1. Introduction
HSLA (High-Strength Low-Alloy) steels are currently one of the preferred types of material among structural steels. Their main advantages include high strength properties, sufficient ductility and very good resistance to brittle failure [
1,
2], even at sub-zero temperatures [
3,
4]. These properties are achieved despite the small number of alloying elements used. In addition, through microalloying and strictly monitored chemical composition of the individual types of steels, very good cold formability and constant technological processability can be achieved.
Thermo-mechanically processed fine-grained steels are generally alloyed with a low content of V, Ti and Nb, creating fine precipitates on the grain boundaries. The resulting carbides, nitrides and carbonitrides of the above elements contribute to matrix strengthening and grain refinement [
5,
6], and together with deformation strengthening, these represent the main mechanisms for HSLA steels, with yield strengths of up to 700 MPa, in achieving the required strength properties. In the case of thermo-mechanically processed steels with a higher yield strength, other strengthening mechanisms (such as, e.g., austenite-to-martensite and bainite phase transformation) are used [
7,
8,
9,
10,
11].
Due to the low carbon content and a very small number of alloying elements, HSLA steels are easily weldable. However, there are some specifics. First of all, the heat input value must be limited. Moreover, attention must also be paid to the susceptibility to cold cracking. In general, when welding structural steels, the heat input value should not exceed 15 kJ·cm
−1. In addition, in the case of welding high-strength fine-grained steels, it is recommended that the heat input value be reduced to 10 kJ·cm
−1, due to both the intensive grain coarsening in the highly heated HAZ and also the softening of the structure that can occur at the interface between HAZ and base material. The effect of grain coarsening on the change of mechanical properties and the decrease of notch toughness values during welding of S700MC steel has already been studied by, e.g., Górka [
12], Moravec et al. [
2], and Skowrońska et al. [
13], and in the case of high-strength steels by, e.g., Mičian [
14], and Njock Bayock et al. [
10]. The issue of susceptibility to cold cracking has been discussed by, e.g., Fydrych et al. [
15]. Many articles have also dealt with simulations of S700MC steel welding, e.g., Kik at al. [
16,
17].
A lot of very interesting works have also been published in the field of cyclic loading (fatigue testing) of fine-grained HSLA steels. The effect of the heat input value on the changes in the fatigue life of welded joints of steels with yield strengths lower than 550 MPa was investigated by, e.g., Šebestová et al. [
18] and Moravec et al. [
19]. The fatigue life of welded joints from steel S700MC and produced using the MAG (Metal Active Gas) method has been studied by Lahtinen et al. [
20], and the case of steels with higher yield strength has been studied by, e.g., Lago et al. [
21] and Kim et al. [
22]. However, all of the above-mentioned authors comprehensively evaluated the effect of welding on fatigue life, by determining the S-N curves (stress–life) of the tested welded joints under the conditions defined by the authors. Thus, from the above works, it is not possible to determine the influence of partial aspects of the welding process. It is, therefore, problematic to assess the effect of, for example, a rigid clamping that reduces the angular deformation of given weldment or intensity of changes that occur in the HAZ. Although there are studies that try to cover just these partial influences, these studies also have their limitations. For example, Schmidova et al. [
23] assessed the dynamic fracture toughness of dynamically loaded samples from S700MC steel with the application a temperature cycle. However, it was a cycle with a maximum temperature of 800 °C, and with a significantly slower heating and cooling rate than during a real welding process.
The major aim of the research described in the following sections was to define the influence of individual aspects of the welding process on changes in the fatigue life of welded joints, and thus to show which aspects occurring during welding have a fundamental effect on the durability and which ones are only marginal. Attention was focused on quantification of the influence of angular deformation, changes occurring in the HAZ, and the notch effect caused by the weld geometry. Such information should enable designers and technologists to make more relevant decisions with respect to both welded joint design and the subsequent design of WPS (welding procedure specification).
2. Materials and Methods
Structural steel S700MC (1.8974) is classified as a fine-grained micro-alloyed high-strength steel produced by thermo-mechanical rolling. It is material with a guaranteed minimum yield strength of 700 MPa, good cold formability, low carbon content, and reduced sulphur content. It is micro-alloyed with elements such as Al, Ti, Nb and V. Additionally, it is necessary to ensure that the sum of Nb, V and Ti does not exceed 0.22 wt%. The reason for its good applicability lies in the fact that it can maintain constant technological conditions at cold forming, has good weldability, and there is the possibility to reduce the weight of given parts while retaining the required strength properties. It is used in the field of transportation (e.g., chassis frames of cars and trucks or components of wagons), in the production of mining machines, cranes, partial structural units of bridges, etc. The chemical composition of the tested material (HSLA steel S700MC) is shown in
Table 1.
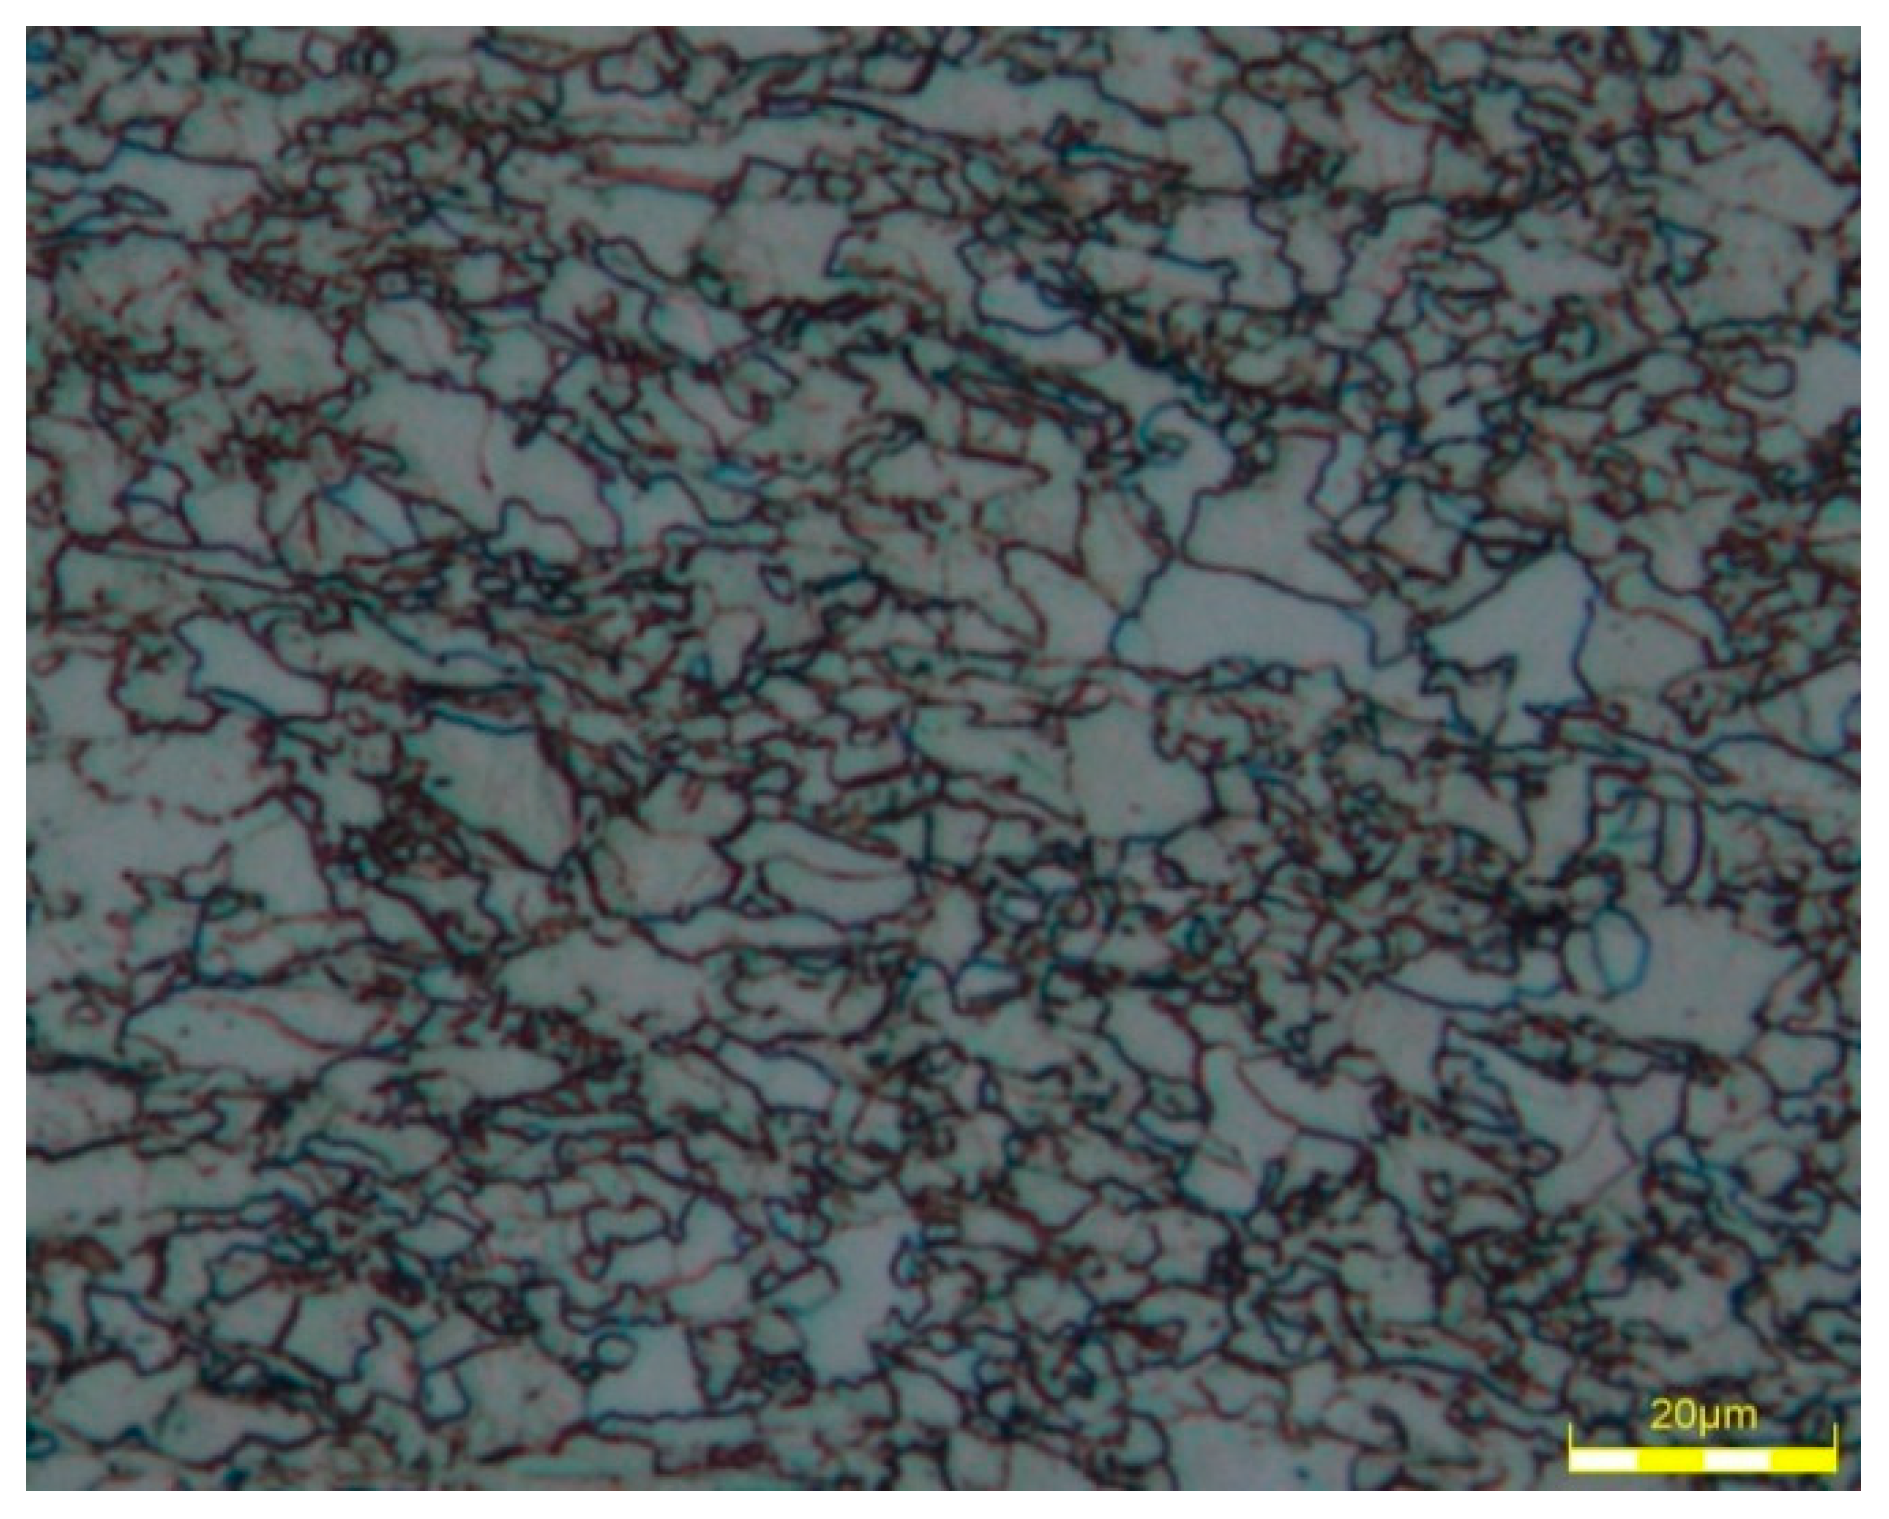
The steel used for the experimental fatigue testing was delivered in the form of 12-mm-thick sheet metal and had a ferritic-bainitic structure (see
Figure 1). Chemical composition defined by the standard EN 10149-2, as well as chemical composition, which was determined experimentally using a Q4 Tasman spectrometer (Bruker, Germany), as given in
Table 1.
A mean grain size of 3.38 µm was determined by EBSD (Electron Back Scatter Diffraction) analysis. This is the average value obtained from three measurements of areas 0.6 mm × 0.6 mm.
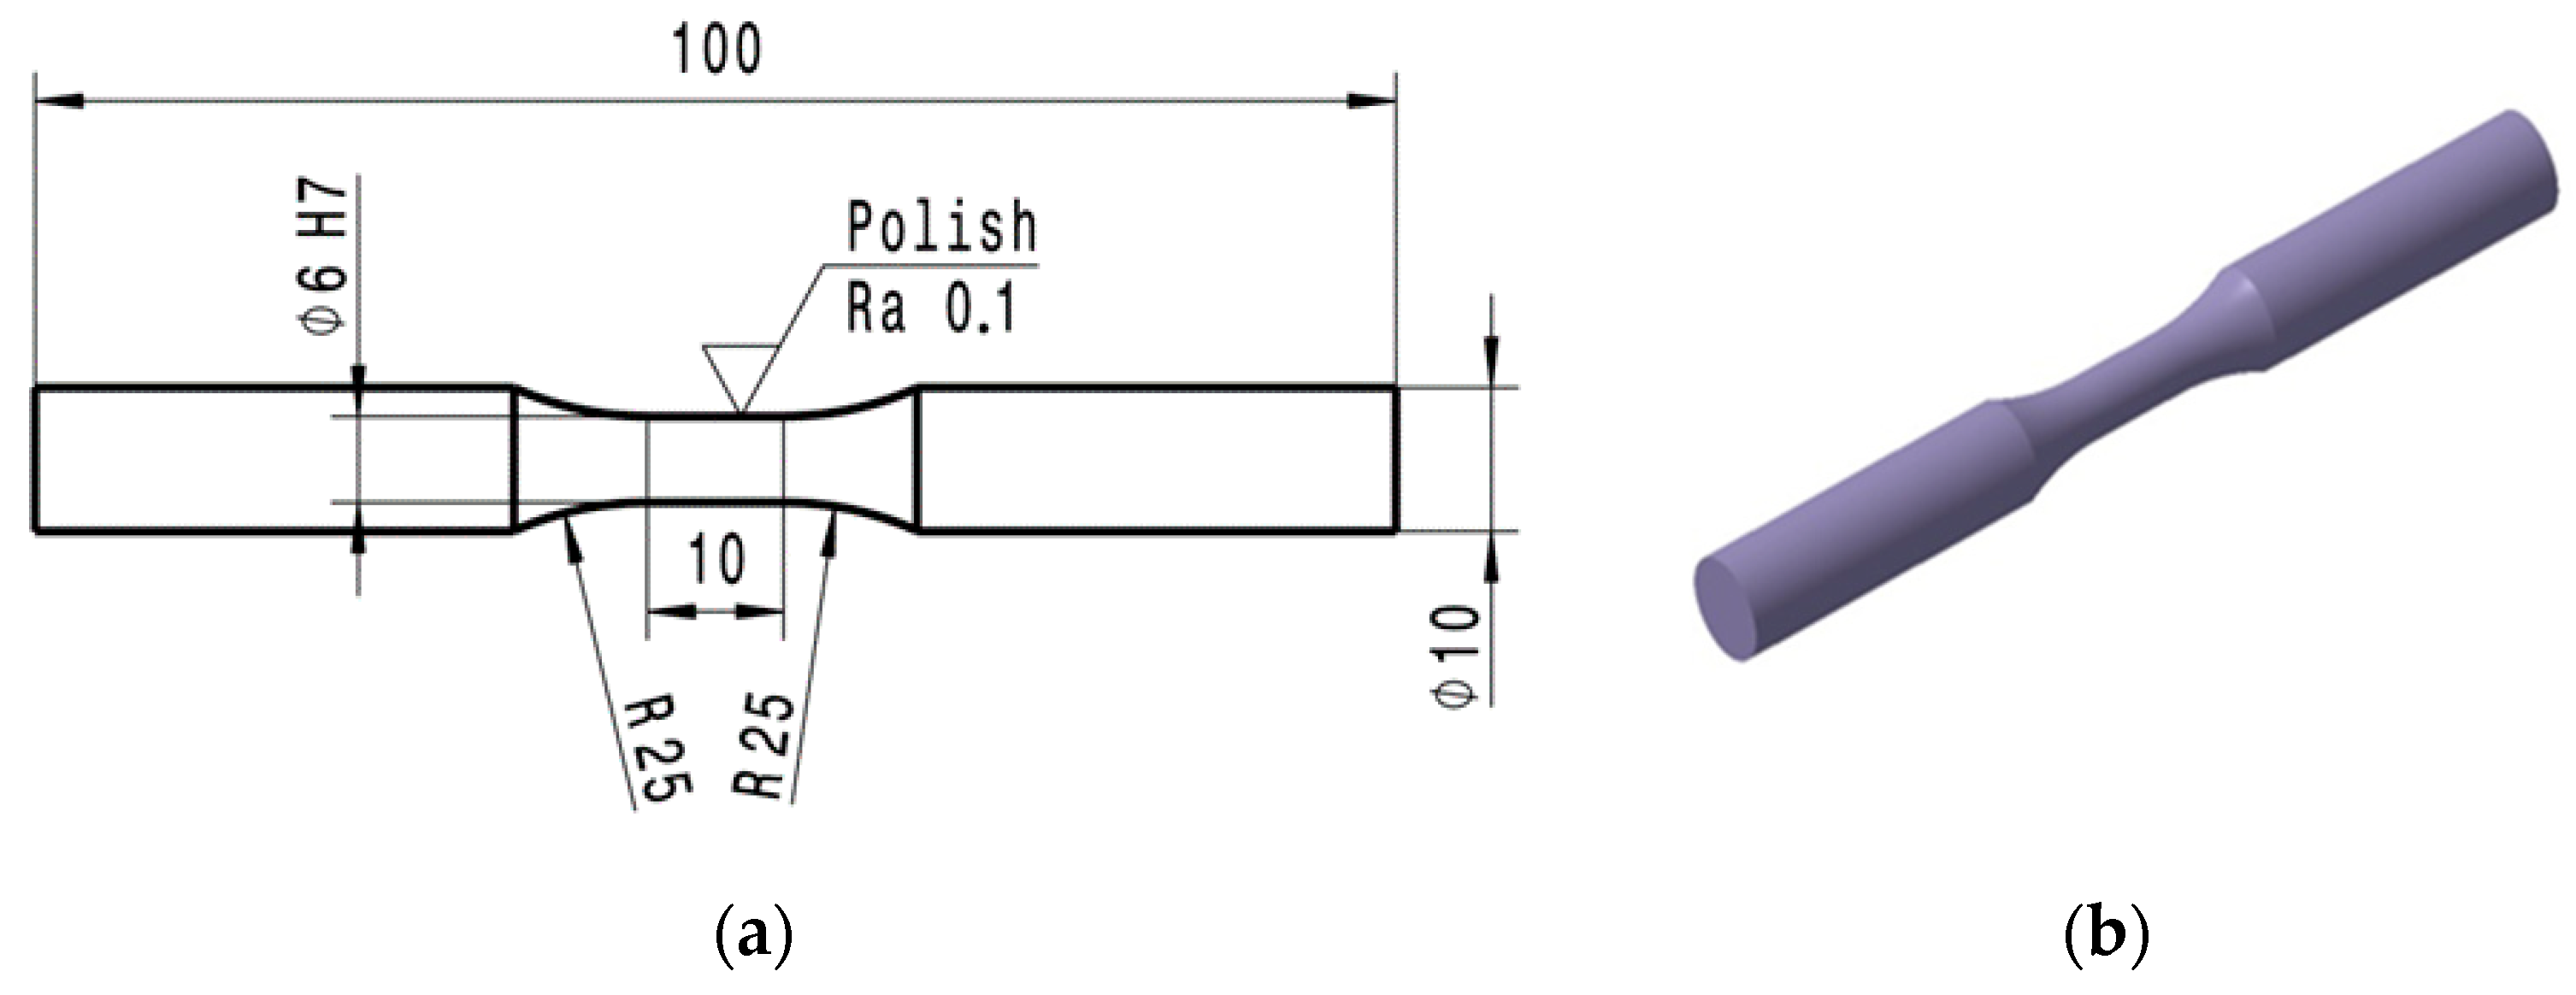
Table 2 shows the basic mechanical properties as determined by the static tensile test. In addition to that, to assess the mechanical properties under dynamic loading, the S-N curve of the base material was also measured. The whole experimental fatigue testing of the base material was performed on the servo-hydraulic device INOVA FU-O-1600-V2 (INOVA GmbH, Bad Schwalbach, Germany), in controlled force mode. For all experiments, only samples with a circular cross-section area were used, in accordance with standard EN 3987—
Figure 2.
With respect to the major aim of this paper, experimental measurements were very closely connected with the adjustment of the fatigue testing. For all measurements (1—base material, 2—basic welded samples, 3—welded samples without influence of angular deformation, 4—welded samples without influence of angular deformation and notch effect), test samples were subjected to the given stress amplitudes (levels) under fully reversed harmonic cycle (purely alternating stress) with the stress ratio R = −1 (algebraic ratio of the minimum stress to the maximum stress). The loading frequency varied depending on the cross-section area of the test samples. In the case of fatigue testing of the base material (S700MC), f = 40 Hz was used. For the rest of the test samples, loading frequency of 20 Hz was used, because of the bigger cross-section area. In addition to this, the loading frequency was also chosen with respect to the possible heating of the sample surface. This is why the infrared pyrometer Mikro-epsilon CTLM-3H2CF2-C8H (Micro-Epsilon Messtechnik, Germany) was used, with a temperature range from −60 °C to 200 °C. On the basis of this approach, it was determined that for the given shape and dimensions of the test sample (see
Figure 2b), the heating of its surface occurred under a loading frequency 60 Hz and a stress amplitude of 610 MPa.
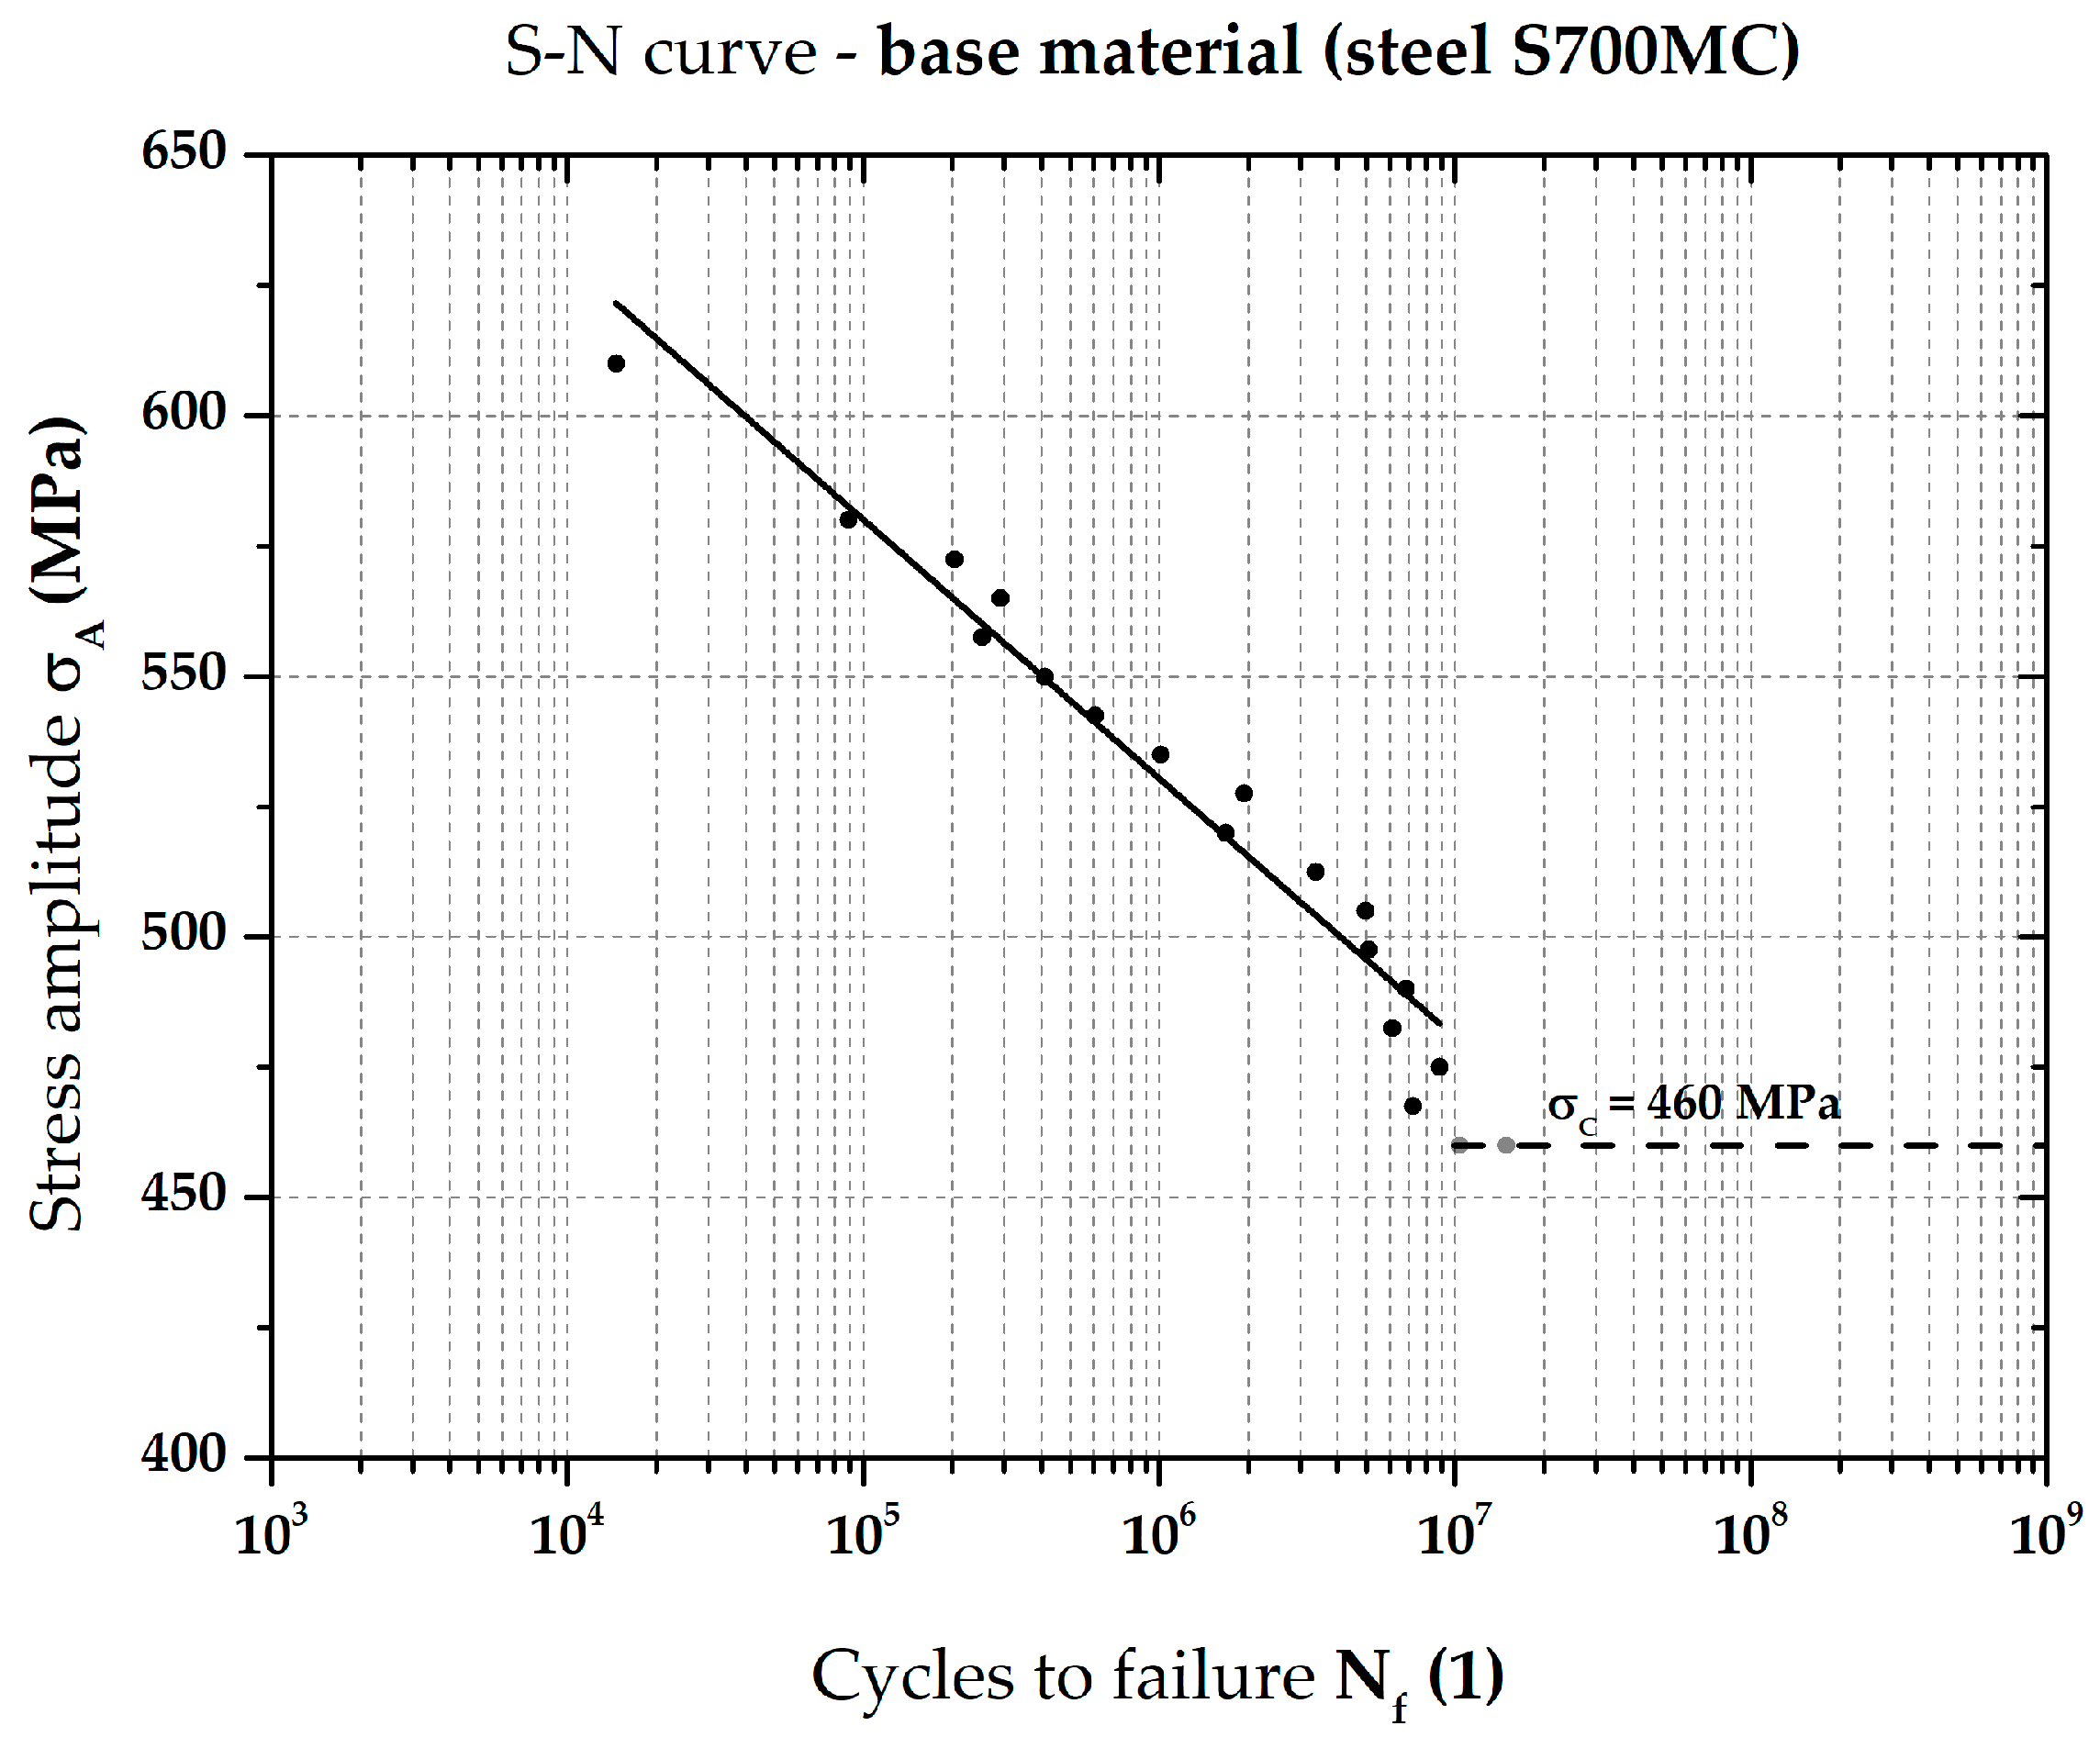
Fatigue testing of the base material was first performed at stress amplitudes (levels) as follows: 610, 580, 565, 550, 535, 520, 505, 490, 475 and 460 MPa. Subsequently, this measurement was enlarged using the “interval halving method” at stress levels of 572.5, 557.5, 542.5, 527.5, 512.5, 497.5, 482.5 and 467.5 MPa. The value of the given stress amplitude was kept constant for each stress level. As criteria for terminating of the test, we took either failure of the tested sample, or the limit of 10
7 cycles being exceeded. In total, 19 samples were tested, one for each stress amplitude, and one more on the stress amplitude 460 MPa to confirm the fatigue limit σ
C of the base material. The measured data and the final S-N curve of the base material are shown in
Table 3 and
Figure 3. Two basic approaches can be used to create S-N curves. The first approach requires more samples to be tested at lower stress amplitudes (levels). This approach makes it possible to determine a confidence interval for the resulting S-N curve, and was chosen, e.g., by Wu et al. [
24] in their work. The second approach rests on using just one sample at higher levels of stress. The advantage of this approach is that there is more complex coverage in the area of limited life, thus resulting in its more precise definition. This second approach was chosen in this article.
3. Welding of Testing Samples
Double-sided fillet welds were designed for fatigue testing. These were assembled from the semi-finished products with dimensions of 300 mm × 180 mm × 12 mm for the flange and 300 mm × 110 mm × 12 mm for the web. To ensure uniform contact between the web and the flange, it was necessary to machine (more precisely to mill) the web in the contact areas with the flange. Web and flange were connected to each other by two tack welds placed on the face of the weldment so that there was no influence of the fillet weld. Subsequently, the semi-automatic MAG welding method was used in the PA—flat position. The sample was not clamped in any way, so it was able to dilatate freely. As a filler material, Boehler UNION NiMoCr (BÖHLER Welding Group GmbH, Düsseldorf, Germany) was used, with a diameter of 1.2 mm and shielding gas M21 (ISO 14175). The chemical composition of the filler material (wire) is given in
Table 4. Weld metal has the following material characteristics at welding with shielding gas M21: proof yield strength R
p0.2 p0.2 = 700 MPa, ultimate tensile strength Rm = 780 MPa, and impact energy KV = 100 J at RT (Room Temperature) and 47 J at −60 °C. The flow rate of the shielding gas was 15 L·min
−1, and the angle between torch and flange was 30°. The welding parameters were set based on previous experiments so that the heat input value reached 10.5 kJ·cm
−1. Welding was carried out in the synergic mode with the current value set as I = 335 A and a welding speed of 0.6 m·min
−1. For welding, a Migatronic BDH 550 Puls Syn (Migatronic Welding Equipment LTD, Loughborough, England) ower supply was used, and the distance between the contact die and the welding area was 15 mm. In total, three welds were prepared, all under identical conditions. Welding parameters were monitored by the WeldMonitor system (DIGITAL ELECTRIC, Brno, Czech Republic) at a scanning frequency of 20 kHz.
Table 5 shows the effective measured values of voltage, current and welding speed for all weld beads. The heat input value Q (
Table 5) was defined by the standard EN 1011-1. It was calculated as the product of the effective voltage and current divided by the welding speed.
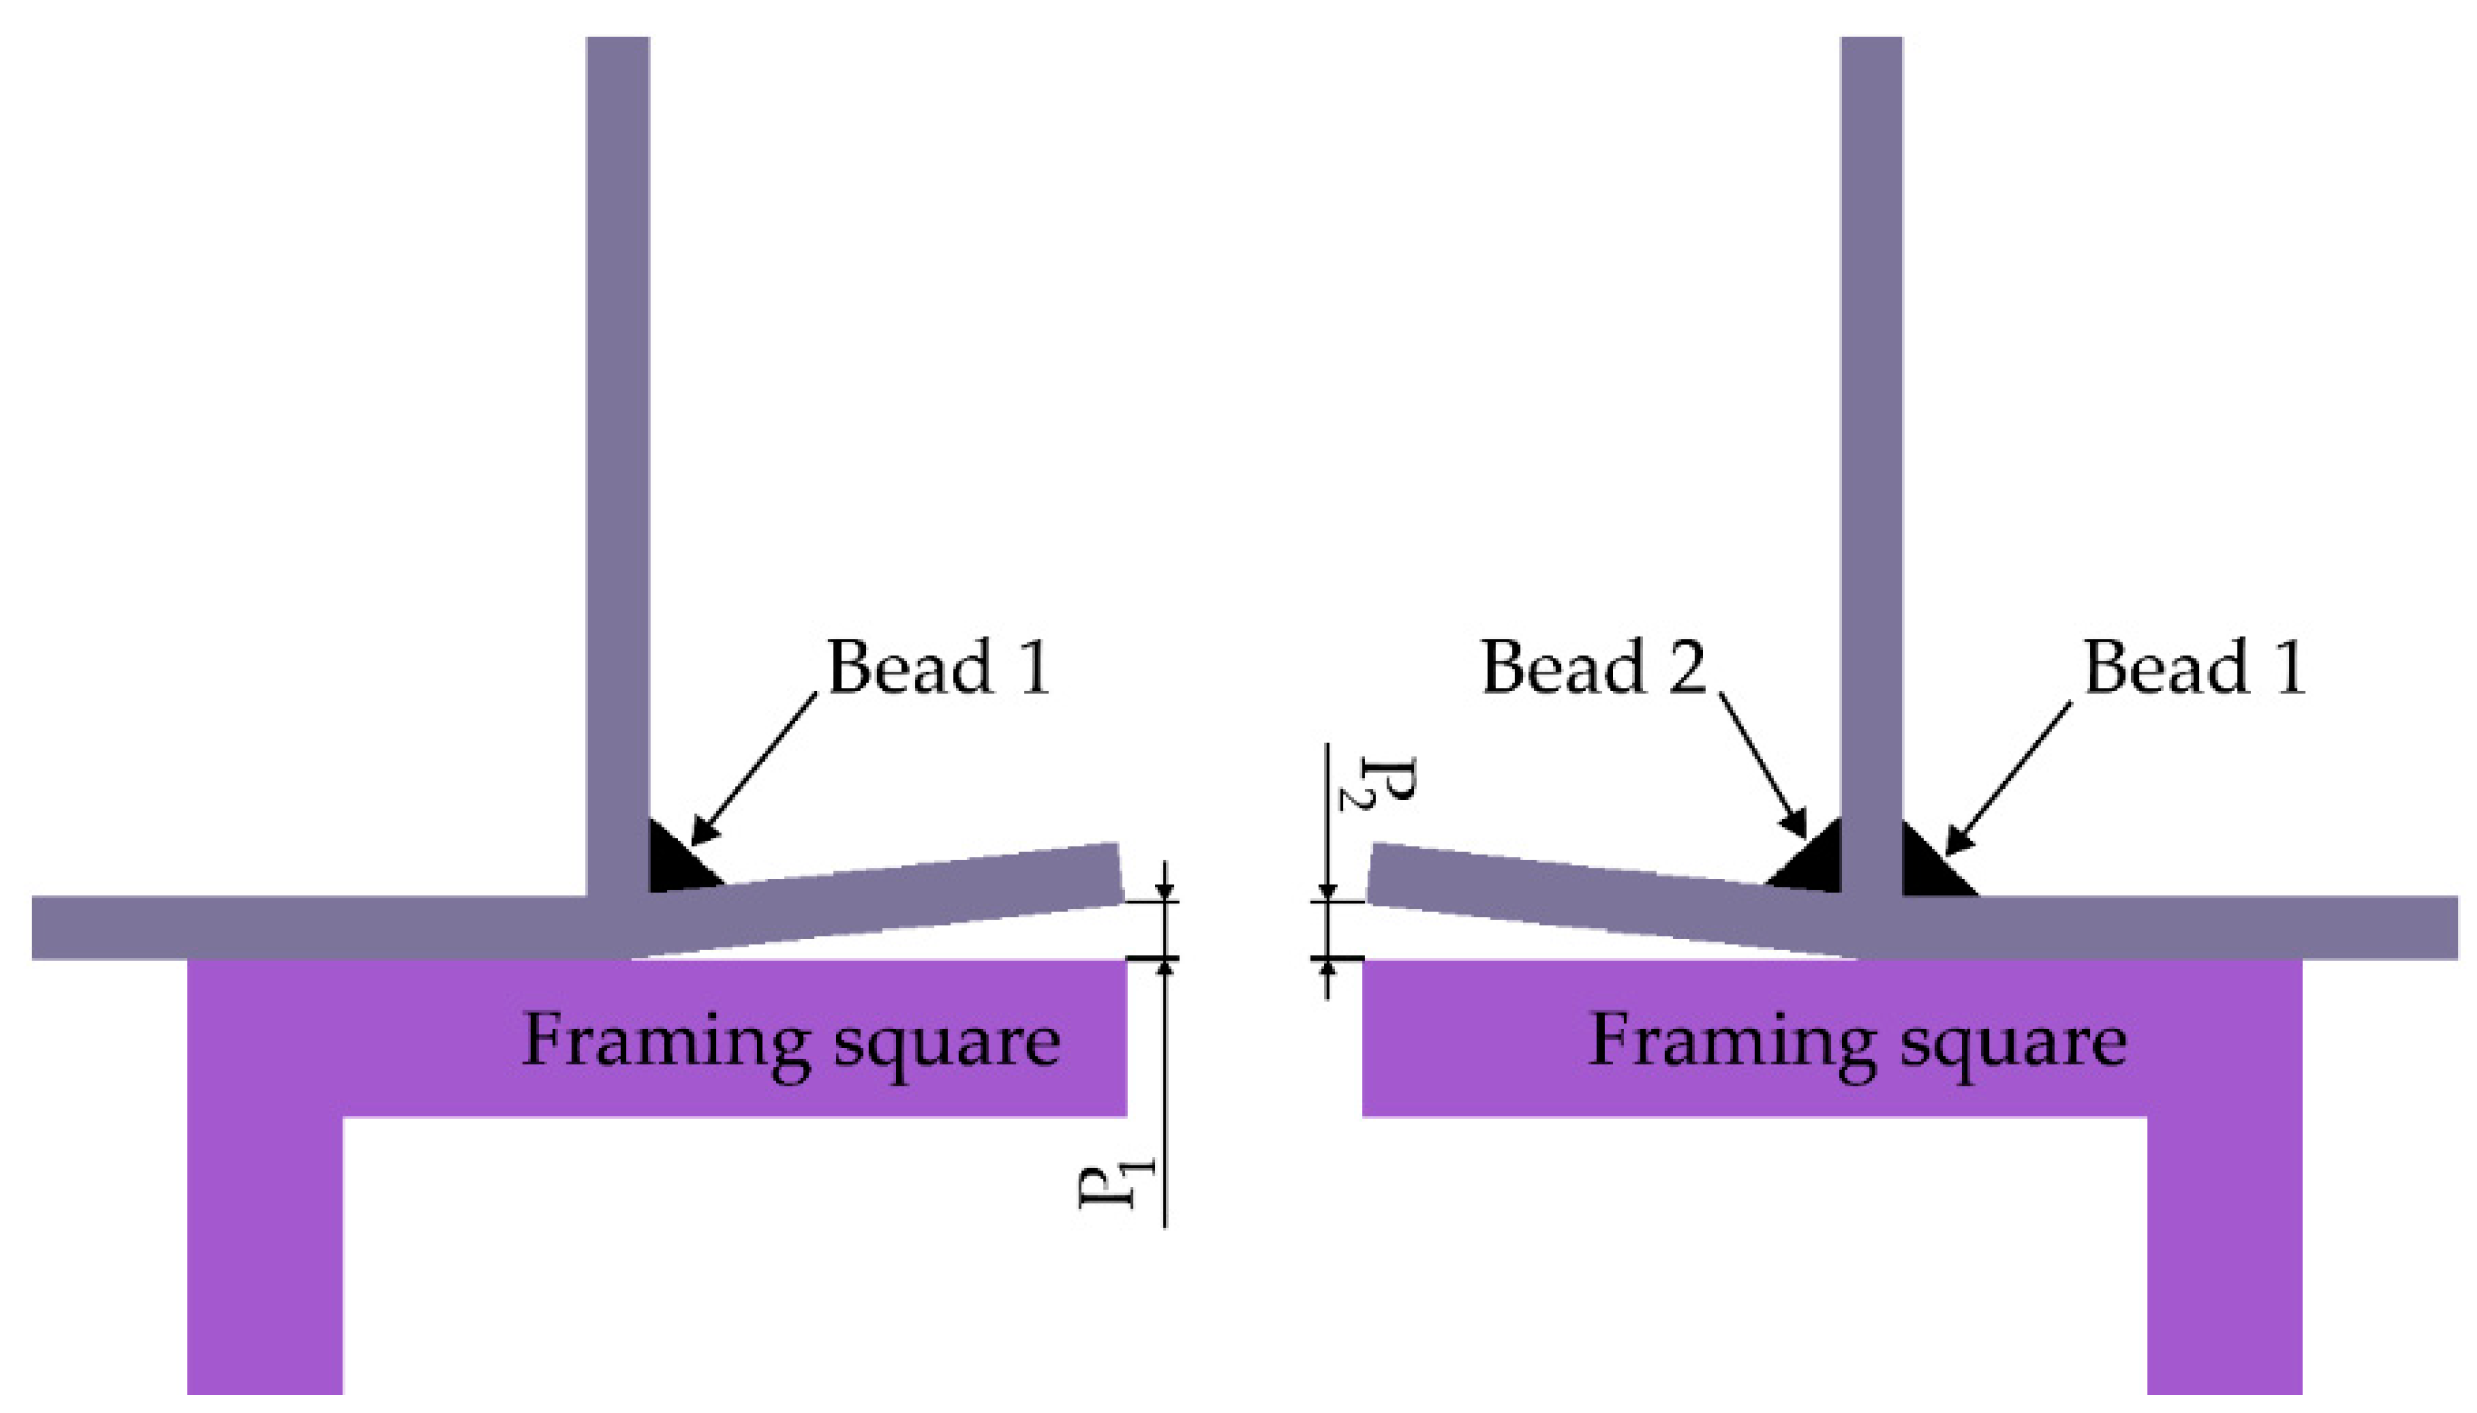
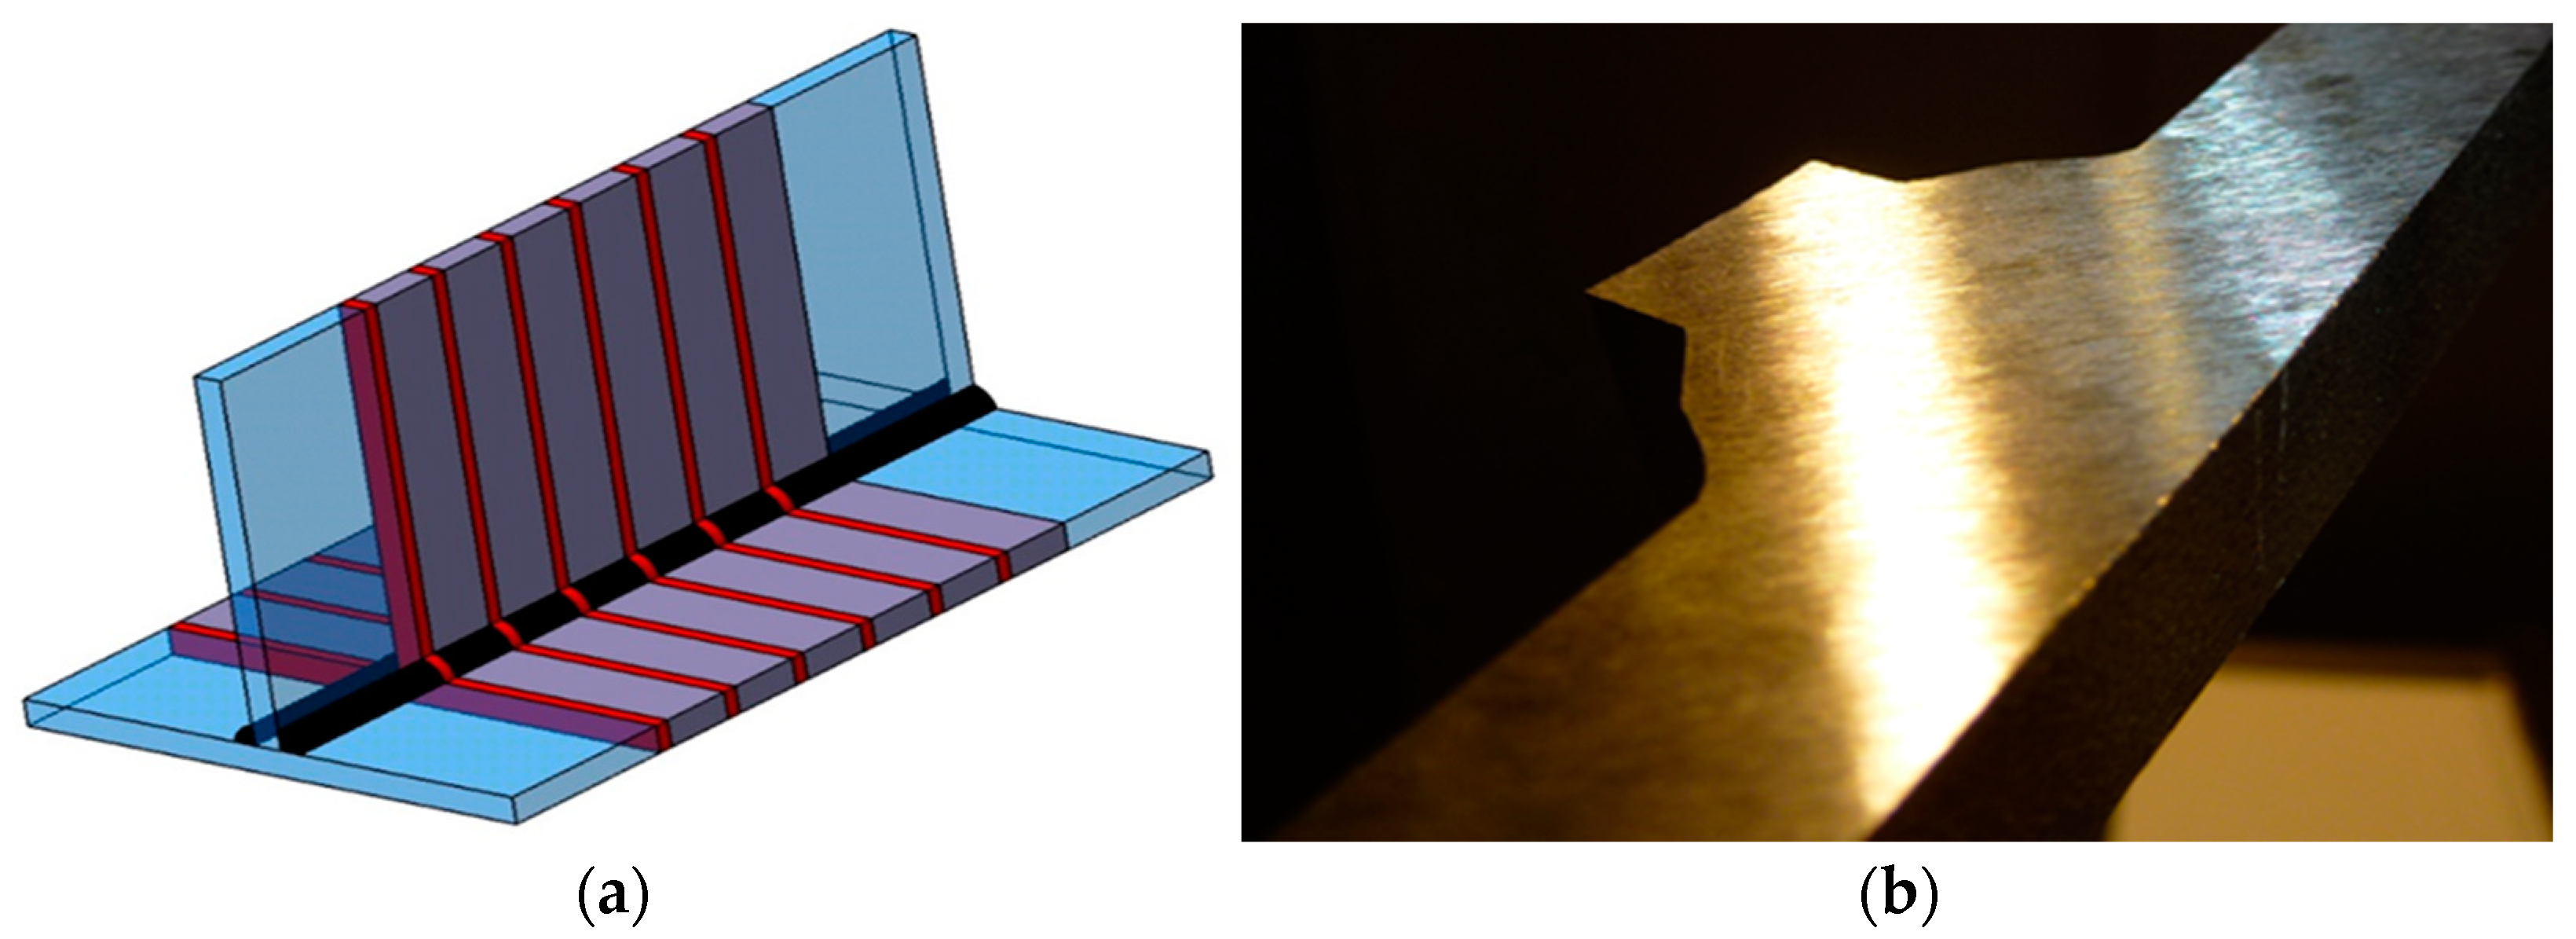
Generally, due to the dilation of welds, there is a deformation of the web and the flange. However, in this case, welds were only stressed in the flange direction, and thus the subsequent measurement of angular deformation after passing the 1st and 2nd bead was performed in the way shown in
Figure 4. From the beginning of the weld, 13 points were taken in this direction at which the angular deformation was measured; thus, the distance between the individual measuring points was 25 mm (see 1st column in
Table 6).
In
Table 6, the measured values of angular deformation after welding the first and second weld bead are shown for all three welds. The difference between the average values of angular deformation in all three welds was lower than 3%—after both the first and second bead. The standard deviation of deformation of the sample did not exceed 4%.
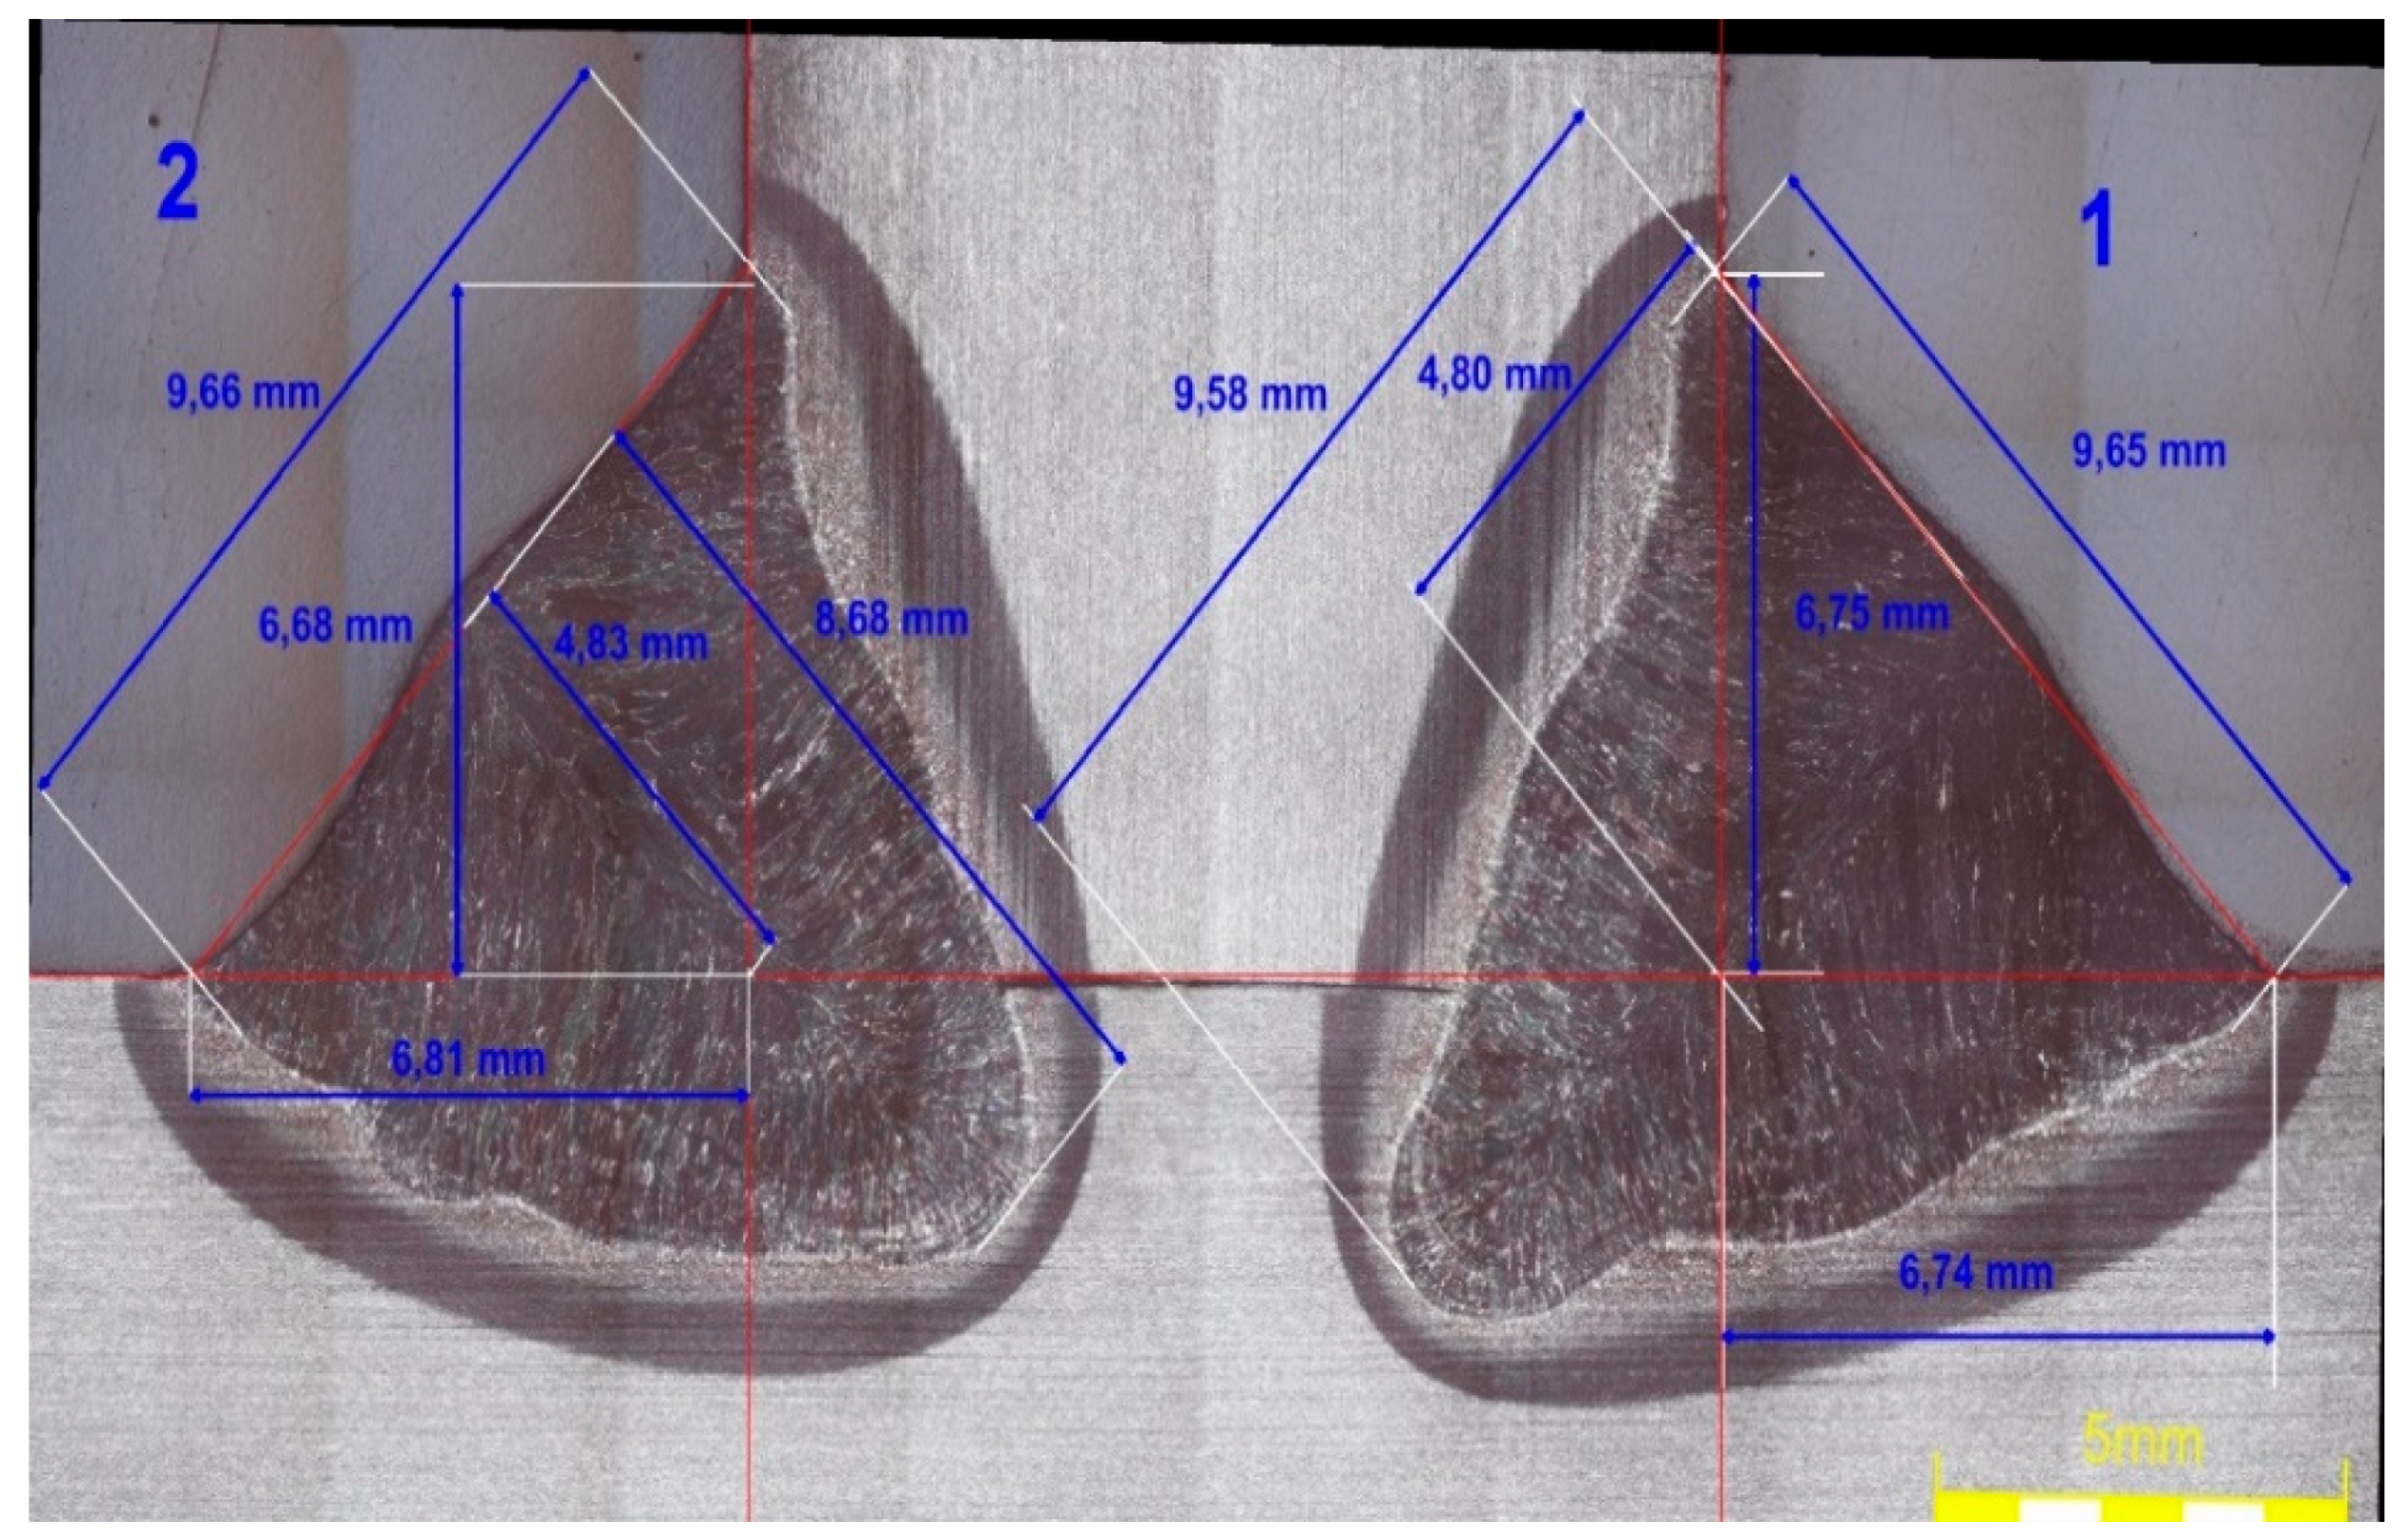
For every welded sample, the beginning and end length of the weld was cut off at a distance of 35 mm, that is, in the area where the temperature field is already stable. Right in this area, a metallographic scratch pattern of the weld and a geometrical evaluation of both beads were performed. The differences in the geometrical evaluation among the individual welds were very small, and differences between the individual measured quantities didn’t exceed 4%. However, only in the case of Weld 2, the difference in the penetration depth was equal to 9%. Therefore, the geometrical evaluation only for Weld 2 is shown in
Figure 5.
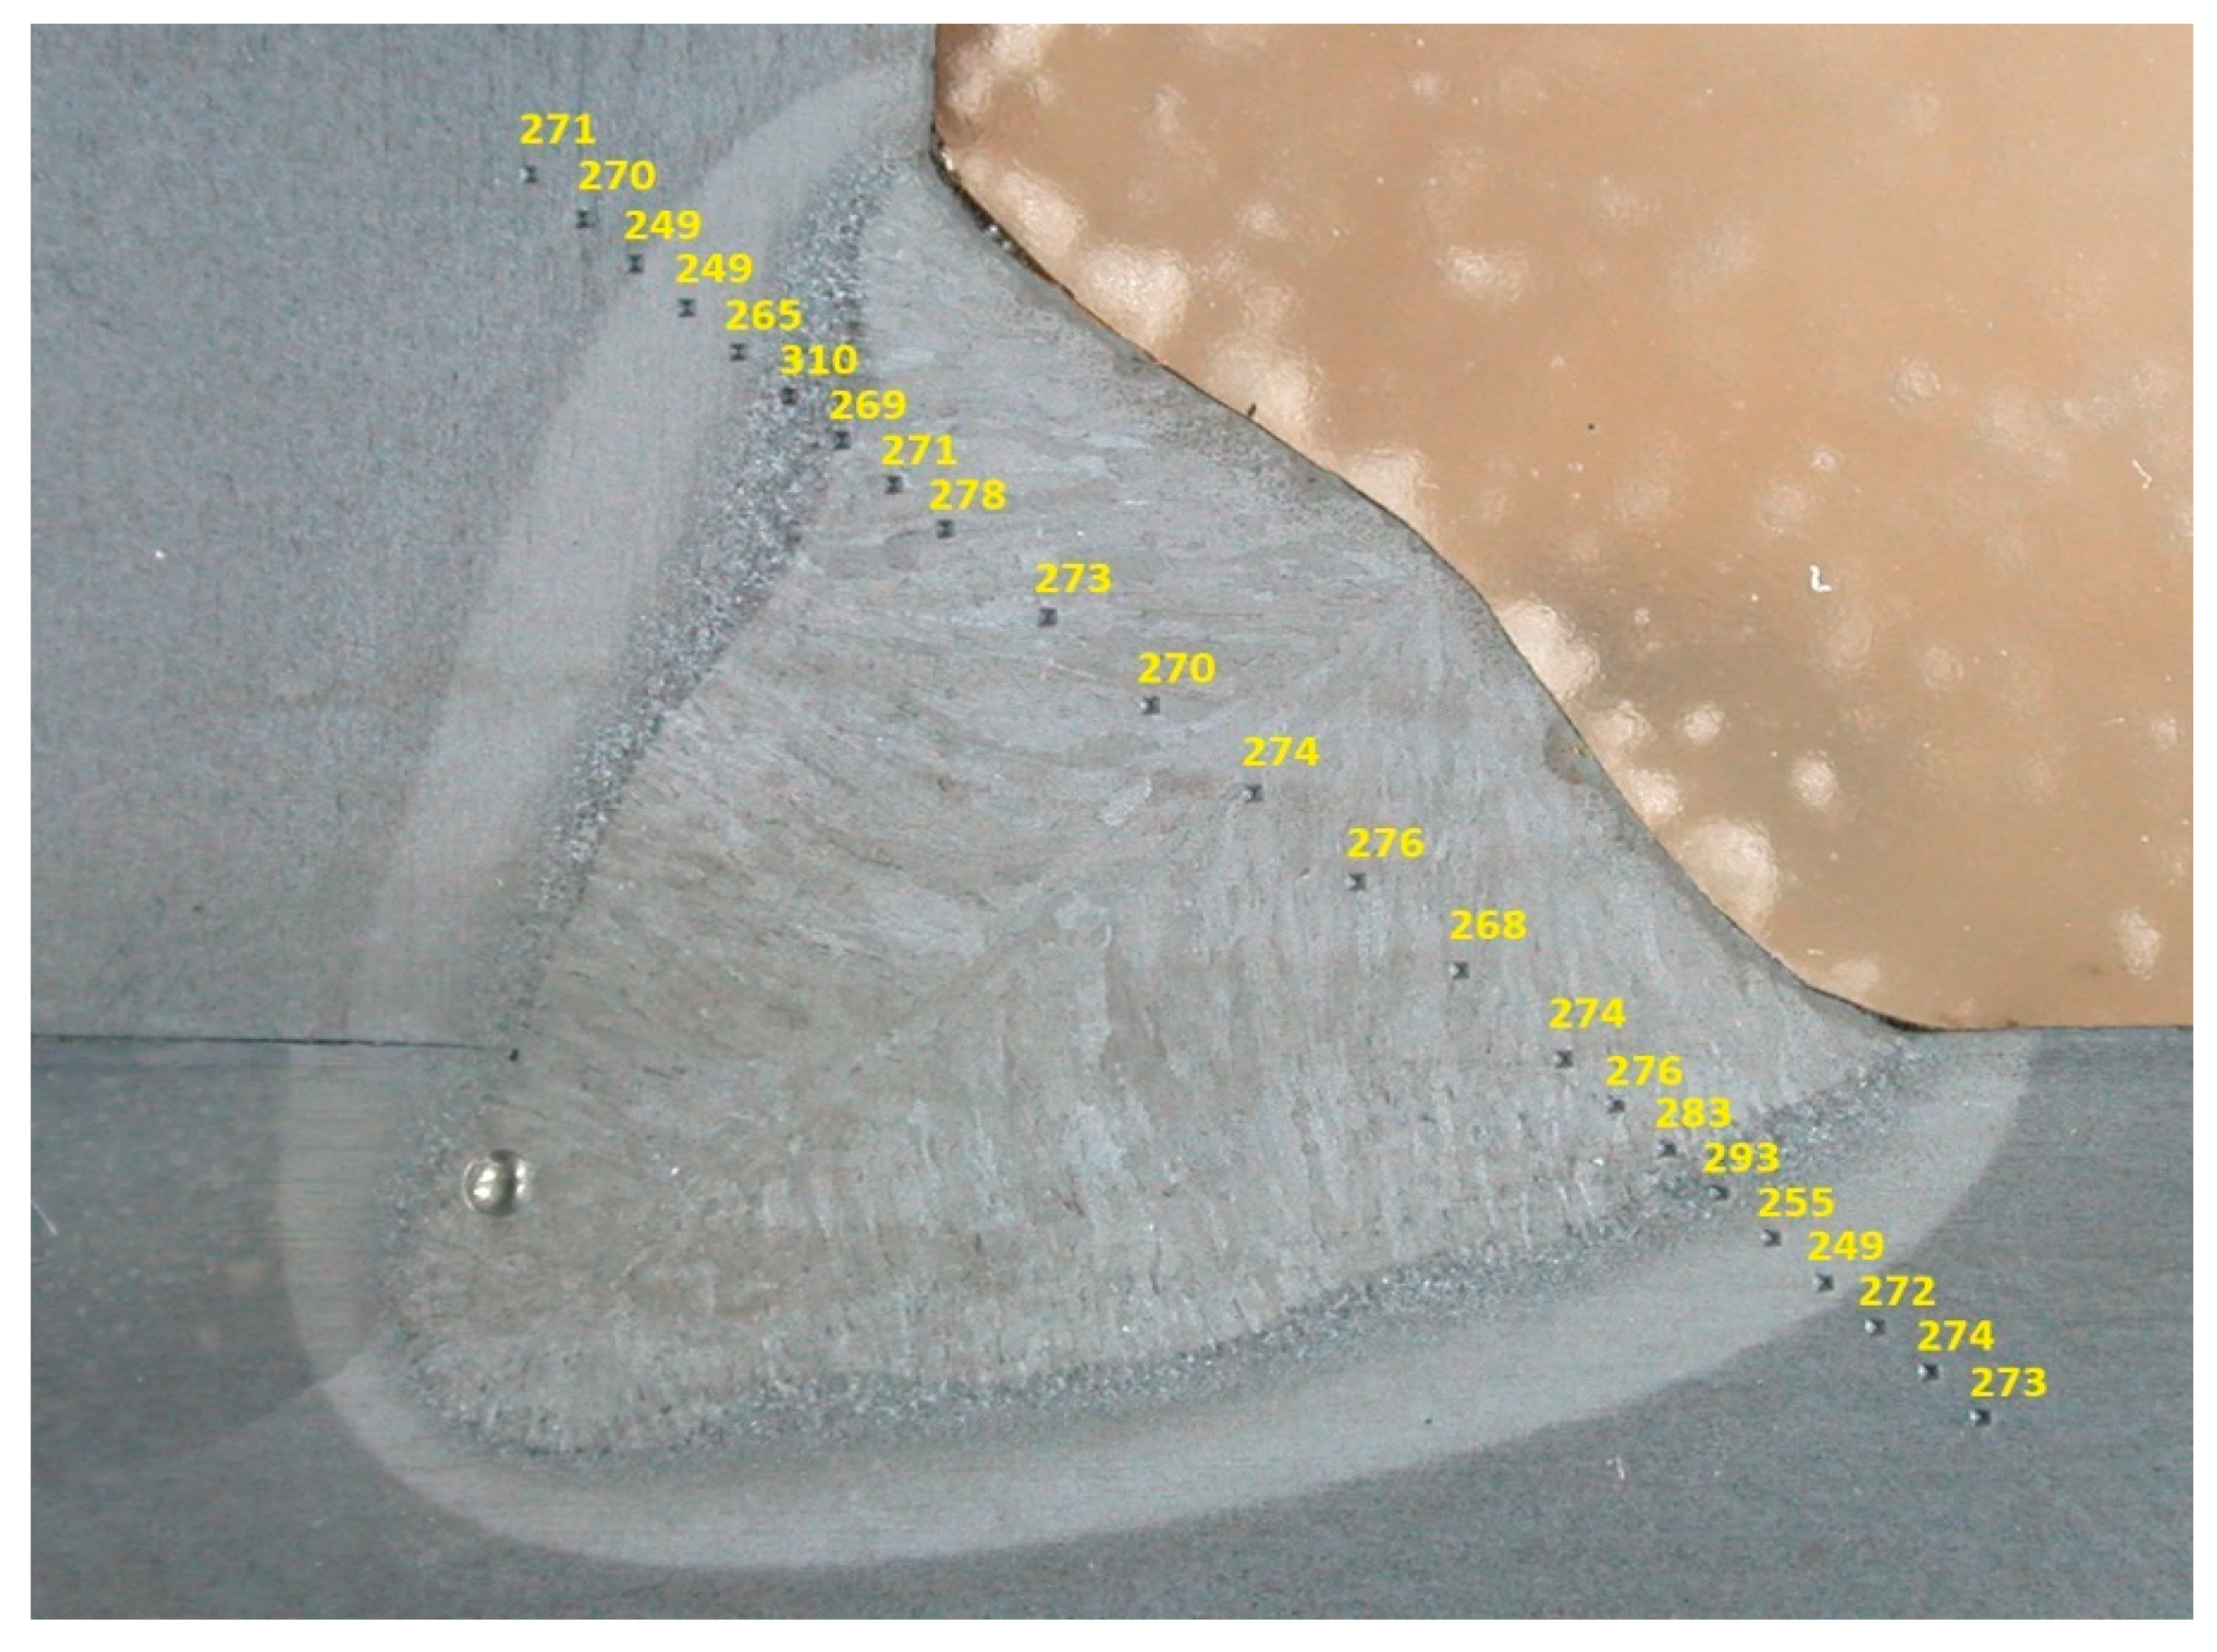
To assess the effect of the welding process on changes in HAZ, Vickers hardness measurements and measurements of grain coarsening were performed in a highly heated HAZ. The hardness measurement HV 5 (in accordance with the standard EN ISO 6507-1) was performed from the base material across the HAZ, to the weld metal, again across HAZ and back to the base material. The distance between the individual indentations was 1.0 mm in the weld metal and 0.5 mm in the base material and the HAZ. As can be seen from
Figure 6, below (Weld 1 and Bead 1), the highest hardness values were measured to be about 0.5 mm from the fusion line. However, due to the very low carbon content, the hardness in the HAZ increased by less than 40 HV 5 compared to the base material.
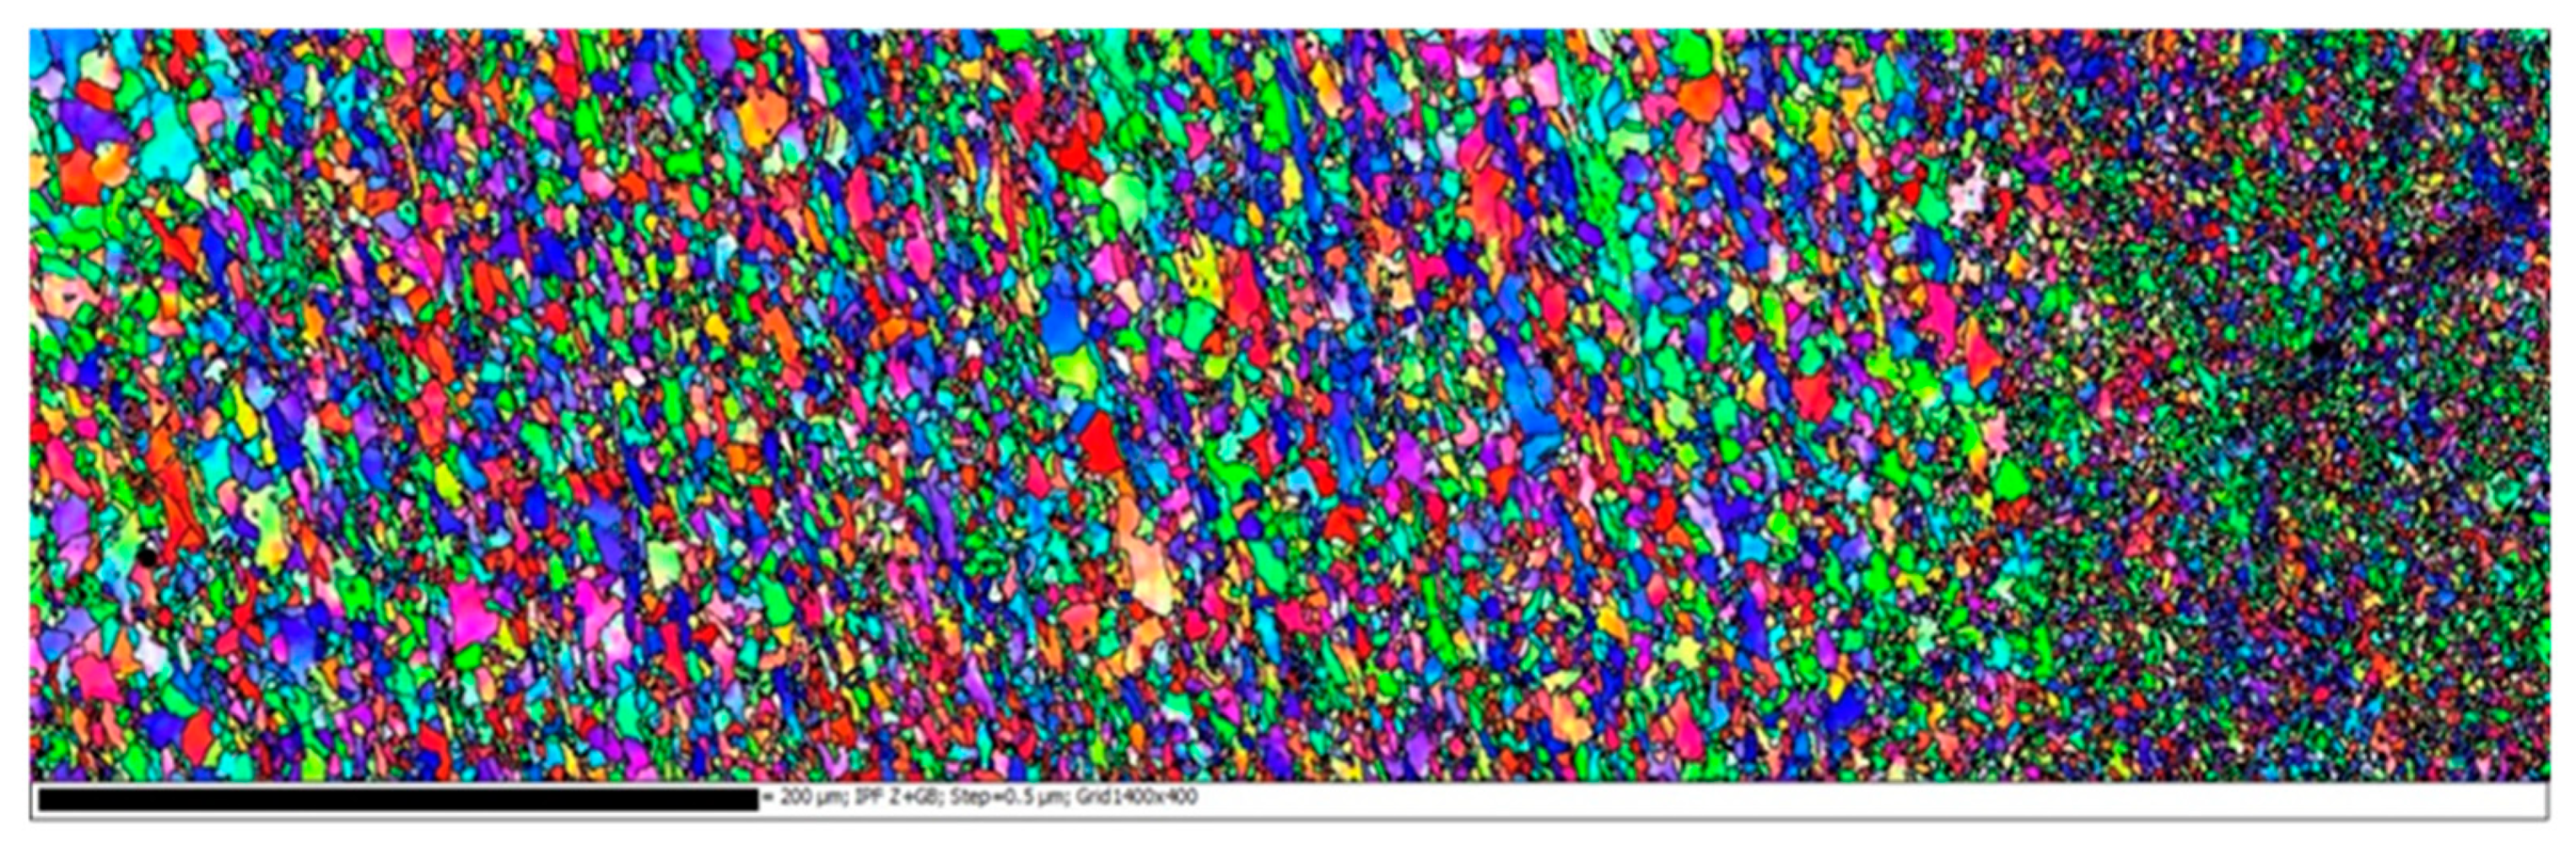
Grain coarsening analysis in the HAZ was performed using a Tescan MIRA electron microscope (Tescan Orsay holding a.s., Brno, Czech Republic) using EBSD analysis at the location of Bead 1 on Weld 1. At first, an area with a width of 0.4 mm and a length of 2.5 mm at the transition from weld metal to HAZ was scanned. The details of this transition from the highly heated area to the normalization area in the HAZ are shown in
Figure 7. Furthermore, the grain size in the highly heated area of the HAZ was measured by EBSD analysis from the fusion line to a distance of 0.3 mm. This measurement was performed along the fusion line in three areas with a size of 0.3 mm × 0.4 mm and the three average values of grain size (d
1 = 13.06 µm, d
2 = 12.87 µm and d
3 = 13.14 µm) were obtained. Therefore, the average grain size in a highly heated HAZ was d
HAZ = 13.02 ± 0.14 µm.
6. Discussion
Fatigue life in the area of limited life (termed as the fatigue strength σN) and also the fatigue (endurance) limit σC are absolutely essential material characteristics for all dynamically stressed parts. Such information is especially necessary in the automotive industry and, e.g., in the still increasing application of HSLA steels. Obtaining the S-N curves of the base materials is quite easy. However, it is already much more difficult with welded joints. The welding process results in there being a lot of aspects influencing fatigue life. Moreover, they have different effects. Therefore, it is very difficult to assess which aspects are more important from a design and technological point of view.
Several authors [
18,
19,
20,
21,
22] have studied the problem of fatigue behaviour of HSLA steel welded joints. Works published in this area differ from each other mainly with respect to the type of steel used, the type of stressed joint, the loading method and in light of the welding technology used. However, all papers evaluate the final weld as a whole, without the possibility of quantifying the individual aspects of own welding process. Nevertheless, it is very difficult to optimize the whole welding process without these partial data. Thus, the major contribution of this paper rests in description of these partial aspects of the whole process and to try, for one of the most used HSLA steels (to be more specific S700MC), to determine the importance of such influences.
Thus, in this paper, the influence of angular deformation and the notch effect of the weld, as well as influence of changes that occur in HAZ of welds was evaluated. As described in Chapter 5, the influence of individual aspects could be gradually eliminated through the geometrical modification of welded samples. From the comparison the individual S-N curves (
Figure 10,
Figure 12 and
Figure 14) could be used to determine the importance (or more precisely degree of influence) of the partial aspects influencing the welding process. The complete comparison, including all testing conditions (base material, basic samples, samples without influence of angular deformation, and samples without influence both of angular deformation and notch effect), is shown in
Figure 15. As already mentioned in
Section 2, the S-N curves were plotted by using individual measurements at greater stress levels. The reason was the necessity of comparing individual influences of the welding process.
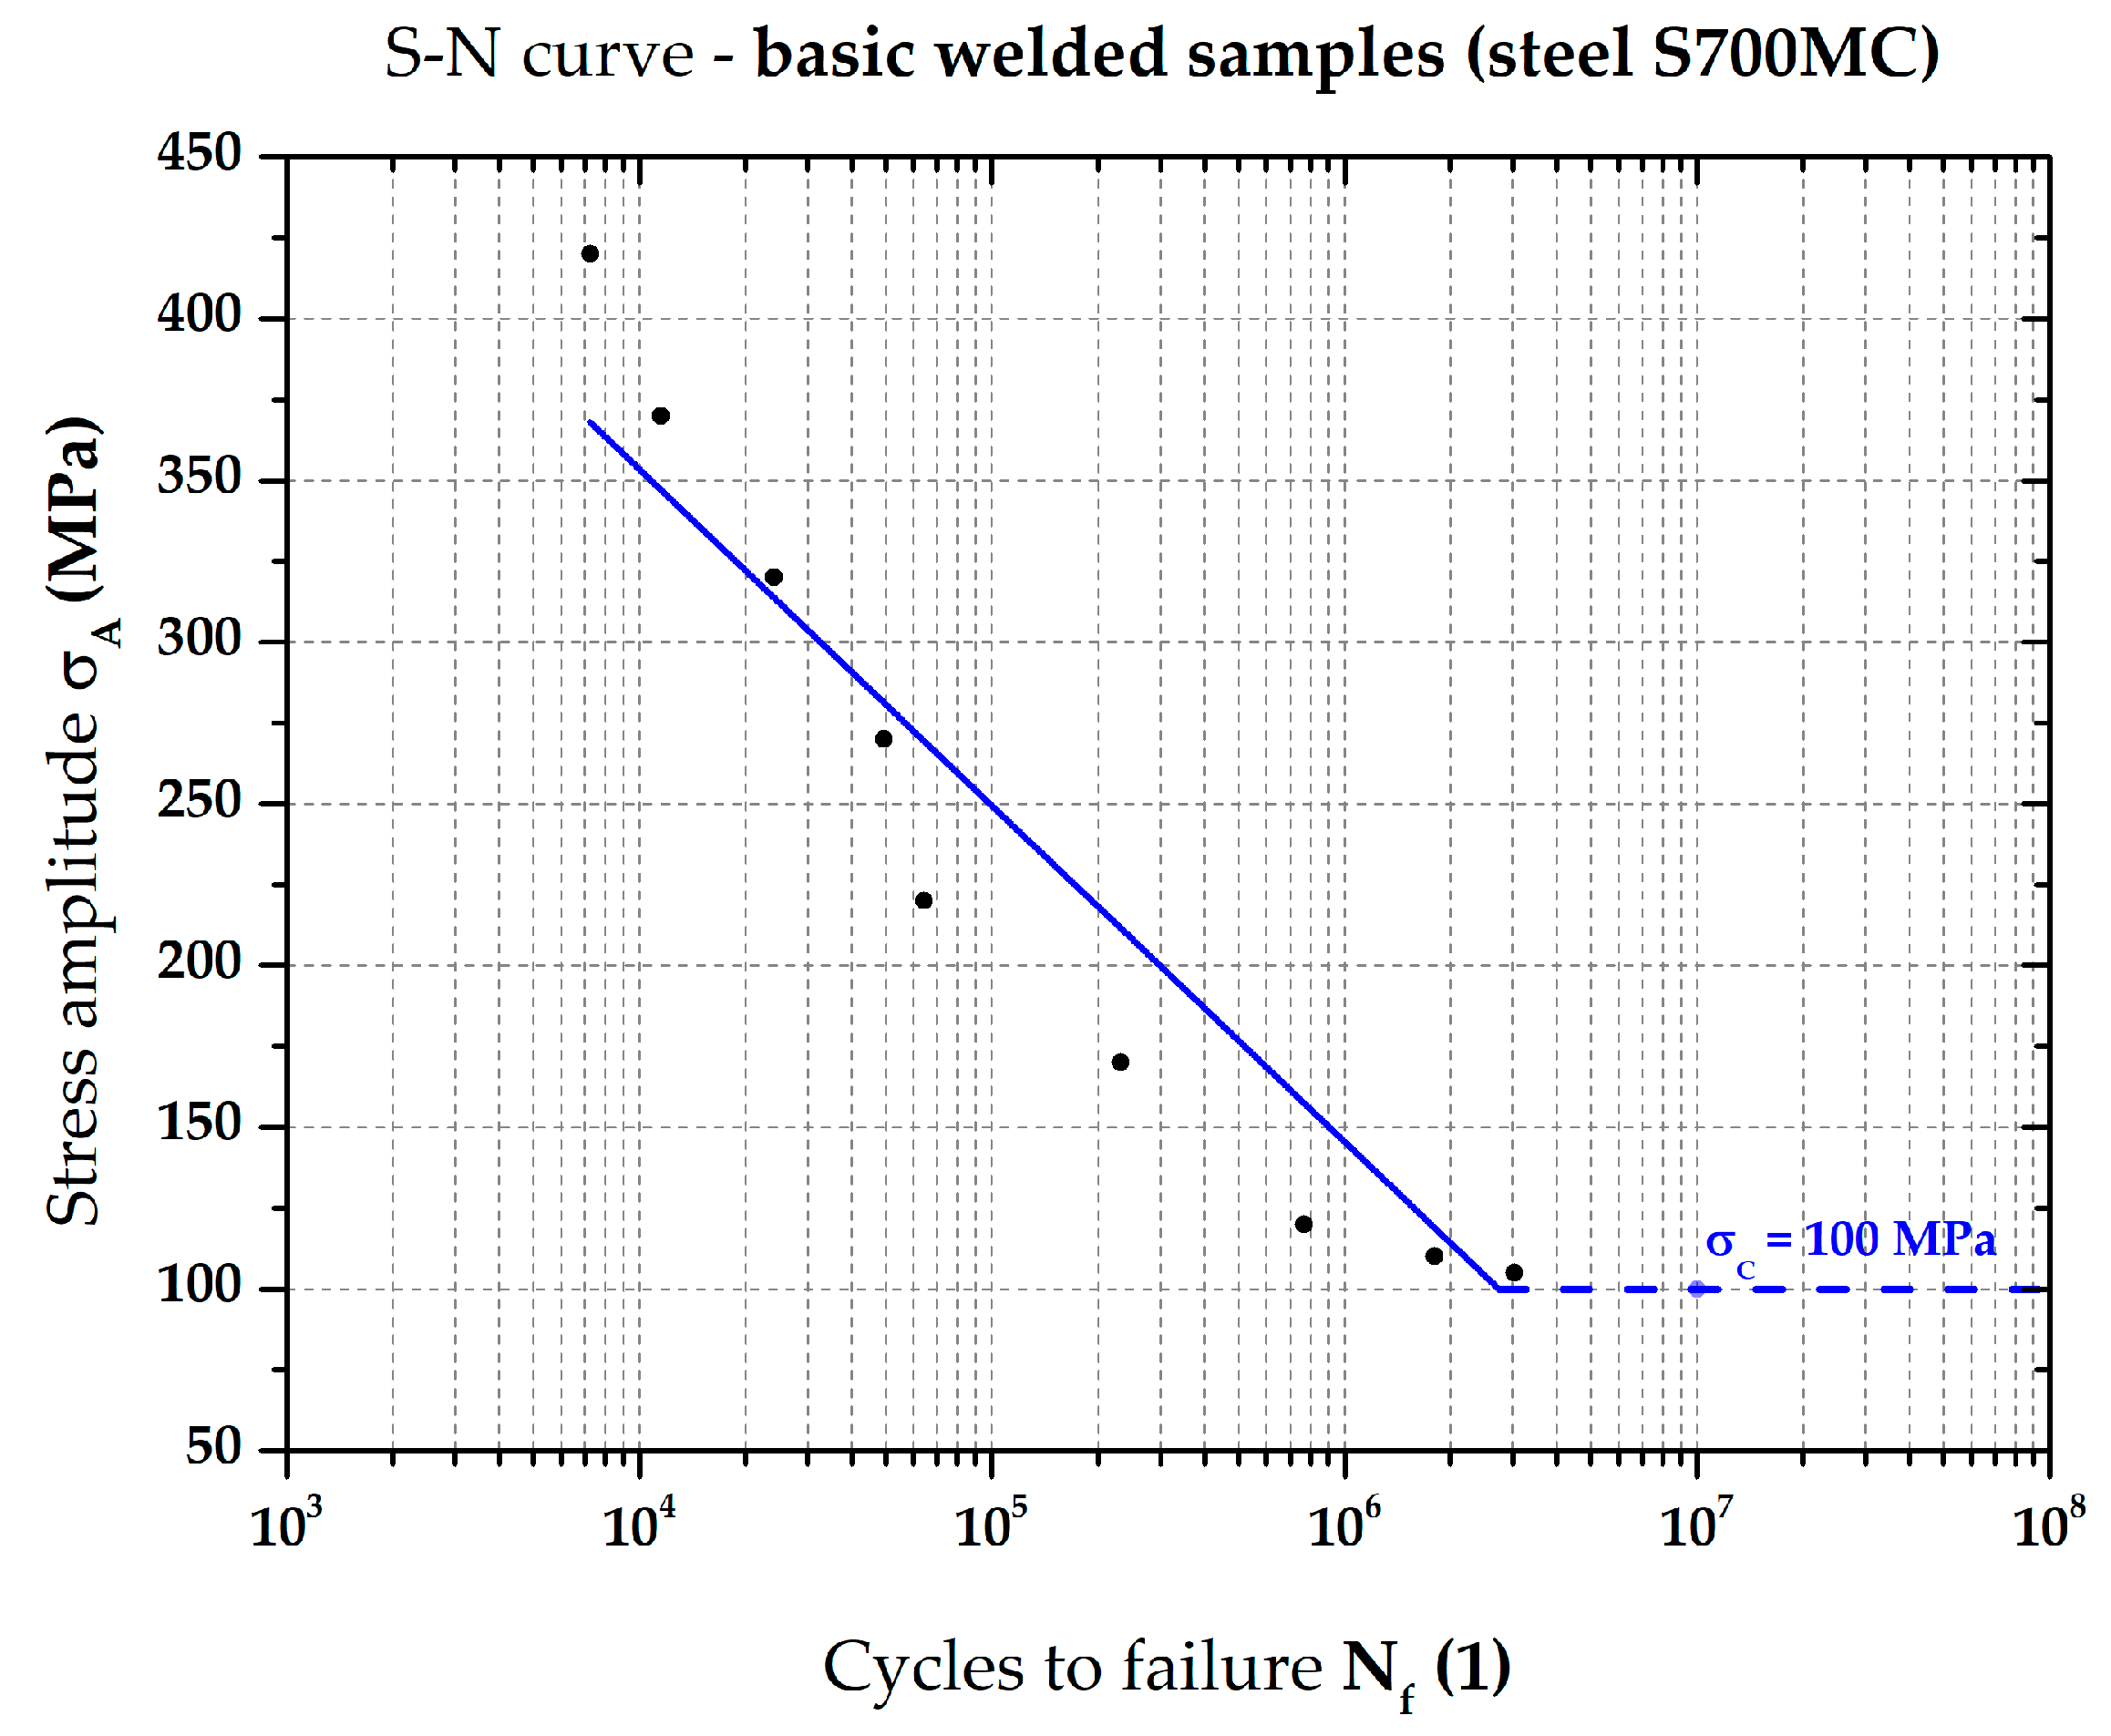
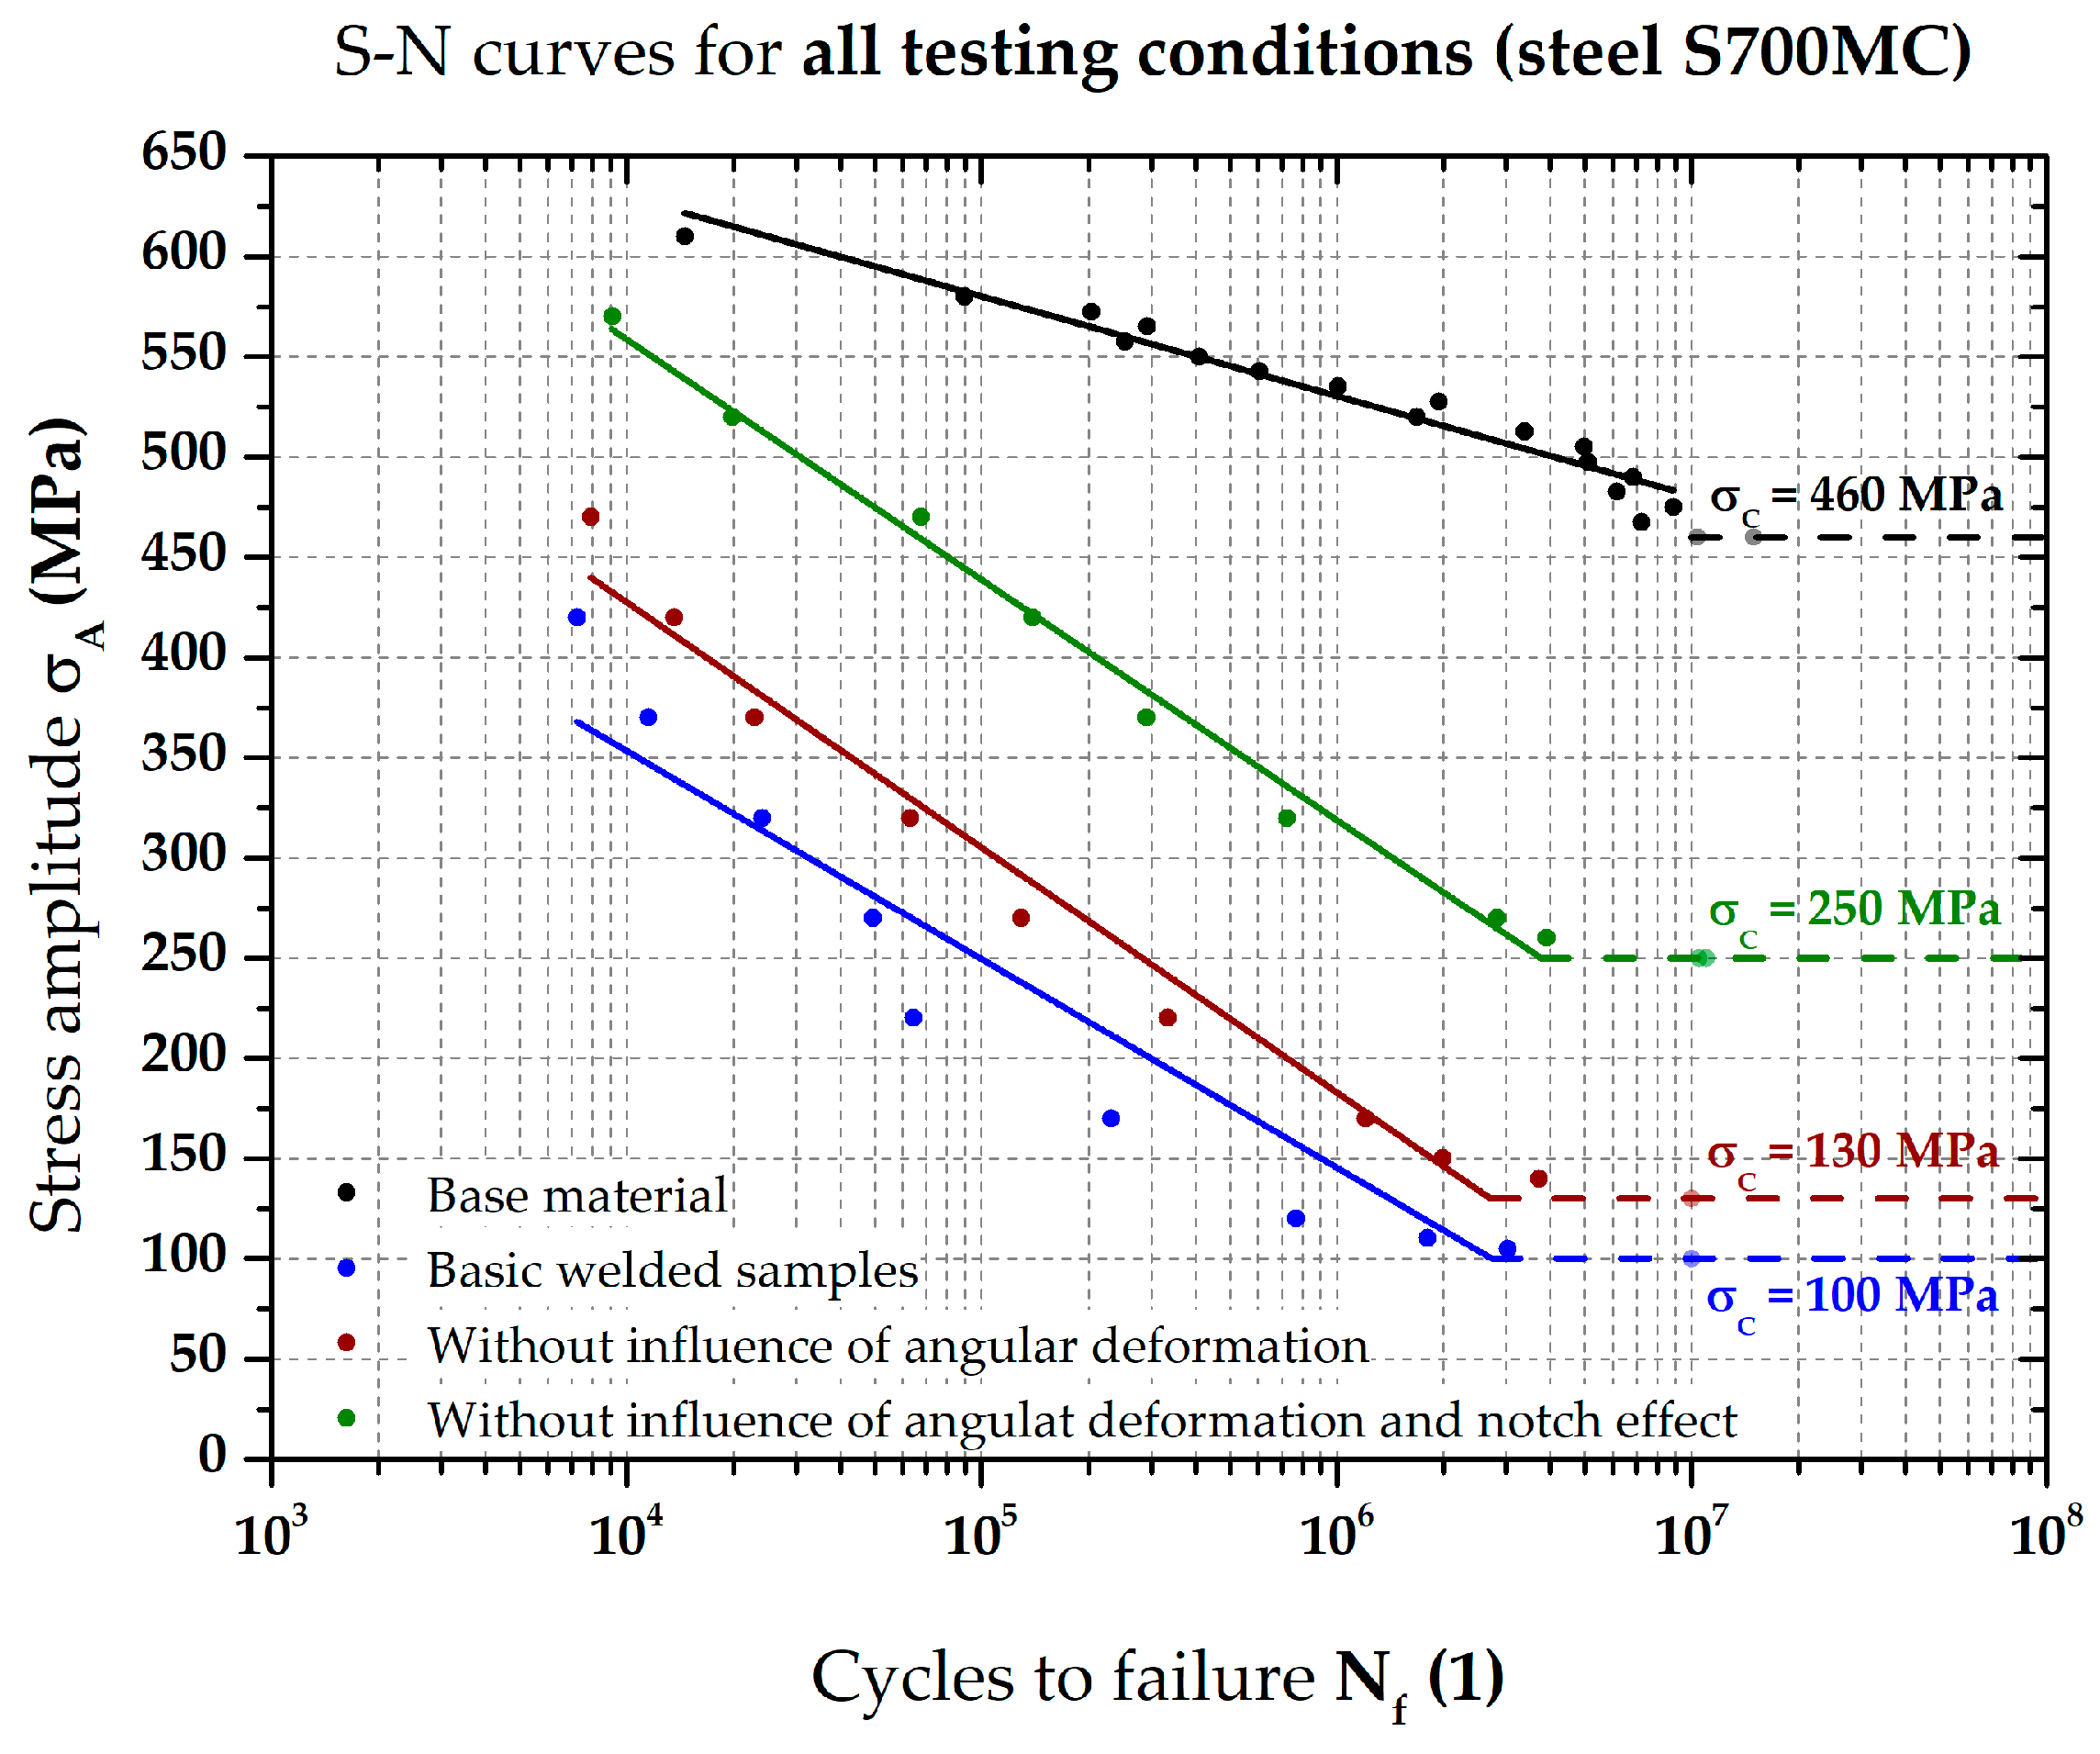
From
Figure 15, it is evident that the welding process (blue S-N curve) significantly reduced the value of steel S700MC fatigue limit σ
C. This fatigue limit was reduced by 360 MPa to 100 MPa, which is more than 78%. There is also a significant difference in the slope of the relevant line in the area of limited life, which is much flatter for the base material. The reasons for such significant changes in fatigue strength arise mainly from the notch effect of the weld, material changes in HAZ and additional bending stresses caused by deformation after welding. However, the size and shape factor of the test samples used also has a partial influence. To assess these partial effects, it was necessary to compare the individual S-N curves of welded joints.
The effect of angular deformation can be determined by mutual comparison of the S-N curves illustrating the fatigue behaviour of the test samples without the influence of angular deformations (
Figure 15—red line) and S-N curve of basic samples (just as they were welded); see
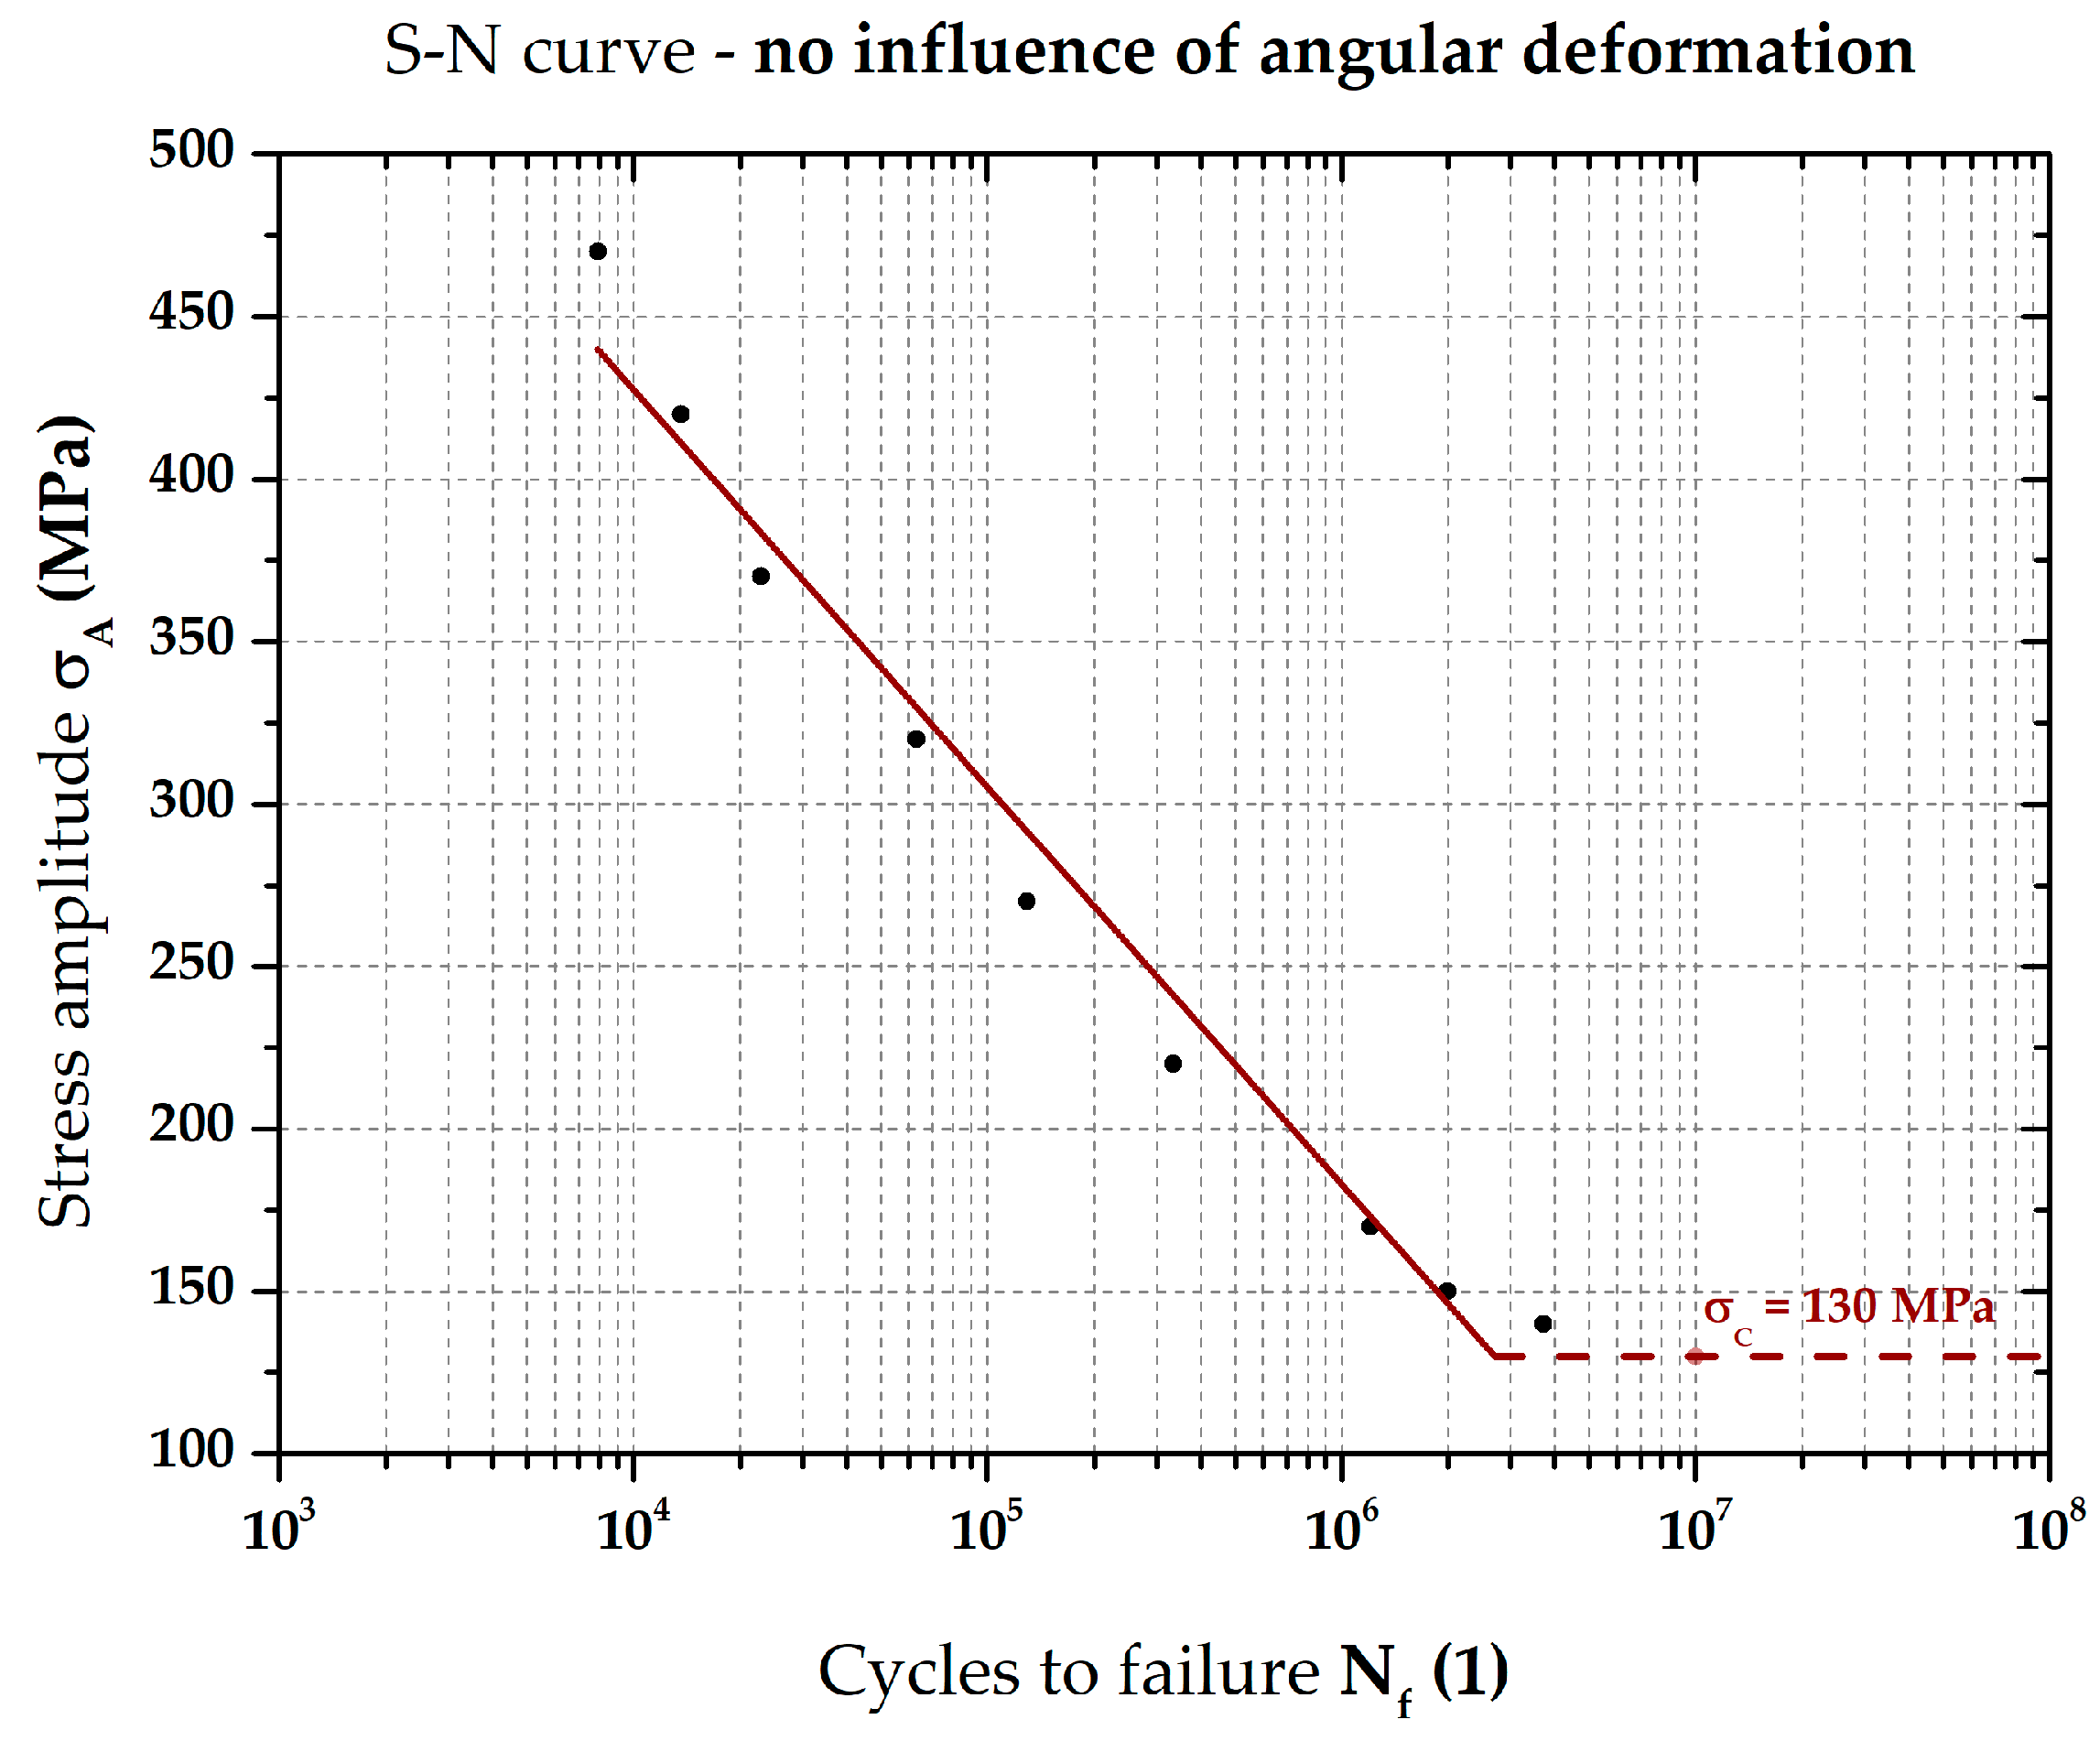
Figure 15 (blue line). The fatigue limit σ
C for samples without the effect of angular deformation increased by 30 MPa to 130 MPa. From these results, it can be concluded that the bending stresses contribute to the reduction base material fatigue limit by approximately 6%, and to the overall influence of welding process by 8.3%. However, this is only valid for the used loading method and clamping of samples on the fatigue testing device, when the distance between the testing grips was 50 mm. If the distance between clamping grips is increased, the magnitude of the bending moment would increase, and thus also the effect of combined bending stress would also slightly increase. However, this effect would probably not exceed 10%.
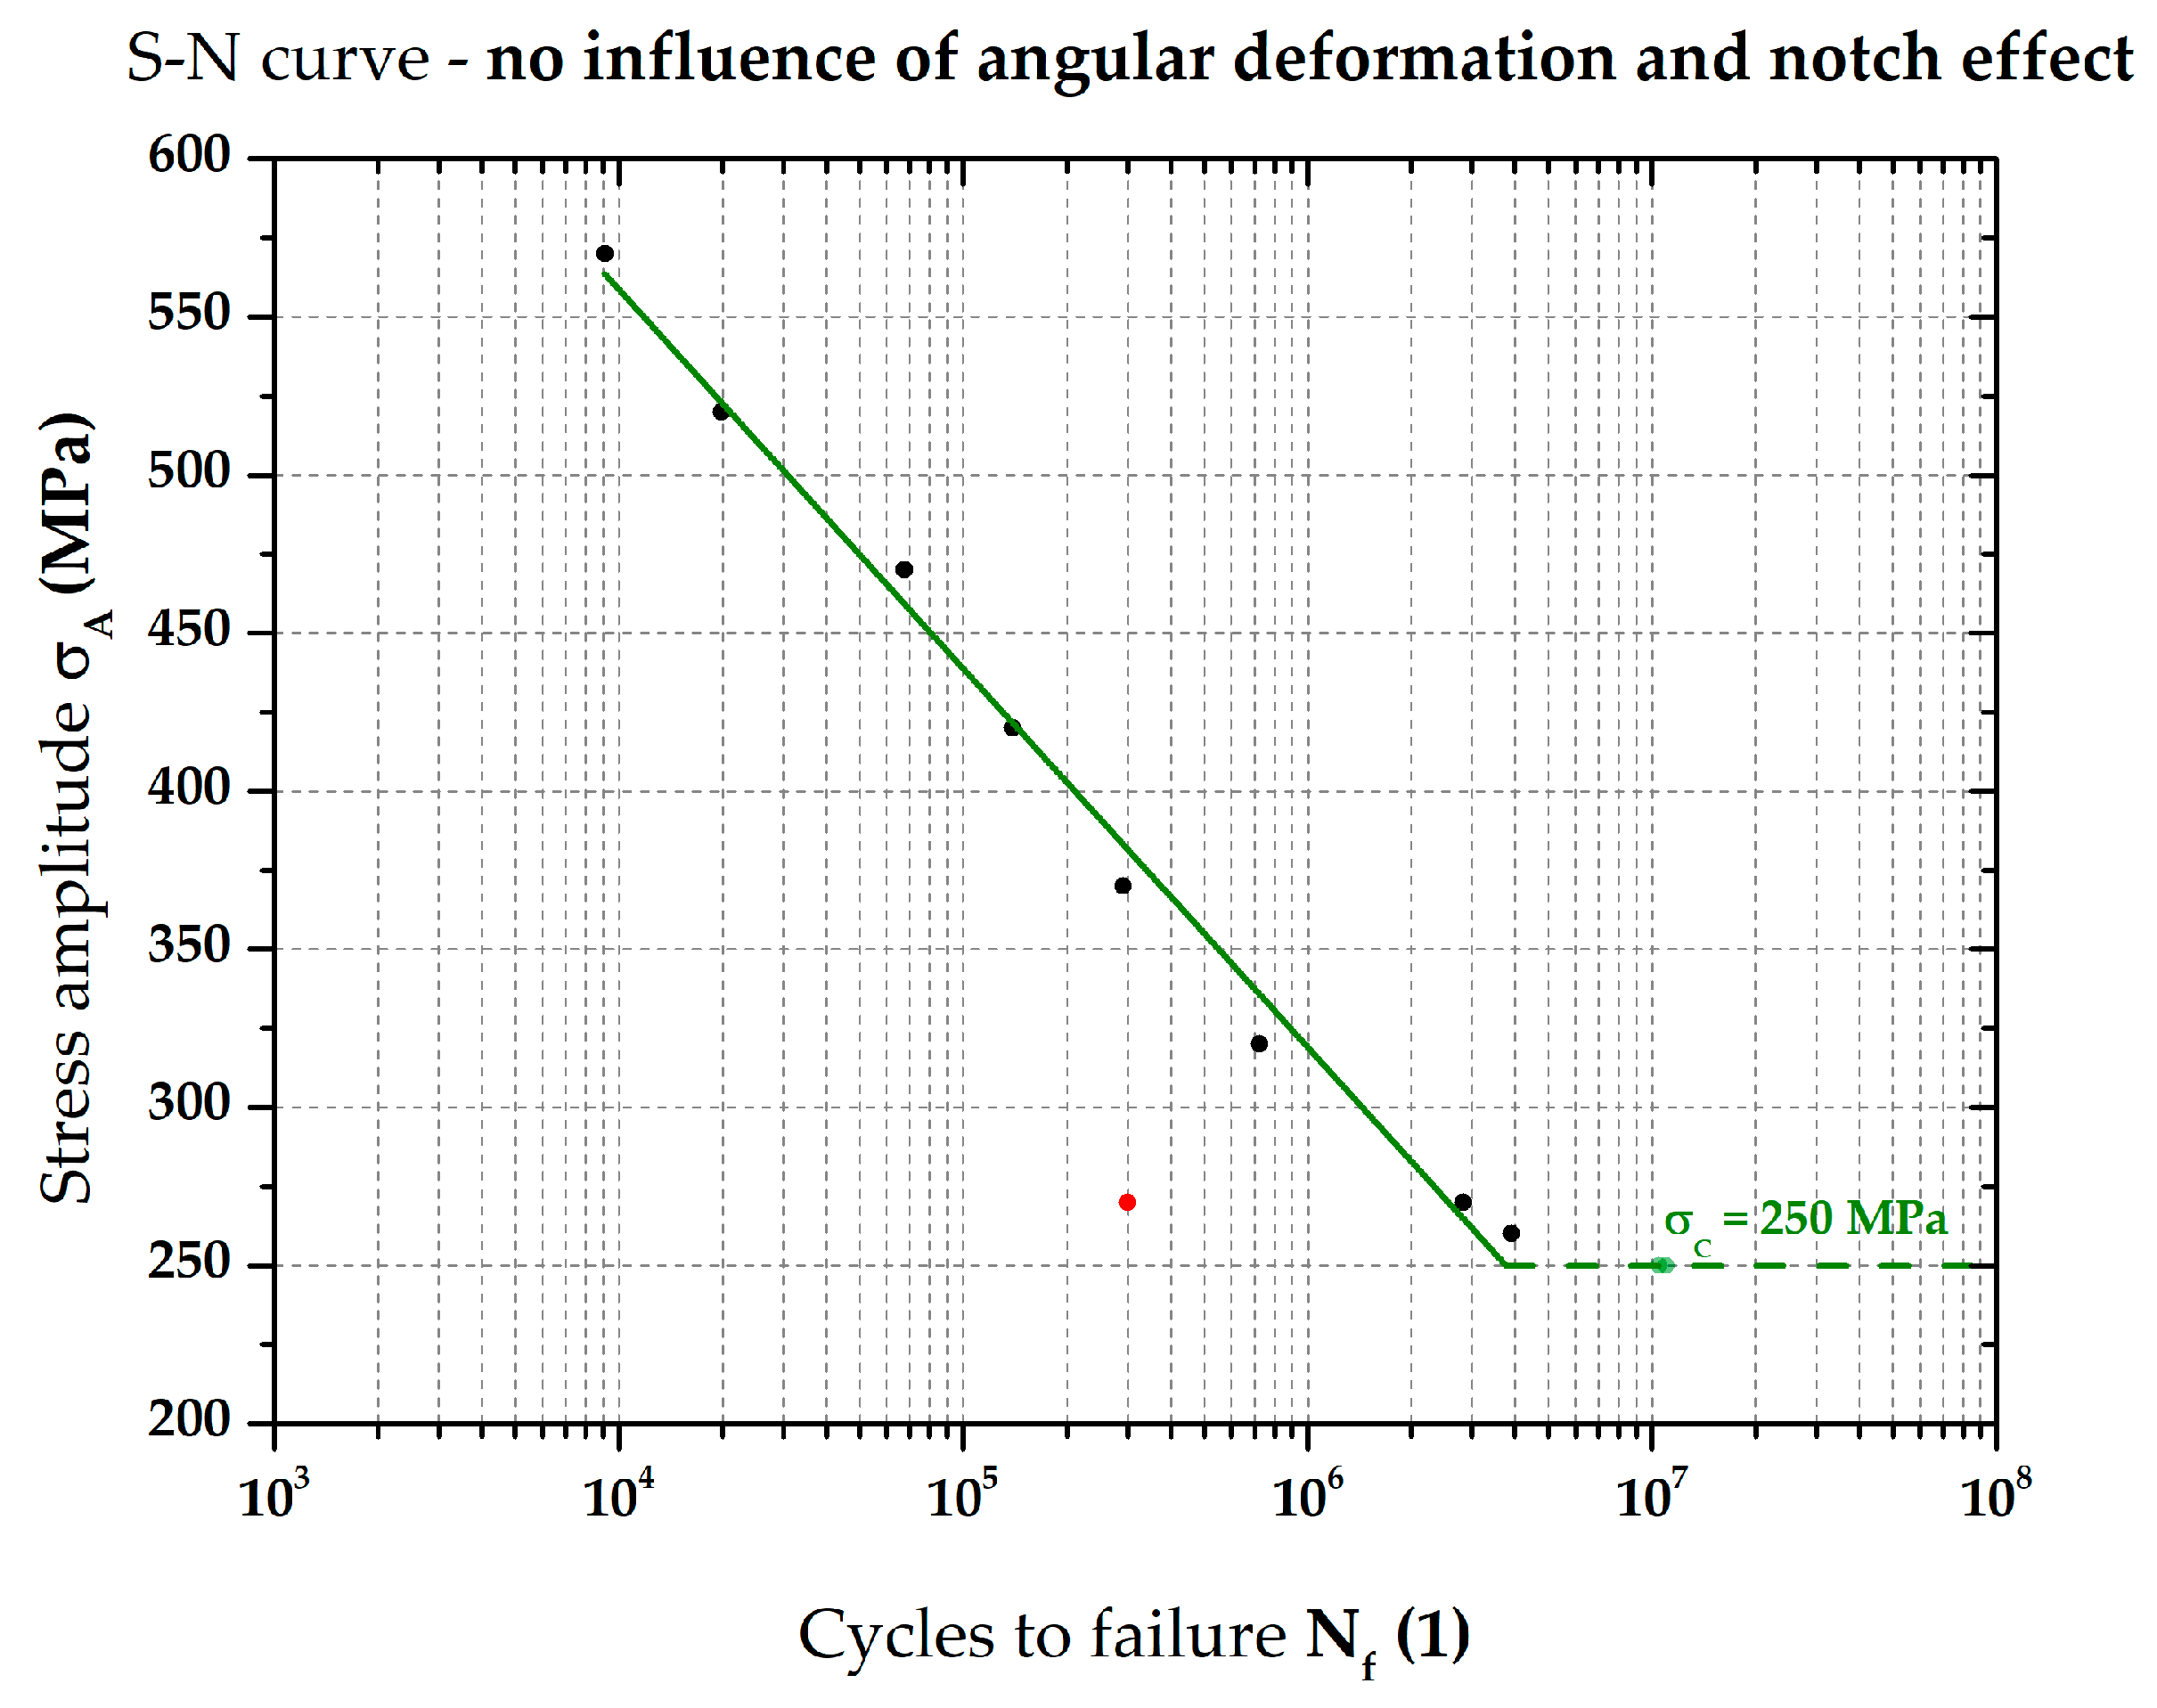
The influence of the notch effect caused due to the weld bead geometry could be assessed by the notch elimination, i.e., by a smooth transition from flange to web. Because of this, samples without the influence of angular deformation and with a radius R6 on transition from the flange to the web were used. The fatigue limit σ
C = 250 MPa was measured by fatigue testing (
Figure 15—olive line), which means an increase of fatigue limit already by 150 MPa, compared to the basic welded samples. Thus, after deduction the effect of angular deformation, notch effect of weld contributed to the base material fatigue limit reduction by 26.6%. Finally, its share in the total welding process influence was 33.4%.
By means of a simple sum, it can be determined that the angular deformation after welding and the notch effect given by the welding bead geometry contribute to the fatigue limit reduction caused by welding approximately by 42%. The rest, i.e., about 58% of such effect, deals with the changes that occur in HAZ due to welding. However, this claim cannot be fully accepted, because the size and the shape factor of the testing samples used need to also be taken into account. This approach would be possible to use under the condition that samples defined by standard EN 3987 would not be used when measuring the S-N curve of the base material (see
Figure 2), but rather modified samples corresponding in shape and dimensions to the testing samples used. These samples would have a rectangular cross-section area with a width of 18 mm and a height of at least 8 mm. Then it would be possible to precisely determine the effect of the changes that occur during welding in the HAZ of welds. Therefore, further work by the authors’ team in this area will be focused on assessing the influence of size and shape factor in HSLA steels.
It was not possible to compare the obtained results with similar works, because it was not possible to find any published scientific studies devoted to the quantification of the influence of partial aspects of the welding process on changes in fatigue behaviour (fatigue limit).
Author Contributions
Conceptualization, J.M.; methodology, J.M. and I.N.; investigation, J.M., J.S., I.N. and S.B.; resources, J.M., I.N. and S.B.; data curation, J.M. and J.S.; writing—original draft preparation, J.M., writing―review and editing, J.M. and J.S.; visualization, J.M. and J.S. All authors have read and agreed to the published version of the manuscript.
Funding
This research was funded by the Student Grant Competition of the Technical University of Liberec under the project No. SGS-2019-5015 "Research and development for innovation of materials and production technologies with application potential in mechanical engineering”.
Institutional Review Board Statement
Not applicable.
Informed Consent Statement
Not applicable.
Data Availability Statement
Not applicable.
Conflicts of Interest
The authors declare no conflict of interest.
References
- Illescas, S.; Fernández, J.; Asensio, J.; Sánchez-Soto, M.; Guilemany, J.M. Study of the Mechanical Properties of Low Carbon Content HSLA Steels. Rev. Metal. 2009, 45, 424–431. [Google Scholar] [CrossRef] [Green Version]
- Moravec, J.; Novakova, I.; Sobotka, J.; Neumann, H. Determination of Grain Growth Kinetics and Assessment of Welding Effect on Properties of S700MC Steel in the HAZ of Welded Joints. Metals 2019, 9, 707. [Google Scholar] [CrossRef] [Green Version]
- Pamnani, R.; Jayakumar, T.; Vasudevan, M.; Sakthivel, T. Investigations on the Impact Toughness of HSLA Steel Arc Welded Joints. J. Manuf. Process. 2016, 21, 75–86. [Google Scholar] [CrossRef]
- Sastry, C.C.; Hariharan, P.; Kumar, M.P.; Manickam, M.A.M. Experimental Investigation on Boring of HSLA ASTM A36 Steel under Dry, Wet, and Cryogenic Environments. Mater. Manuf. Process. 2019, 34, 1352–1379. [Google Scholar] [CrossRef]
- Barbaro, F.; Kuzmikova, L.; Zhu, Z.; Li, H. Weld Haz Properties in Modern High Strength Niobium Pipeline Steels. In Proceedings of the Energy Materials 2014; Springer International Publishing: Cham, Germany, 2016; pp. 657–664. [Google Scholar]
- Fernández, J.; Illescas, S.; Guilemany, J.M. Effect of Microalloying Elements on the Austenitic Grain Growth in a Low Carbon HSLA Steel. Mater. Lett. 2007, 61, 2389–2392. [Google Scholar] [CrossRef]
- Schaupp, T.; Schroepfer, D.; Kromm, A.; Kannengiesser, T. Welding Residual Stresses in 960MPa Grade QT and TMCP High-Strength Steels. J. Manuf. Process. 2017, 27, 226–232. [Google Scholar] [CrossRef]
- Branco, R.; Berto, F. Mechanical Behavior of High-Strength, Low-Alloy Steels. Metals 2018, 8, 610. [Google Scholar] [CrossRef] [Green Version]
- Laitila, J.; Larkiola, J. Effect of Enhanced Cooling on Mechanical Properties of a Multipass Welded Martensitic Steel. Weld World 2019, 63, 637–646. [Google Scholar] [CrossRef] [Green Version]
- Njock Bayock, F.; Kah, P.; Mvola, B.; Layus, P. Effect of Heat Input and Undermatched Filler Wire on the Microstructure and Mechanical Properties of Dissimilar S700MC/S960QC High-Strength Steels. Metals 2019, 9, 883. [Google Scholar] [CrossRef] [Green Version]
- Taavitsainen, J.; da Silva, P.S.V.; Porter, D.; Suikkanen, P. Weldability of Direct-Quenched Steel with a Yield Stress of 960 MPa. In Proceedings of the 10th International Conference on Trends in Welding Research and 9th International Welding Symposium of Japan Welding Society (9WS), Tokyo, Japan, 11–14 October 2016; Curran Associates, Inc.: New York, NY, USA, 2017; pp. 52–55. [Google Scholar]
- Górka, J. Microstructure and Properties of the High-Temperature (HAZ) of Thermo-Mechanically Treated S700MC High-Yield-Strength Steel. Mater. Tehnol. 2016, 50, 616–621. [Google Scholar] [CrossRef]
- Skowrónska, B.; Chmielewski, T.; Golański, D.; Szulc, J. Weldability of S700MC Steel Welded with the Hybrid Plasma+ MAG Method. Manuf. Rev. 2020, 7, 4. [Google Scholar] [CrossRef] [Green Version]
- Mičian, M.; Harmaniak, D.; Nový, F.; Winczek, J.; Moravec, J.; Trško, L. Effect of the T8/5 Cooling Time on the Properties of S960MC Steel in the HAZ of Welded Joints Evaluated by Thermal Physical Simulation. Metals 2020, 10, 229. [Google Scholar] [CrossRef] [Green Version]
- Fydrych, D.; Tomków, J.; Rogalski, G.; Labanowski, J. Weldability of S460ML High Strength Low Alloy Steel in Underwater Conditions. Appl. Mech. Mater. 2016, 838, 10–17. [Google Scholar] [CrossRef]
- Kik, T.; Górka, J.; Kotarska, A.; Poloczek, T. Numerical Verification of Tests on the Influence of the Imposed Thermal Cycles on the Structure and Properties of the S700MC Heat-Affected Zone. Metals 2020, 10, 974. [Google Scholar] [CrossRef]
- Kik, T.; Moravec, J.; Švec, M. Experiments and Numerical Simulations of the Annealing Temperature Influence on the Residual Stresses Level in S700MC Steel Welded Elements. Materials 2020, 13, 5289. [Google Scholar] [CrossRef]
- Šebestová, H.; Horník, P.; Mrňa, L.; Jambor, M.; Horník, V.; Pokorný, P.; Hutař, P.; Ambrož, O.; Doležal, P. Fatigue Properties of Laser and Hybrid Laser-TIG Welds of Thermo-Mechanically Rolled Steels. Mater. Sci. Eng. A 2020, 772, 138780. [Google Scholar] [CrossRef]
- Moravec, J.; Sobotka, J.; Solfronk, P.; Thakral, R. Heat Input Influence on the Fatigue Life of Welds from Steel S460MC. Metals 2020, 10, 1288. [Google Scholar] [CrossRef]
- Lahtinen, T.; Vilaça, P.; Infante, V. Fatigue Behavior of MAG Welds of Thermo-Mechanically Processed 700MC Ultra High Strength Steel. Int. J. Fatigue 2019, 126, 62–71. [Google Scholar] [CrossRef]
- Lago, J.; Trško, L.; Jambor, M.; Nový, F.; Bokůvka, O.; Mičian, M.; Pastorek, F. Fatigue Life Improvement of the High Strength Steel Welded Joints by Ultrasonic Impact Peening. Metals 2019, 9, 619. [Google Scholar] [CrossRef] [Green Version]
- Kim, Y.; Hwang, W. Effect of Weld Seam Orientation and Welding Process on Fatigue Fracture Behaviors of HSLA Steel Weld Joints. Int. J. Fatigue 2020, 137, 105644. [Google Scholar] [CrossRef]
- Schmidová, E.; Bozkurt, F.; Culek, B.; Kumar, S.; Kuchariková, L.; Uhríčik, M. Influence of Welding on Dynamic Fracture Toughness of Strenx 700MC Steel. Metals 2019, 9, 494. [Google Scholar] [CrossRef] [Green Version]
- Wu, S.C.; Qin, Q.B.; Hu, Y.N.; Branco, R.; Li, C.H.; Williams, C.J.; Zhang, W.H. The Microstructure, Mechanical, and Fatigue Behaviours of MAG Welded G20Mn5 Cast Steel. Fatigue Fract. Eng. Mater. Struct. 2020, 43, 1051–1063. [Google Scholar] [CrossRef]
Figure 1.
Ferritic-bainitic structure of the tested material—steel S700MC.
Figure 2.
Dimensions (a) and 3D illustration (b) of the est sample in accordance with standard EN 3987.
Figure 3.
S-N curve (semi-log scale) of the base material—steel S700MC.
Figure 4.
Measurement of angular deformation after welding.
Figure 5.
Geometrical evaluation of Weld 2 after welding of the tested material—steel S700MC (etched by 3% Nital).
Figure 6.
HV5 hardness measurement after the welding of HSLA steel S700MC (Weld 1, Bead 1).
Figure 7.
Details of grain coarsening in the HAZ after welding of steel S700MC (Weld 1, Bead 1).
Figure 8.
Cyclic testing: (a) cutting of test samples; (b) completely prepared test sample.
Figure 9.
Shape adjustment and loading of fatigue tests.
Figure 10.
S-N curve (semi-log scale) of basic welded samples—steel S700MC.
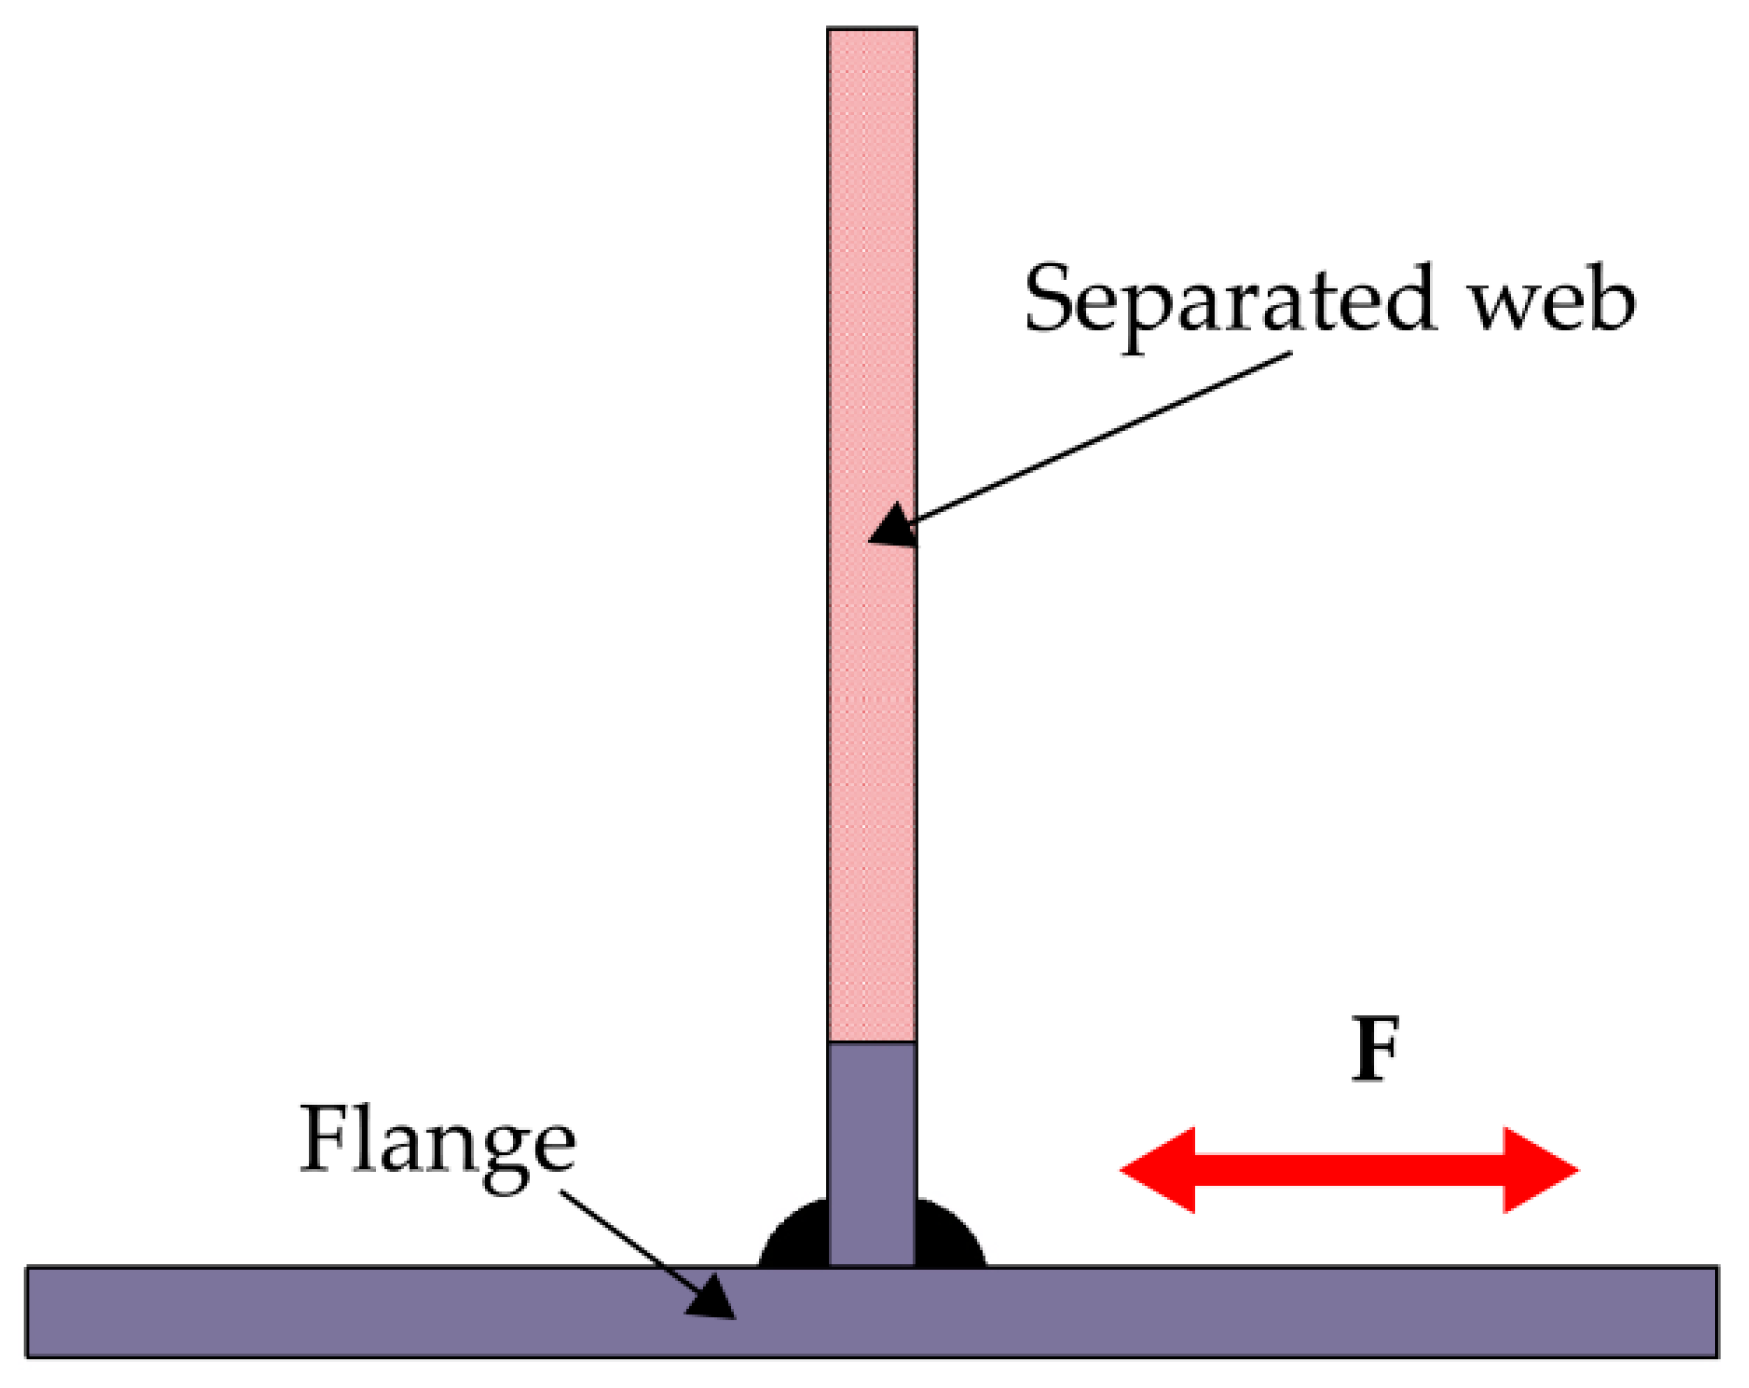
Figure 11.
Schematic representation of the test sample flange modification.
Figure 12.
S-N curve (semi-log scale) of the welded samples without the influence of angular deformation.
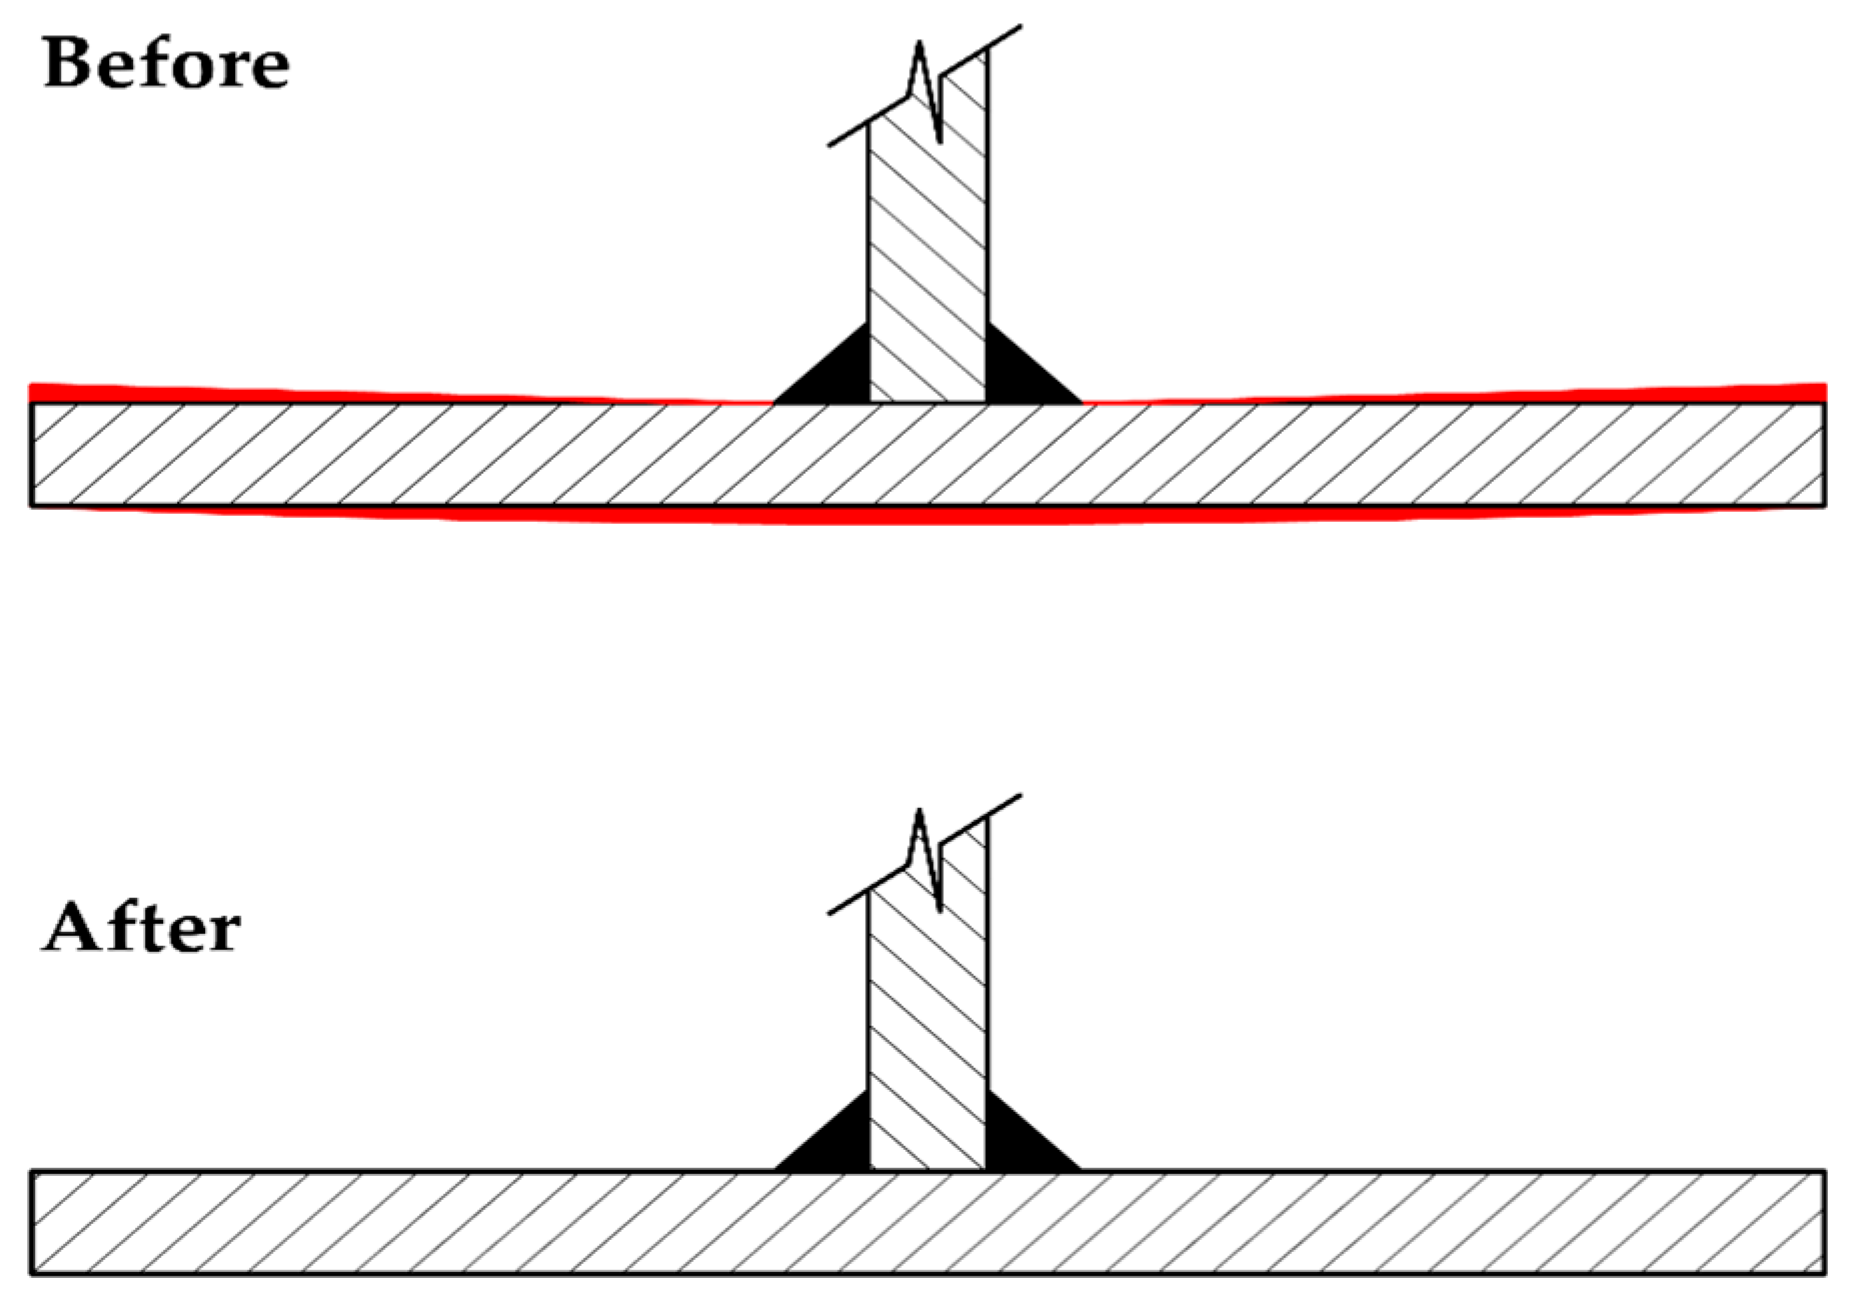
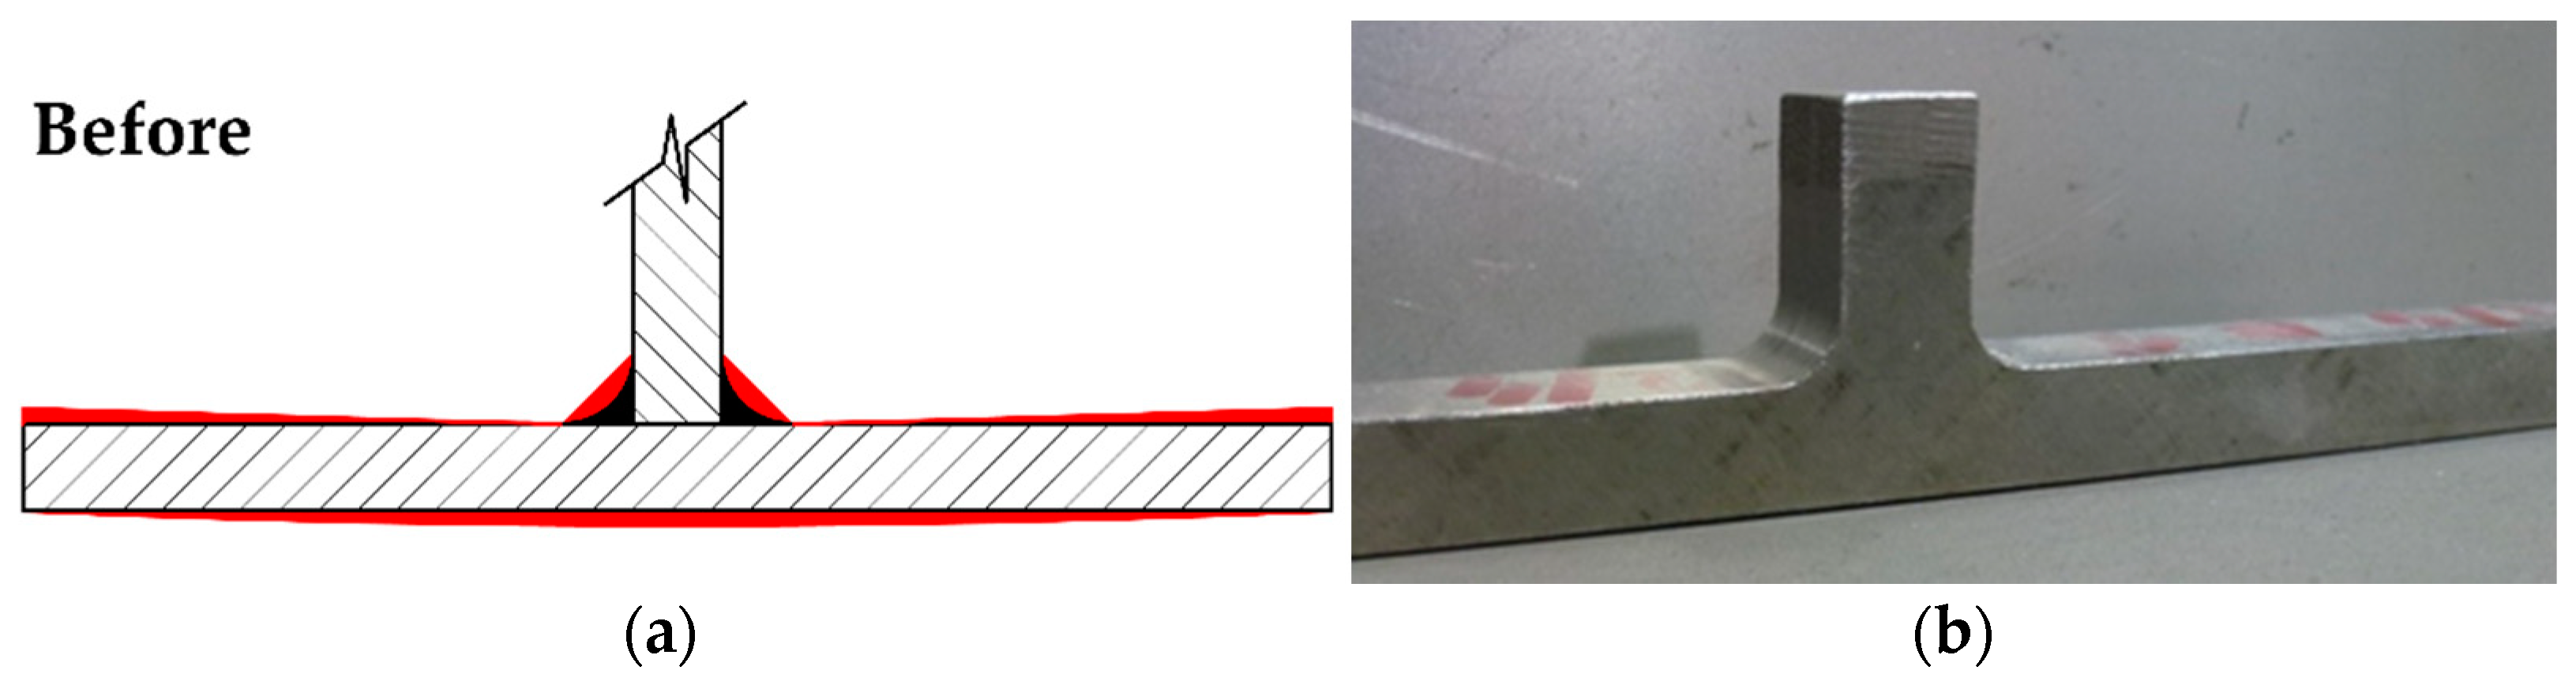
Figure 13.
Schematic representation of modifications: (a) flange and weld bead; (b) real sample.
Figure 14.
S-N curve (semi-log scale) of welded samples without the influence of angular deformation and notch effect.
Figure 15.
Comparison of the final S-N curves (semi-log scale) regarding observed aspects of welding process.
Table 1.
Chemical composition of steel S700MC (wt%).
| Element | C | Si | Mn | P | S | Al | Nb | V |
| ČSN EN 10149-2 | max. 0.12 | max. 0.6 | max. 2.2 | max. 0.025 | max. 0.010 | min. 0.015 | max. 0.09 | max. 0.2 |
| Experiment | 0.051 | 0.197 | 1.916 | 0.006 | 0.006 | 0.038 | 0.063 | 0.072 |
| Element | Ti | Mo | B | N | Ni | Cr | W | - |
| ČSN EN 10149-2 | max. 0.25 | max. 1 | max. 0.005 | - | - | - | - | - |
| Experiment | 0.056 | 0.113 | 0 | 0.013 | 0.154 | 0.036 | 0.035 | - |
Table 2.
Chemical composition of steel S700MC (wt.%).
Strain
Rate (s−1) | Sample
No. | Diameter of Sample
D (mm) | Proof yield Strength
Rp0.2 (MPa) | Ultimate Tensile Strength
Rm (MPa) | Uniform Ductility
Ag (%) | Total
Ductility
A30 (%) |
|---|
| 10−2 | BMT-01 | 6.52 | 749 | 851 | 10.97 | 23.91 |
| BMT-02 | 6.53 | 748 | 852 | 12.33 | 25.22 |
| BMT-03 | 6.50 | 731 | 849 | 10.72 | 23.62 |
| BMT-04 | 6.52 | 743 | 853 | 11.09 | 23.89 |
| BMT-05 | 6.51 | 739 | 850 | 11.14 | 24.37 |
| Average Value | 742 | 851 | 11.25 | 24.20 |
Table 3.
Cycles to failure Nf vs. stress amplitude σA of the base material—steel S700MC.
| σA (MPa) | 610 | 580 | 572.5 | 565 | 557.5 | 550 | 542.5 | 535 | 527.5 | 520 |
| Nf (1) | 14,618 | 89,479 | 203,831 | 292,247 | 253,012 | 409,694 | 607,374 | 1,011,570 | 1,938,660 | 1,680,770 |
| σA (MPa) | 512.5 | 505 | 497.5 | 490 | 482.5 | 475 | 467.5 | 460 | 460 | - |
| Nf (1) | 3,382,470 | 4,981,640 | 5,112,390 | 6,834,210 | 6,149,530 | 8,881,580 | 7,209,650 | 1.03 × 10⁷ | 1.49 × 10⁷ | - |
Table 4.
Chemical composition of filler wire Böhler UNION NiMoCrø1 (wt%).
| Element | C | Si | Mn | Cr | Mo | Ni |
|---|
| Content (wt%) | 0.08 | 0.60 | 1.70 | 0.20 | 0.50 | 1.50 |
Table 5.
Actual welding process parameters measured by the WeldMonitor system.
Weld
Designation | Number of
Bead | Effective
Current
I (A) | Effective
Voltage
U (V) | Real Welding Speed
vs (m·min−1) | Heat Input
Q (J·mm−1) |
|---|
| Weld 1 | 1 | 353.2 | 29.7 | 0.601 | 1.047 |
| 2 | 348.6 | 29.8 | 0.599 | 1.041 |
| Weld 2 | 1 | 351.7 | 29.7 | 0.597 | 1.050 |
| 2 | 347.9 | 29.8 | 0.599 | 1.039 |
| Weld 3 | 1 | 354.3 | 29.8 | 0.602 | 1.052 |
| 2 | 350.5 | 29.7 | 0.600 | 1.041 |
Table 6.
Measured values of angular deformation (in accordance with
Figure 4).
| Distance (mm) | Weld 1 | Weld 2 | Weld 3 |
|---|
| P1 | P2 | P1 | P2 | P1 | P2 |
|---|
| (mm) | (mm) | (mm) | (mm) | (mm) | (mm) |
|---|
| 0 | 1.60 | 3.03 | 1.67 | 3.16 | 1.59 | 3.11 |
| 25 | 1.63 | 3.11 | 1.58 | 2.99 | 1.55 | 3.09 |
| 50 | 1.67 | 3.18 | 1.59 | 3.00 | 1.58 | 3.25 |
| 75 | 1.71 | 3.16 | 1.65 | 3.17 | 1.69 | 3.28 |
| 100 | 1.78 | 3.19 | 1.71 | 3.29 | 1.73 | 3.24 |
| 125 | 1.77 | 3.21 | 1.79 | 3.21 | 1.74 | 3.26 |
| 150 | 1.72 | 3.13 | 1.75 | 3.12 | 1.66 | 3.17 |
| 175 | 1.73 | 3.07 | 1.70 | 3.08 | 1.68 | 3.09 |
| 200 | 1.69 | 2.99 | 1.64 | 3.16 | 1.62 | 3.01 |
| 225 | 1.68 | 2.96 | 1.65 | 3.08 | 1.63 | 3.03 |
| 250 | 1.65 | 2.94 | 1.61 | 3.04 | 1.59 | 2.98 |
| 275 | 1.61 | 2.94 | 1.63 | 2.99 | 1.57 | 2.96 |
| 300 | 1.58 | 2.91 | 1,66 | 3.02 | 1.62 | 2.95 |
| Average Value | 1.68 ± 0.06 | 3.06 ± 0.11 | 1.66 ± 0.06 | 3.10 ± 0.09 | 1.63 ± 0.06 | 3.09 ± 0.12 |
Table 7.
Cycles to failure Nf vs. stress amplitude σA of basic welded samples—steel S700MC.
| σA (MPa) | 420 | 370 | 320 | 270 | 220 | 170 | 120 | 110 | 105 | 100 | 100 |
|---|
| Nf (1) | 7257 | 11,498 | 24,089 | 49,563 | 64,277 | 231,763 | 766,911 | 1,804,877 | 3,026,921 | 107 | 107 |
Table 8.
Nf vs. σA of welded samples without influence of angular deformation.
| σA (MPa) | 470 | 420 | 370 | 320 | 270 | 220 | 170 | 150 | 140 | 130 | 130 |
|---|
| Nf (1) | 7931 | 13,611 | 22,973 | 63,235 | 129,164 | 334,854 | 1,208,016 | 1,989,038 | 3,725,785 | 107 | 107 |
Table 9.
Nf vs. σA of welded samples without the influence of angular deformation.
| σA (MPa) | 570 | 520 | 470 | 420 | 370 | 320 | 270 | 260 | 250 | 250 |
|---|
| Nf (1) | 9113 | 19,839 | 67,511 | 139,254 | 291,378 | 723,172 | 2,830,010 | 3,901,817 | 1.1 × 10⁷ | 1.05 × 10⁷ |
| Publisher’s Note: MDPI stays neutral with regard to jurisdictional claims in published maps and institutional affiliations. |
© 2021 by the authors. Licensee MDPI, Basel, Switzerland. This article is an open access article distributed under the terms and conditions of the Creative Commons Attribution (CC BY) license (http://creativecommons.org/licenses/by/4.0/).


