Abstract
Forming limit curve (FLC) is an important failure criterion for sheet metals in sheet metal forming, while the M-K model is widely used for the prediction of the FLC. In the M-K model, such prediction is greatly influenced by the initial thickness imperfection factor and material properties, from which the original M-K model’s theoretical derivation is proposed as a solution to the above mentioned issue in this paper. Then the relationship between the M-K model and Keeler’s empirical formula is then studied, from which a new method to predict FLC is proposed that combines the M-K model with Keeler’s empirical formula according to the previous analyses. It turns out that this new method can simplify the calculation procedure. Finally, the experimental results of two kinds of aluminum alloys, AA6016 and AA5182, have verified the effectiveness of the proposed method.
1. Introduction
Lightweight materials are currently a hot issue in the automotive and aerospace industry. As light alloy material, aluminum alloy is of small destiny, has a high ratio of strength to weight and has high corrosion resistance ability [1,2,3]. Therefore, it is increasing in popularity. However, aluminum alloys are quite different from automotive steel sheets in ductility, anisotropy, yield strength and other indicators, so the study of its formability is of great significance. The forming limit curve (FLC) is the most intuitive and effective formability indicator for evaluating the forming performance of metal sheets. It is a curve determined by the instability limit strains of the sheet metal under different strain paths [4]. During the forming process, fracture occurs when the minor and major strain points of the sheet metal are above the FLC. As FLC is widely used to accurately predict the forming limit, great attention has been paid to it [5,6].
To quickly and easily obtain the FLC of metal sheets, the following theoretical models have been proposed, based on the plastic forming theory. The Swift model is based on a unique relationship between the root-mean-square values of shear stress and incremental strain [7]. The Hill model is derived from permissible discontinuities of stress, velocity, and surface slope [8]. The modified maximum force criterion (MMFC) predicts localized necking under non-proportional loading [9]. The M-K model takes the initial thickness imperfection into account [10]. It is widely used because of its simplicity and high precision, and its original model has already been improved significantly by scholars. For further researches on the M-K method, the angle between the groove and direction of the principal stress has been introduced in prediction [11,12,13,14]. Although scholars have done a lot of research on it, there are still some disadvantages. The predictions made by the M-K model are affected by many factors, such as the yield criterion of the materials and the termination conditions of the algorithm. The performance of the original M-K model on prediction of the FLC for aluminum alloy is in need of further research. So further study is needed to improve the M-K method.
In this study, the M-K model’s theoretical derivation is proposed. Besides, the effect of material properties and the termination condition of the algorithm are carried out, and then the relation between the M-K model and Keeler’s empirical formula [15] is studied. Based on the previous analyses about such relation, a new method to predict FLC is proposed, which combines the M-K model with Keeler’s empirical formula, and can greatly simplify the calculation. Finally, the experiments of two aluminum alloys, AA6016 and AA5182, are introduced to verify the effectiveness of this method.
2. Materials and Methods
2.1. Theoretical Analysis
2.1.1. Original M-K Model
The schematic diagram of groove model is shown in Figure 1. The plastic flow follows the normality rule, which states
where is yield function; , , and are stress components that correspond to the principal axis of stress.
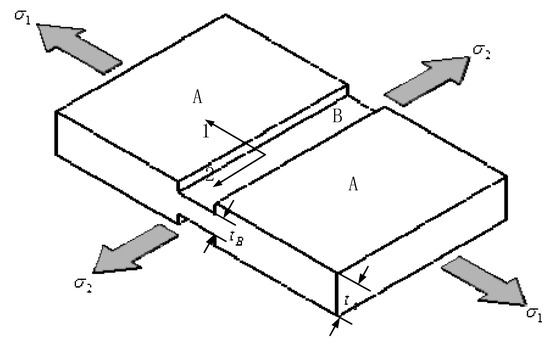
Figure 1.
Schematic diagram of groove model.
According to the hypothesis of incompressibility, we have
In order to take sheet metal’s normal anisotropy into account, the Hill’48 plastic yield [16] criterion is applied. The following formulas can be obtained.
where is normal anisotropic coefficient.
and are defined as follows:
Considering stresses are parallel to principal axis of stress, the relation between and can be derived by the equivalent plastic work which is expressed as
From Equation (1), is derived as a function of , while .
It is supposed that the strains of the zone A and the zone B are equal in the 2-direction:
force balance condition in 1-direction is expressed as:
And the error is set as:
Based on the above analysis, the stresses and strains of zone A can be obtained when the equivalent strain increment and the ratio of zone A are given. The equivalent strain increment of zone B can be determined by Newton iterative algorithm with the objective function (9). The strain of zone B is considered as the fracture strain when the main strain of the zone B is far greater than that of zone A.
Setting
then the termination of the algorithm can be written as . The recommended value of is stated in this paper. The flow chart of each path is shown in Figure 2.
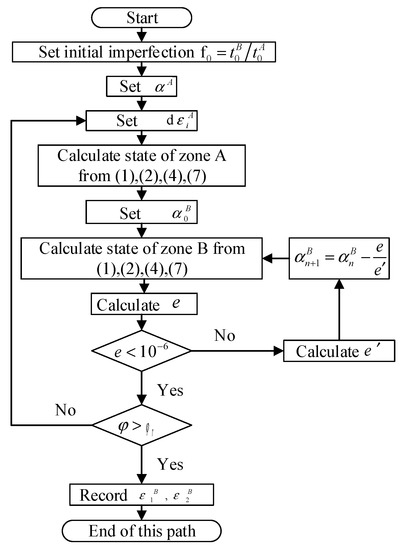
Figure 2.
Flow chart of each path.
2.1.2. Relationship between M-K Model and Keeler’s Empirical Formula
The hardening model is expressed as
During each iteration, is a constant, while the stress component and the thickness are determined by the strain increment of zone B . That is to say, is a function of . From Equations (2) and (6), the strain increment is a function of . Accordingly, we have
Divide both sides of Equation (10) by , we have
Therefore, the calculated FLCs are independent of strength coefficient , which is similar to Keeler’s empirical formula [15]. However, there is a slight difference between Keeler’s empirical formula and M-k method. The former is dependent on the thickness of the sheet metal, which is expressed as Equations (15) and (16), while the latter introduces the thickness imperfection.
2.1.3. The Modified M-K Model
The contrastive study points out the predicted forming limit curves, obtained by the original M-K model, do not match the experiment results for either AA6016 or AA5182. However, the value of accords with the experiments. In order to predict the FLC more precisely, the M-K method is combined with Keeler’s empirical formula, where is calculated by the M-K method, and the accurate FLC is calculated according to Equation (15).
In the following equations, the calculation of will be simplified. When the minor strain is 0, from Equations (4) and (5), we have
According to Equations (10), (12) and (18), Equation (14) can be written as
where and are the initial thickness of zone B and A, let denote the initial thickness imperfection factor.
In each iteration, is dependent only on . Equations (14) and (19) have similarities. Meanwhile, Equation (19) expresses that the only depends on the hardening exponent and the initial thickness imperfection factor.
2.2. Experiments to Determine the Material Properties
Aluminum alloy 6016-T4 and 5182-O (sheet thickness is 1 mm) are applied in the experiments of this paper. The geometrical dimension of the dog bones is shown in Figure 3, designed according to the standard GB/T 228.1-2010 [17]. The stretch testing machine is SANS (50 KN, MTS Industrial Systems (China) CO., LTD., Shenzhen, China), and the strains are measured by the extensometer with 25 mm-gauge-length. During the test, the chuck moves at a constant speed of 3 mm/s.
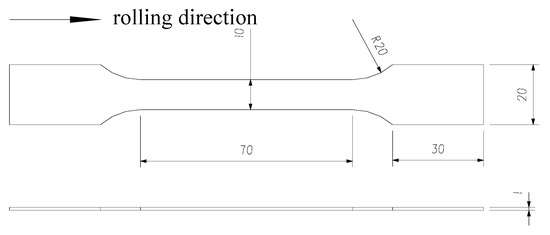
Figure 3.
Geometry of test specimen for uniaxial tensile test in mm.
The stress-strain response of AA6016 and AA5182 is expressed in Figure 4. The stress-strain response are fitted by power function and the adjusted R-squared is greater than 0.995. The fitting results are expressed in Table 1 and Figure 4.
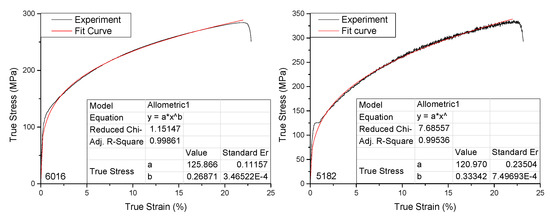
Figure 4.
The stress-strain response of AA6016 and AA5182.

Table 1.
Material parameter of AA6016 and AA5182.
The forming limit tests are carried out in accordance with GB/T15825.631995 [18]. The drawing of the test tooling is shown in Figure 5. The strain path (ratio of major to minor strain) is changed according to the change of specimen width and the lubrication condition. The test pieces are rectangular sheets shown in Figure 6. The width is in a range from 20 mm to 160 mm and the interval is 20 mm. The value of is 20 mm greater than . Only one experiment is carried out for each specimen. Each point in the forming limit diagram is only one sample.
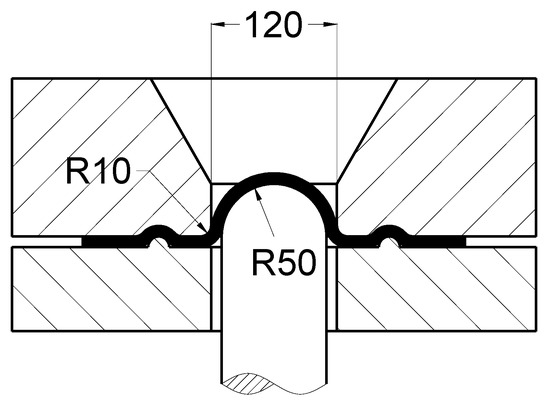
Figure 5.
Drawing of the test tooling in mm.
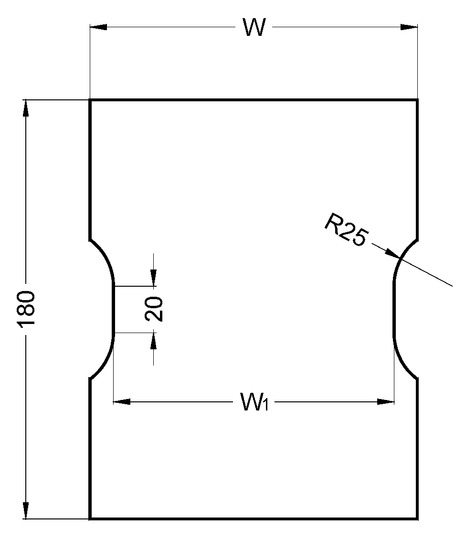
Figure 6.
Geometry of test specimen for FLC test in mm.
3. Results and Discussion
3.1. Parameters’ Effect on the Prediction of the FLC
From Equations (4) and (5), the yield criterion directly determines the stress and strain increment tensor of each iteration. Accordingly, the yield criterion has a direct impact on the prediction results. In Section 2.1.1 (Theoretical Analyses), the Hill’48 yield criterion was applied with the normal anisotropy. When the normal anisotropic coefficient was equal to one, the Von Mises yield criterion was applied. For both of the above mentioned yield criteria, the initial thickness imperfection factor was 0.999.
The predicted FLCs of AA6016 and AA5182, based on the M-K method, are shown in Figure 7. The lowest point of the FLC, predicted by the M-K method, is independent of the normal anisotropic coefficient. This outcome is consistent with the previous theoretical derivations in Section 2.1.3. When the normal anisotropic coefficient changes, there is a subtle change in the shape of the prediction curve at the left side (negative minor strain) while significant change is seen on that at the right side (positive minor strain). The curve rises with the decrease of the normal anisotropic coefficient.
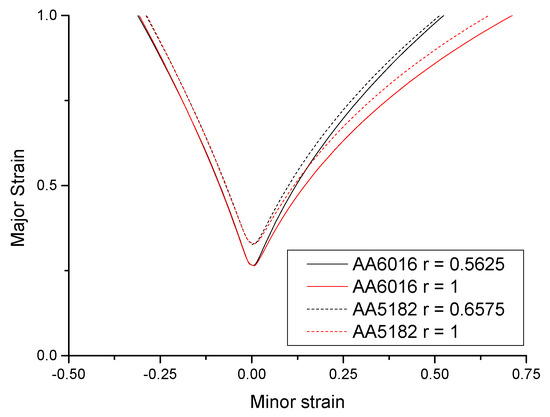
Figure 7.
The effect of hardening exponent and normal anisotropic coefficient.
From the analysis in Section 2.1.1, the predicted results, based on the M-K method, are dependent on the hardening exponent, but independent on the strength coefficient. According to Table 1, the hardening exponent of 6016 is less than that of 5182. Therefore, when the hardening exponent increases, the predicted FLC based on M-K method moves up, as shown in Figure 7.
By comparing the experimental data of AA6016 and AA5182, the predicted FLC is independent on the strength coefficient under the M-K method. The FLC tends to move up when the strength coefficient increases. In addition, the relies on the hardening exponent.
Based on previous relevant studies, the value of in the termination condition of the algorithm is in a range from 7 to 10. However, the principle of determining this value is unclear. This paper discusses the influence of the value on predicted FLC. Figure 8 reveals the ratios of equivalent strains in region B to those in region A. The values of are chosen for the purpose that the strain paths are evenly distributed throughout the forming limit diagram. The value changes slowly at the initial stage and then increases rapidly when , the equivalent strain, reaches a certain value. To research the influence of on predicted result, let denote the equivalent strain when reaches . If setting
the values of are very small under different stress paths. The ratios of to are less than 2%, which are listed in Table 2. Therefore, the iteration termination condition can be taken as . That is to say, is regarded as the termination condition of the algorithm under the M-K method.
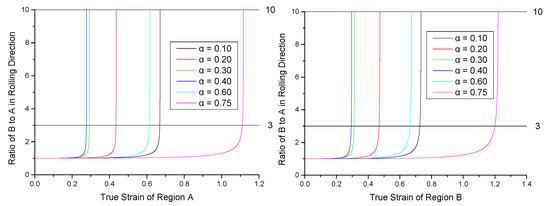
Figure 8.
The relationship between the equivalent strain and the ratio of the strain increment of zone B and A.
Table 2.
The ratio of the strain increment of zone B and A.
In addition, the predicted FLCs for AA6016 under different initial thickness imperfection factors are expressed in Figure 9. The FLC curve calculated from the M-K theory is greatly influenced by initial thickness imperfection factor. The FLC tends to move up when the initial thickness imperfection increases. In addition, the
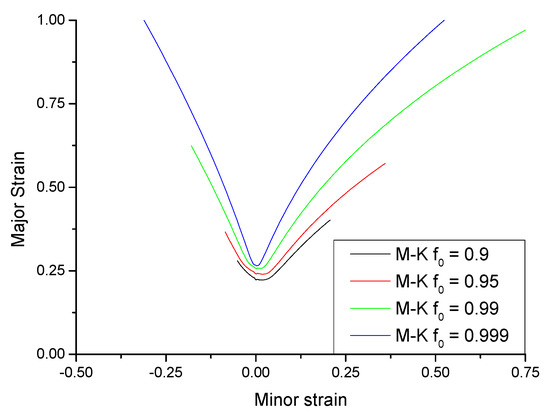
Figure 9.
Influence of initial thickness imperfection.
relies on the initial thickness imperfection factor.
3.2. Performance of the Improved M-K Model
According to the analysis in Section 2.2, both Keeler’s empirical formula and the M-K method depend on the hardening exponent. However, the M-K method depends on initial thickness imperfection factor, while Keeler’s empirical formula depends on the thickness of the sheet metal. FLC experiments are carried out to explore the relationship between these parameters and the predicted FLC’s accuracy. The experiments’ results are stated in Figure 10 and Figure 11. Meanwhile, the predicted FLCs, based on M-K method and Keeler’s empirical formula, are presented.
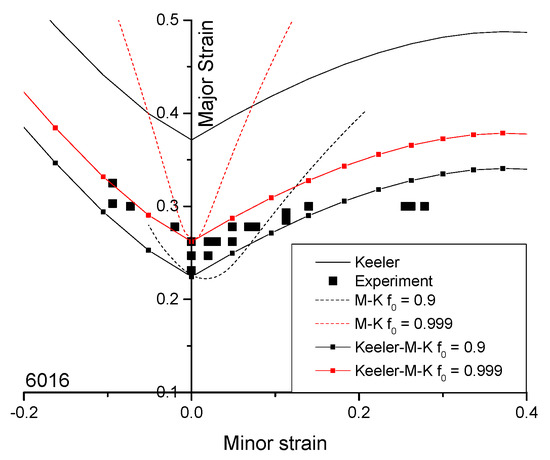
Figure 10.
FLC for AA6016.
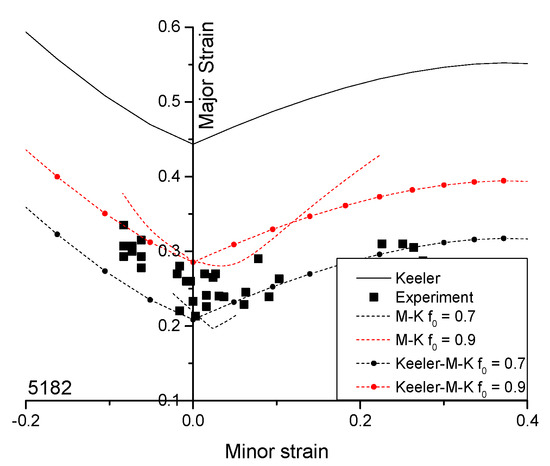
Figure 11.
FLC for AA5182.
For AA6016 and AA5182, the prediction results, based on the M-K method and Keeler’s empirical formula, respectively, are very different. Under Keeler’s empirical formula, the shape of the FLC never changes, while only the lowest point does with the corresponding parameters. On the contrary, both and the shape of the FLC under the M-K method change with the parameters. Therefore, although there are some similarities between Keeler’s empirical formula and the M-K method, their predicted results are quite different in both the lowest point of the FLC, , and the shape of the FLC.
Compared with experimental results, the value of under the M-K method, tends to be more accurate when the initial thickness imperfection factor is appropriate (for example, the thickness imperfection factor of AA6016 is between 0.9 and 0.999, while the factor of AA5182 is between 0.7 and 0.9). In contrast, the shape of the FLC under Keeler’s empirical formula is more consistent with the experimental results. Therefore, these two methods are suggested to be combined. Calculating under the M-K method, and then the FLC curve according to Equation (15), the FLCs are presented in Figure 10 and Figure 11. By comparison of the experimental data and the predicted FLC under the proposed method, the predicted FLC under the proposed new method fits the experimental data very well for both AA6016 and AA5182 when the initial thickness imperfection factor is suitable.
4. Conclusions
In this study, the theoretical derivation of the M-K method is proposed. Besides, the relationship between the M-K method and Keeler’s empirical formula is presented. Under this relation, a new method to predict FLC, which combines both of these two aspects, is proposed. Finally, the experiments about the forming limit curve of AA6016 and AA5182 validate the proposed new method. Consequently, it is concluded that:
- By comparison with the experimental data of AA6016 and AA5182, the predicted FLC is independent on the strength coefficient under the M-K method. The FLC tends to move up when the strength coefficient or the initial thickness imperfection increases. In addition, the relies on the hardening exponent and the initial thickness imperfection factor.
- Under the M-K method, is regarded as the termination condition of the algorithm.
- Although there are some similarities between Keeler’s empirical formula and the M-K method, those predicted results are quite different in both the lowest point of the FLC, , and the shape of the FLC.
- When the initial thickness imperfection factor is suitable, the predicted FLC under the proposed new method fits the results of the experiments very well for both AA6016 and AA5182.
Author Contributions
Conceptualization, X.L. and L.L.; methodology, X.L.; software, Y.C.; validation, Y.C., R.X.; formal analysis, R.X.; investigation, Y.C.; resources, X.L.; data curation, Y.C.; writing—original draft preparation, Y.C.; writing—review and editing, X.L.; visualization, Y.C.; supervision, X.L.; project administration, X.L.; funding acquisition, L.L. All authors have read and agreed to the published version of the manuscript.
Funding
This work was supported by the National Science and Technology Major Project of China (grant numbers 2014ZX04002041).
Institutional Review Board Statement
Not applicable.
Informed Consent Statement
Not applicable.
Data Availability Statement
Data is contained within the article.
Conflicts of Interest
The authors declare no conflict of interest.
References
- Guiju, Z.; Caiyuan, X. Study on lightweight design of aluminium alloy wheels. Aust. J. Mech. Eng. 2018, 16, 30–36. [Google Scholar] [CrossRef]
- Ferreira, V.; Egizabal, P.; Popov, V.; Cortazar, M.; Irazustabarrena, A.; López-Sabirón, A.; Ferreira Ferreira, G. Lightweight automotive components based on nanodiamond-reinforced aluminium alloy: A technical and environmental evaluation. Diam. Relat. Mater. 2019, 92, 174–186. [Google Scholar] [CrossRef]
- Samuel Ratna Kumar, P.S.; Edwin Sudhagar, P.; John Alexis, S.; Subramani, M. Vibration Study on Aluminium Alloy 5083 Composite Reinforced with Montmorillonite. Trans. Indian Inst. Met. 2019, 72, 2449–2456. [Google Scholar] [CrossRef]
- Gao-shan, M.; Min, W.; Xiang-dong, W. Theoretical prediction of FLDs for Al-Li alloy at elevated temperature based on M-K model. Chin. J. Nonferrous Met. 2008, 18, 980–984. [Google Scholar]
- Mohammed, B.; Park, T.; Kim, H.; Pourboghrat, F.; Esmaeilpour, R. The Forming Limit Curve for Multiphase Advanced High Strength Steels Based on Crystal Plasticity Finite Element Modeling. Mater. Sci. Eng. A 2018, 725, 250–266. [Google Scholar] [CrossRef]
- Wang, H.; Yan, Y.; Han, F.; Wan, M. Experimental and theoretical investigations of the forming limit of 5754O aluminum alloy sheet under different combined loading paths. Int. J. Mech. Sci. 2017, 133, 147–166. [Google Scholar] [CrossRef]
- Swift, H.W. Plastic instability under plane stress. J. Mech. Phys. Solids 1952, 1, 1–18. [Google Scholar] [CrossRef]
- Hill, R. On discontinuous plastic states, with special reference to localized necking in thin sheets. J. Mech. Phys. Solids 1952, 1, 19–30. [Google Scholar] [CrossRef]
- Manopulo, N.; Hora, P.; Peters, P.; Gorji, M.; Barlat, F. An extended Modified Maximum Force Criterion for the prediction of localized necking under non-proportional loading. Int. J. Plast. 2015, 75, 189–203. [Google Scholar] [CrossRef]
- Marciniak, Z.; Kuczyński, K. Limit strains in the processes of stretch-forming sheet metal. Int. J. Mech. Sci. 1967, 9, 609–620. [Google Scholar] [CrossRef]
- LI, X.-q.; DONG, H.-r.; WANG, H.-b.; GUO, G.-q.; LI, D.-s. Effect of strain rate difference between inside and outside groove in M−K model on prediction of forming limit curve of Ti6Al4V at elevated temperatures. Trans. Nonferrous Met. Soc. China 2020, 30, 405–416. [Google Scholar] [CrossRef]
- Ghazanfari, A.; Assempour, A. A New Calibration Method for FLCs in the M-K Frame-Work. Adv. Mater. Res. 2012, 341–342, 426–431. [Google Scholar] [CrossRef]
- Haiyan, Y.; Yunkai, G. Study on Forming Limit Diagram for Transformation—Induced Plasticity Sheet Steel Based on M-K Model. China Mech. Eng. 2007, 18, 109–113. [Google Scholar]
- Penga, L.F.; Xua, Z.T.; Fubc, M.W.; Laia, X.M. Forming limit of sheet metals in meso-scale plastic forming by using different failure criteria. Int. J. Mech. Sci. 2017, 120, 190–203. [Google Scholar] [CrossRef]
- Keeler, S. Plastic Instability and Fracture in Sheets Stretched over Rigid Punches; Massachusetts Institute of Technology: Cambridge, MA, USA, 1961. [Google Scholar]
- Hill, R. A Theory of the Yielding and Plastic Flow of Anisotropic Metals. Proc. R. Soc. Lond. 1948, 193, 281–297. [Google Scholar] [CrossRef]
- Standardization Administration of China. Metallic Materials—Tensile Testing—Part 1: Method of Test at Room Temperature; Standardization Administration of China: Beijing, China, 2010. [Google Scholar]
- Standardization Administration of China. Sheet Metal Formability and Test Methods—Part 8: Guidelines for the Determination of Forming-Limit Diagrams; Standardization Administration of China: Beijing, China, 2008. [Google Scholar]


Publisher’s Note: MDPI stays neutral with regard to jurisdictional claims in published maps and institutional affiliations. |
© 2021 by the authors. Licensee MDPI, Basel, Switzerland. This article is an open access article distributed under the terms and conditions of the Creative Commons Attribution (CC BY) license (http://creativecommons.org/licenses/by/4.0/).