Cleavage Stress Producing Notch-Induced Anisotropic Fracture and Crack Path Deflection in Cold Drawn Pearlitic Steel
Abstract
1. Introduction
2. Experimental Program
2.1. Materials Used
2.2. Types of Samples
- Geometry A: R/D = 0.03, C/D = 0.10
- Geometry B: R/D = 0.05, C/D = 0.30
- Geometry C: R/D = 0.40, C/D = 0.10
- Geometry D: R/D = 0.40, C/D = 0.30
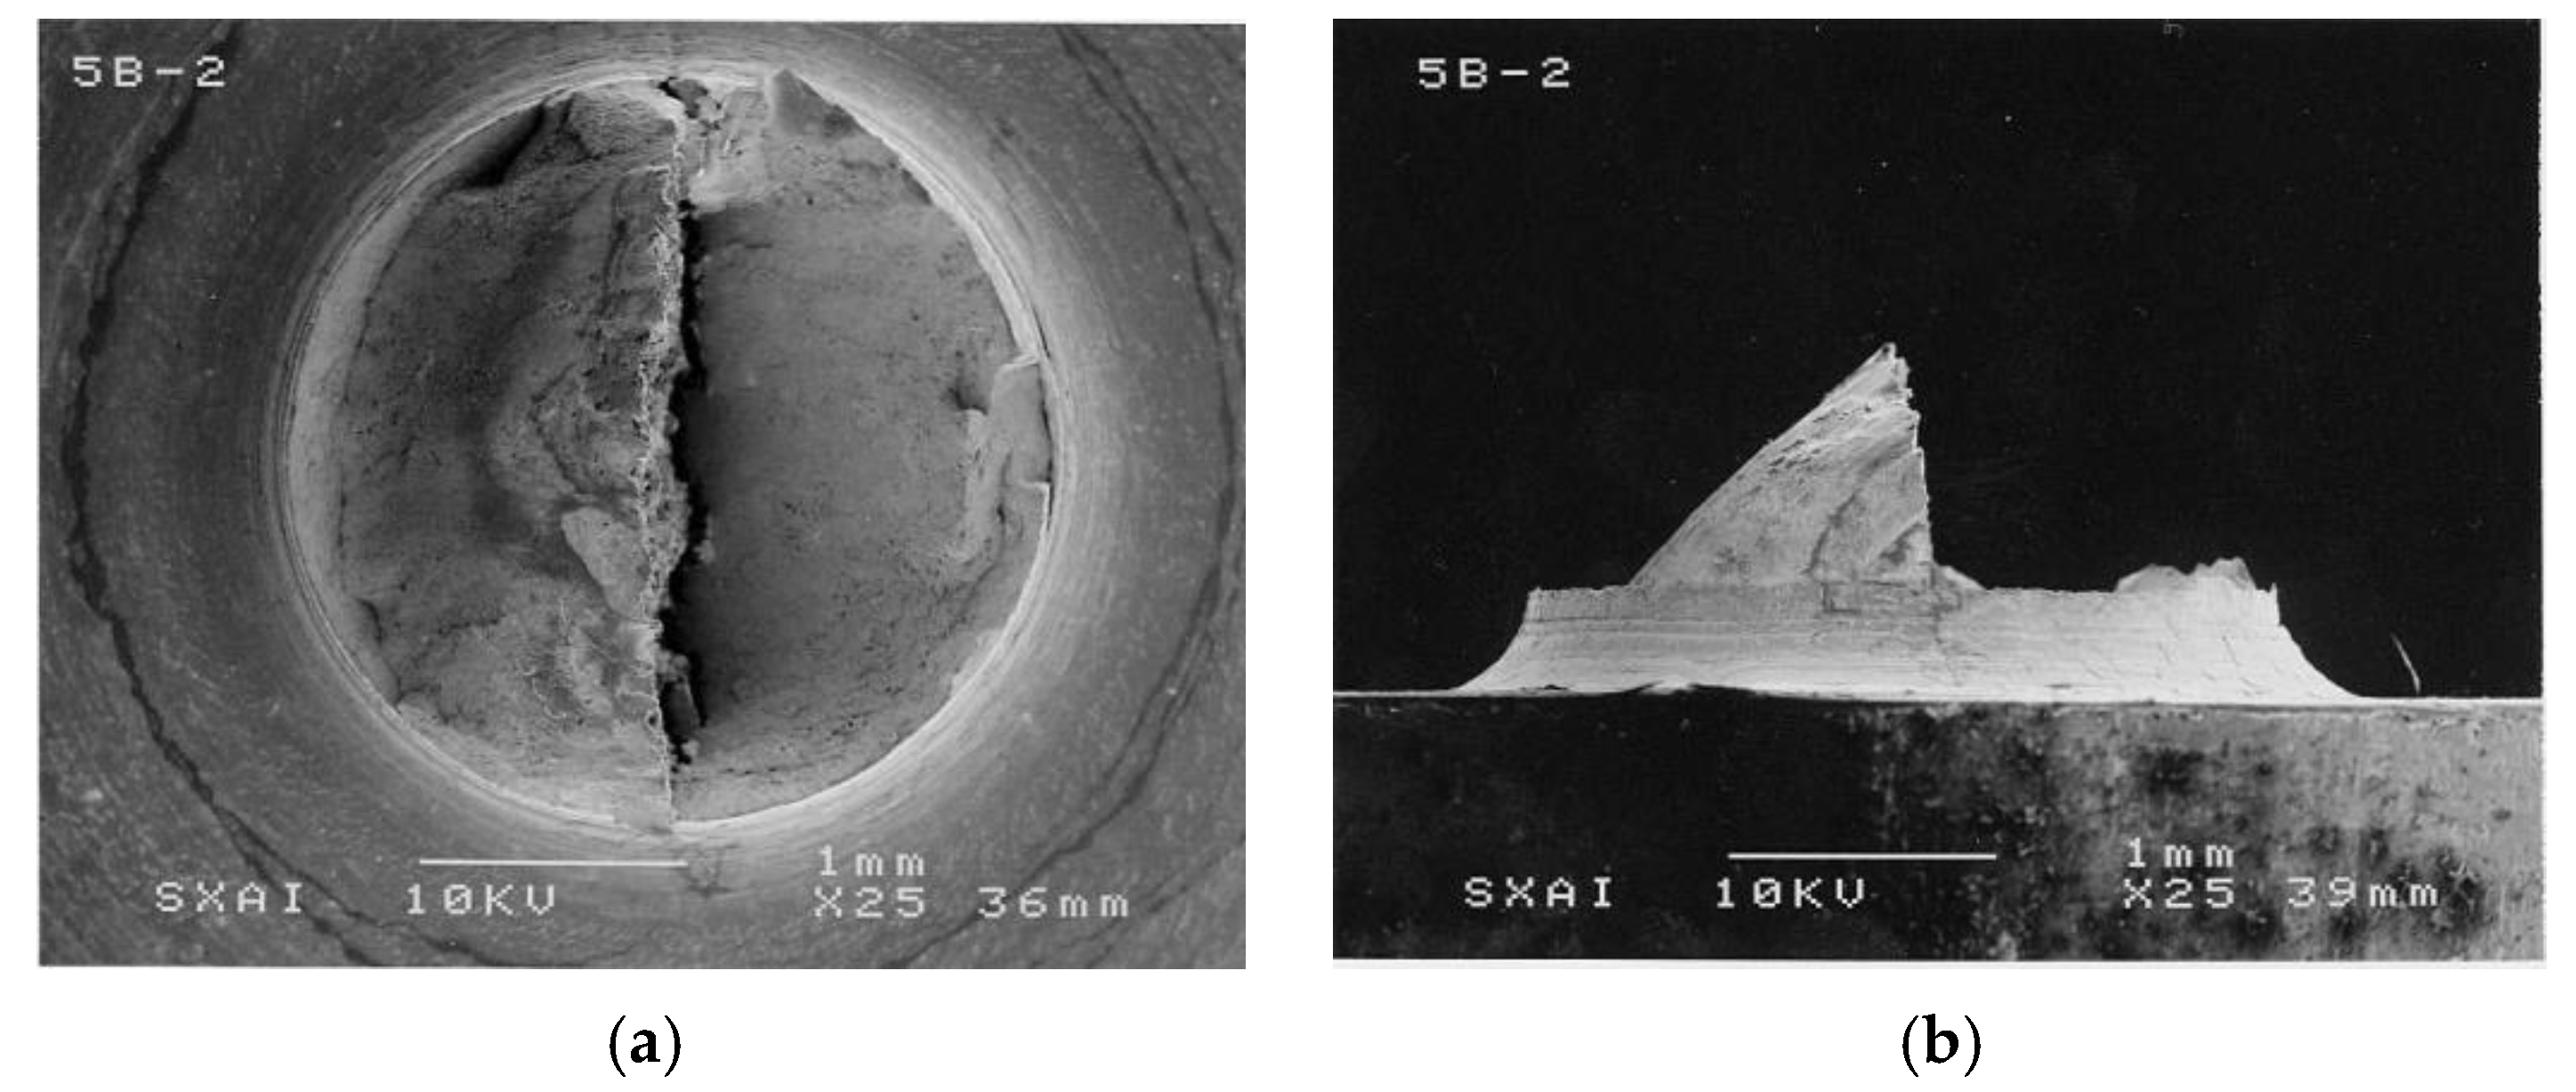
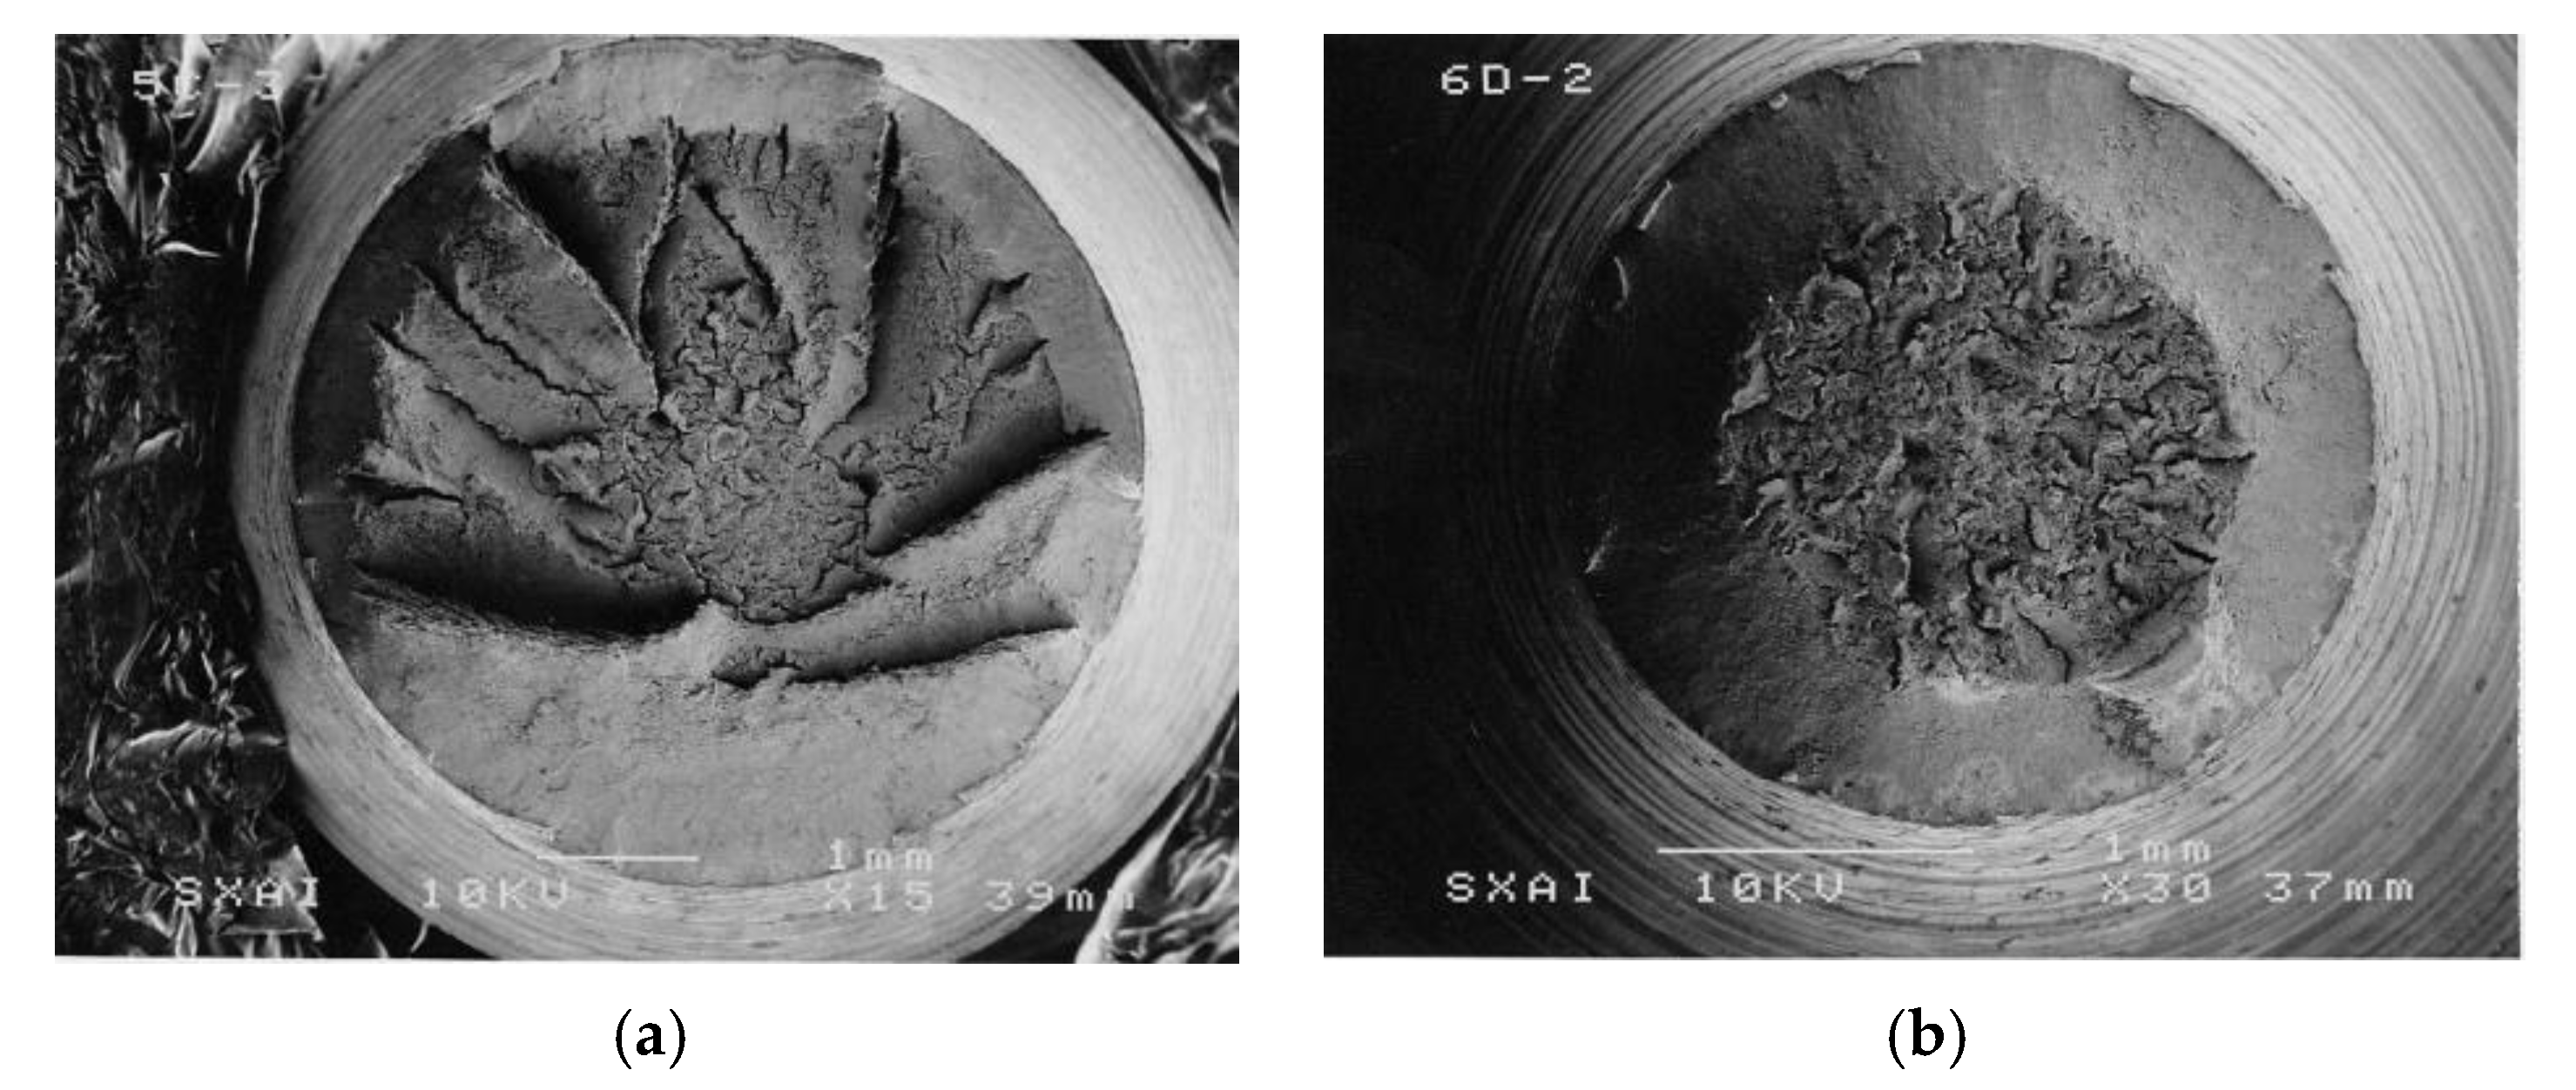
2.3. Fracture Tests and Fractographic Analysis
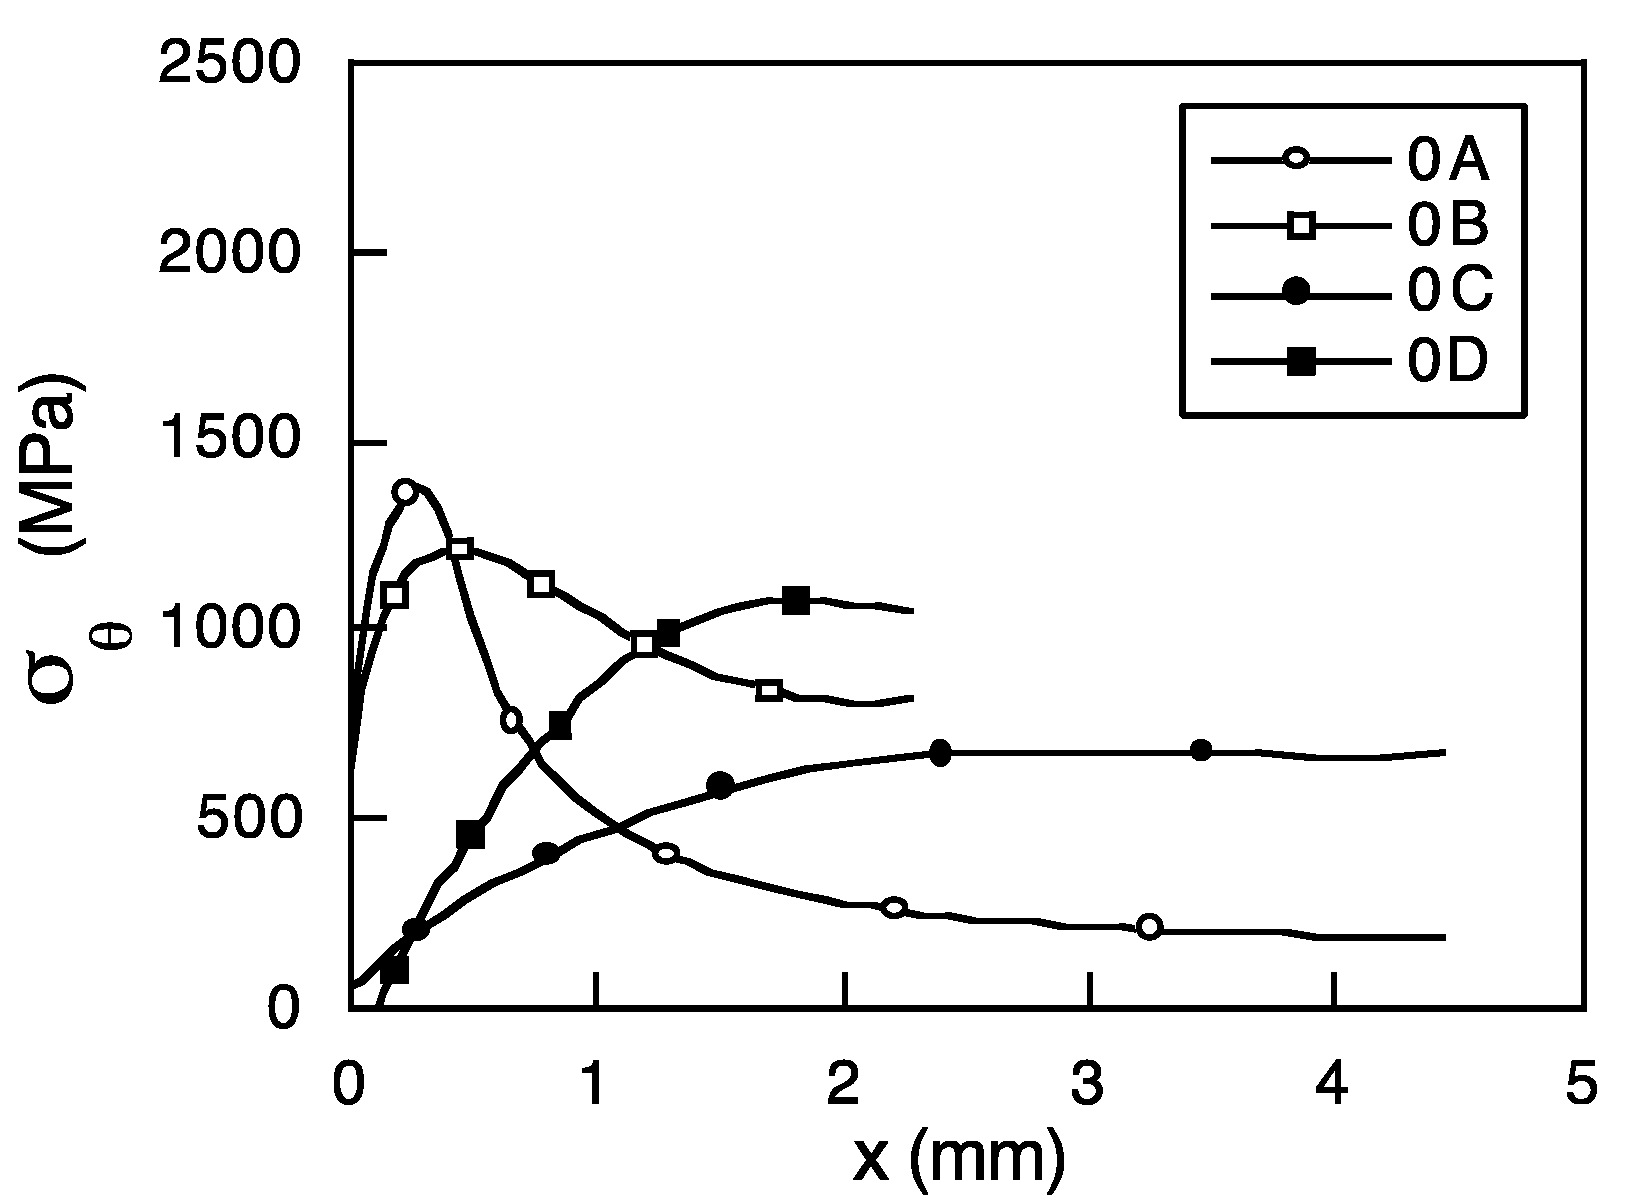
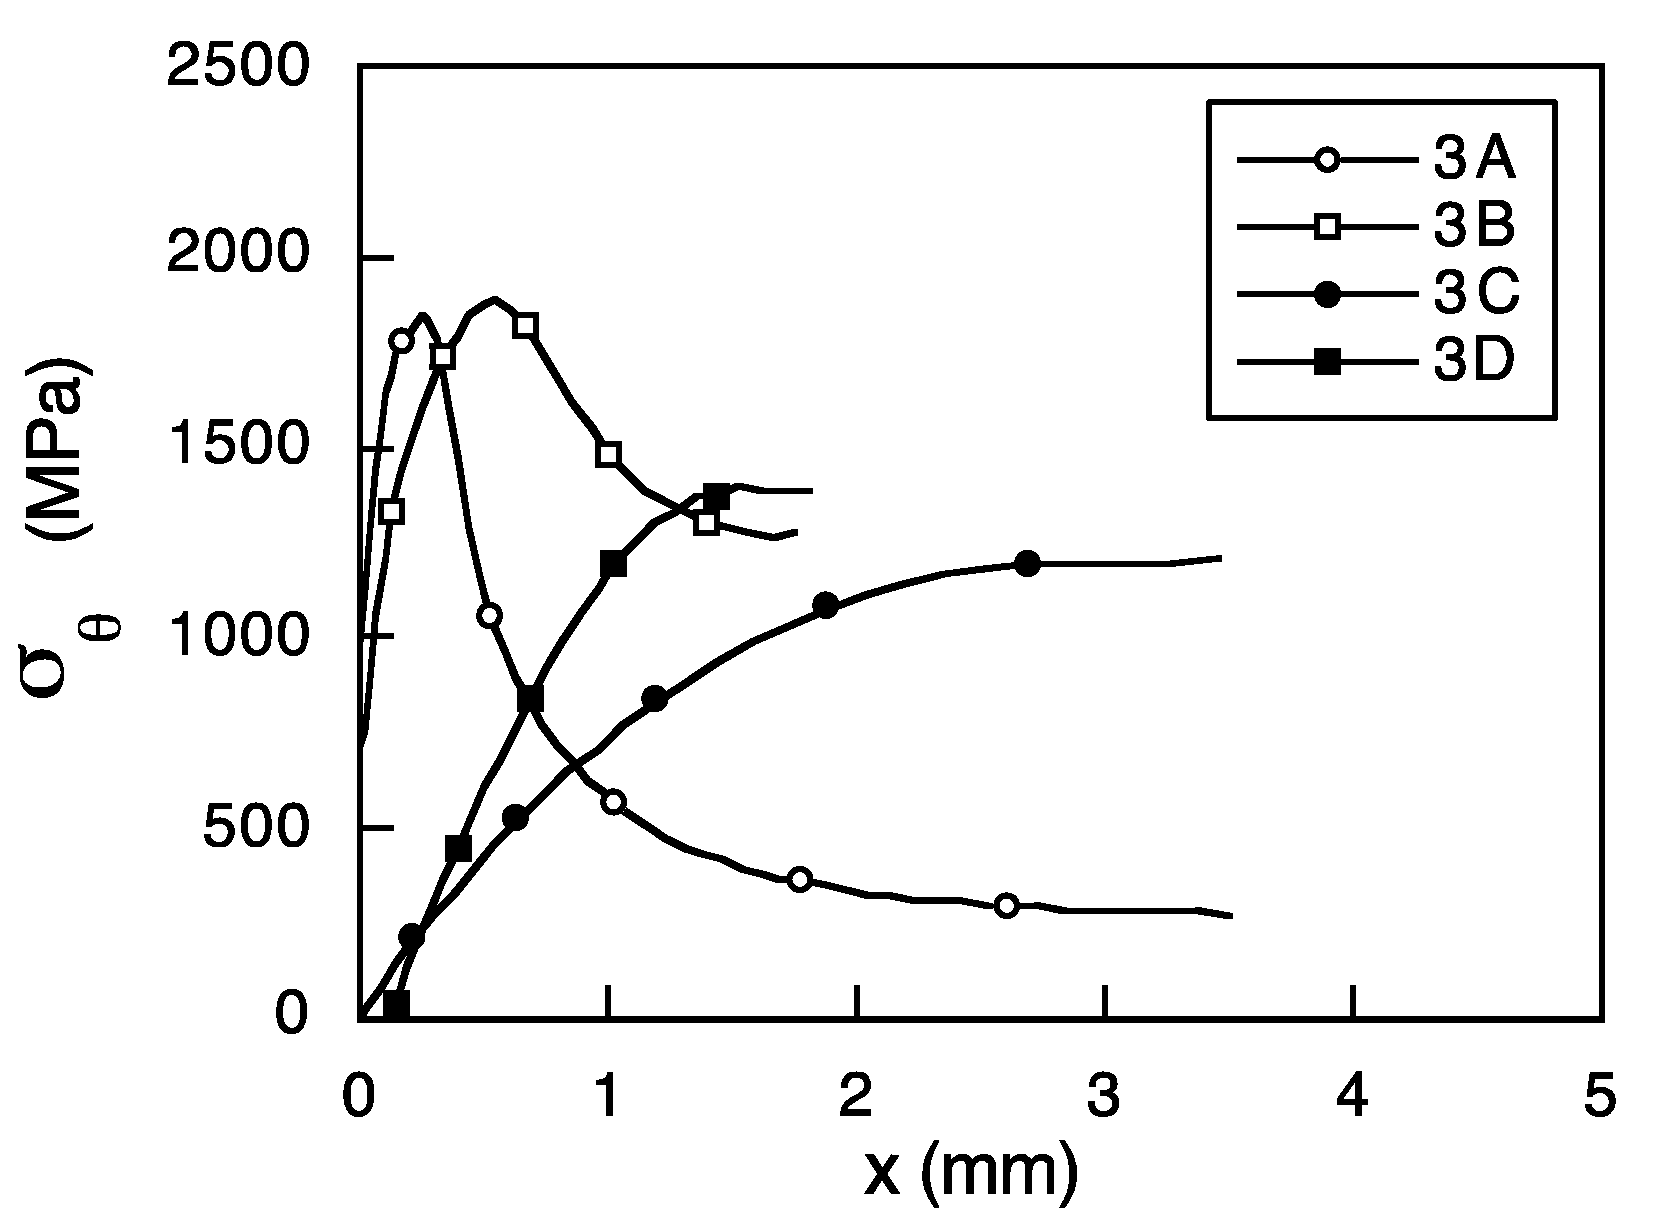
2.4. Computation of Internal Variables
3. Numerical Results
4. Discussion: Micromechanical Model
5. Conclusions
Author Contributions
Funding
Institutional Review Board Statement
Informed Consent Statement
Data Availability Statement
Conflicts of Interest
References
- Borchers, C.; Kirchheim, R. Cold-drawn pearlitic steel wires. Prog. Mater. Sci. 2016, 82, 405–444. [Google Scholar] [CrossRef]
- Toribio, J. Structural integrity of progressively cold-drawn pearlitic steels: From Raffaello Sanzio to Vincent van Gogh. Procedia Struct. Integr. 2017, 3, 3–10. [Google Scholar] [CrossRef]
- Gil-Sevillano, J. Cleavage-limited maximum strength of work-hardened B.C.C. polycrystals. Acta Metall. 1986, 34, 1473–1485. [Google Scholar]
- Toribio, J.; Ayaso, F.J. Anisotropic fracture behavior of cold drawn steel: A materials science approach. Mater. Sci. Eng. A 2003, 343, 265–272. [Google Scholar] [CrossRef]
- He, Y.; Xiang, S.; Shi, W.; Liu, J.; Ji, X.; Yu, W. Effect of microstructure evolution on anisotropic fracture behaviors of cold drawing pearlitic steels. Mater. Sci. Eng. A 2017, 683, 153–163. [Google Scholar] [CrossRef]
- Toribio, J. Anisotropy of hydrogen embrittlement in cold drawn pearlitic steel: A Tribute to Mantegna. Procedia Struct. Integr. 2020, 28, 2438–2443. [Google Scholar] [CrossRef]
- Toribio, J.; Ayaso, F.J. Image analysis of exfoliation fracture in cold drawn steel. Mater. Sci. Eng. A 2004, 387–389, 438–441. [Google Scholar] [CrossRef]
- Tanaka, M.; Saito, H.; Yasumaru, M.; Higashida, K. Nature of delamination cracks in pearlitic steels. Scripta Mater. 2016, 112, 32–36. [Google Scholar] [CrossRef]
- Embury, J.D.; Fisher, R.M. The structure and properties of drawn pearlite. Acta Metall. 1966, 14, 147–159. [Google Scholar] [CrossRef]
- Langford, G. Deformation of Pearlite. Metall. Trans. A 1977, 8, 861–875. [Google Scholar] [CrossRef]
- Ridley, N. A review of the data on the interlamellar spacing of pearlite. Metall. Trans. A 1984, 15, 1019–1036. [Google Scholar] [CrossRef]
- Languillaume, J.; Kapelski, G.; Baudelet, B. Cementite dissolution in heavily cold drawn pearlitic steel wires. Acta Mater. 1997, 45, 1201–1212. [Google Scholar] [CrossRef]
- Zelin, M. Microstructure evolution in pearlitic steels during wire drawing. Acta Mater. 2002, 50, 4431–4447. [Google Scholar] [CrossRef]
- Hall, E.O. The deformation and ageing of mild steel: III Discussion of results. Proc. Phys. Soc. Sec. B 1951, 64, 747–753. [Google Scholar] [CrossRef]
- Petch, N.J. The cleavage strength of polycrystals. J. Iron Steel Inst. 1953, 174, 25–30. [Google Scholar]
- Choi, H.C.; Park, K.T. The effect of carbon content on the Hall-Petch parameter in the cold drawn hypereutectoid steels. Scripta Mater. 1996, 34, 857–862. [Google Scholar] [CrossRef]
- Nam, W.J.; Bae, C.M.; Lee, C.S. Effect of carbon content on the Hall-Petch parameter in cold drawn pearlitic steel wires. J. Mater. Sci. 2002, 37, 2243–2249. [Google Scholar] [CrossRef]
- Toribio, J. Relationship between microstructure and strength in eutectoid steels. Mater. Sci. Eng. A 2004, 387–389, 227–230. [Google Scholar] [CrossRef]
- Toribio, J.; González, B.; Matos, J.C. Microstructure and mechanical properties in progressively drawn pearlitic steel. Mater. Trans. 2014, 55, 93–98. [Google Scholar] [CrossRef]
- Toribio, J.; González, B.; Matos, J.C. Cleavage stress required to produce fracture path deflection in cold-drawn prestressing steel wires. Int. J. Fract. 2007, 144, 189–196. [Google Scholar] [CrossRef]
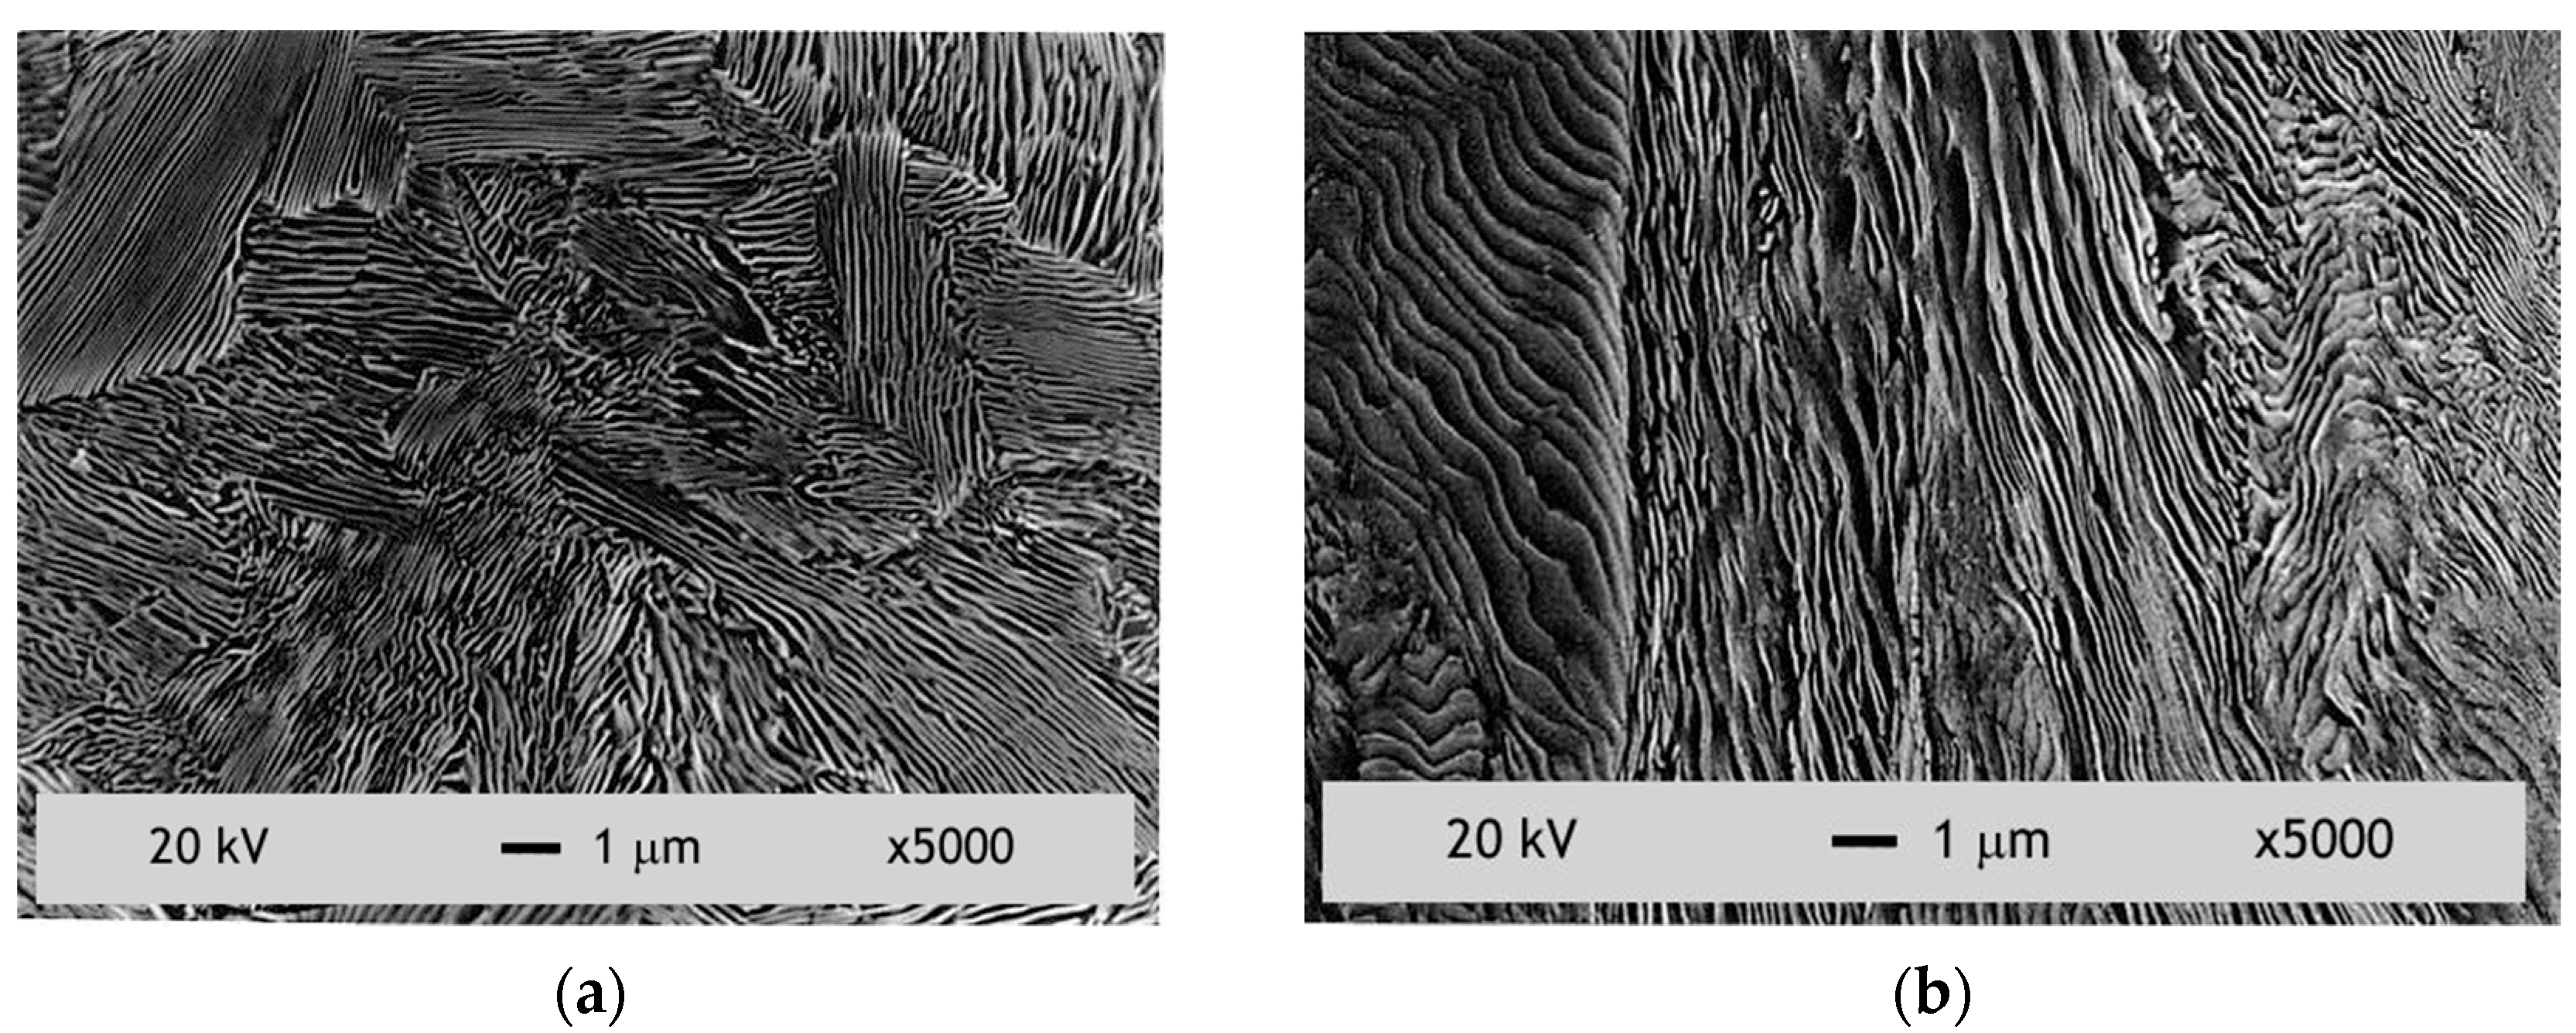
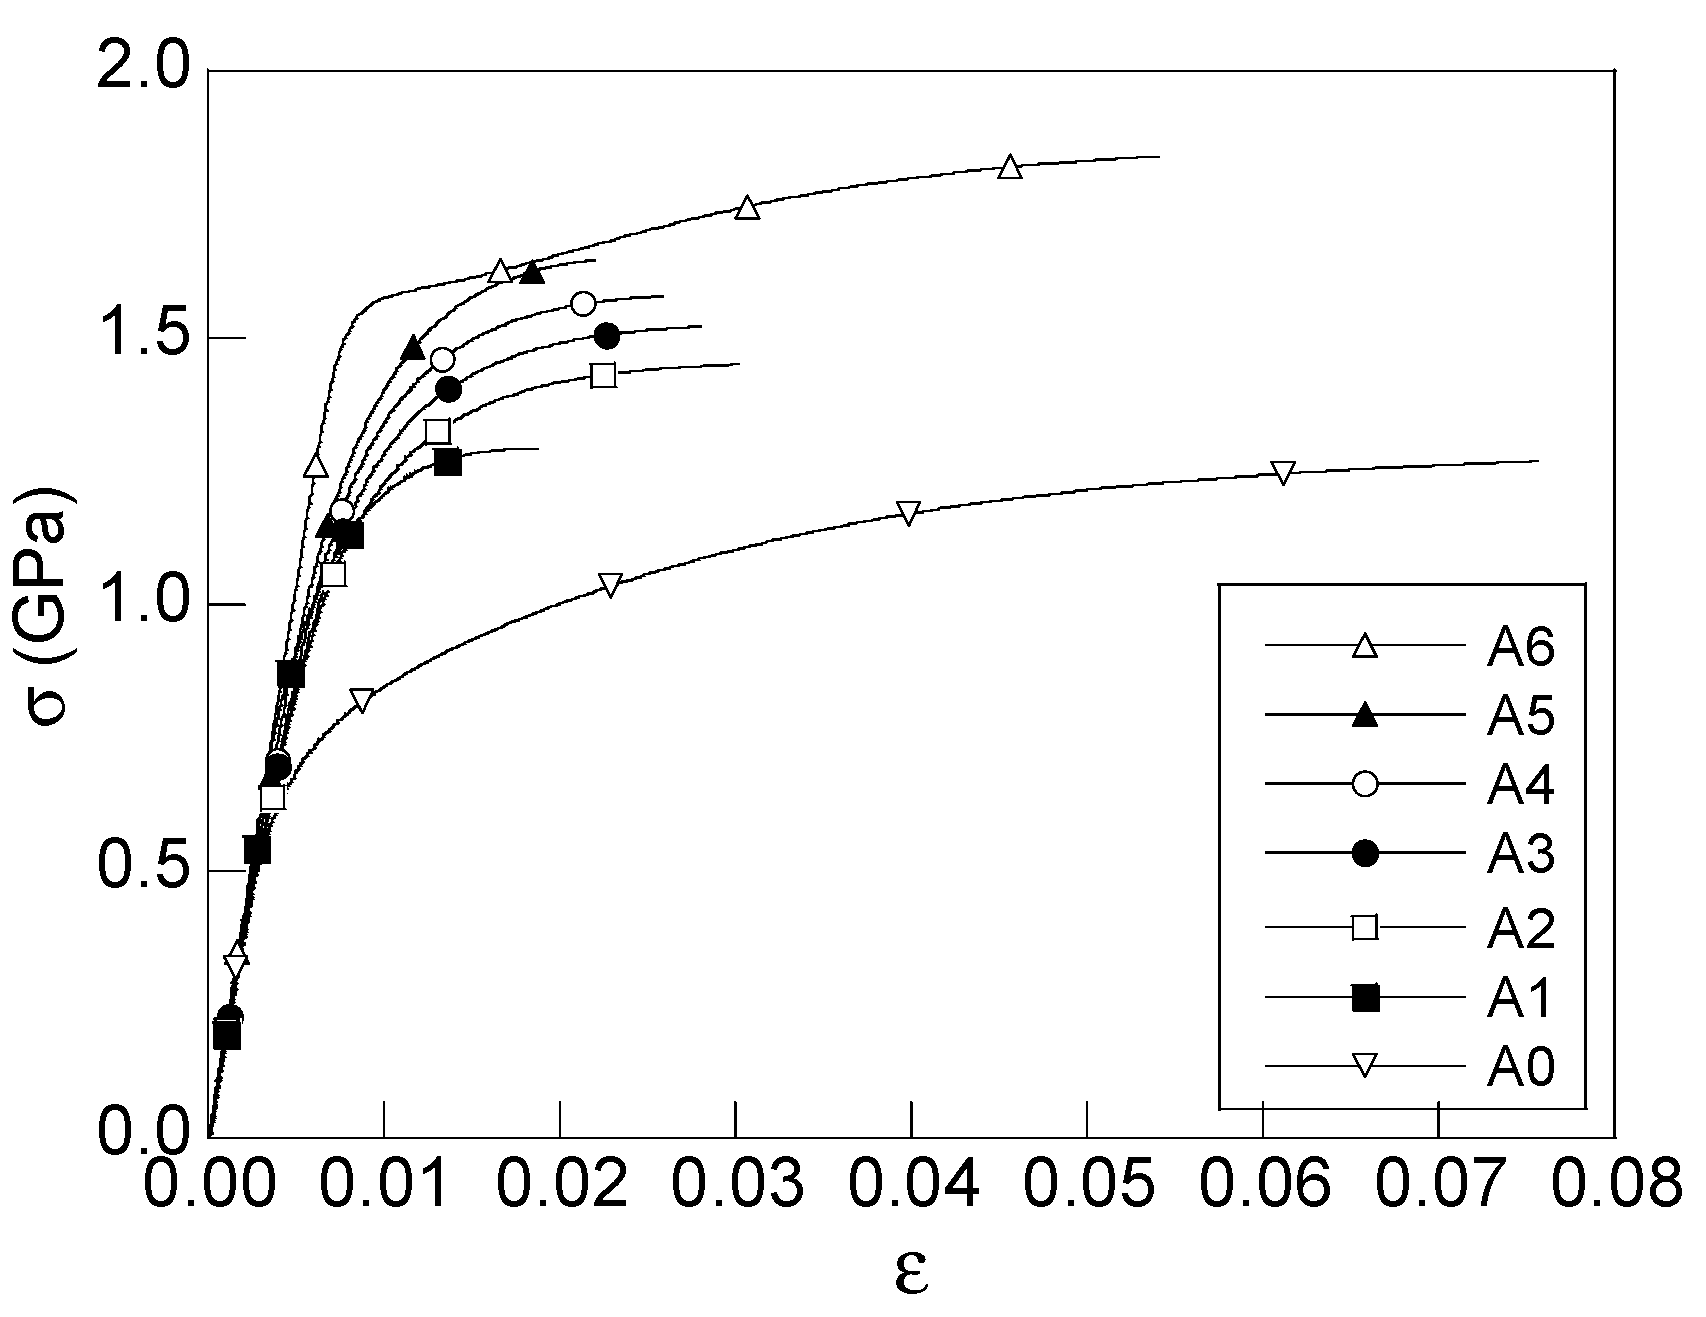

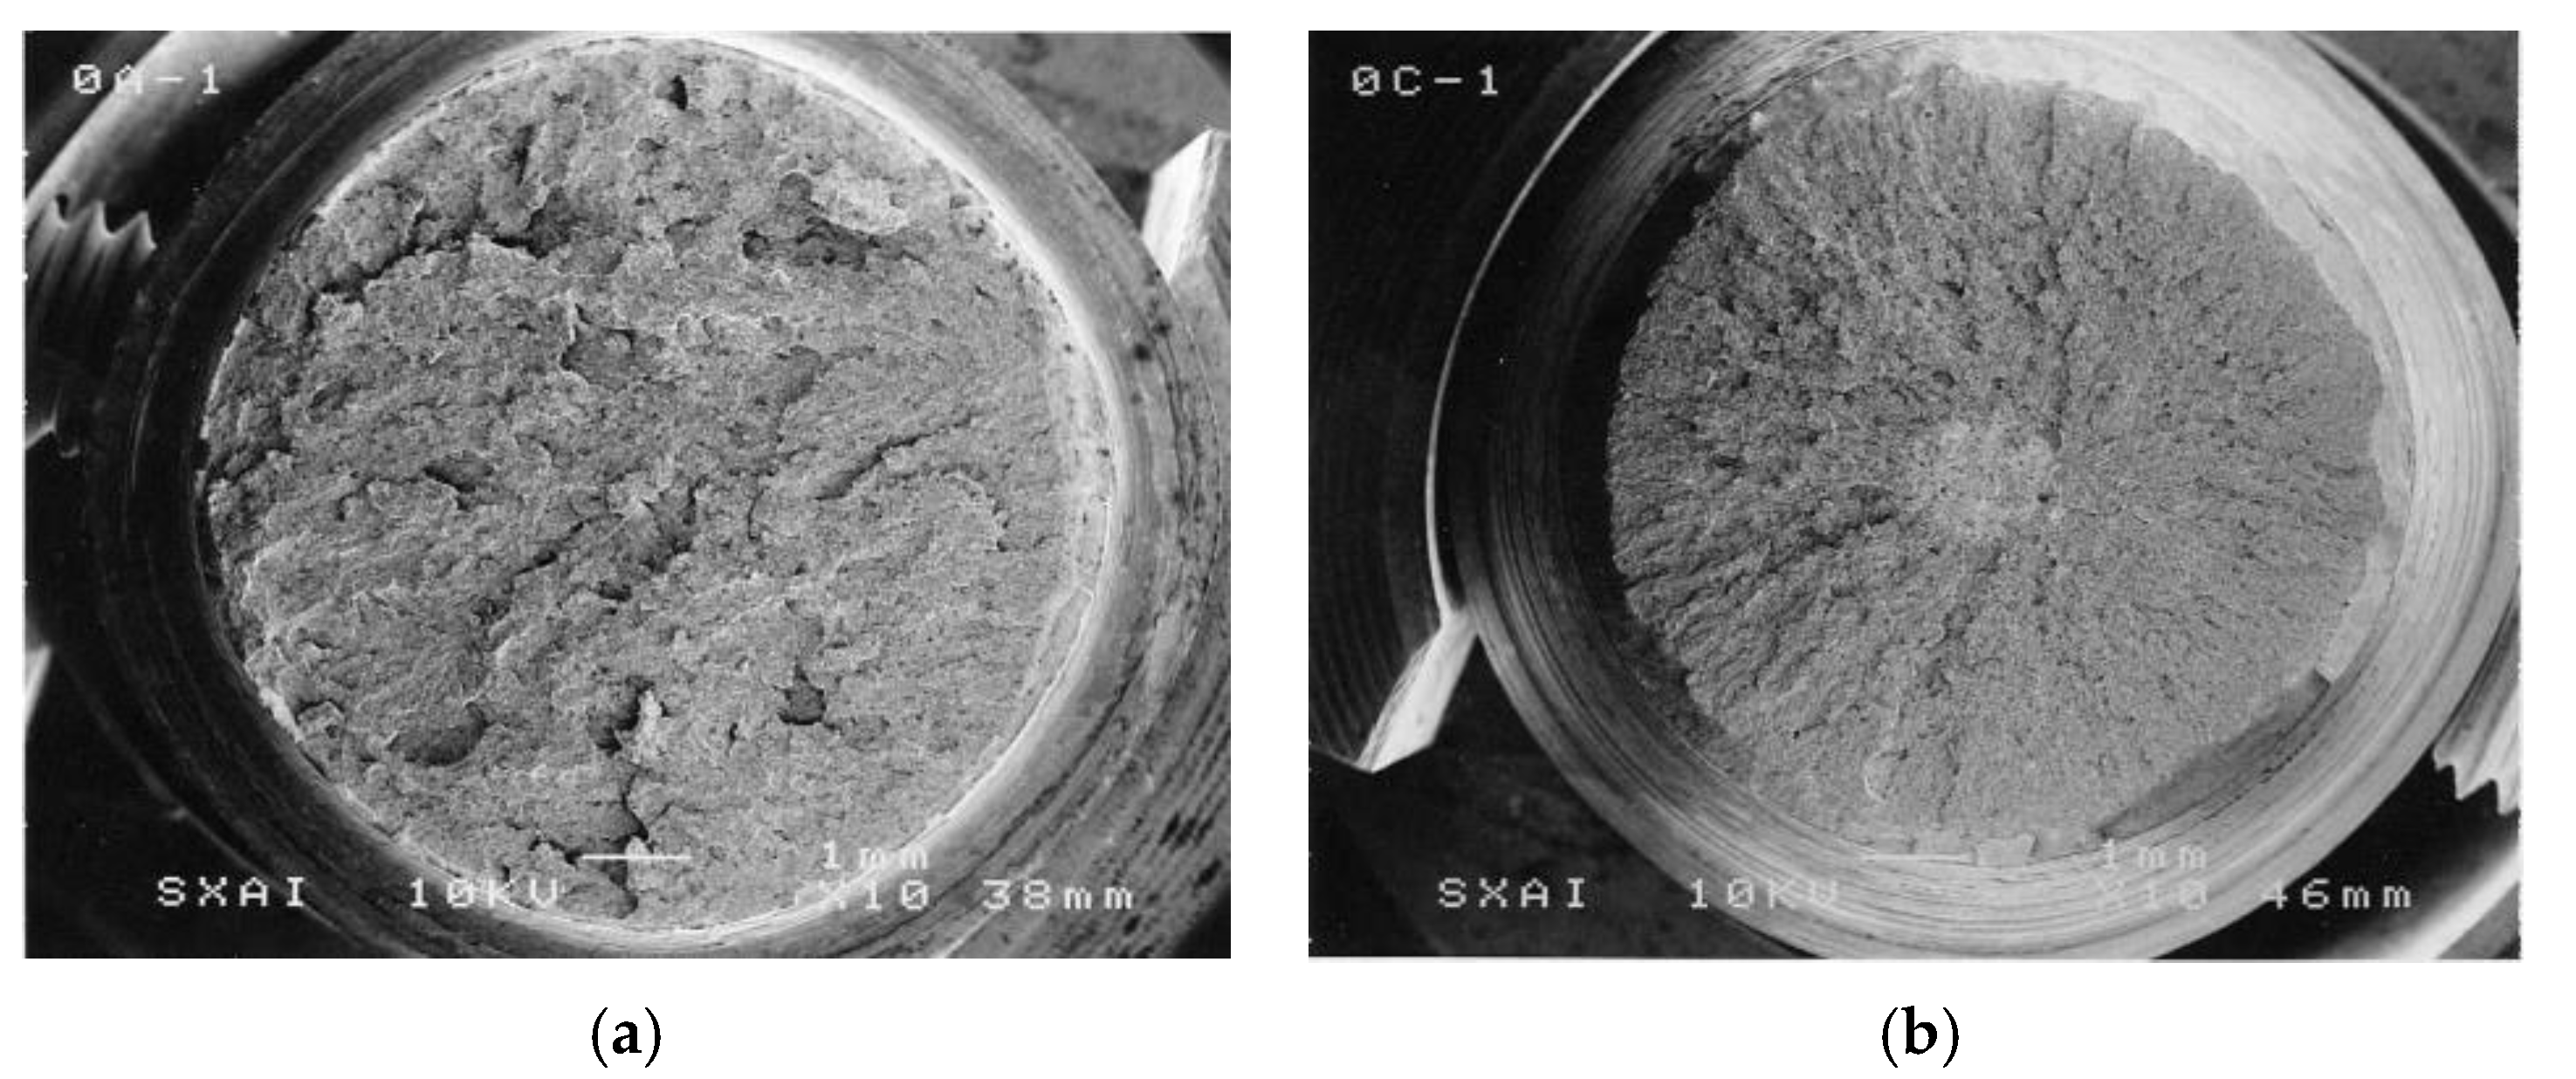
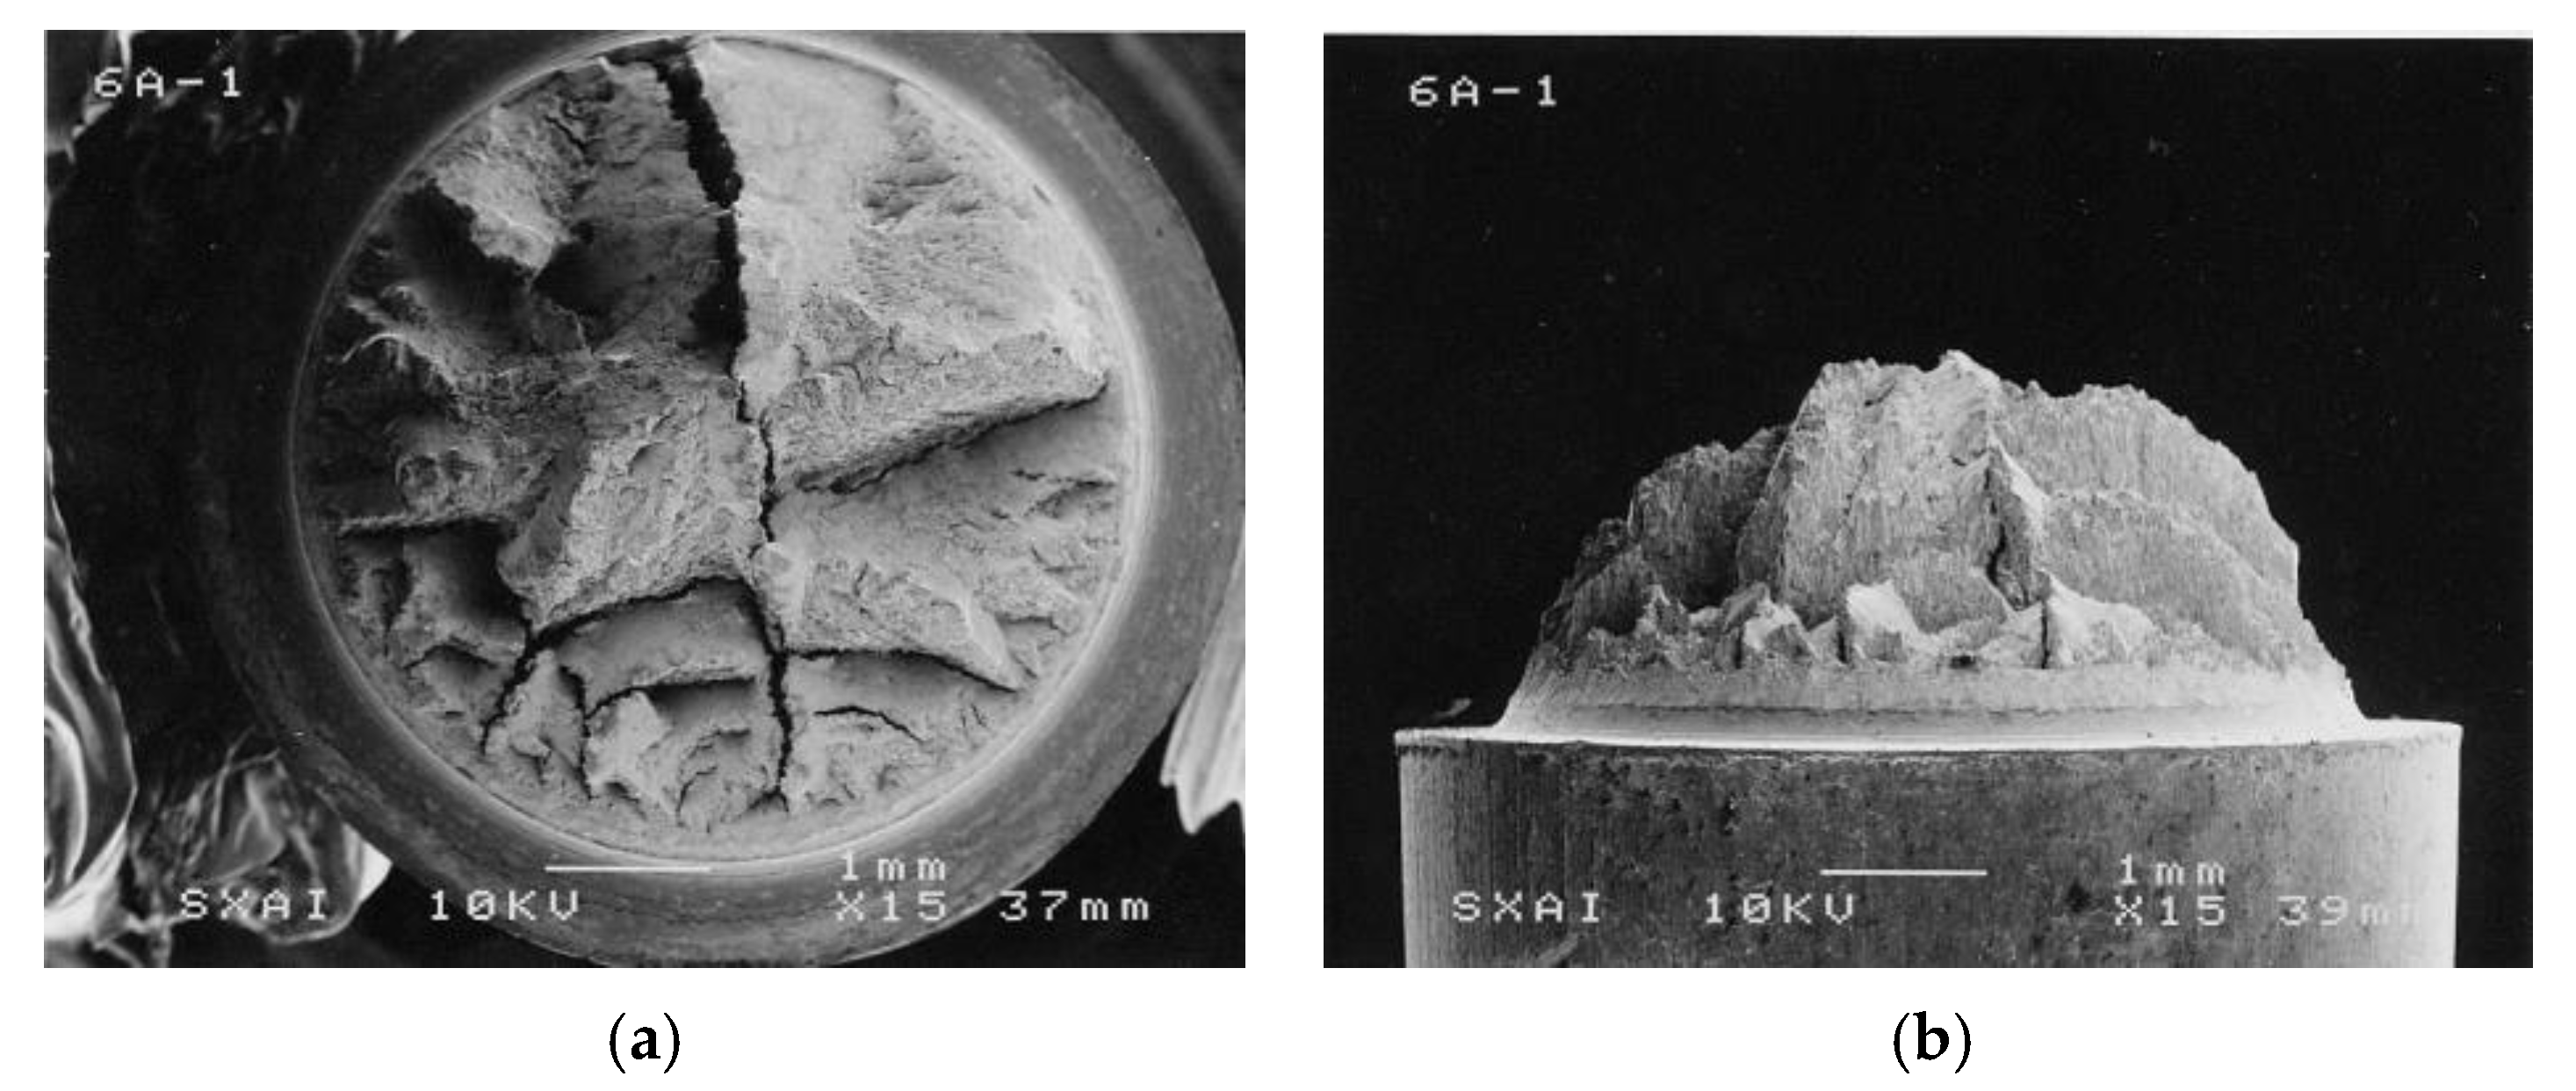



| C | Mn | Si | P | S | Al | Cr | V |
|---|---|---|---|---|---|---|---|
| 0.80 | 0.69 | 0.23 | 0.012 | 0.009 | 0.004 | 0.265 | 0.06 |
| Steel | D (mm) | Di/D0 | εPcum | E (GPa) | σY (GPa) | σR (GPa) |
|---|---|---|---|---|---|---|
| A0 | 12.00 | 1 | 0 | 197.4 | 0.686 | 1.175 |
| A1 | 10.80 | 0.9 | 0.21 | 201.4 | 1.100 | 1.294 |
| A2 | 9.75 | 0.82 | 0.42 | 203.5 | 1.157 | 1.347 |
| A3 | 8.90 | 0.74 | 0.60 | 197.3 | 1.212 | 1.509 |
| A4 | 8.15 | 0.68 | 0.77 | 196.7 | 1.239 | 1.521 |
| A5 | 7.50 | 0.63 | 0.94 | 202.4 | 1.271 | 1.526 |
| A6 | 7.00 | 0.58 | 1.08 | 198.8 | 1.506 | 1.762 |
Publisher’s Note: MDPI stays neutral with regard to jurisdictional claims in published maps and institutional affiliations. |
© 2021 by the authors. Licensee MDPI, Basel, Switzerland. This article is an open access article distributed under the terms and conditions of the Creative Commons Attribution (CC BY) license (http://creativecommons.org/licenses/by/4.0/).
Share and Cite
Toribio, J.; Ayaso, F.-J. Cleavage Stress Producing Notch-Induced Anisotropic Fracture and Crack Path Deflection in Cold Drawn Pearlitic Steel. Metals 2021, 11, 451. https://doi.org/10.3390/met11030451
Toribio J, Ayaso F-J. Cleavage Stress Producing Notch-Induced Anisotropic Fracture and Crack Path Deflection in Cold Drawn Pearlitic Steel. Metals. 2021; 11(3):451. https://doi.org/10.3390/met11030451
Chicago/Turabian StyleToribio, Jesús, and Francisco-Javier Ayaso. 2021. "Cleavage Stress Producing Notch-Induced Anisotropic Fracture and Crack Path Deflection in Cold Drawn Pearlitic Steel" Metals 11, no. 3: 451. https://doi.org/10.3390/met11030451
APA StyleToribio, J., & Ayaso, F.-J. (2021). Cleavage Stress Producing Notch-Induced Anisotropic Fracture and Crack Path Deflection in Cold Drawn Pearlitic Steel. Metals, 11(3), 451. https://doi.org/10.3390/met11030451


