Article

Quantitative Correlation and Control Strategy for Element Content Fluctuation along Casting Direction in Central Area of Continuous Casting Billet

1
College of Materials Science and Engineering, Chongqing University, Chongqing 400044, China
2
Chongqing Key Laboratory of Vanadium-Titannium Metallurgy and New Materials, Chongqing University, Chongqing 400044, China
*
Author to whom correspondence should be addressed.
Metals 2021, 11(3), 452; https://doi.org/10.3390/met11030452
Submission received: 19 February 2021 / Revised: 4 March 2021 / Accepted: 8 March 2021 / Published: 9 March 2021
(This article belongs to the Section Metal Casting, Forming and Heat Treatment)

Abstract

:
The statistical correlation was applied to analyze the specific and quantitative correlation relationship between the solidification structure and central segregation along the casting direction in carbon steel billet. On this basis, the segregation formation mechanism of the solute element and related control strategy were investigated. It is found that the equiaxed crystal zone fluctuation along the casting direction determines the fluctuation degree of central segregation. At the same time, the central segregation at a certain position is mostly affected by the equiaxed crystal zone width at the hysteretic position. Moreover, the casting speed can influence the columnar to equiaxed transition (CET) fluctuation along the casting direction by affecting the flow of molten steel in the billet. Overall, the segregation mechanism of solute elements along the casting direction can be summarized into two aspects: First, with the growth of columnar crystals in the initial stage, the segregated solutes are continuously enriched and distributed in the equiaxed crystal zone after CET. The fluctuation of the equiaxed crystal zone will affect the distribution of the enriched solute in the billet and cause the fluctuation of the central segregation. Second, due to the solidification shrinkage at the end of solidification, the solute-enriched liquid phase at the hysteretic position is pumped to the solidification endpoint and forms the central V-shaped segregation. Meanwhile, the stable solidification structure (columnar crystal length or equiaxed crystal zone width) along the casting direction and control measures preceded equiaxed crystal zone formation are beneficial to reduce the central V-shaped segregation.

1. Introduction

In the era of rapid industrial development, steel products, especially high-end steel products, play an essential role in national economic development and state construction. Nowadays, continuous casting (CC) is a major production process of high-end steel products in the world due to higher efficiency and lower energy consumption. However, central carbon segregation along the casting direction occurs due to the carbon solubility difference between the liquid phase and solid phase, which can induce tremendous quality control issues in high-end steel products [1,2]. Moreover, this kind of defect is difficult to eliminate in reheating and rolling processes and will be left into the subsequent products, which will affect the tensile yield strength and low-temperature impact toughness [3,4]. Therefore, the control of central segregation along the casting direction is important to improve the quality stability of high-end steel products.
To date, many researches have been proposed to control the central segregation of the billets and various methods have been applied to mitigate the central segregation during the CC process, such as adjusting process parameters [5], applying electromagnetic stirring [6,7], or dynamic soft reduction technology [8,9]. The above methods can reduce the central segregation defect to a certain extent and improve the internal quality of billets by changing the solidification structure characteristics. Nevertheless, previous researches mainly focused on the observation of central segregation defect on a certain cross section or only described the qualitative relationship between central segregation and solidification structure which characteristic is very important and basic for the defect formation process. The specific description for the effect of solidification structure on central segregation and element content fluctuation along the casting direction is rare. On the other hand, the internal central segregation of steel billets always means the fluctuating distribution of the carbon element along the casting direction [10,11], which is an essential factor affecting the quality stability of billets and the properties of final products. Guo et al. introduced the stochastic mathematical method to predict the maximum value of carbon element content along the casting direction and quantitatively evaluate the central segregation degree based on the fluctuation of carbon distribution in the billets [12]. However, the cause of element fluctuation in billets, i.e., the formation mechanism of uneven central segregation, is still worth investigating. Traditionally, the relative movement or flow of segregated liquid during solidification is the main cause of macrosegregation [13]. With the solidification process, the carbon element is rejected into the liquid phase, resulting in a continuous enrichment of carbon element in liquid. This high concentration of carbon element in the liquid phase results in the occurrence of segregation defects. However, Flemings [14] indicated that it is still unclear how the solute-enriched liquid phase flow affects the final central segregation and the specific influence of the solidification structure on the central segregation formation, as well as the control strategy for element content fluctuation, are also rarely reported. There is still work to be done on the basic segregation formation mechanism and control strategy.
In this paper, SCM 440 (S: Steel, C: Cr, M: Mo) cold heading steel was selected to represent the high-end carbon steel. During the cold heading process, SCM 440 wire rod will crack because of the uneven low-temperature impact toughness caused by the residues central segregation defect along the casting direction. Hence, it is of great significance to investigate and control the central segregation to improve the quality and utilization ratio of the SCM 440 wire rod. First, the statistical correlation was applied to quantitatively reflect the correlation relationship between the solidification structure and the central segregation along the casting direction of selected SCM 440 billet samples. Second, the effect of process parameters on solidification structure and central segregation fluctuation was interpreted. On this basis, the formation mechanism of billet central segregation has been further explained and the corresponding control strategies have also been proposed. This research can provide theoretical guidance for controlling the internal defects and improving the quality uniformity along casting direction in CC billets.

2. Experimental Procedures

2.1. Research Object and Analysis Areas

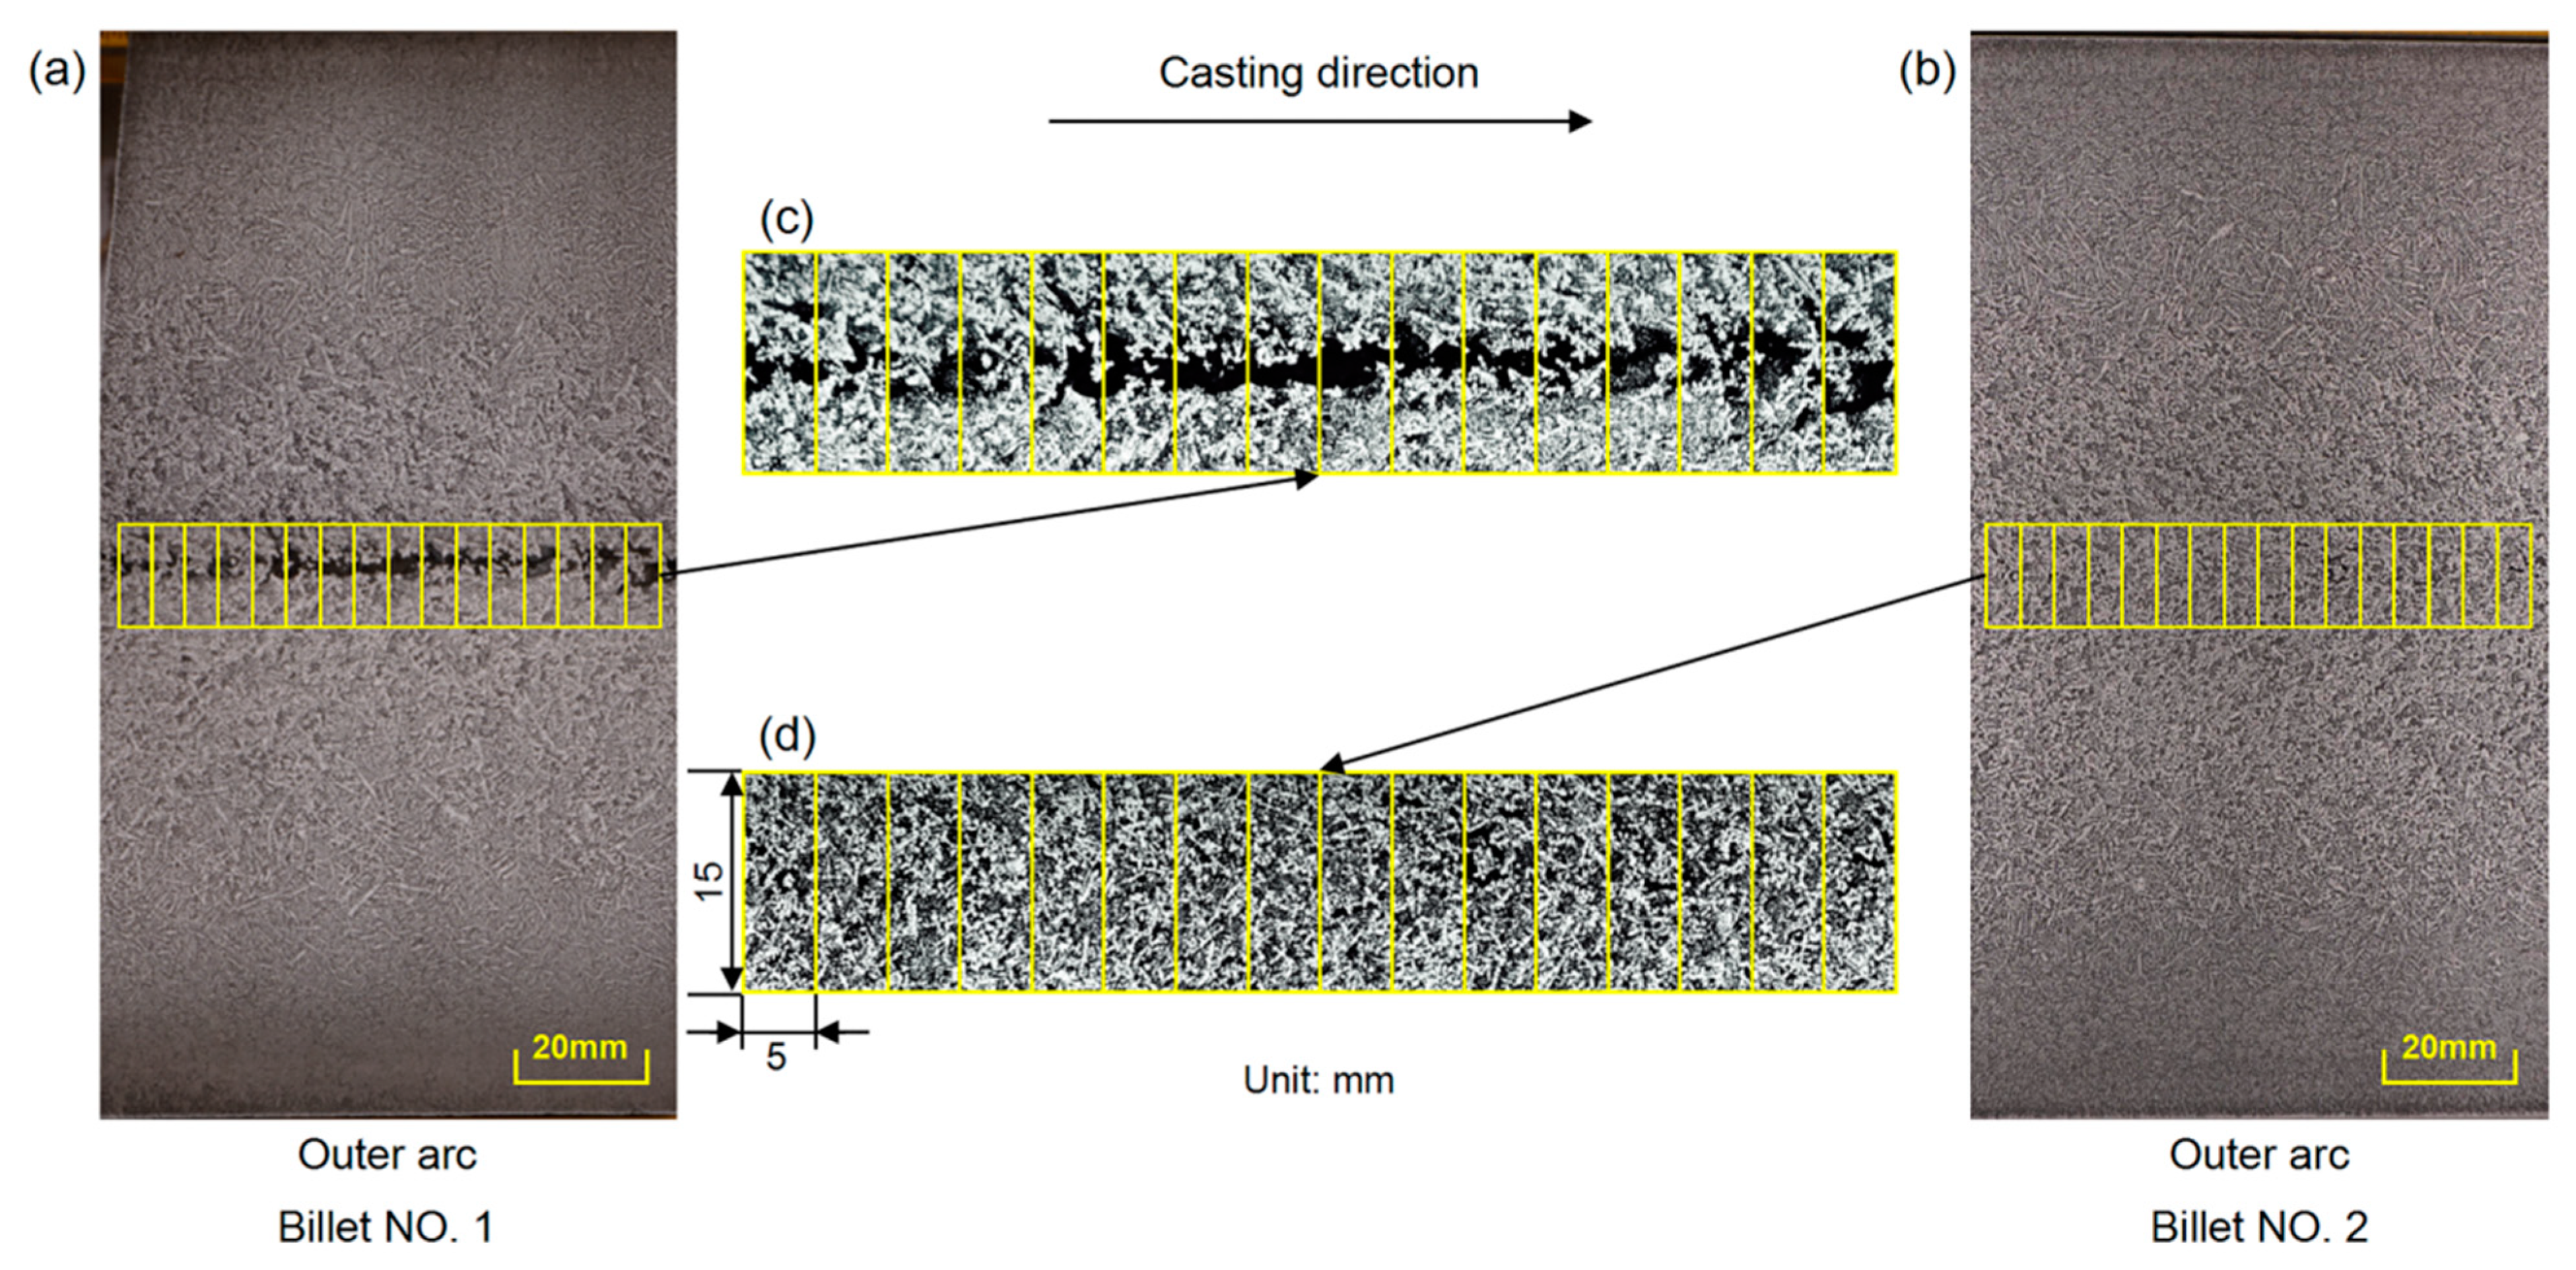
SCM440 cold heading steel billet with a size of 160 mm × 160 mm was selected as the research object. The main chemical composition (mass%) is C0.38~0.43, Si0.15~0.30, Mn0.60~0.90, P ≤ 0.002, S ≤ 0.002, Cr0.90~1.20, Mo0.15~0.30, and Fe balance. Two billet samples were obtained in the actual production field under different process parameters as shown in Table 1. During the CC process, the casting speed needs to be adjusted because of the temperature decrease of the molten steel in the ladle. Thus, the main process difference between of two billet samples is the casting speed. One is 1.8 m/min, and the other is 2.1 m/min. The solidification structure of the central vertical section was obtained by hot pickling experiment and the sampling method for the vertical section of two billet samples is shown in Figure 1a. During the experiment, the samples were etched with 1:1 warm hydrochloric acid–water solution for revealing the solidification structure more clearly. The temperature of the hydrochloric acid–water solution was 60~80 °C, and the pickling time was 25 min. After pickling, the solidification structure on the central vertical section was obtained. Sixteen central segregation analysis areas with each size of 5 mm × 15 mm were selected from the central equiaxed crystal zone of two billet samples, as shown in Figure 1b. The selected analysis areas and the corresponding solidification structure of the inner and outer arc sides are shown in Figure 2.

2.2. Characterization of Segregation Degree

Previous characterizations of segregation degree including drilling samples, electron probe, and Glow Discharge Optical Emission Spectroscopy. However, the analysis area of these methods is small and cannot overall reflect the central segregation degree in the billet because of the existence of the centerline segregation and V-shaped segregation. Xu [15] introduced the segregation area ratio to evaluate the central segregation degree in pipeline steel slabs and compared the calculated results with the carbon chemical analysis. It is shown that the segregation area ratio increases with the increase of carbon segregation ratio, meaning that it is effective to use the segregation area ratio to evaluate the segregation degree. Thus, in this paper, the two-dimensional segregation area ratio was applied to describe the central segregation degree along the casting direction of billet samples, which can quantitatively characterize the overall segregation degree and reflect the morphology of central segregation. In the solidification structure diagram of billet samples shown in Figure 2c, d, the dark point represents the segregation area, i.e., the solidification structure formed by the solute-enriched liquid phase and the bright part is the dendrite. The single dark point with size greater than or equal to 1 mm2 was counted to calculate the two-dimensional segregation area ratio and represent the segregation degree, as shown in Equation (1).
R s e g = A S / A
where Rseg is the segregation area ratio of each analysis area, %; AS is the total area of the dark points (the single area of dark point must be greater than or equal to 1 mm2), mm2; A is the area of a single analysis area.

2.3. Determination of CET Position

The current research aims to investigate the specific correlation between central segregation and solidification structure, including the columnar and equiaxed crystals. Thus, it is necessary to determine the columnar crystal length of the inner and outer arc side and equiaxed crystal zone width corresponding to each analysis area. The measurement of the columnar crystal length requires the determination of the columnar to equiaxed transition (CET) position of the billet samples. However, the quantitative determination of CET position at a certain position of the CC billets is still difficult. Hunt [16] established a criterion of CET and analyzed the effects of alloy composition, nucleation density, and undercooling on CET. On this basis, Shibata et al. [17] optimized the Hunt model and studied the CET in stainless steel continuous casting slabs. Niu et al. [18] modified the criterion of CET proposed by J.D. Hunt and the modified criterion of CET can avoid the inaccurate selection of heterogeneous nucleation density. However, previous researches on CET are mostly based on the complex calculation of the solidification process parameters and focus on the overall CET position of the whole billet, ignoring the observation and characterization of the actual solidification structure characteristics and the fluctuation of the CET position along the casting direction. On the other hand, the solidification structure of carbon steel is more complex than that of stainless steel or other alloys, such as Al alloys, and the determination of the CET in carbon steel is more difficult. Therefore, few researches have been done on the CET along the casting direction of carbon steel billets.
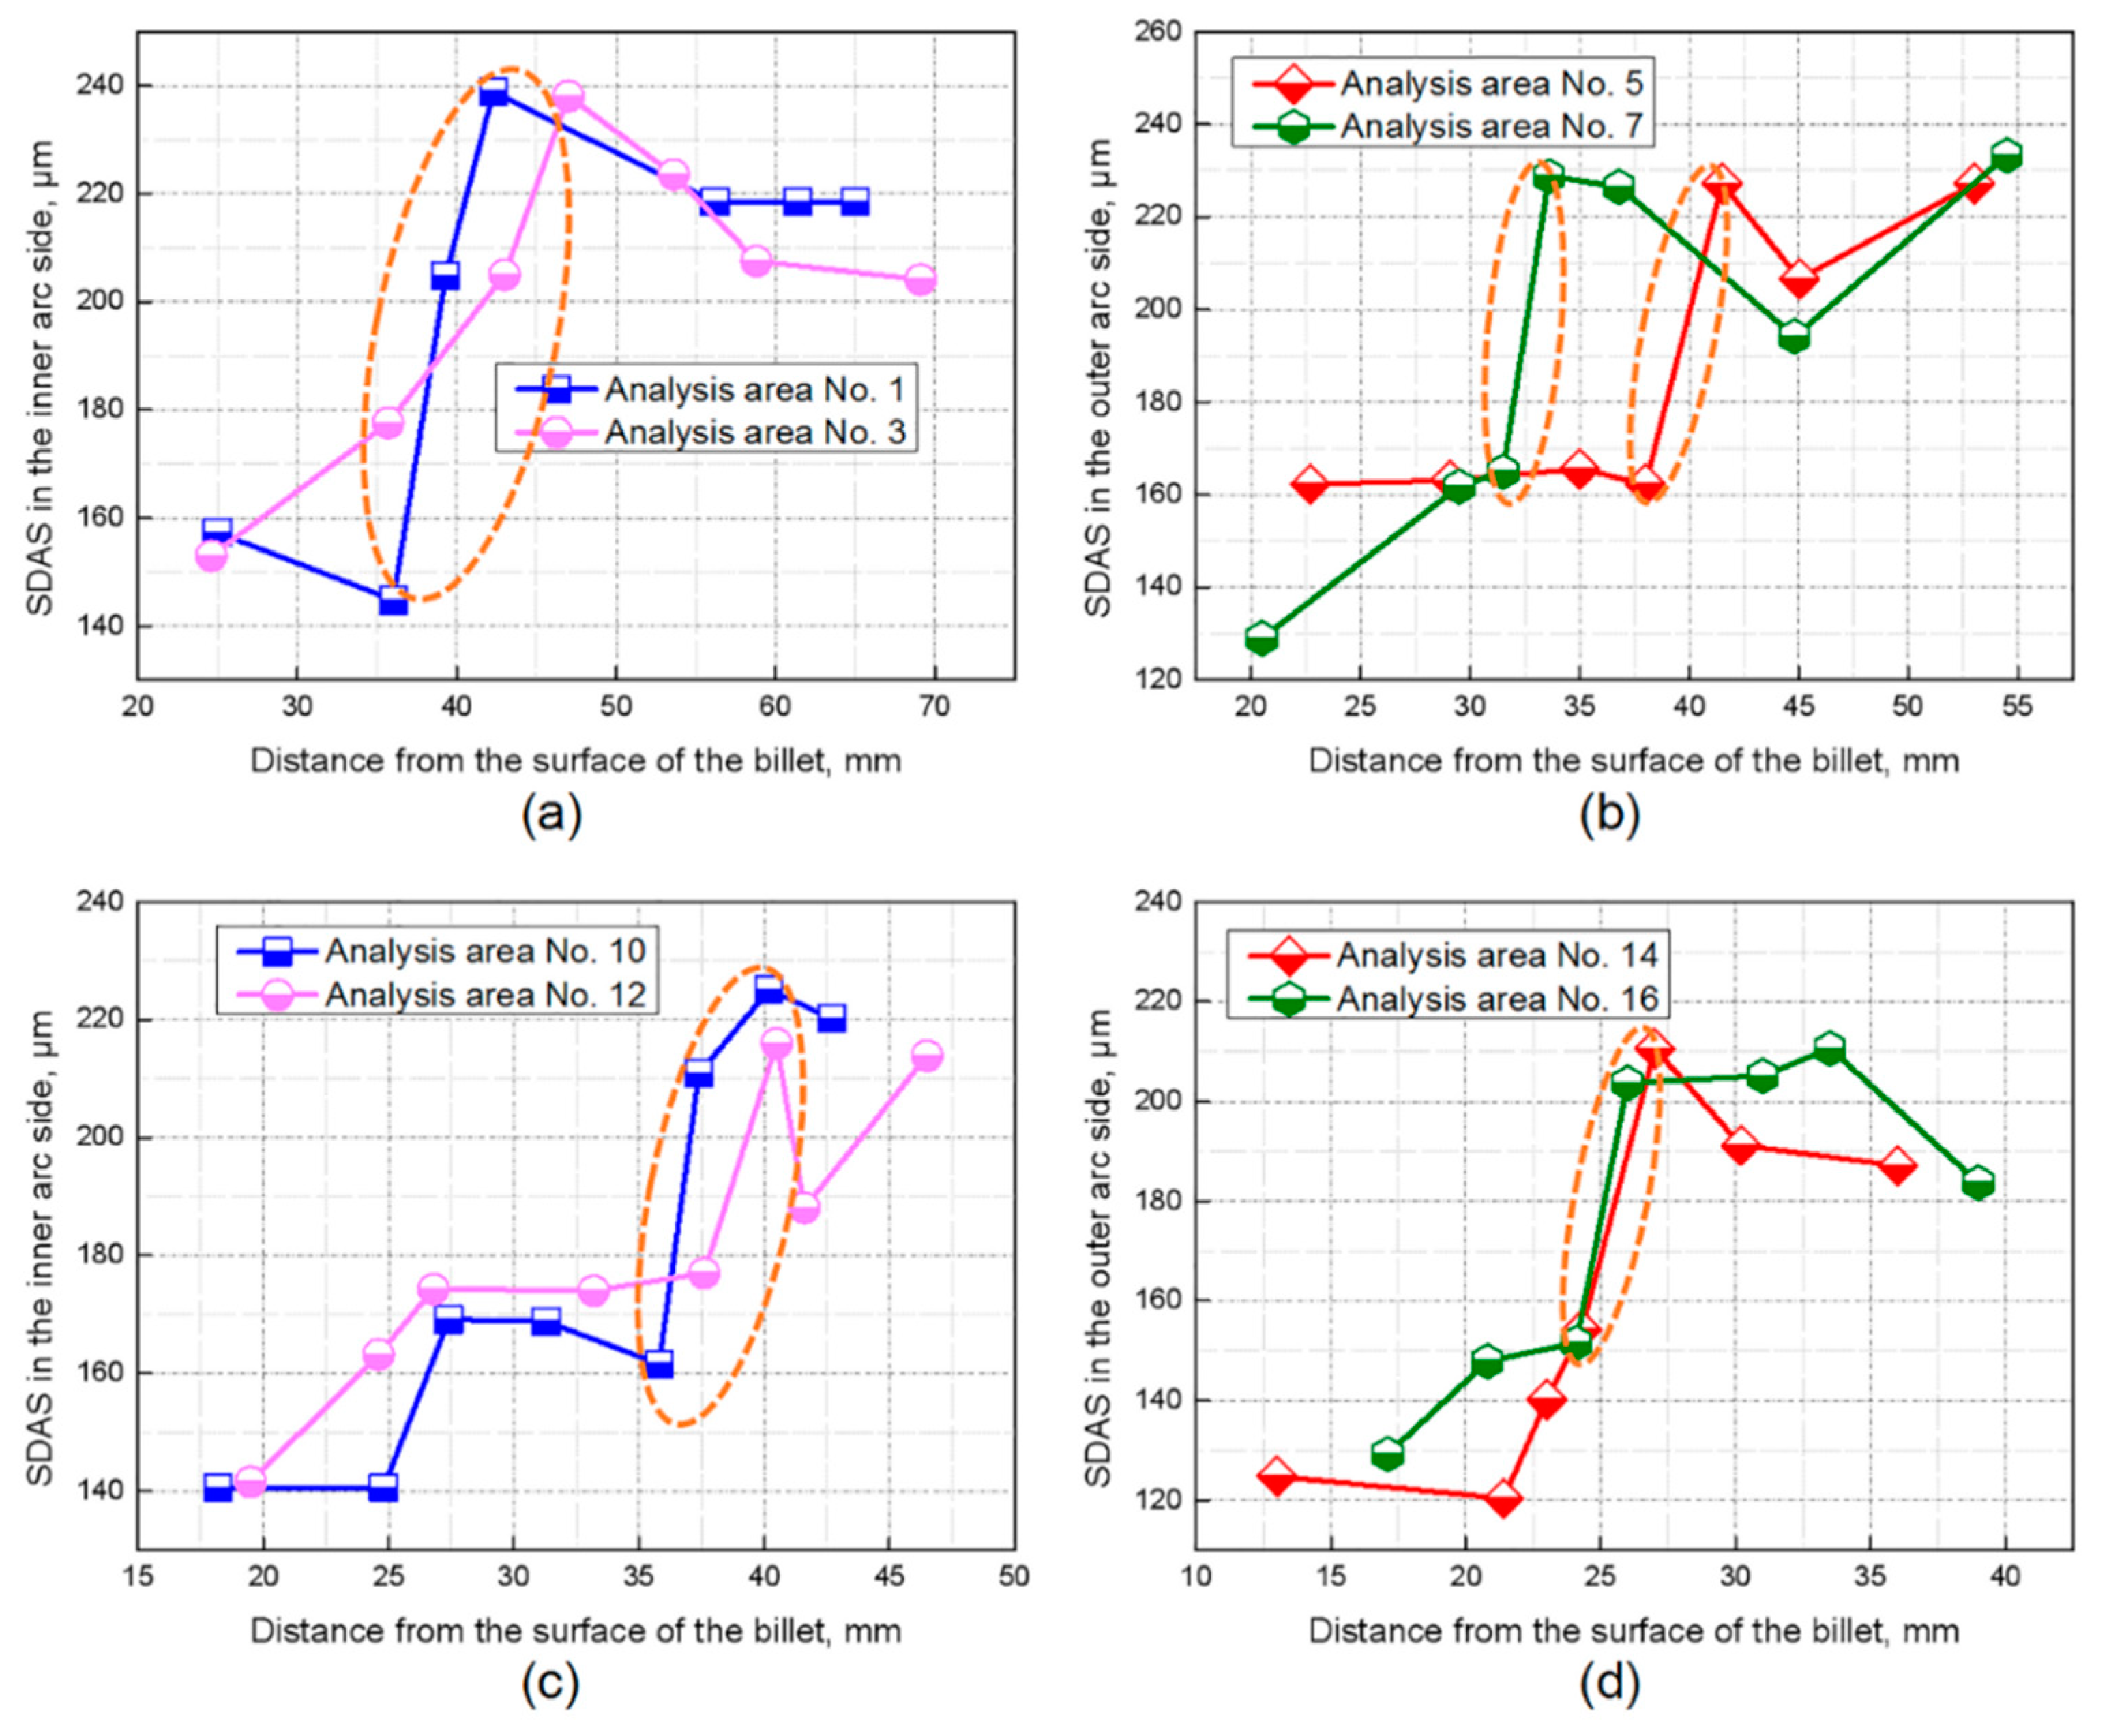
During the research process of this paper, the solidification structure on the vertical section of the selected billet samples was observed and the secondary dendrite arm spacing (SDAS) at different positions on the vertical section was measured from the surface to the center successively. Part of the SDAS measurement results are shown in Figure 3 and it is found that from the surface to the center of the billet, the SDAS increases gradually and has the largest increase rate at a certain position (marked with ellipses in Figure 3). Combined with the observation of the overall solidification structure of two billet samples in Figure 2, it can be seen that the maximum increase rate of the SDAS occurs at the CET position of the billet samples. Ji et al. [19] and Li et al. [20] investigated the dendrite morphology in steel products. In their researches, the maximum increase rate of SDAS also exits and appears at the CET position. According to reference [21], the local solidification time of the columnar zone and equiaxed crystal zone is quite different, meaning that there is also a great difference in the local cooling rate. During the continuous casting process, the heat flux is approximately perpendicular to the surface of the billet due to the growth of the columnar crystal in the initial stage of the CC process, which leads to higher heat transfer efficiency and faster cooling rate. At this time, the SDAS will be smaller according to Equation (2), in which d2 represents the SDAS and R is the local cooling rate. After the superheat of the molten steel is eliminated, there will be CET and the isotropic growth of equiaxed crystals leads to a drastic decrease in heat transfer efficiency, which will increase the local solidification time and the SDAS.
d 2 = β · R α
where d2 represent the SDAS, mm; R is the local cooling rate, °C/min; α and β are coefficients. For the SCM440 cold heading steel billet selected in this paper, α is 0.38 and β is usually 148 [22].
Therefore, this paper determined the CET position and measured the columnar crystal length by calculating the maximum increase rate of the SDAS. In the inner and outer arc sides of the billet samples corresponding to central analysis areas, the typical dendrite SDAS were measured successively from the surface to the center. The increase in SDAS between adjacent dendrites is calculated according to Equation (3). It is considered that the CET transition has occurred when there is the maximum SDAS increase and the end of the previous dendrite is the endpoint of columnar crystal growth. The equiaxed crystal zone width can be obtained by subtracting the columnar crystal length of inner and outer arc sides from the billet width.
R S D A S = ( S D A S i + 1 S D A S i ) / S D A S i ( i = 1 , 2 , 3 , )
where RSDAS is the increase rate of the SDAS; SDASi is the SDAS of the previous dendrite, µm; SDASi + 1 is the SDAS of the latter dendrite, µm.

2.4. Statistical Correlation

Simply comparing or metering the solidification structure (columnar crystal length or equiaxed crystal width) and the central segregation degree to judge the effect of solidification structure on the central segregation is qualitative and does not conform to the fine control of steel products. Therefore, statistical correlation is needed to quantitatively describe the specific correlation between solidification structure and central segregation. The Pearson correlation coefficient is a kind of statistical method that can quantitatively characterize the correlation between variables [23], and the quantitative description of correlation relationship between the solidification structure and the central segregation using the Pearson correlation coefficient has not been reported. In this paper, the Pearson correlation coefficient has been introduced to characterize the correlation relationship between these two variables, and it can be defined as Equation (4) for two single variables x = { x 1 , x 2 , x n } and y = { y 1 , y 2 , y n } .
r ( x , y ) = i = 1 n ( x i 1 n j = 1 n x j ) ( y i 1 n j = 1 n y j ) i = 1 n ( x i 1 n j = 1 n x j ) 2 i = 1 n ( y i 1 n j = 1 n y j ) 2
where r (x, y) represents the Pearson correlation coefficient of two variables x and y. When the Pearson coefficient is 1, there is a perfect positive linear correlation between the variables. When the Pearson coefficient is −1, there is a perfect negative linear correlation between the variables. When the Pearson coefficient is 0, there is no correlation between the variables at all. A larger value of r shows more correlation between the two variables. The specific correlation relationship can be reflected quantitatively by means of the Pearson correlation coefficient.

3. Results and Discussion

3.1. Quantitative Correlation between Solidification Structure and Central Segregation

3.1.1. Fluctuation Correlation

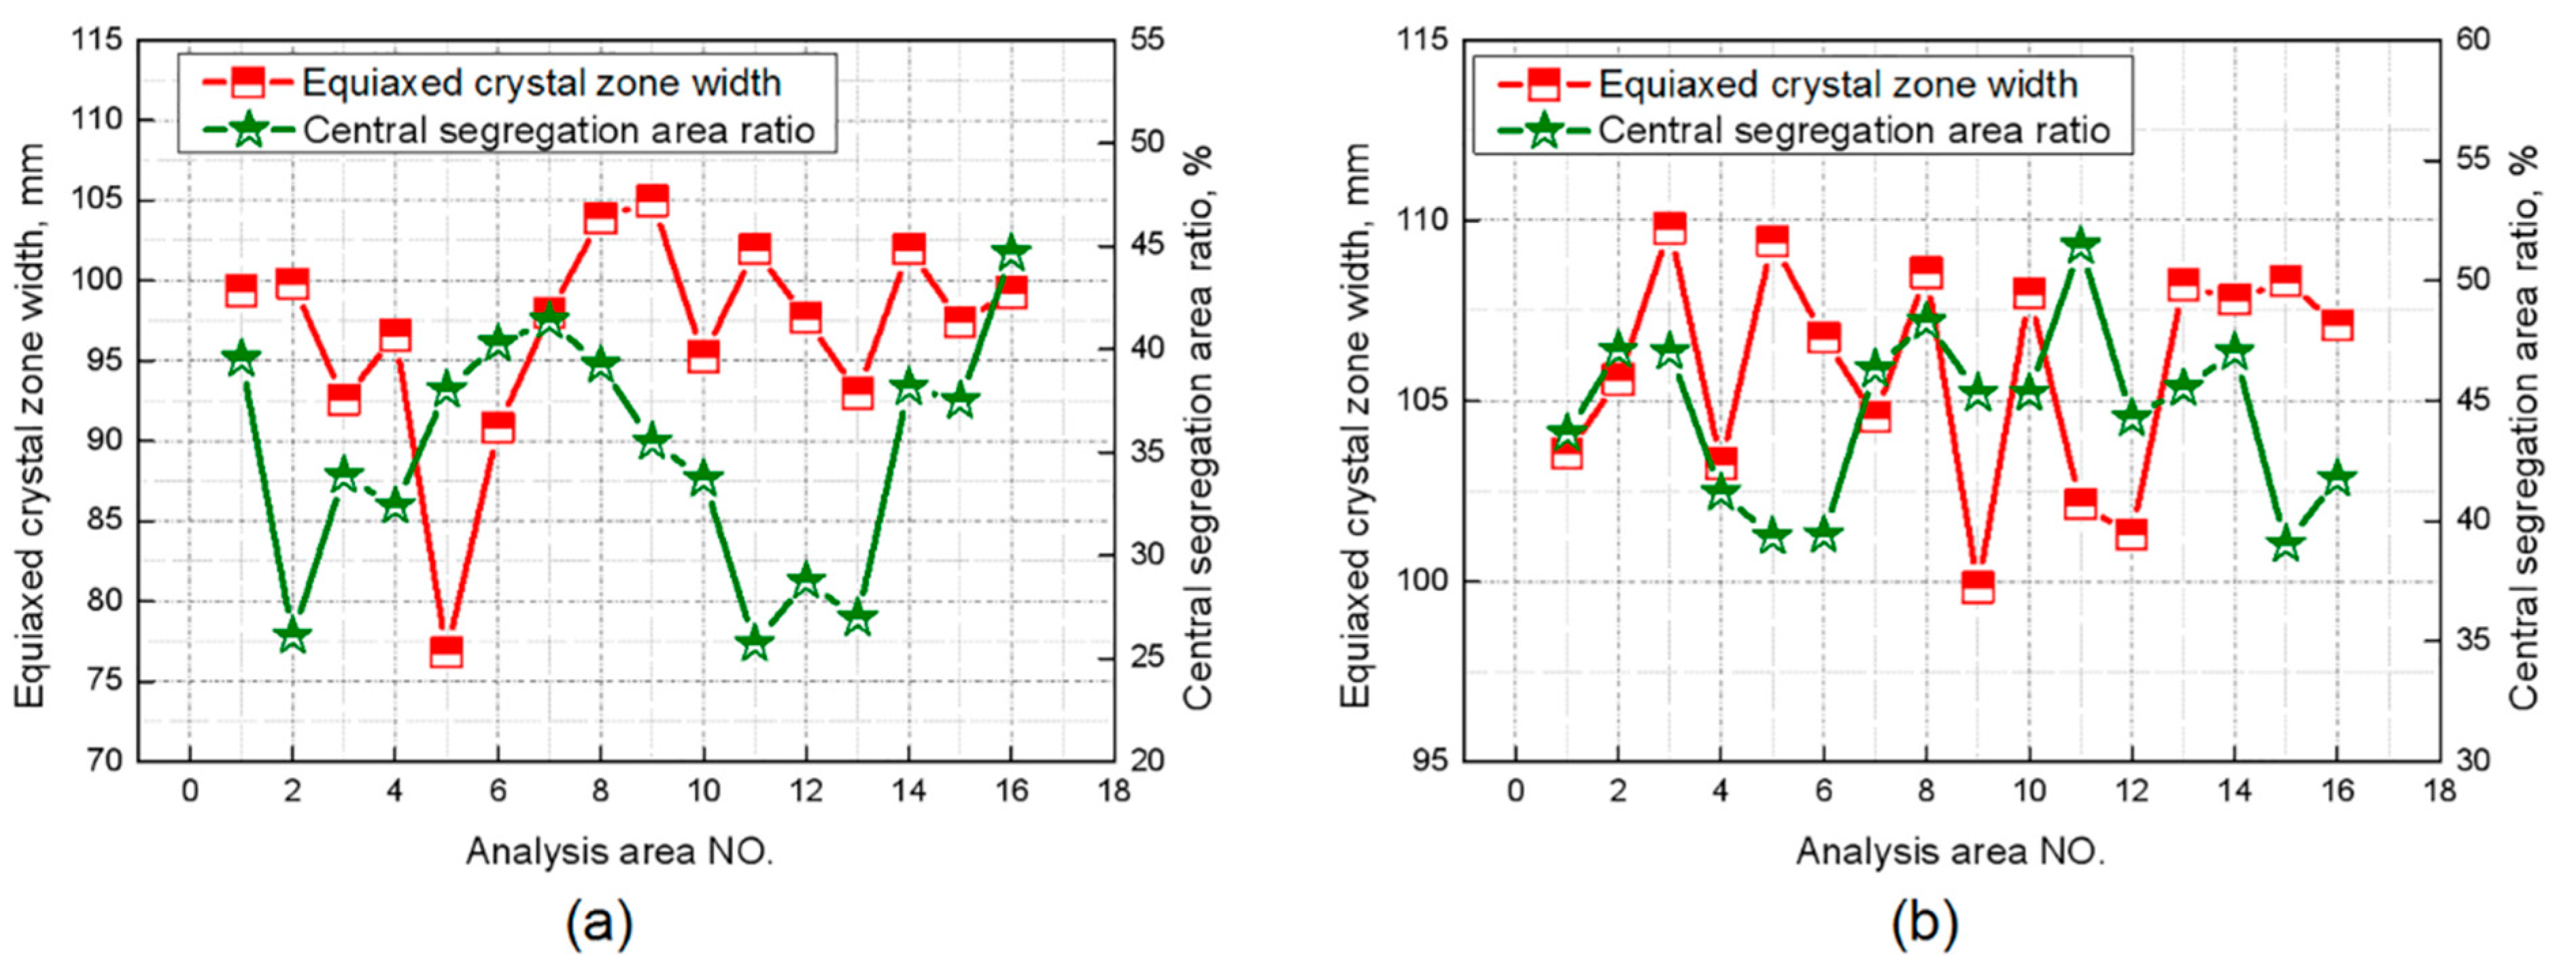
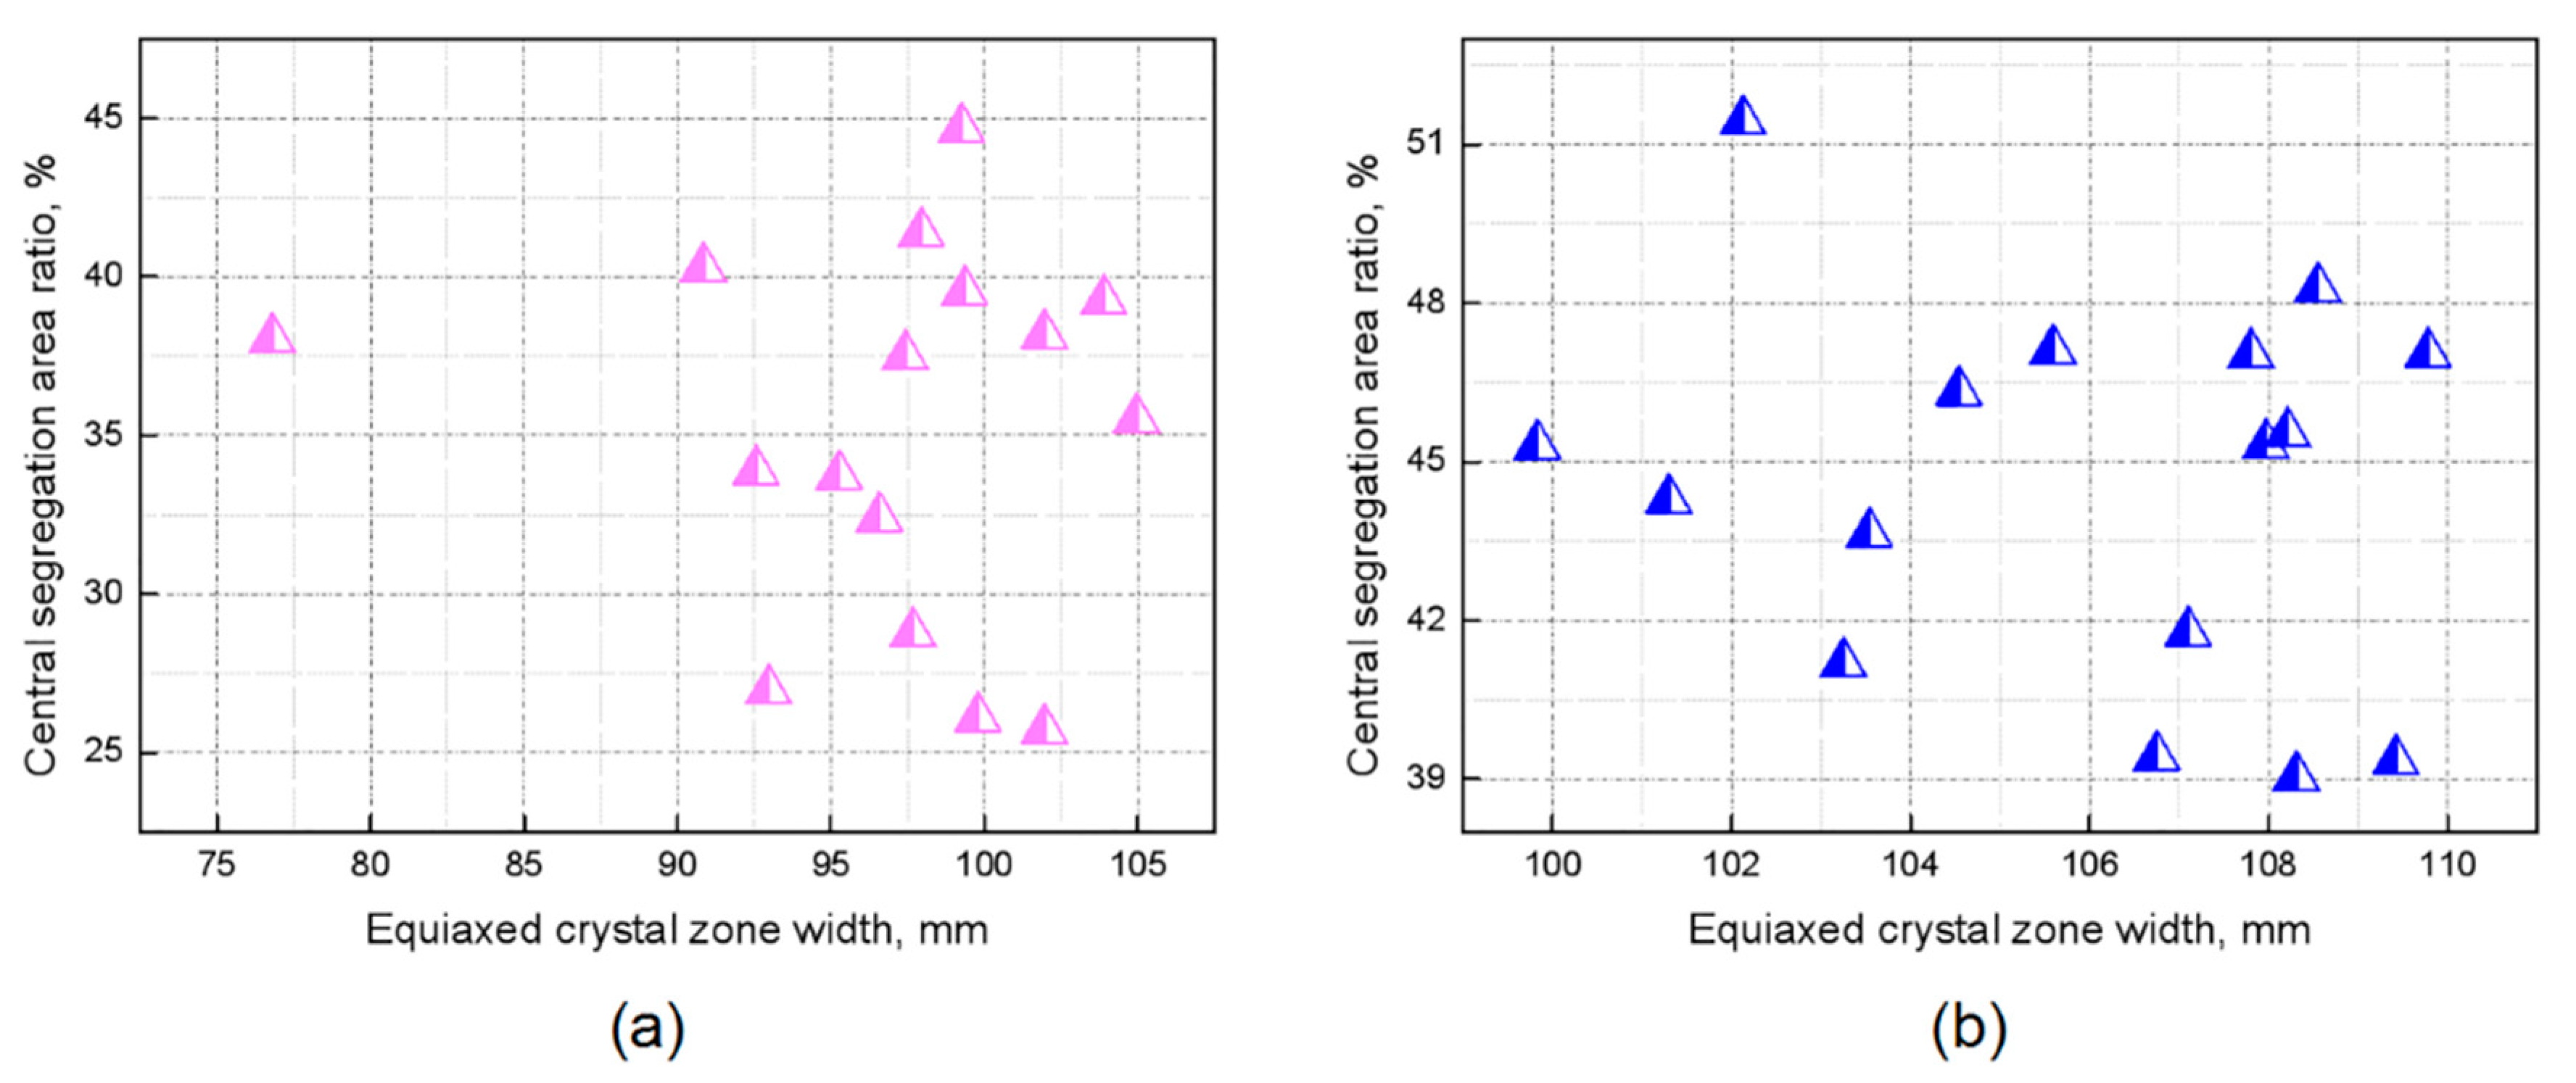
After the determination of the CET position and the columnar crystal length on the vertical section of the selected billet samples, the equiaxed crystal zone width can be obtained. Figure 4 shows the distribution of the calculated equiaxed crystal zone width and the central segregation area ratio corresponding to each analysis area. It can be seen that both the equiaxed crystal zone width and the central segregation area ratio fluctuate to different degrees. To investigate the discrete relationship between the equiaxed crystal zone width and the central segregation area ratio, the variation coefficient was introduced to quantitatively describe the discrete degree of these two variables, which can avoid the comparison error caused by the different scales of the two sets of data. The variation coefficient of the equiaxed crystal zone width and the central segregation area ratio can be obtained by Equation (5).
c v = σ / μ
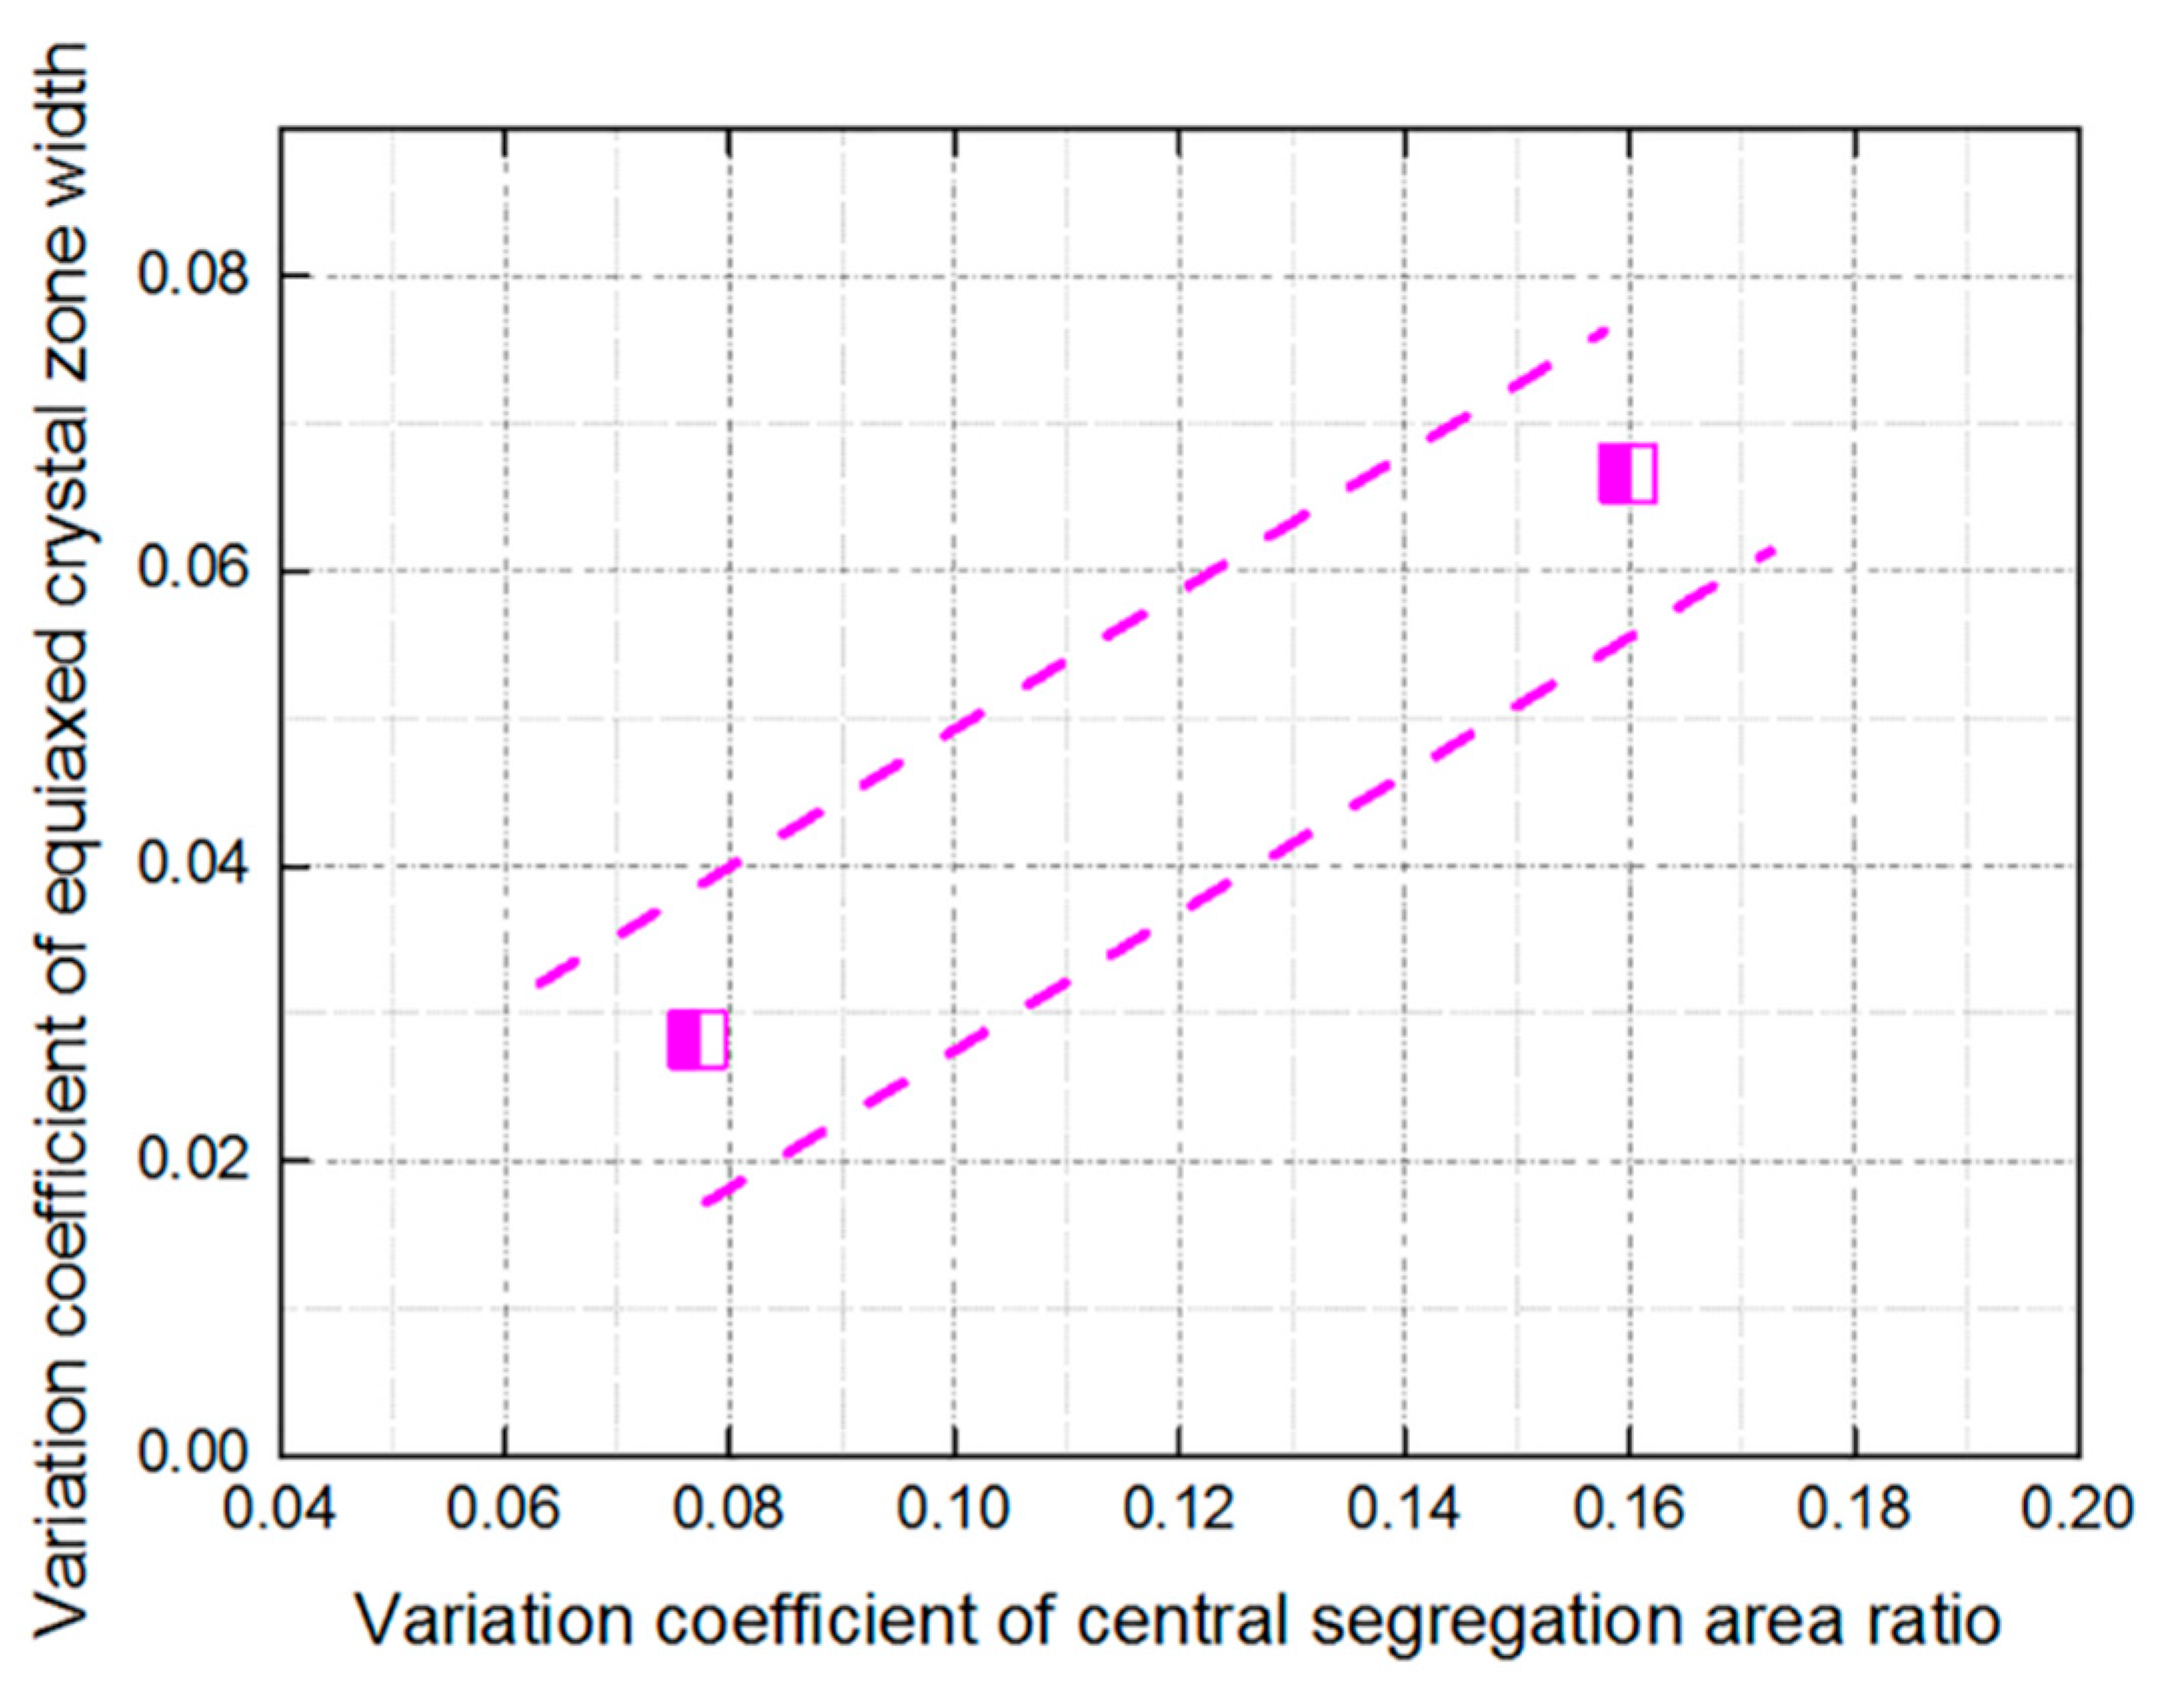
where σ is the mean square deviation of a set of data, µ is the mean value, and the results are shown in Figure 5.
It is found that the fluctuation degree of central segregation ratio increases with the increase of equiaxed crystal zone width fluctuation on the vertical section of two selected billet samples, i.e., the greater the fluctuation in the equiaxed crystal zone width, the stronger the fluctuation in the central segregation area ratio.
Central segregation defect along the casting direction is formed in the central equiaxed crystal zone of billet. After the columnar to equiaxed transition, the solute element is discharged continuously with the equiaxed crystal grows and distributed in the central equiaxed crystal zone. At the endpoint of the solidification, the solute-enriched liquid phase is pumped to form the central segregation when the negative pressure caused by solidification shrinkage reaches a certain level. The fluctuation of equiaxed crystal zone in the billet determines the fluctuation of the solute-enriched liquid phase in the center of the billet. Therefore, the fluctuation of the equiaxed crystal zone width will affect the fluctuation degree of central segregation.

3.1.2. Hysteretic Correlation

The above content mainly analyzed the overall fluctuation correlation of the solidification structure and central segregation on the vertical section of the billet samples. However, in view of the present metallurgical industry precise control, the whole characteristic research regarding the billet quality control is limited. At the same time, the specific quantitative effect of the solidification structure on the central segregation defect is still unclear. Based on the above problems, a more detailed analysis of the relationship between the solidification structure and central segregation inside the billet is necessary. Figure 6 shows the distribution of the central segregation area ratio of each central analysis area on the vertical section and the equiaxed crystal zone width at the corresponding position. It can be seen that the distribution is discrete and there is no obvious trend.
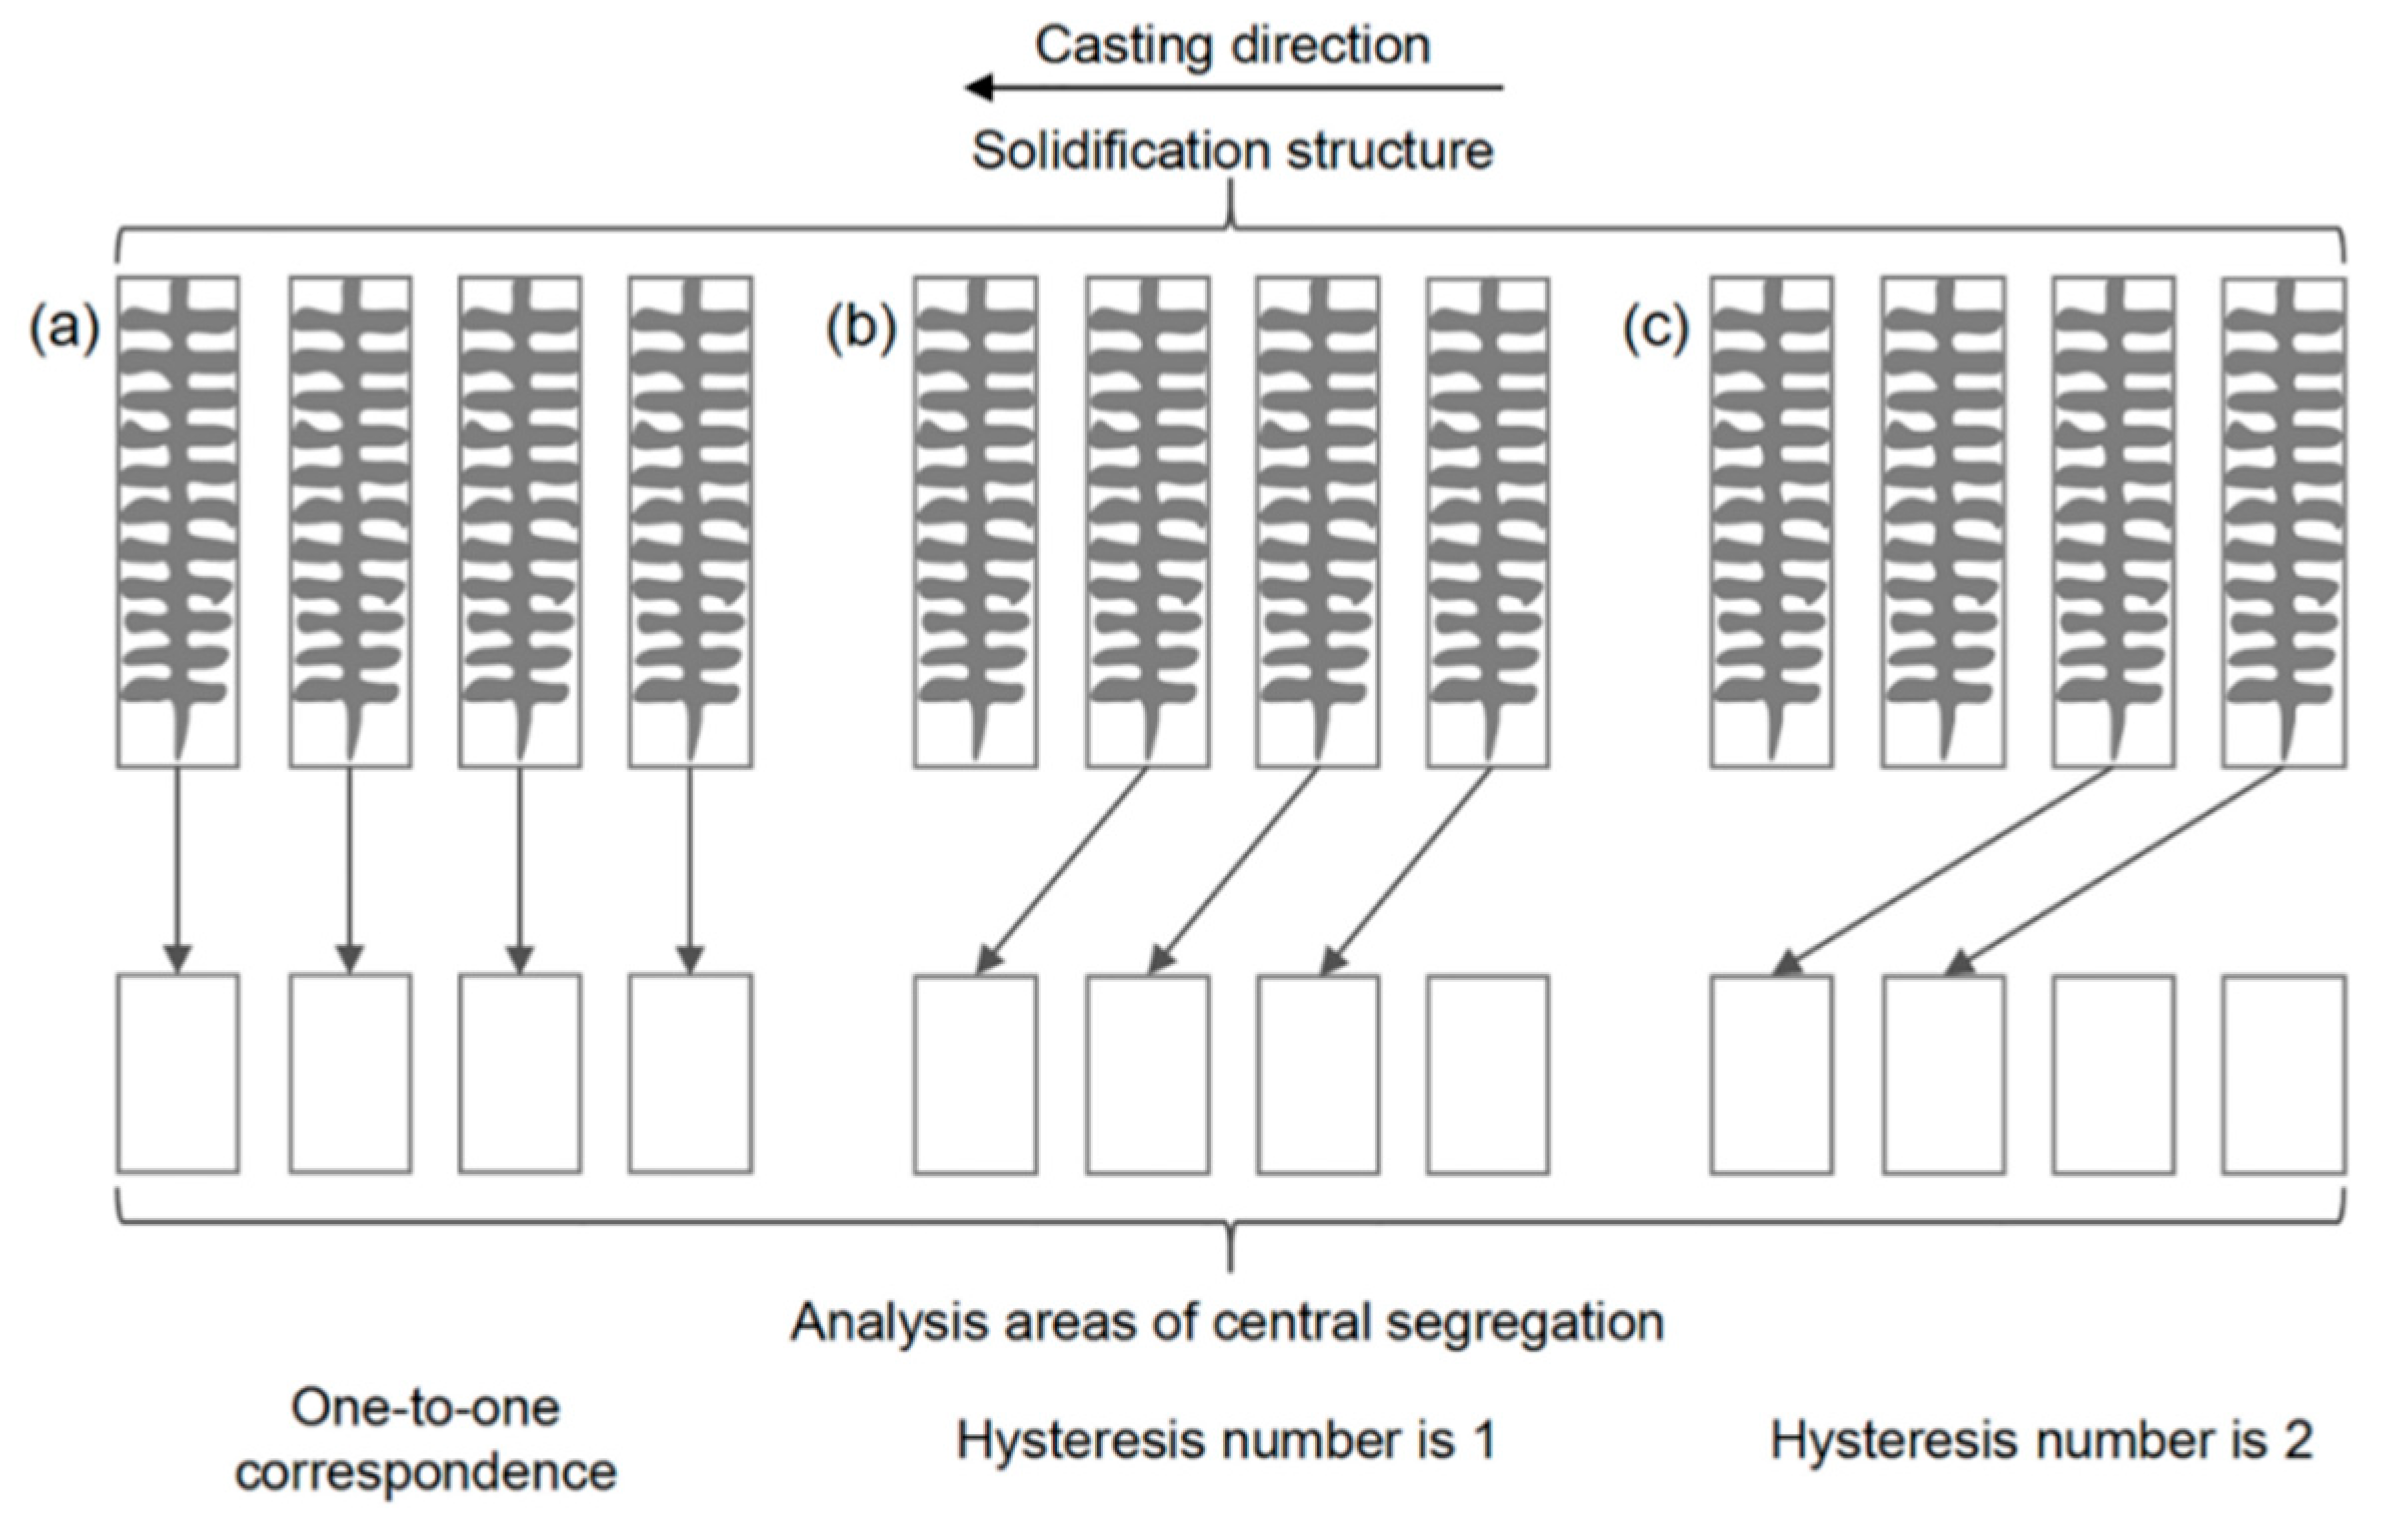
During the CC process, the billet solidifies gradually from outside to inside and there is time hysteresis between the solidification of columnar crystal zone and equiaxed crystal zone. Therefore, the hysteresis should also be considered in the analysis of the correlation relationship between solidification structure and central segregation. Due to the characteristic of hysteresis, two groups of data (equiaxed crystal zone width and central segregation area ratio) were processed with hysteresis according to the method shown in Figure 7 and the Pearson correlation coefficient under different hysteresis numbers was calculated to characterize the correlation of variables. After the two groups of data are processed with hysteresis, the amount of superposed data will decrease, thus the hysteresis processing should follow the principle that the superposed data volume is not less than half of the total data volume. Pearson correlation coefficient and corresponding significance level α between the equiaxed crystal zone width and the central segregation area ratio under different hysteresis numbers are shown in Table 2. In the calculation process of the Pearson correlation coefficient, the significance level α means the probability that the two groups of variables are not correlated is not greater than α × 100%.
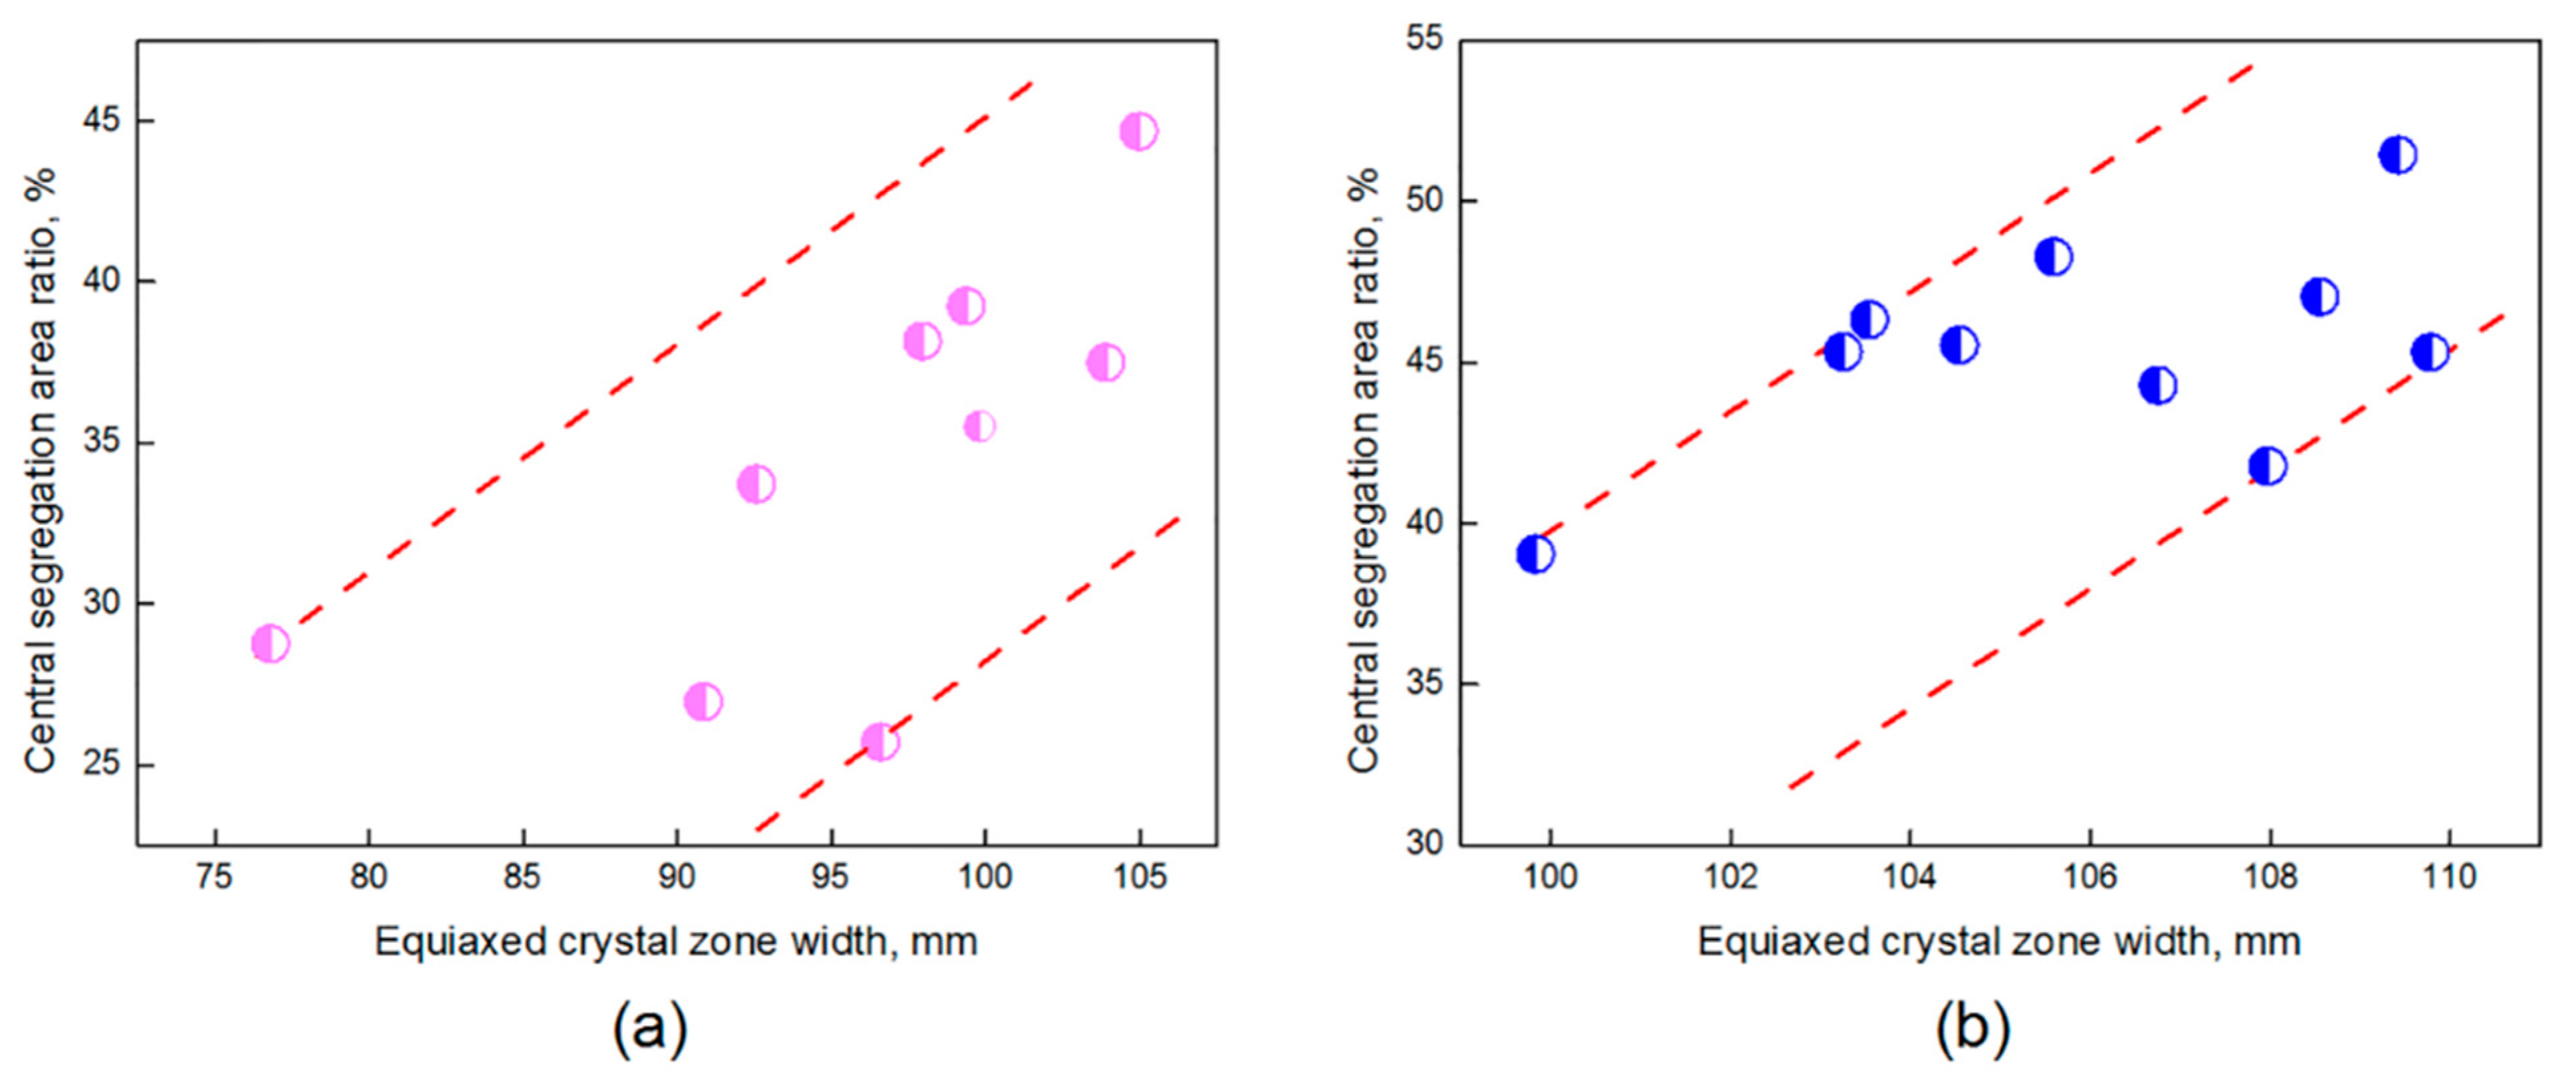
It can be seen from Table 2 that the Pearson correlation coefficient between the central segregation area ratio and the equiaxed crystal zone width of two billet samples present fluctuating distribution, which indicates that the hysteresis will affect the correlation relationship between the two groups of data. Observing the data in the table, there is a maximum positive Pearson correlation coefficient for both two billet samples under certain hysteretic condition. At this time, the corresponding hysteresis number was defined as HMP and the HMP of the two selected billet samples are 7 and 6, which are close. In this case, the corresponding central segregation area ratio and equiaxed crystal zone width distribution of the two billet samples are shown in Figure 8. It can be seen that the central segregation area ratio and the equiaxed crystal zone width are approximately positively correlated. The existence of the maximum positive Pearson correlation coefficient and similar HMP indicates that the central segregation is mainly affected by the equiaxed crystal zone width at the hysteretic position and the central segregation degree will be increased with the equiaxed crystal zone width increases.
The central segregation defect of the two billet samples selected in this paper is mainly spot segregation, which is spot-like on the cross section and V-shaped on the vertical section and is mainly formed in the central equiaxed crystal zone of the CC billet [24]. During the CC process, the segregated solute is concentrated to the center with the solidification process of the billet. At the endpoint of solidification, the cavity caused by solidification shrinkage needs to be filled by the liquid phase. However, the corresponding position in the cross section has been solidified and the liquid phase needs to be pumped from the equiaxed crystal zone at the hysteretic position of the solidification endpoint (opposite to the casting direction). Thus, the effect of the equiaxed crystal zone width on the central segregation is hysteretic. Since the liquid phase needed for the endpoint of solidification comes from the hysteretic equiaxed crystal zone, the distribution of solute-enriched liquid phase in the equiaxed crystal zone will affect the final center segregation. During the solidification process, the equiaxed crystals are connected into a network to hinder the macroscopic flow of the liquid phase and the interdendritic segregation is difficult to homogenize. In this case, when the equiaxed crystal zone width increases, the distribution range of the solute-enriched liquid phase will also increase and be pumped more easily to form the central spot segregation defect. The average value of the central segregation area ratio and equiaxed crystal zone width of the two billet samples are shown in Table 3. It can be seen that the overall segregation degree of two billet samples increases as the equiaxed crystal zone width increases, which is also a positive correlation. In general, the phenomenon that the central segregation ratio increases with the increase of the equiaxed crystal zone width not only exists in the different analysis areas of a single billet sample but also exists between different billet samples.
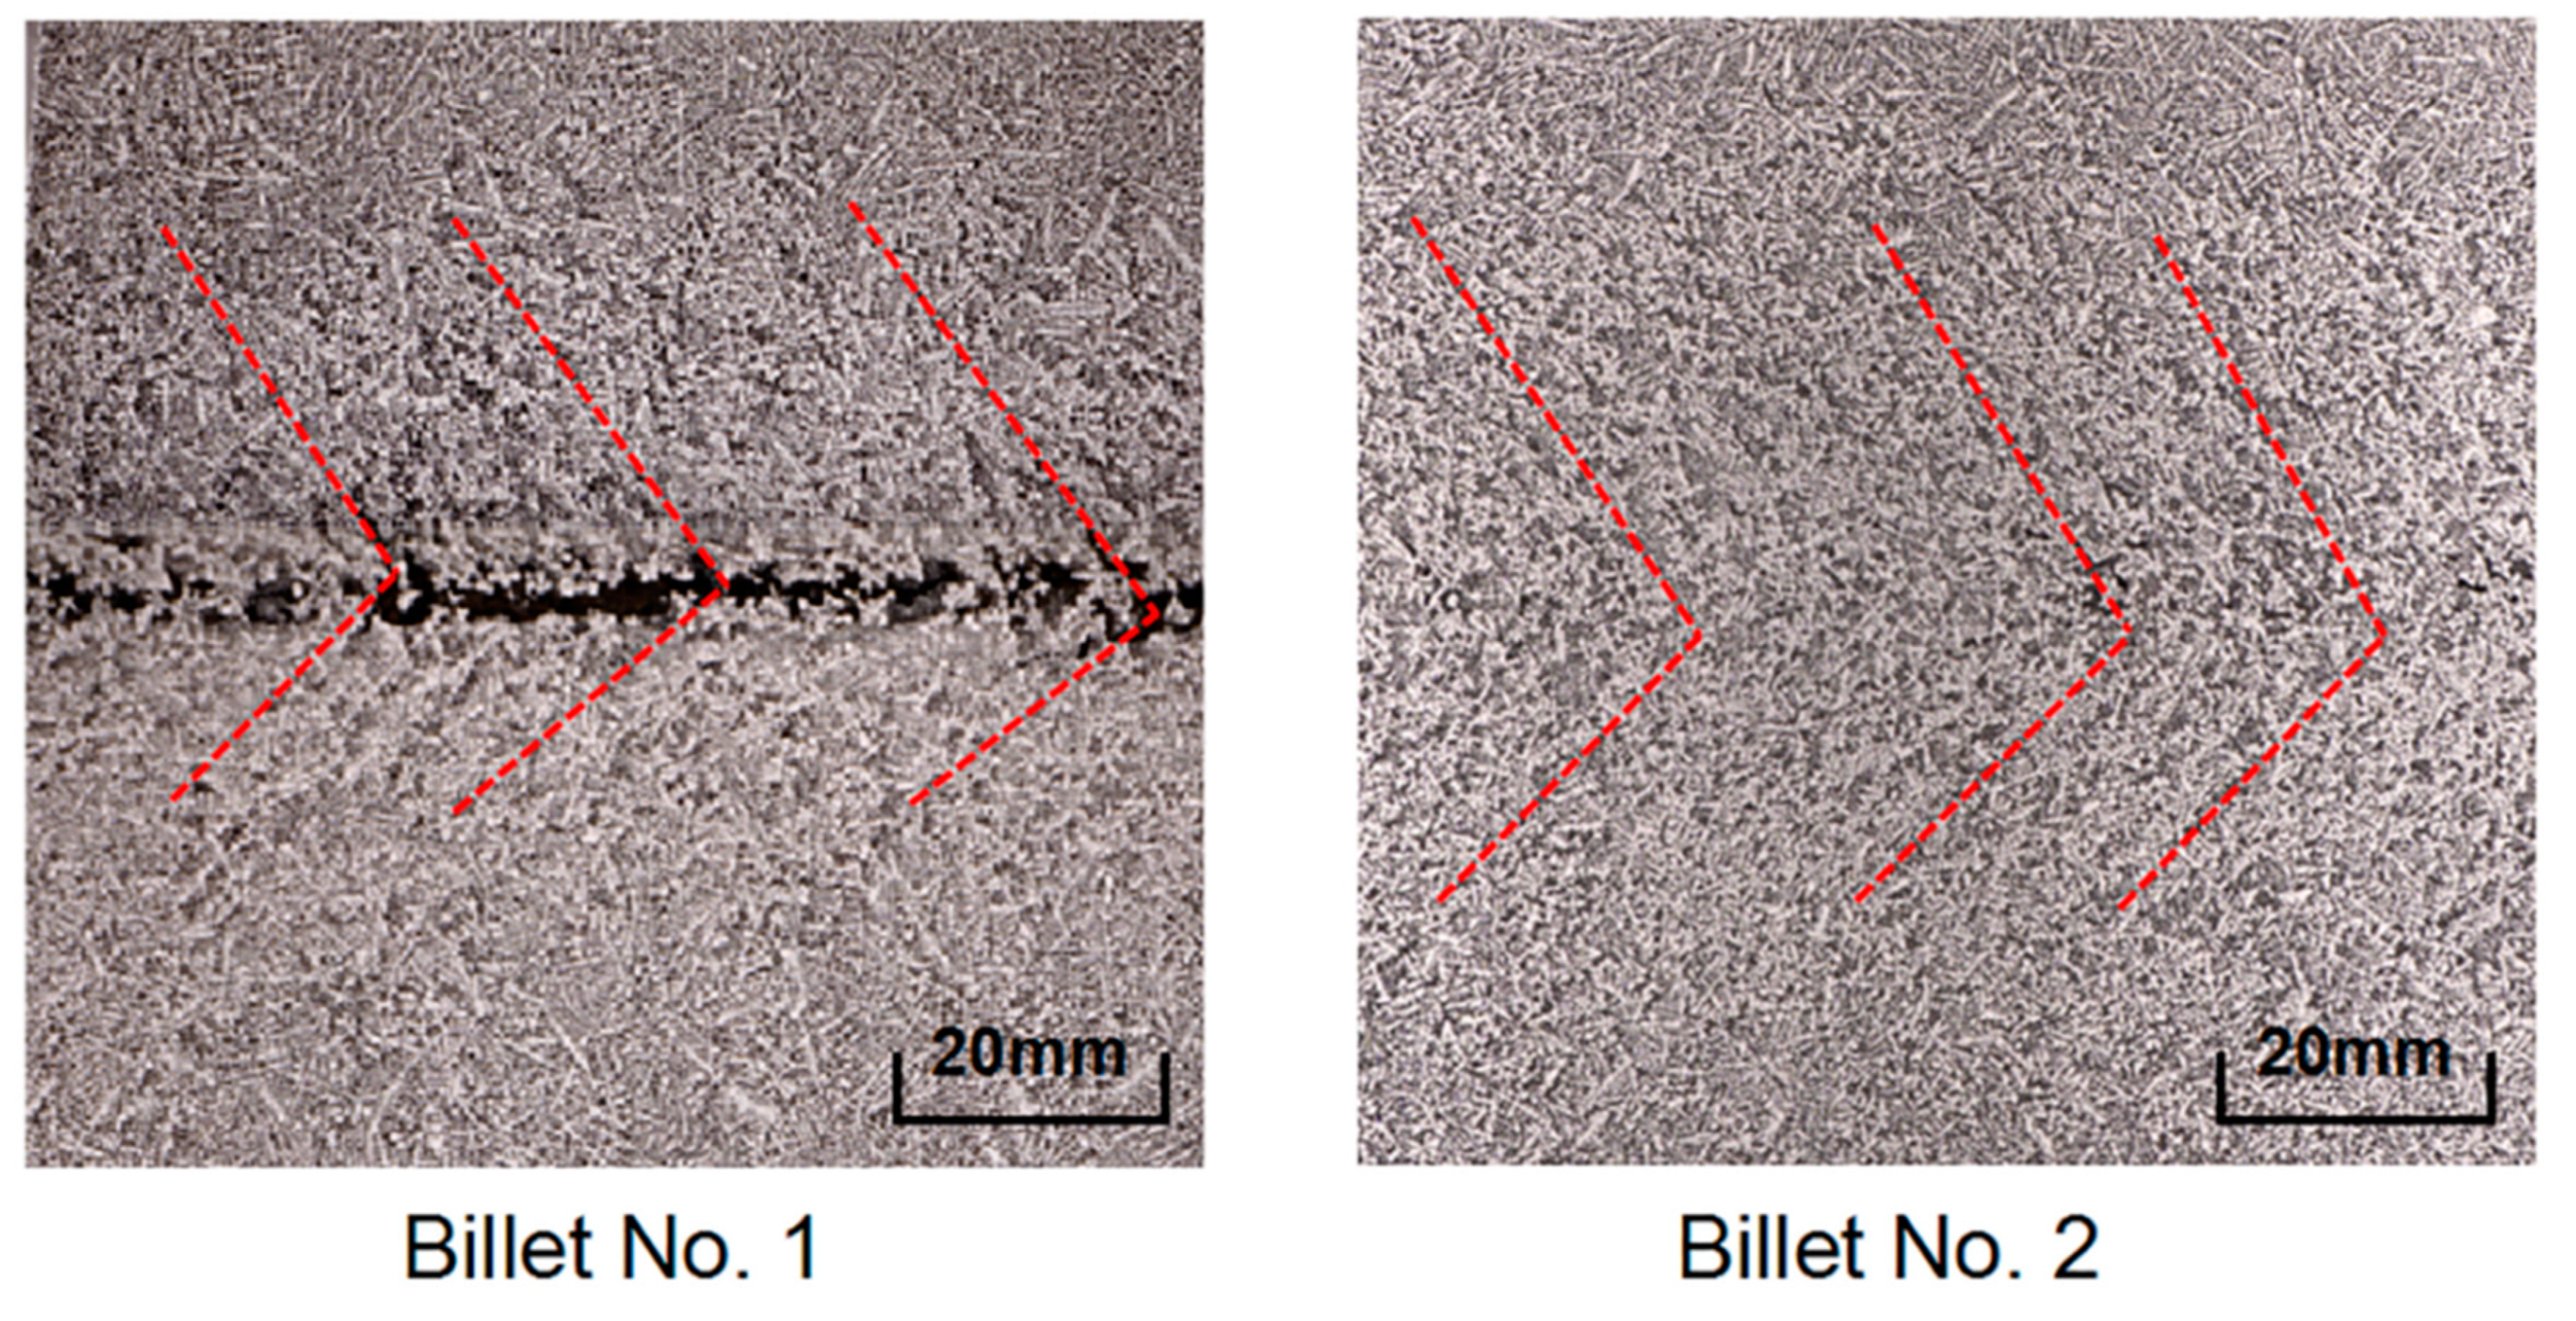
As mentioned above, spot segregation exists as V-shaped segregation on the vertical section. At the endpoint of solidification, the solute-enriched liquid phase forms V-shaped segregation channels in the center of the billet because of the negative pressure caused by solidification shrinkage. To investigate the hysteretic influence of solidification structure on the central segregation, this paper compared the hysteretic angles with the actual V-shaped segregation angles of the billet samples. The hysteretic effect of the solidified structure on the central segregation will form hysteretic angles, as shown in Figure 9. The actual V-shaped segregation angles of the billet samples are shown in Figure 10. Table 4 shows the comparison between the hysteretic angles and the actual V-shaped segregation angles and the relative error is the ratio of the difference between the average value of these two variables and the average value of actual V-shaped segregation angles. According to Table 4, the hysteretic angle is close to the V-shaped segregation angle, and the error is less than 5%. This result shows that during the solidification of the billet, the solidification endpoint will continuously pump the solute-enriched liquid phase at the subsequent locations and the effect of the solidification structure on the central segregation is hysteretic.

3.2. Effect of Casting Speed on the Solidification Structure Fluctuation

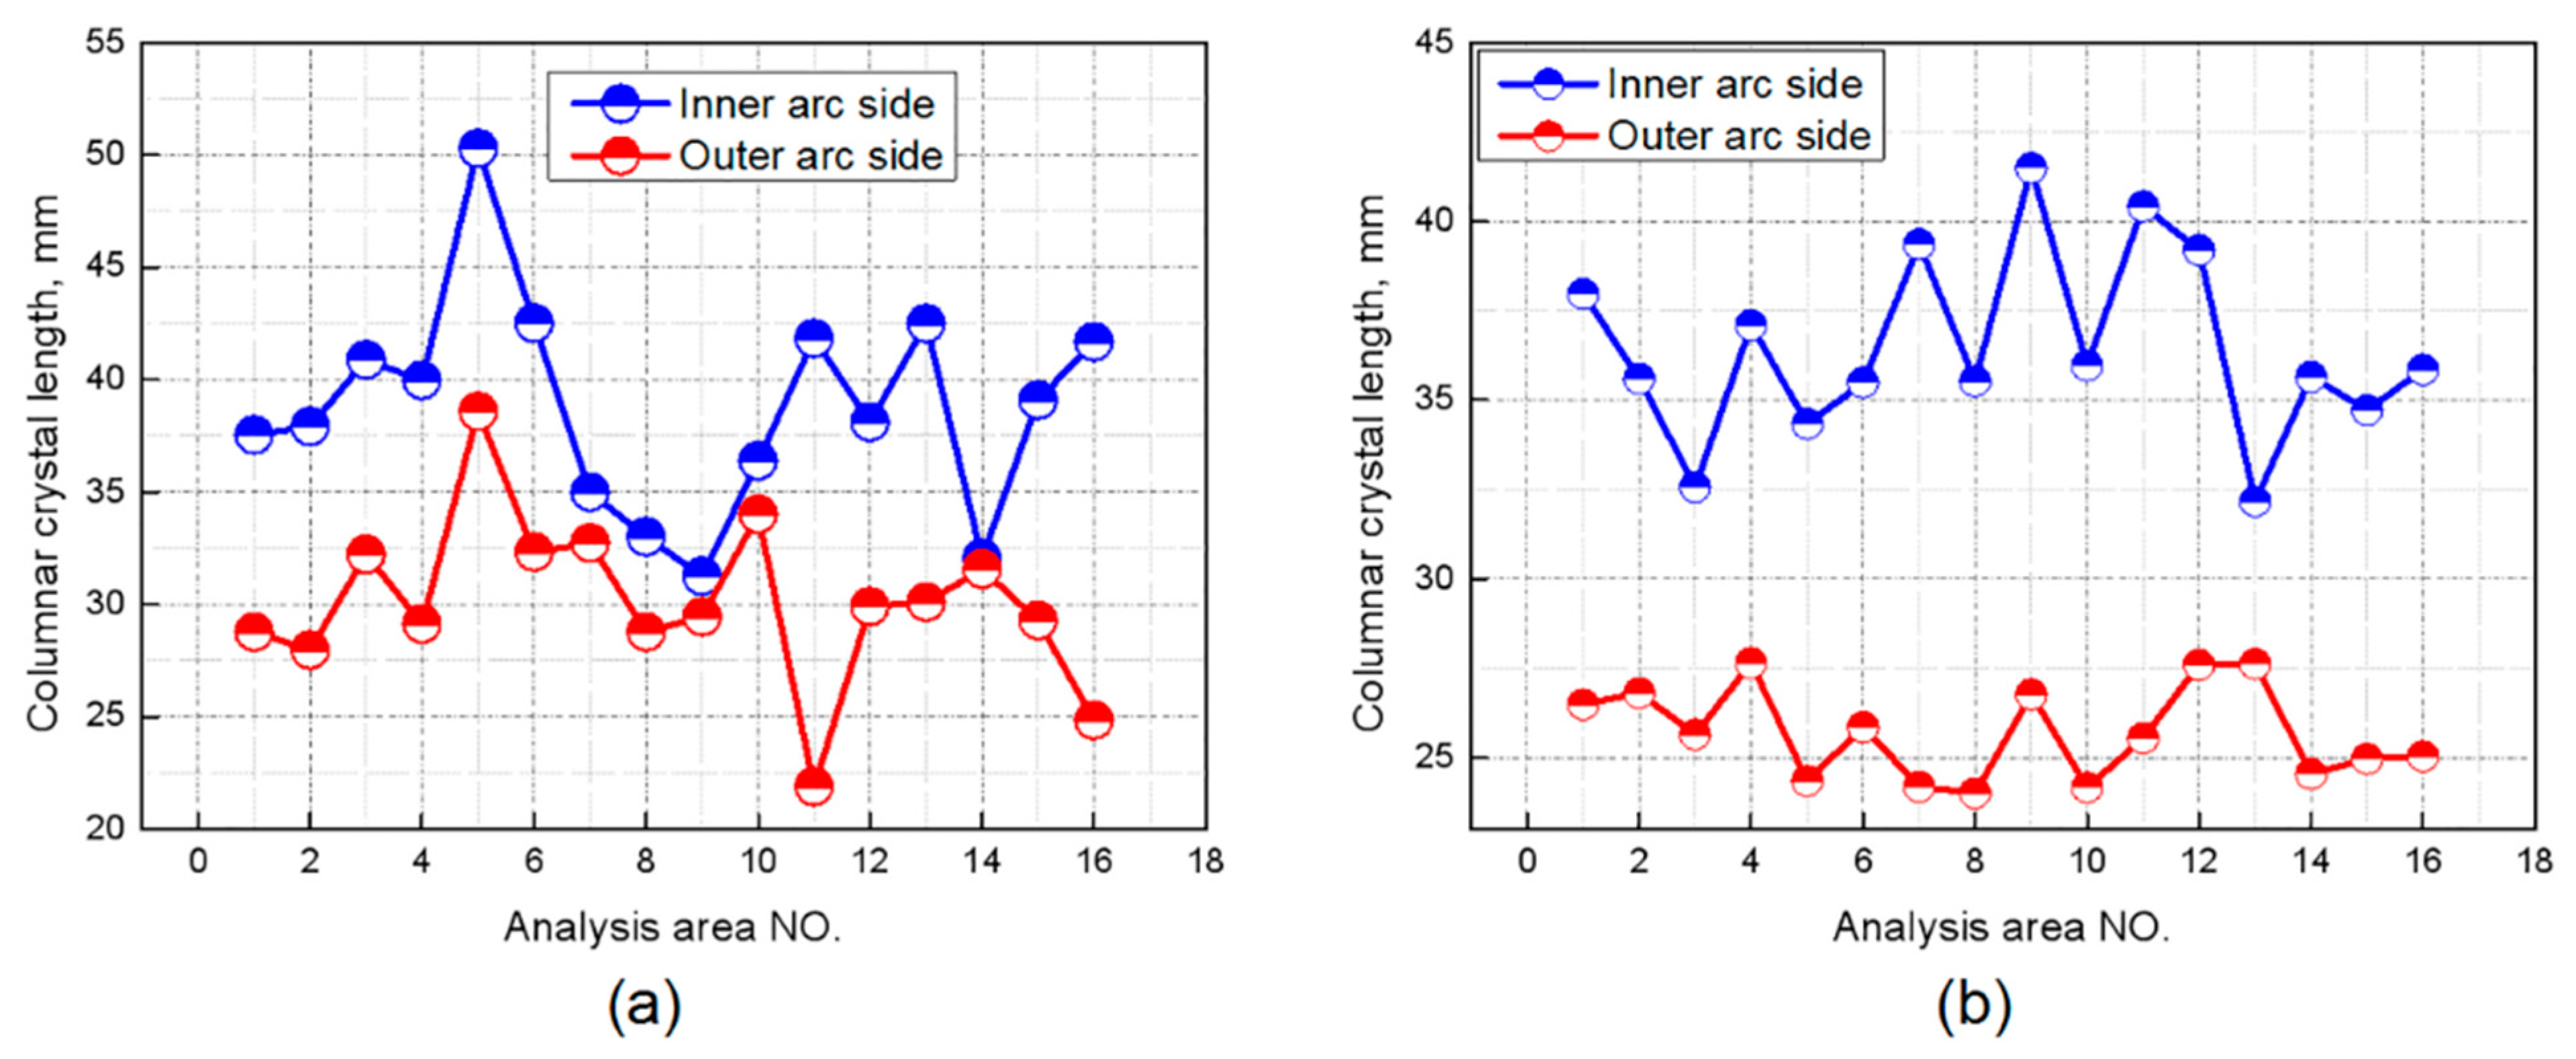
In this research, the central segregation area ratio of the two selected billet samples fluctuated with the solidification structure fluctuation, which is closely related to the CC process parameters. The major difference in the process parameters of the two selected billets is the casting speed. Therefore, it is important to investigate the effect of casting speed on the fluctuation of the solidification structure. The distribution of columnar crystal length in the inner and outer arc side of the billet samples is shown in Figure 11, it can be seen that the columnar crystal length fluctuates to different degrees. On this basis, the casting speed of two billet samples and the columnar crystal characteristics were calculated and the results are shown in Table 5. It can be seen that with the increase of the casting speed, the length and fluctuation degree of the columnar crystal, as well as the central segregation fluctuation on the vertical section of the billet are all decreased.
In the initial stage of the CC process, the columnar crystals grow from the outside to the inside and the temperature gradient gradually decreases in the solidification front. When the temperature gradient is less than a certain level, the CET occurs and equiaxed crystals begin to grow. Therefore, to investigate the effect of casting speed on the columnar crystal length fluctuation is to explore the effect of casting speed on the stability of CET positions. The CET during the solidification process of alloys can be affected by numerous factors, such as the solute concentration, melt superheat, and metal-mold heat transfer coefficient [25]. Liu et al. [26] investigated the effect of magnetic field on the CET of alloys and it is found that the application of a high magnetic field caused the deformation of dendrite and occurrence of CET. Besides, Harada et al. [27] pointed that during the CC process of steel, the solidification time is long and the fluid flow can largely affect the solidification structure, which is closely related to the casting speed in the CC process. According to previous researches, the increase of the fluid flow can increase the number of dendrites or dendrite fragments transported from the vicinity of the mold walls or melt surface into the liquid phase. On the other hand, stronger fluid flow can accelerate the elimination of the molten steel superheat and promote the equiaxed crystal nucleation. Thus, it is speculated that the unstable flow of molten steel in the billet may lead to the instability of the CET position.
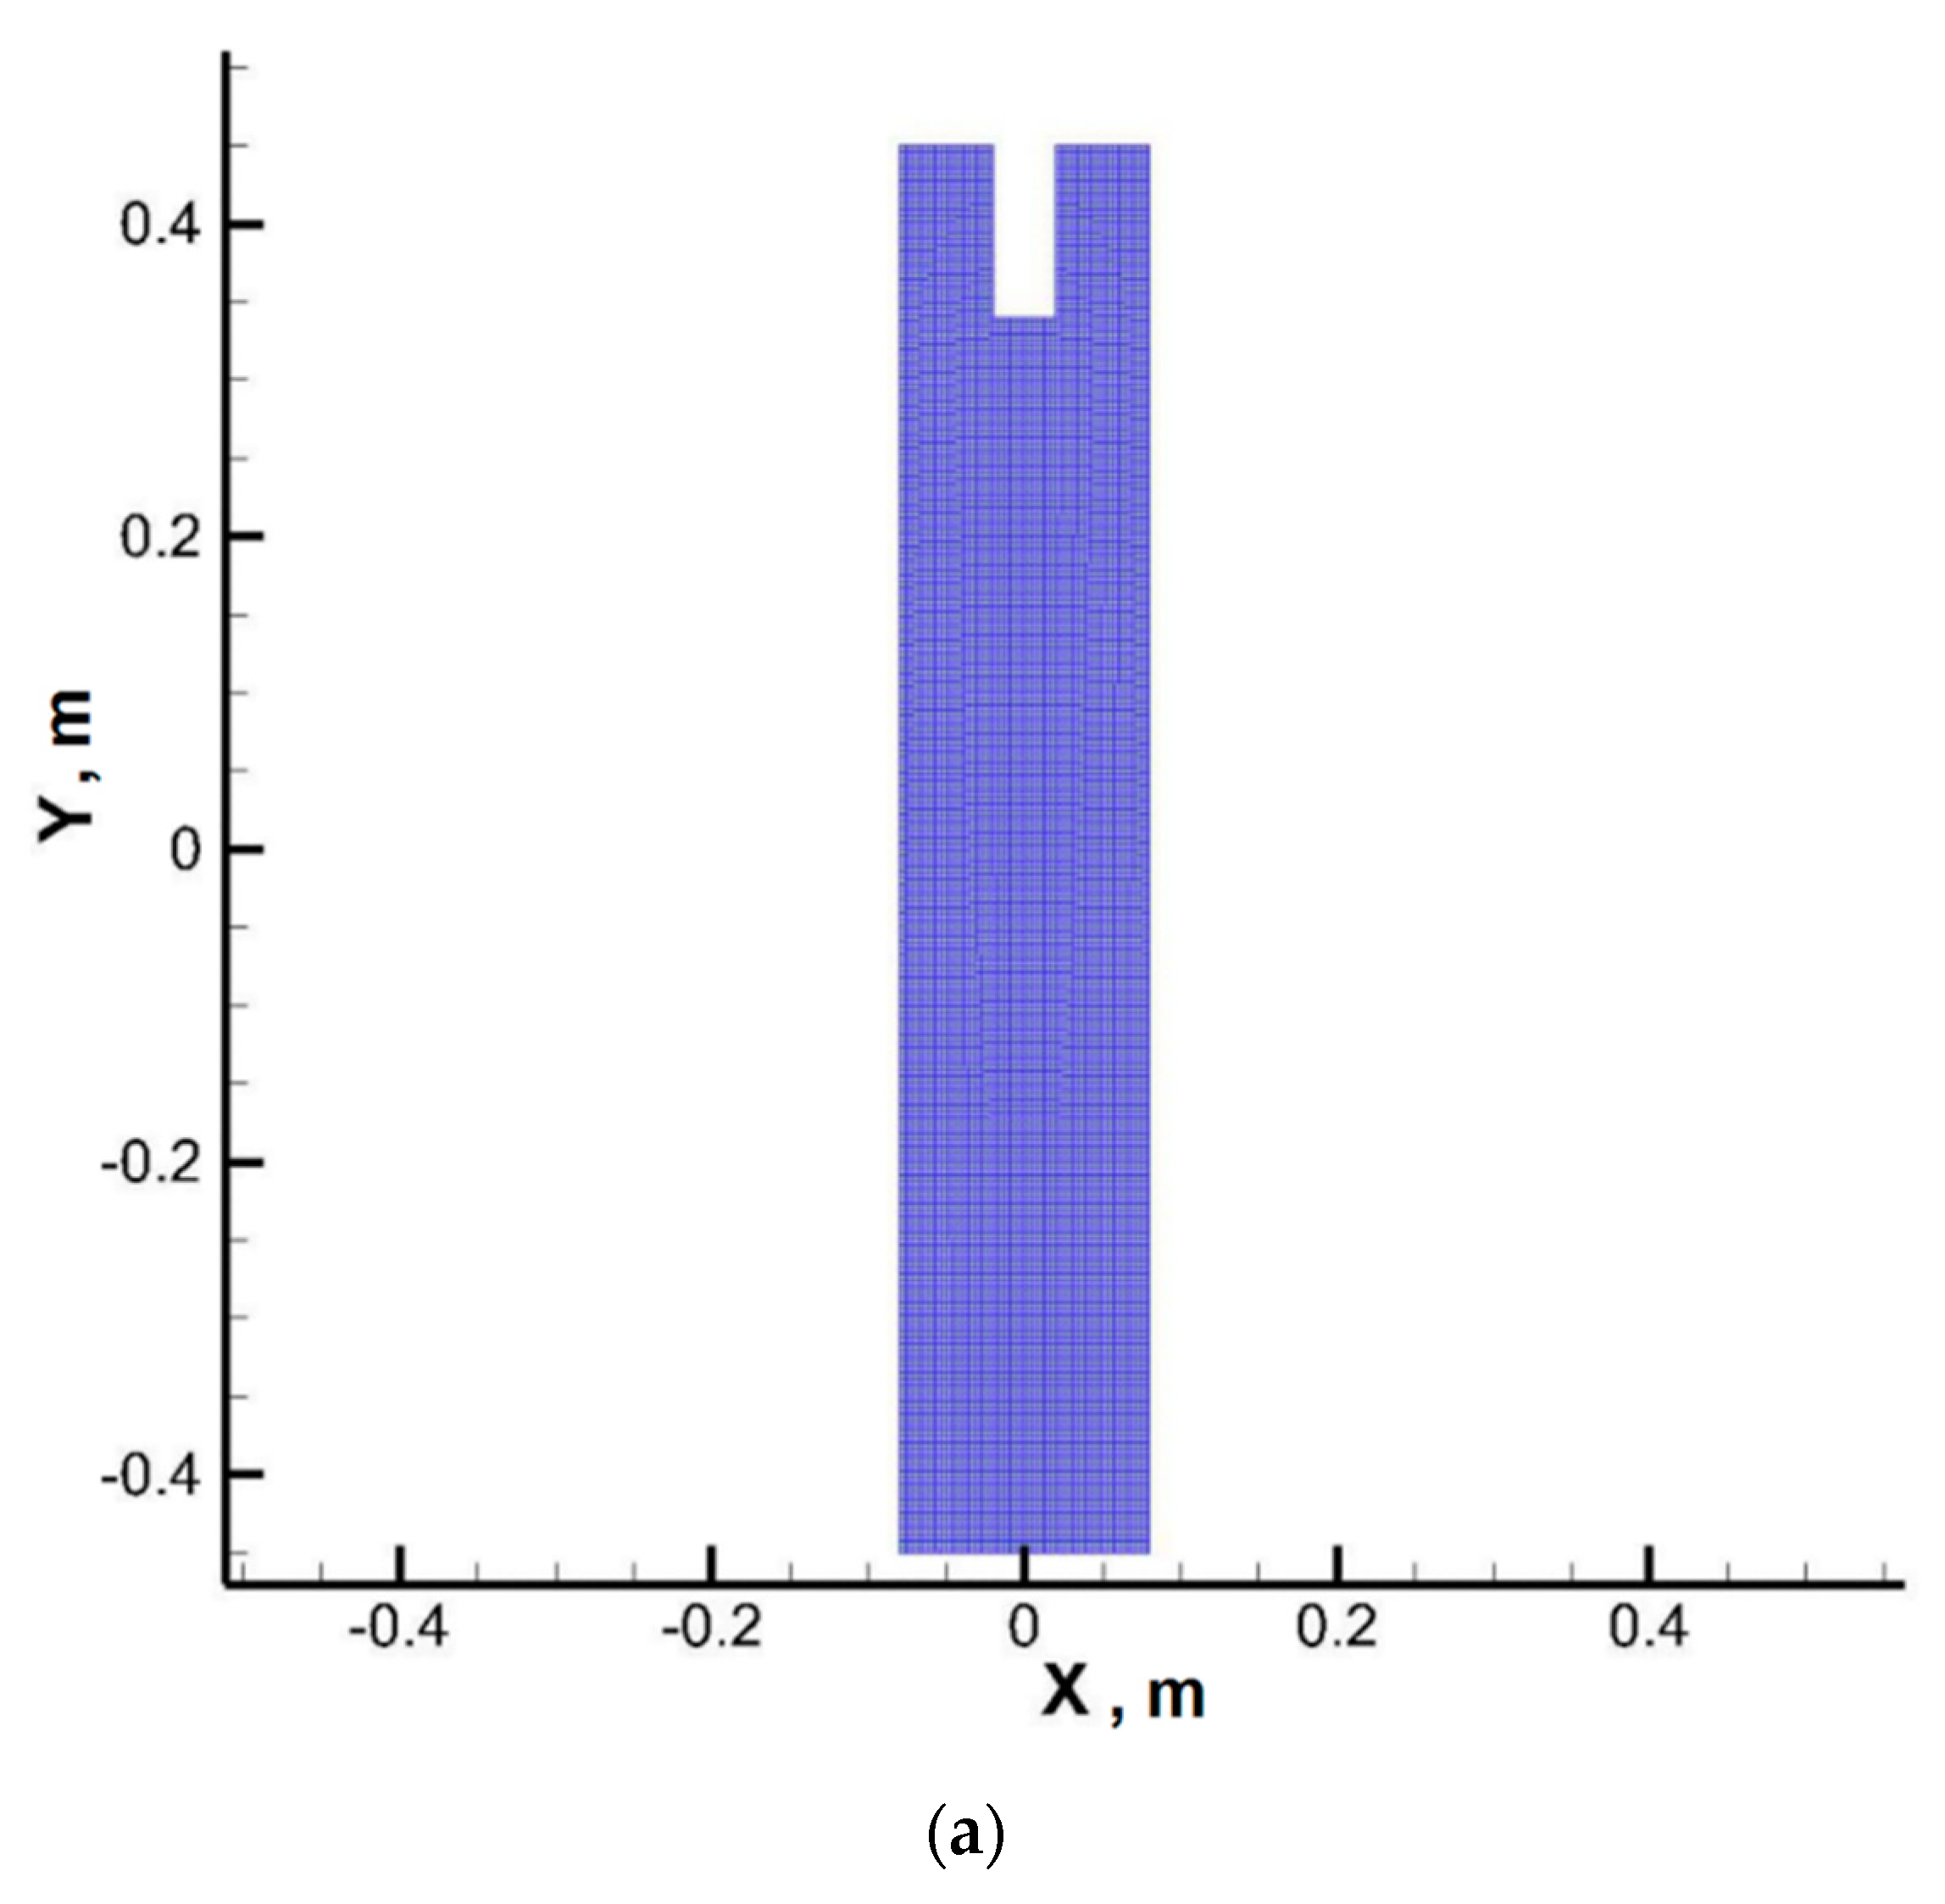
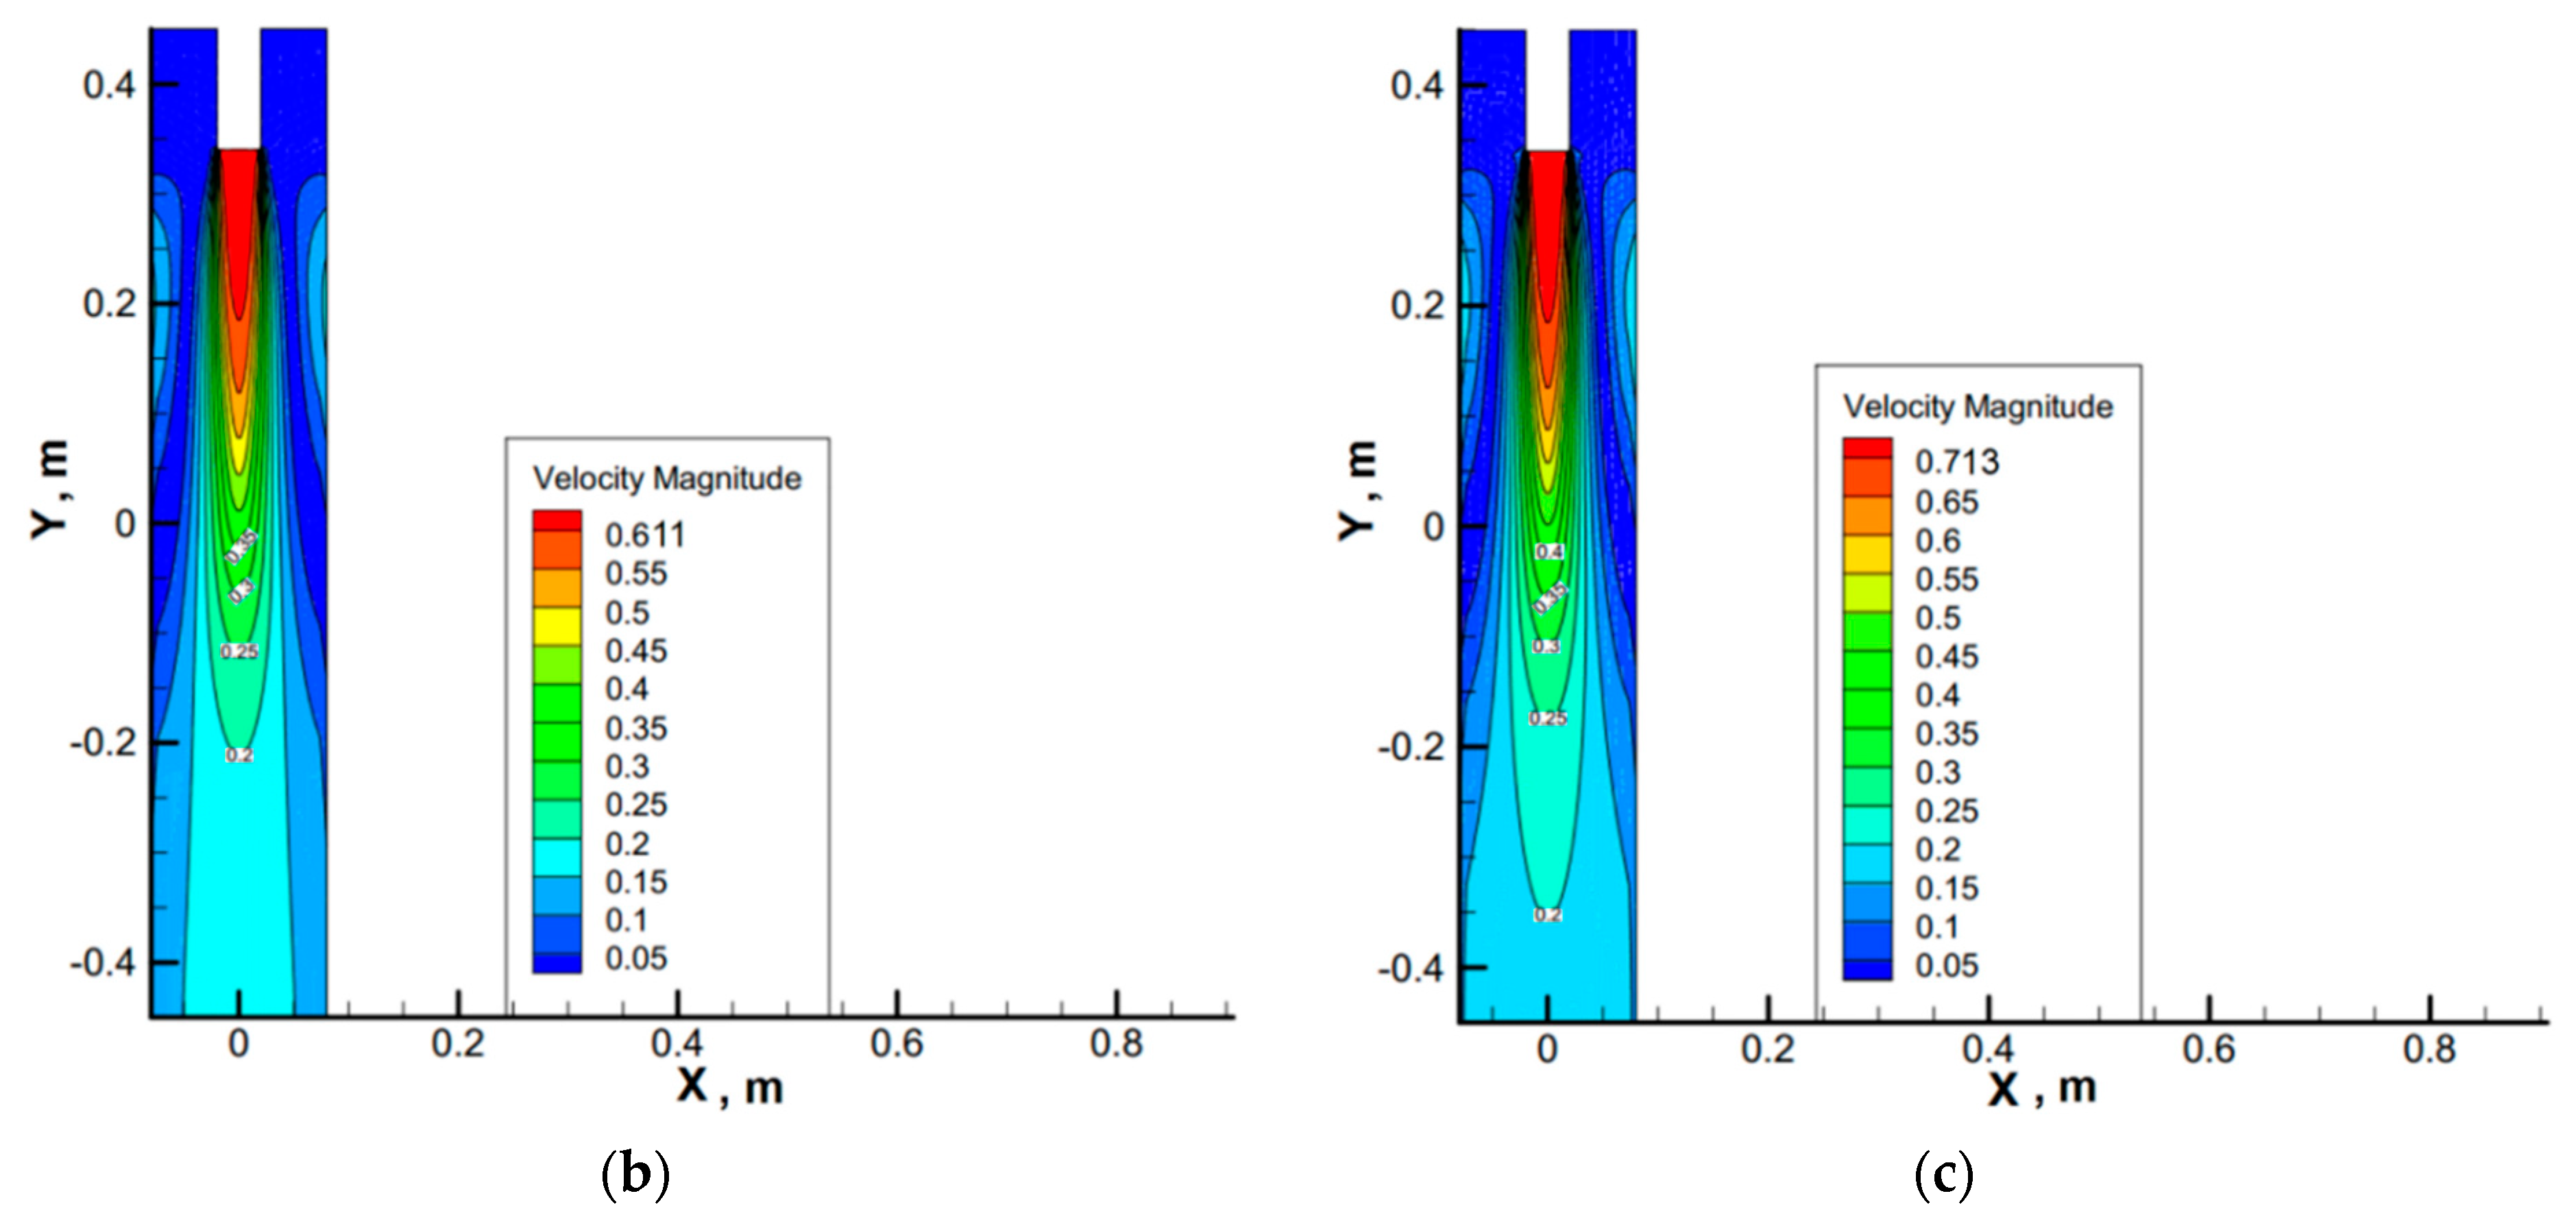
To investigate the influence of casting speed on the CET fluctuation, the mold in the CC process was selected as the research project and a two-dimensional (2–D) single-phase model has been established based on the ANSYS-FLUENT. This chapter mainly discusses the effect of casting speed on the velocity distribution of molten steel in the mold, so the model is isothermal without energy model and the standard kε turbulence model was used to solve the velocity distribution of molten steel. The computational domain, the mold, was divided into approximately 15400 cells and the size of each cell is 3 mm × 3 mm. The system was meshed using GAMBIT software and the physical properties, crucial dimensions, and parameters for the calculation are listed in Table 6. The divided cells and the calculated velocity distribution of molten steel in the mold are shown in Figure 12.
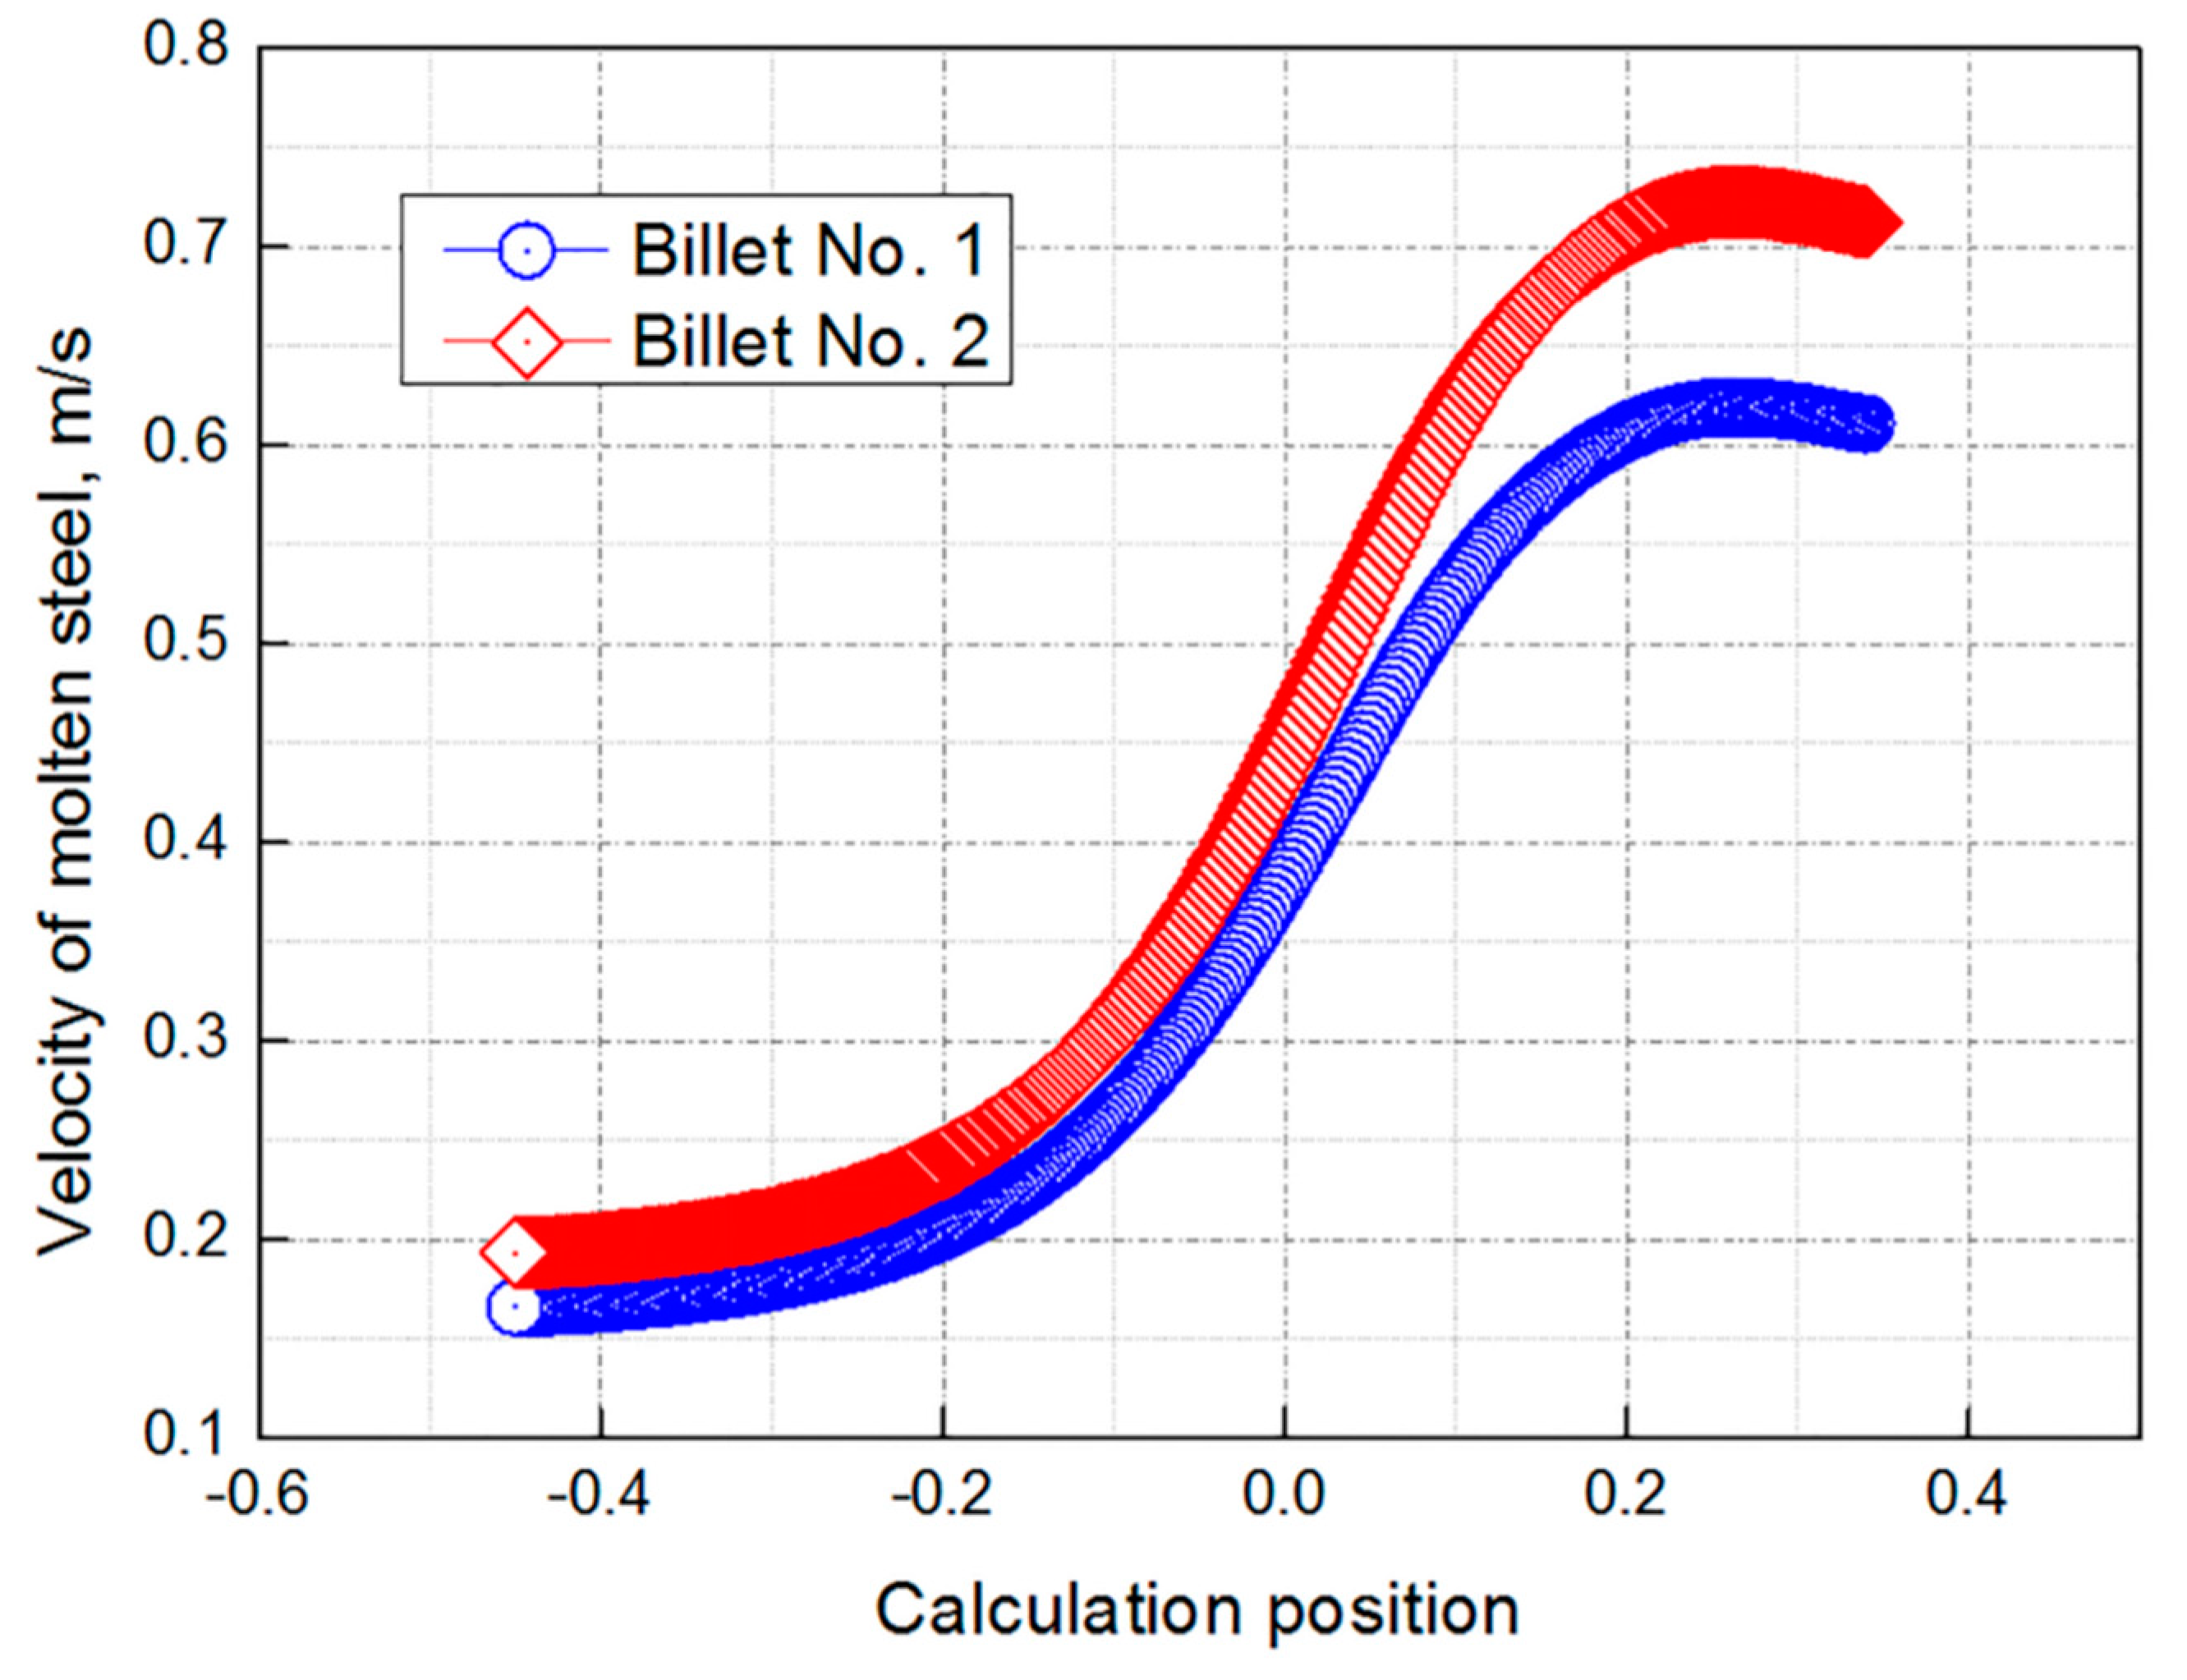
To analyze the molten steel flow in the mold, the velocity distribution of molten steel along the mold centerline was obtained, and the results are shown in Figure 13. To compare the stability of the steel flow in the mold visually and quantitatively, the velocity gradient along the mold centerline was calculated according to Equation (6).
v g = ( v 1 v 2 ) / l
where v1 is the velocity of the previous moment, m/s; v2 is the velocity of the later moment, m/s; l is the distance between v1 and v2, m.
For the two billet samples, v1 is the velocity that the molten steel flows into the mold, which can be calculated through the casting speed and throughput of molten steel. The overall velocity in mold No. 2 is relatively larger, so the velocity at the exit of mold No. 2 was selected as the v2 for two billet samples and v2 is 0.193 m/s. The results of the calculated velocity gradient are shown in Table 7. It can be seen that the velocity gradient along the centerline of mold No. 1 is larger during the CC process, which means the velocity and flow state of molten steel in the mold is more unstable. As mentioned earlier, fluid flow is one factor that affect the CET of the billet. Therefore, the CET position of the vertical section of billet No. 1 is more unstable and the columnar crystal length fluctuates more. On the contrary, the velocity and flow state of molten steel in the mold of billet No. 2 are more stable, leading to more uniform CET and the fluctuation of the columnar crystal is less, which corresponds to the measured results. On the other hand, the columnar crystal length of billet No. 2 is shorter because of the lower superheat and stronger fluid flow, which makes the front section of the columnar crystal less affected by the central flow of molten steel in the mold, so the overall fluctuation CET billet No. 2 is smaller.
Based on the above analysis of the solidification structure of billet samples and the velocity distribution of molten steel in mold, it can be concluded that the casting speed will influence the internal CET uniformity of billet to some extent during the CC process. Under the condition of higher casting speed, the flow state and velocity distribution of molten steel in the mold is more uniform and stable. In this case, the dendrites carried by the fluid flow into the liquid phase will be more uniform and the fluctuation of CET position will be decreased. When the casting speed is lower, the whole flow of molten steel is weak and the dendrites transported into the liquid phase are less, which is unfavorable to equiaxed crystal growth. Meanwhile, the velocity gradient of molten steel in the mold is larger and the velocity distribution is unstable, so the CET fluctuates greatly.

3.3. Formation Mechanism and Control Strategy of Central Segregation

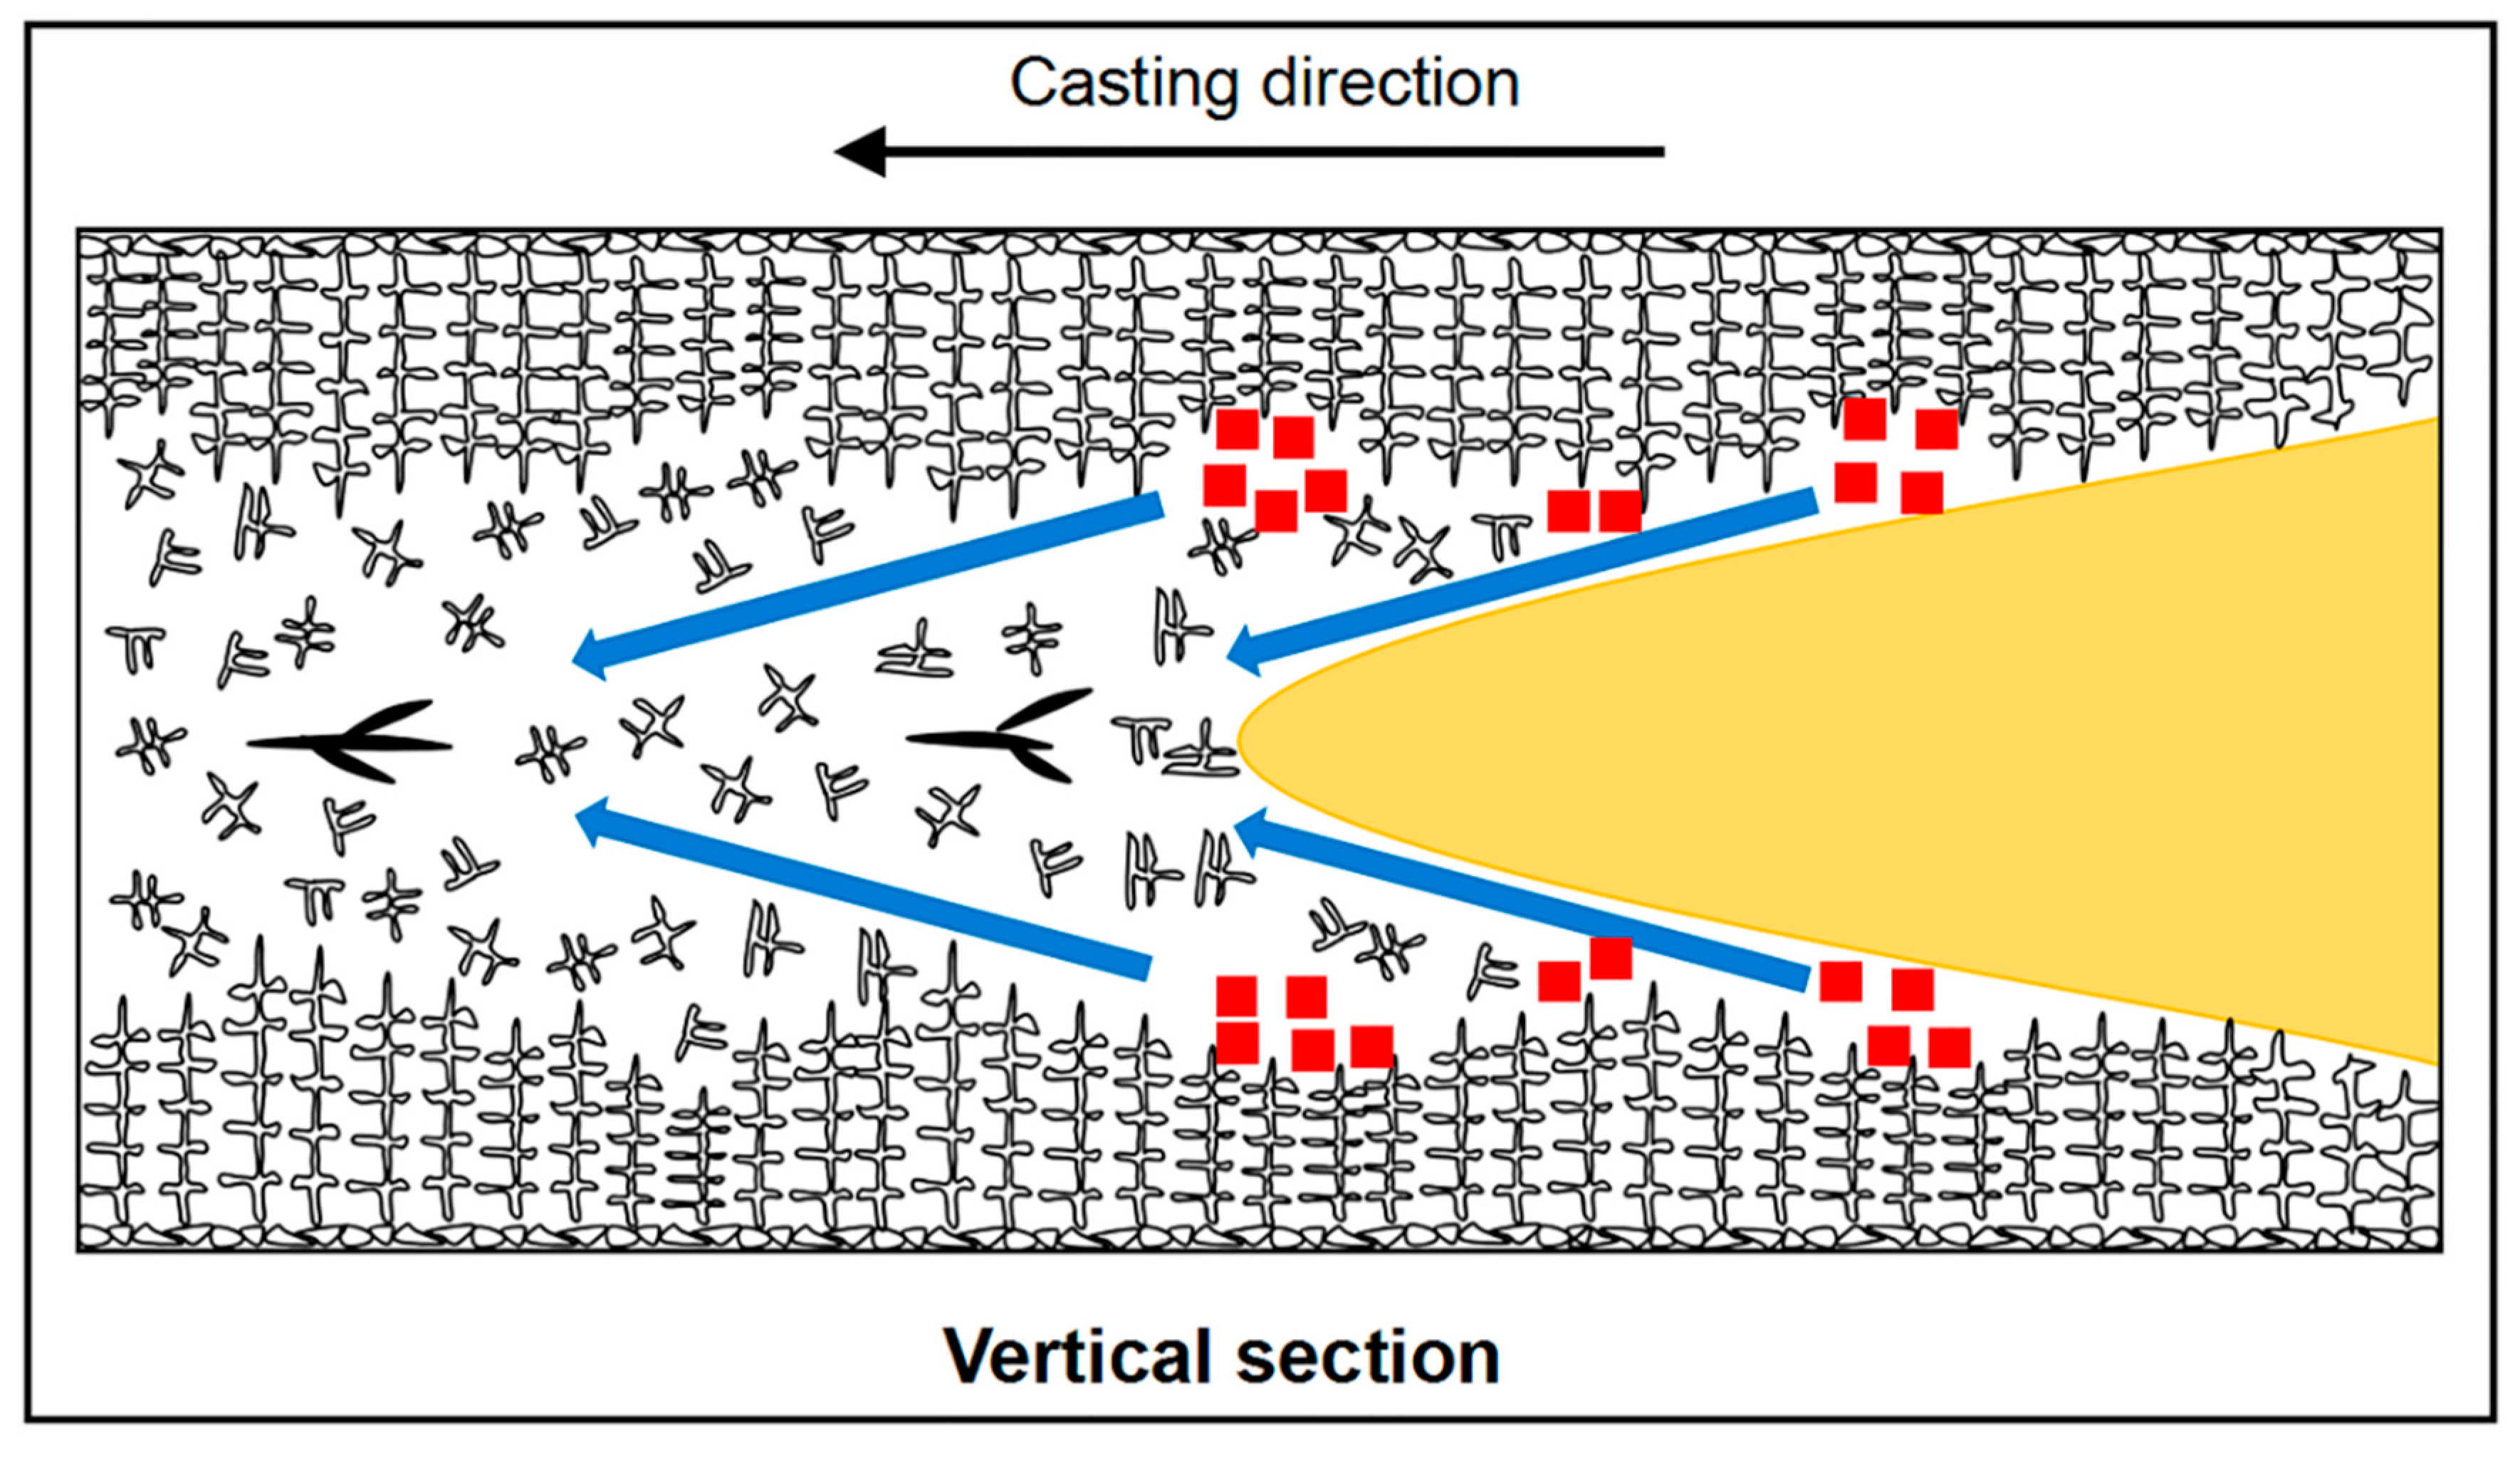
Generally, it is believed that during the solidification process of the billet, the solute elements are continuously enriched at the solid–liquid interface. At the endpoint of solidification, the solute-enriched liquid phase solidifies at the center of the billet to form the central segregation defect. In this paper, it is found that there is a fluctuation correlation between equiaxed crystal zone and central segregation. As the fluctuation of equiaxed crystal zone width increases, the central segregation fluctuation will also increase. During the CC process, the solute elements are constantly enriched at the solid–liquid interface with the columnar crystal growth. After CET, the segregated solute is distributed in the equiaxed crystal zone of the billet and finally forms central segregation with the solidification process. However, The CET on the vertical section of the billet is not uniform due to factors such as fluid flow, leading to the fluctuation of the equiaxed crystal zone and central segregation. The fluctuation of central segregation increases with the width fluctuation of the equiaxed crystal zone. On the other hand, there is a hysteretic relationship between the equiaxed crystal zone of the billet and the central segregation. This kind of hysteretic relationship can be summarized as shown in Figure 14, where the red square symbols represent the segregated solute during the solidification and blue arrows represent the main flow of segregated solute driven by solidification shrinkage. The segregated solute elements are continuously enriched and distributed in equiaxed crystal zone after CET. As the solidification process proceeds on the vertical section, the cavity formed by solidification shrinkage needs to be supplemented by the liquid phase during the solidification process. At this time, the corresponding position of the endpoint of solidification in the cross section has already solidified, so it is necessary to pump the solute-enriched liquid phase from the hysteretic equiaxed crystal zone. Therefore, the effect of solidification structure on central segregation is hysteretic. When there is more solute-enriched liquid phase at the hysteretic equiaxed crystal zone, the obvious flow channel will be formed and the defect will present obvious banded V-shaped segregation. When the solute-enriched liquid phase at the hysteretic position is less, the flow channel will be obscure, and the segregated solute will be presented as spot segregation in the central equiaxed crystal zone.
Based on the mechanism of central segregation obtained from the above analysis, the control of central segregation during the CC process may obey the principles as follows: First, to control the central segregation and improve the quality stability of CC billets, it is necessary to keep the solidification structure (columnar crystal length or equiaxed crystal zone width) stable during the CC process. The stable solidification structure can improve the uniformity of segregated solute and promote the overall quality stability of the billet. Second, in addition to the usual segregation control measures at the final stage of solidification such as electromagnetic stirring or dynamic soft reduction technology, this paper found that the control measures before the equiaxed crystal zone is completely formed might be meaningful and the V-shaped segregation defect on the vertical section of the billet can be reduced, especially when combined with the stable solidification structure along the casting direction.
In summary, the correlation between solidification structure and central segregation was investigated by statistical correlation in this paper and the central segregation mechanism of the solute element was also described. First, during the CC process, the central segregation fluctuation will increase with the fluctuation of the equiaxed crystal zone and the central segregation at a specific position can be affected by the equiaxed crystal zone width at the hysteretic position. Second, it is known that the CET position on the vertical section of the billet samples is unstable through observation and measurement. In this paper, it is found that the casting speed can affect the stability of the CET position by changing the flow uniformity of molten steel. Under higher casting speed, the velocity gradient of molten steel is smaller and the velocity distribution is more uniform, leading to a more stable CET position distribution. Finally, the solute segregation in the CC billet can be summarized as follows: The solute elements enriched in the initial stage of solidification will be distributed in the equiaxed crystal zone after CET. The fluctuation of CET determines the fluctuation of central segregation. At the end of solidification, there is a pumping effect from the endpoint of solidification to the hysteretic solute-enriched liquid phase and finally forms the central segregation. The distribution of segregated solute at the hysteretic position will determine the morphology of central segregation (V-shaped segregation or central spot segregation).

4. Conclusions

There is a fluctuating and hysteretic correlation relationship between the equiaxed crystal zone and the central segregation on the vertical section of the billet. The non-uniform equiaxed crystal zone width distribution in the CC billet will lead to stronger central segregation fluctuation along the casting direction. For a certain central area, the segregation degree along the casting direction is mainly affected by the equiaxed crystal zone at the hysteretic position and the larger the equiaxed crystal zone width, the more severe the central segregation.
(1)
During the CC process, the casting speed will influence the uniformity of the CET position by affecting the fluid flow in the billet. Under lower casting speed, the velocity gradient of molten steel along the casting direction is larger, and the flow is unstable. In this case, the distribution of the dendrites transported by the fluid flow will be also unstable, leading to the more serious fluctuation of the CET position. Under higher casting speed, the velocity gradient is smaller, thus the dendrite distribution driven by the liquid flow is more uniform, leading to a more stable distribution of CET position.
(2)
The formation mechanism of central segregation along the casting direction obtained from this research includes two aspects. First, during the CC process, solute elements are enriched at the solid–liquid interface and distributed in the equiaxed zone after CET. At this time, the fluctuation of the equiaxed crystal zone width will affect the distribution of the enriched solute in the billet and cause the fluctuation of the central segregation. Second, at the end of solidification, there is a pumping effect from the endpoint of solidification to the hysteretic solute-enriched liquid phase and finally forms the central V-shaped segregation in the central area.
(3)
During the CC process, the equiaxed crystal zone width or columnar crystal length should be kept stable to improve the quality uniformity. At the same time, the central segregation is mainly affected by the equiaxed crystal zone width at the hysteretic position. Thus, control measures applied before the equiaxed crystal zone is completely formed will be meaningful. Combined with the more stable solidification structure, the V-shaped segregation defect on the vertical section of the billet can be reduced.

Author Contributions

Data analysis, D.G.; Investigation, Z.H.; Experimental verification, Z.P.; Visualization, Q.L.; Software, J.C.; writing—original draft preparation, D.G.; writing—review and editing, Z.H. All authors have read and agreed to the published version of the manuscript.

Funding

This research was funded by United Funds between National Natural Science Foundation and Baowu Steel Group Corporation Limited from China (No. U1860101).

Data Availability Statement

Not applicable.

Acknowledgments

The authors are very grateful for support from United Funds between National Natural Science Foundation and Baowu Steel Group Corporation Limited from China (No. U1860101).

Conflicts of Interest

The authors declare no conflict of interest.

References

  1. Lage, M.G.; Silva, A.L.V.D.C.E. Evaluating segregation in HSLA steels using computational thermodynamics. J. Mater. Res. Technol. 2015, 4, 353–358. [Google Scholar] [CrossRef] [Green Version]
  2. Long, M.; Chen, D. Study on Mitigating Center Macro-Segregation During Steel Continuous Casting Process. Steel Res. Int. 2011, 82, 847–856. [Google Scholar] [CrossRef]
  3. Su, L.; Li, H.; Lu, C.; Li, J.; Fletcher, L.; Simpson, I.; Barbaro, F.; Zheng, L.; Bai, M.; Shen, J.; et al. Transverse and z-Direction CVN Impact Tests of X65 Line Pipe Steels of Two Centerline Segregation Ratings. Met. Mater. Trans. A 2016, 47, 3919–3932. [Google Scholar] [CrossRef]
  4. Guo, F.; Wang, X.; Liu, W.; Shang, C.; Misra, R.D.K.; Wang, H.; Zhao, T.; Peng, C. The Influence of Centerline Segregation on the Mechanical Performance and Microstructure of X70 Pipeline Steel. Steel Res. Int. 2018, 89, 1800407. [Google Scholar] [CrossRef]
  5. Wang, W.; Hou, Z.-B.; Chang, Y.; Cao, J.-H. Effect of superheat on quality of central equiaxed grain zone of continuously cast bearing steel billet based on two-dimensional segregation ratio. J. Iron Steel Res. Int. 2018, 25, 9–18. [Google Scholar] [CrossRef]
  6. Li, J.; Wang, B.; Ma, Y.; Cui, J. Effect of complex electromagnetic stirring on inner quality of high carbon steel bloom. Mater. Sci. Eng. A 2006, 425, 201–204. [Google Scholar] [CrossRef]
  7. Guan, R.; Ji, C.; Zhu, M. Modeling the Effect of Combined Electromagnetic Stirring Modes on Macrosegregation in Continuous Casting Blooms. Met. Mater. Trans. A 2020, 51, 1137–1153. [Google Scholar] [CrossRef]
  8. Ogibayashi, S.; Kobayashi, M.; Yamada, M.; Mukai, T. Influence of Soft Reduction with One-piece Rolls on Center Segregation in Continuously Cast Slabs. ISIJ Int. 1991, 31, 1400–1407. [Google Scholar] [CrossRef] [Green Version]
  9. Yim, C.H.; Kil Park, J.; You, B.D.; Yang, S.M. The Effect of Soft Reduction on Center Segregation in C.C. Slab. ISIJ Int. 1996, 36, S231–S234. [Google Scholar] [CrossRef]
  10. Raihle, C.-M.; Fredriksson, H. On the formation of pipes and centerline segregates in continuously cast billets. Met. Mater. Trans. A 1994, 25, 123–133. [Google Scholar] [CrossRef]
  11. Hou, Z.; Wen, G.; Tang, P.; Cheng, G. Periodicity of Carbon Element Distribution along Casting Direction in Continuous-Casting Billet by Using Singular Spectrum Analysis. Met. Mater. Trans. A 2014, 45, 1817–1826. [Google Scholar] [CrossRef]
  12. Guo, D.-W.; Hou, Z.-B.; Cao, J.-H.; Guo, Z.-A.; Chang, Y.; Wen, G.-H. Prediction of maximum carbon element content in continuous casting billets of 82B cord steel based on statistics of extreme values method. J. Iron Steel Res. Int. 2020, 27, 1–7. [Google Scholar] [CrossRef]
  13. Choudhary, S.; Ganguly, S.; Sengupta, A.; Sharma, V. Solidification morphology and segregation in continuously cast steel slab. J. Mater. Process. Technol. 2017, 243, 312–321. [Google Scholar] [CrossRef]
  14. Flemings, M.C. Our Understanding of Macrosegregation. Past and Present. ISIJ Int. 2000, 40, 833–841. [Google Scholar] [CrossRef]
  15. Xu, Z.; Wang, X.; Huang, F.; Zhou, L.; Wang, W.; Yin, Y. Semi-macro segregation and solidification structure of pipeline steel continuous casting slabs. J. Univ. Sci. Technol. Beijing 2014, 36, 751–756. [Google Scholar] [CrossRef]
  16. Hunt, J. Steady state columnar and equiaxed growth of dendrites and eutectic. Mater. Sci. Eng. 1984, 65, 75–83. [Google Scholar] [CrossRef]
  17. Shibata, H.; Itoyama, S.; Kishimoto, Y.; Takeuchi, S.; Sekiguchi, H. Prediction of Equiaxed Crystal Ratio in Continuously Cast Steel Slab by Simplified Columnar-to-Equiaxed Transition Model. ISIJ Int. 2006, 46, 921–930. [Google Scholar] [CrossRef]
  18. Niu, L.; Qiu, S.-T.; Zhao, J.-X.; Chen, Y.-Q.; Yang, S.-F. Processing parameter optimization for continuous casting of 38CrMoAl round bloom based on a prediction model of the equiaxed crystal ratio. Ironmak. Steelmak. 2018, 46, 835–844. [Google Scholar] [CrossRef]
  19. Ji, Y.; Tang, H.; Lan, P.; Shang, C.; Zhang, J. Effect of Dendritic Morphology and Central Segregation of Billet Castings on the Microstructure and Mechanical Property of Hot-Rolled Wire Rods. Steel Res. Int. 2017, 88, 1600426. [Google Scholar] [CrossRef]
  20. Li, B.; Zhang, Z.; Liu, H.; Luo, M.; Lan, P.; Tang, H.; Zhang, J. Characteristics and evolution of the spot segregations and banded defects in high strength corrosion resistant ”tube steel”. Acta. Metall. Sin. 2019, 55, 762–772. [Google Scholar] [CrossRef]
  21. Li, J.-M.; Jiang, M.-F.; Ning, J.-X.; Zhai, J. Effect of casting speed on dendrite arm spacing of Mn13 steel continuous casting slab. J. Iron Steel Res. Int. 2020, 27, 665–672. [Google Scholar] [CrossRef]
  22. El-Bealy, M.; Thomas, B.G. Prediction of dendrite arm spacing for low alloy steel casting processes. Met. Mater. Trans. A 1996, 27, 689–693. [Google Scholar] [CrossRef]
  23. Hodgson, P.; Kong, L.; Davies, C. The prediction of the hot strength in steels with an integrated phenomenological and artificial neural network model. J. Mater. Process. Technol. 1999, 87, 131–138. [Google Scholar] [CrossRef]
  24. Ji, Y.; Lan, P.; Geng, H.; He, Q.; Shang, C.; Zhang, J. Behavior of Spot Segregation in Continuously Cast Blooms and the Resulting Segregated Band in Oil Pipe Steels. Steel Res. Int. 2018, 89, 1700331. [Google Scholar] [CrossRef]
  25. Siqueira, C.; Cheung, N.; Garcia, A. The columnar to equiaxed transition during solidification of Sn–Pb alloys. J. Alloy. Compd. 2003, 351, 126–134. [Google Scholar] [CrossRef]
  26. Liu, H.; Xuan, W.; Xie, X.; Li, C.; Wang, J.; Yu, J.; Li, X.; Zhong, Y.; Ren, Z. Columnar-to-Equiaxed Transition and Equiaxed Grain Alignment in Directionally Solidified Ni3Al Alloy Under an Axial Magnetic Field. Met. Mater. Trans. A 2017, 48, 4193–4203. [Google Scholar] [CrossRef]
  27. Harada, H.; Miyazawa, K.; Matsumiya, T. Numerical modeling of columnar to equiaxed transition with consideration of molten steel flow. Int. J. Cast Met. Res. 2003, 15, 301–305. [Google Scholar] [CrossRef]
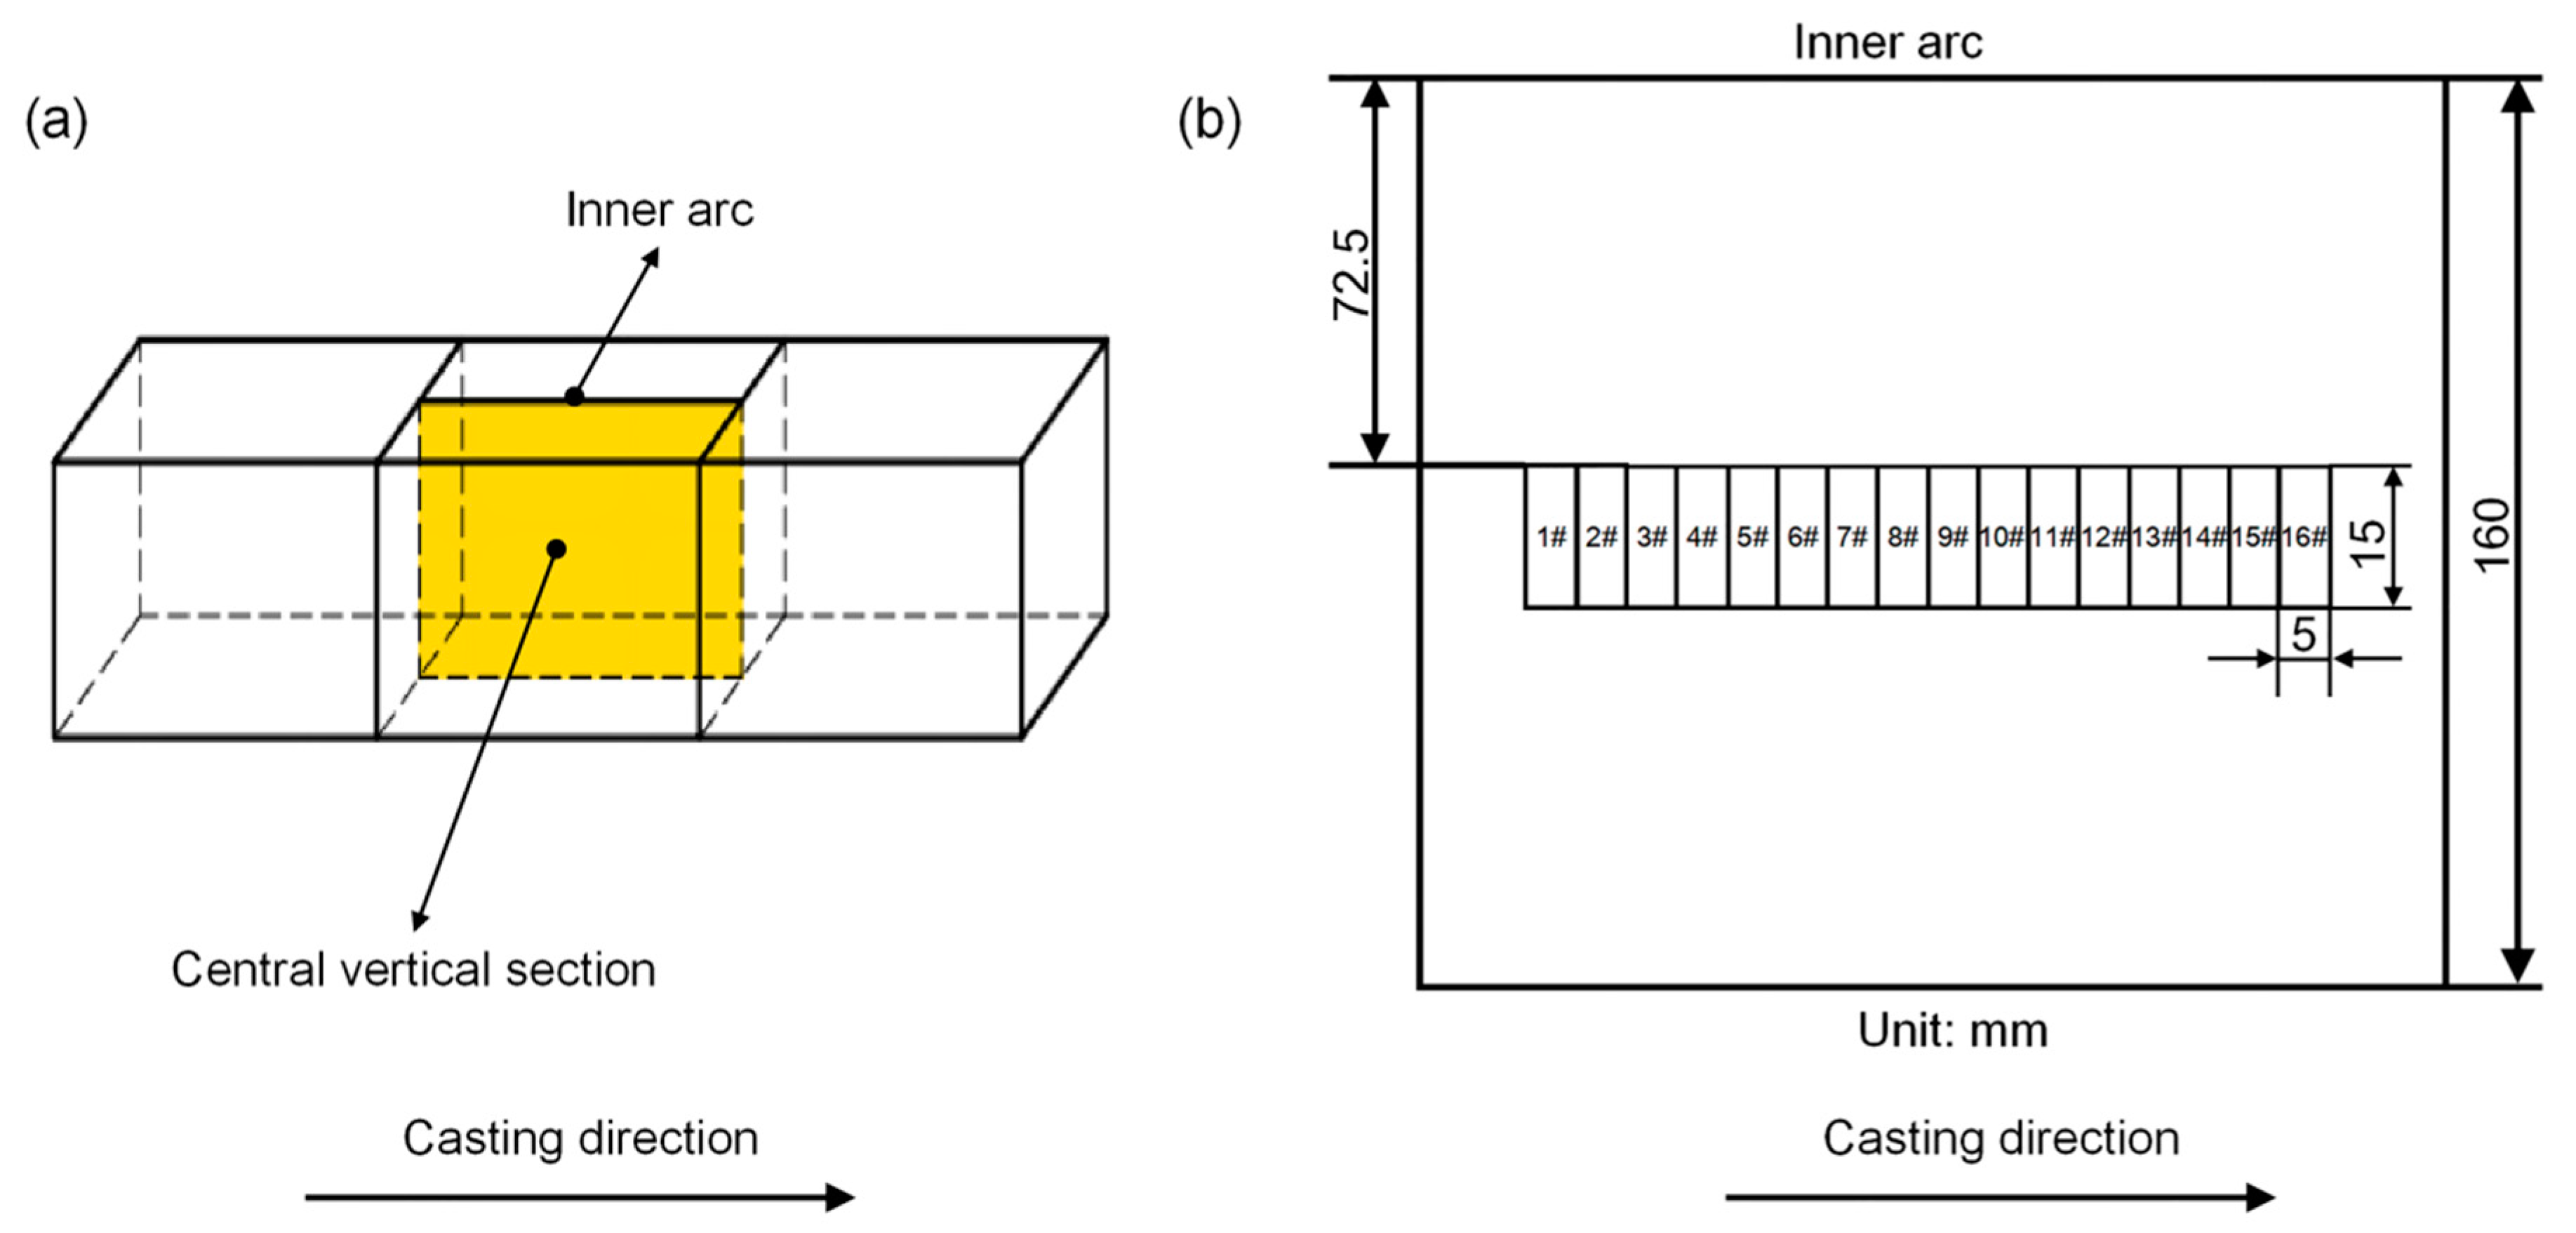
Figure 1. Schematic of central vertical section and analysis areas in continuous casting billet. (a) Two billet samples under different process parameters were cut along the centerline from inner arc side to outer arc side and the obtained central vertical sections were taken as the research objects. (b) For the obtained central vertical sections, 16 analysis areas were selected along the casting direction in the central equiaxed crystal zone. The size of each analysis area is 5 mm × 15 mm.
Metals 11 00452 g001
Figure 2. Selected analysis areas and the corresponding solidification structure of two billet samples. (a,b) show the solidification structure of the selected vertical sections of billet No. 1and 2. (c,d) show the selected analysis areas along the casting direction on the central vertical sections. The size of each analysis area is 5 mm × 15 mm.
Metals 11 00452 g002
Figure 3. Partial SDAS measurement results from the surface to center. For billet No. 1, the SDAS at analysis areas No. 1and 3 on the inner arc side and the SDAS at analysis areas No. 5 and 7 on the outer arc side are shown in (a,b), respectively. For billet No. 2, the SDAS at analysis areas No. 10and 12 on the inner arc side and the SDAS at analysis areas No. 14 and 16 on the outer arc side are shown in (c,d), respectively. The uneven selection of measurement results can explain the consistency of results.
Metals 11 00452 g003
Figure 4. Calculated equiaxd crystal zone width and central segregation area ratio of billet No. 1 (a) and billet No. 2 (b).
Metals 11 00452 g004
Figure 5. Fluctuation characteristics of solidification structure and central segregation of billet No. 1 and No. 2.
Metals 11 00452 g005
Figure 6. Distribution of the central segregation area ratio and the corresponding equiaxed crystal zone width of billet No. 1(a) and No. 2 (b).
Metals 11 00452 g006
Figure 7. Hysteretic treatment of solidification structure and central segregation. The central analysis area and the solidification structure correspond to each other is as shown in (a). When the central segregation in the analysis area is affected by the position where the hysteresis number is 1, the corresponding relationship is shown in (b). When the central segregation in the analysis area is affected by the position where the hysteresis number is 2, the corresponding relationship is shown in (c).
Metals 11 00452 g007
Figure 8. Distribution of central segregation area ratio and equiaxed crystal zone width under hysteretic conditions of billet No. 1 (a) and billet No. 2 (b). The hysteresis number of the two billet samples are 7 and 6, respectively.
Metals 11 00452 g008
Figure 9. Hysteretic angles of billet No. 1 and No. 2. The yellow triangle symbols represent the determined CET position at each position corresponding to the central analysis areas.
Metals 11 00452 g009
Figure 10. Actual V-shaped segregation angles of billet No. 1 and No. 2.
Metals 11 00452 g010
Figure 11. Measured columnar crystal length in inner and outer arc side of billet No. 1 (a) and No. 2 (b).
Metals 11 00452 g011
Figure 12. Cell division of computational domain (a) and the calculated velocity distribution of billet No. 1 (b) and No. 2 (c). The velocity that the molten steel flows into the mold can be obtained by the casting speed and the throughput of molten steel.
Metals 11 00452 g012aMetals 11 00452 g012b
Figure 13. Velocity distribution along the centerline from the submerged entry nozzle to the end of the mold.
Metals 11 00452 g013
Figure 14. The formation mechanism of central segregation in cold heading steel billet, in which the red square symbols represent the segregated solute during the solidification and blue arrows represent the main flow of segregated solute driven by solidification shrinkage.
Metals 11 00452 g014
Table 1. Main process parameters of SCM440 cold heading steel billet.
SampleSuperheat, °CCasting Speed, m/minSpecific Water Amount, L/kg
No. 1421.80.68
No. 2402.10.68
Table 2. Pearson correlation coefficient under different hysteresis numbers of billet No. 1 and billet No. 2.
Billet No. 1Billet No. 2
Hyteresis NumbersPearson Correlation CoefficientSignificance Level αHyteresis NumbersPearson Correlation CoefficientSignificace Level α
0−0.0680.8030−0.1990.460
1−0.3190.2471−0.1900.497
2−0.4850.0792−0.4950.072
3−0.4580.11630.1810.555
4−0.2200.49240.2540.425
50.2190.51850.1750.607
60.5920.07160.5400.107
70.6730.0477−0.2570.505
80.6190.10280.4430.271
Table 3. Average central segregation area ratio and equiaxed crystal zone width of billet No. 1 and No. 2.
SampleAverage Central Segregation Area Ratio, %Average Equiaxed Crystal Zone Width, mm
No. 135.1196.83
No. 244.50105.88
Table 4. Comparison of hysteretic angle and V-shaped segregation angle of billet No. 1 and No. 2.
Billet No. 1Billet No. 2
Average hysteretic angle, °89.67Average hysteretic angle, °103.90
Average V-shaped segregation angle, °94.33Average V-shaped segregation angle, °102.67
Relative error, % 4.95Relative error, % 1.20
Table 5. Variation coefficient of columnar crystal length of billet No. 1 and No. 2.
Characteristics ParametersBillet No. 1Billet No. 2
Casting speed, m/min1.82.1
Variation coefficient of central segregation area ratio0.15990.0772
Variation coefficient of columnar crystal lengthInner arc side0.11920.0701
Outer arc side0.12060.0493
Average columnar crystal length/mmInner arc side38.7536.46
Outer arc side30.1025.71
Table 6. Main parameters in the current calculation.
ParametersValues
Model Length, m0.9
Model Width, m0.16
Submerged Depth, m0.11
Density, kg/m37020
Viscosity, Pa × s0.0067
Table 7. Velocity discrepancy and gradient of molten steel when the velocity decreases to 0.193 m/s.
SamplesVelocity Discrepancy, m/sDistance Corresponding to Velocity Discrepancy, mVelocity Gradient, s−1
Billet No. 10.4180.5670.737
Billet No. 20.5200.7900.658
Publisher’s Note: MDPI stays neutral with regard to jurisdictional claims in published maps and institutional affiliations.