
Effects of Multi-Axial Compression on the Mechanical and Fretting Wear Properties of Ti-45Nb Alloys


Abstract
:
1. Introduction
2. Materials and Methods
2.1. Materials
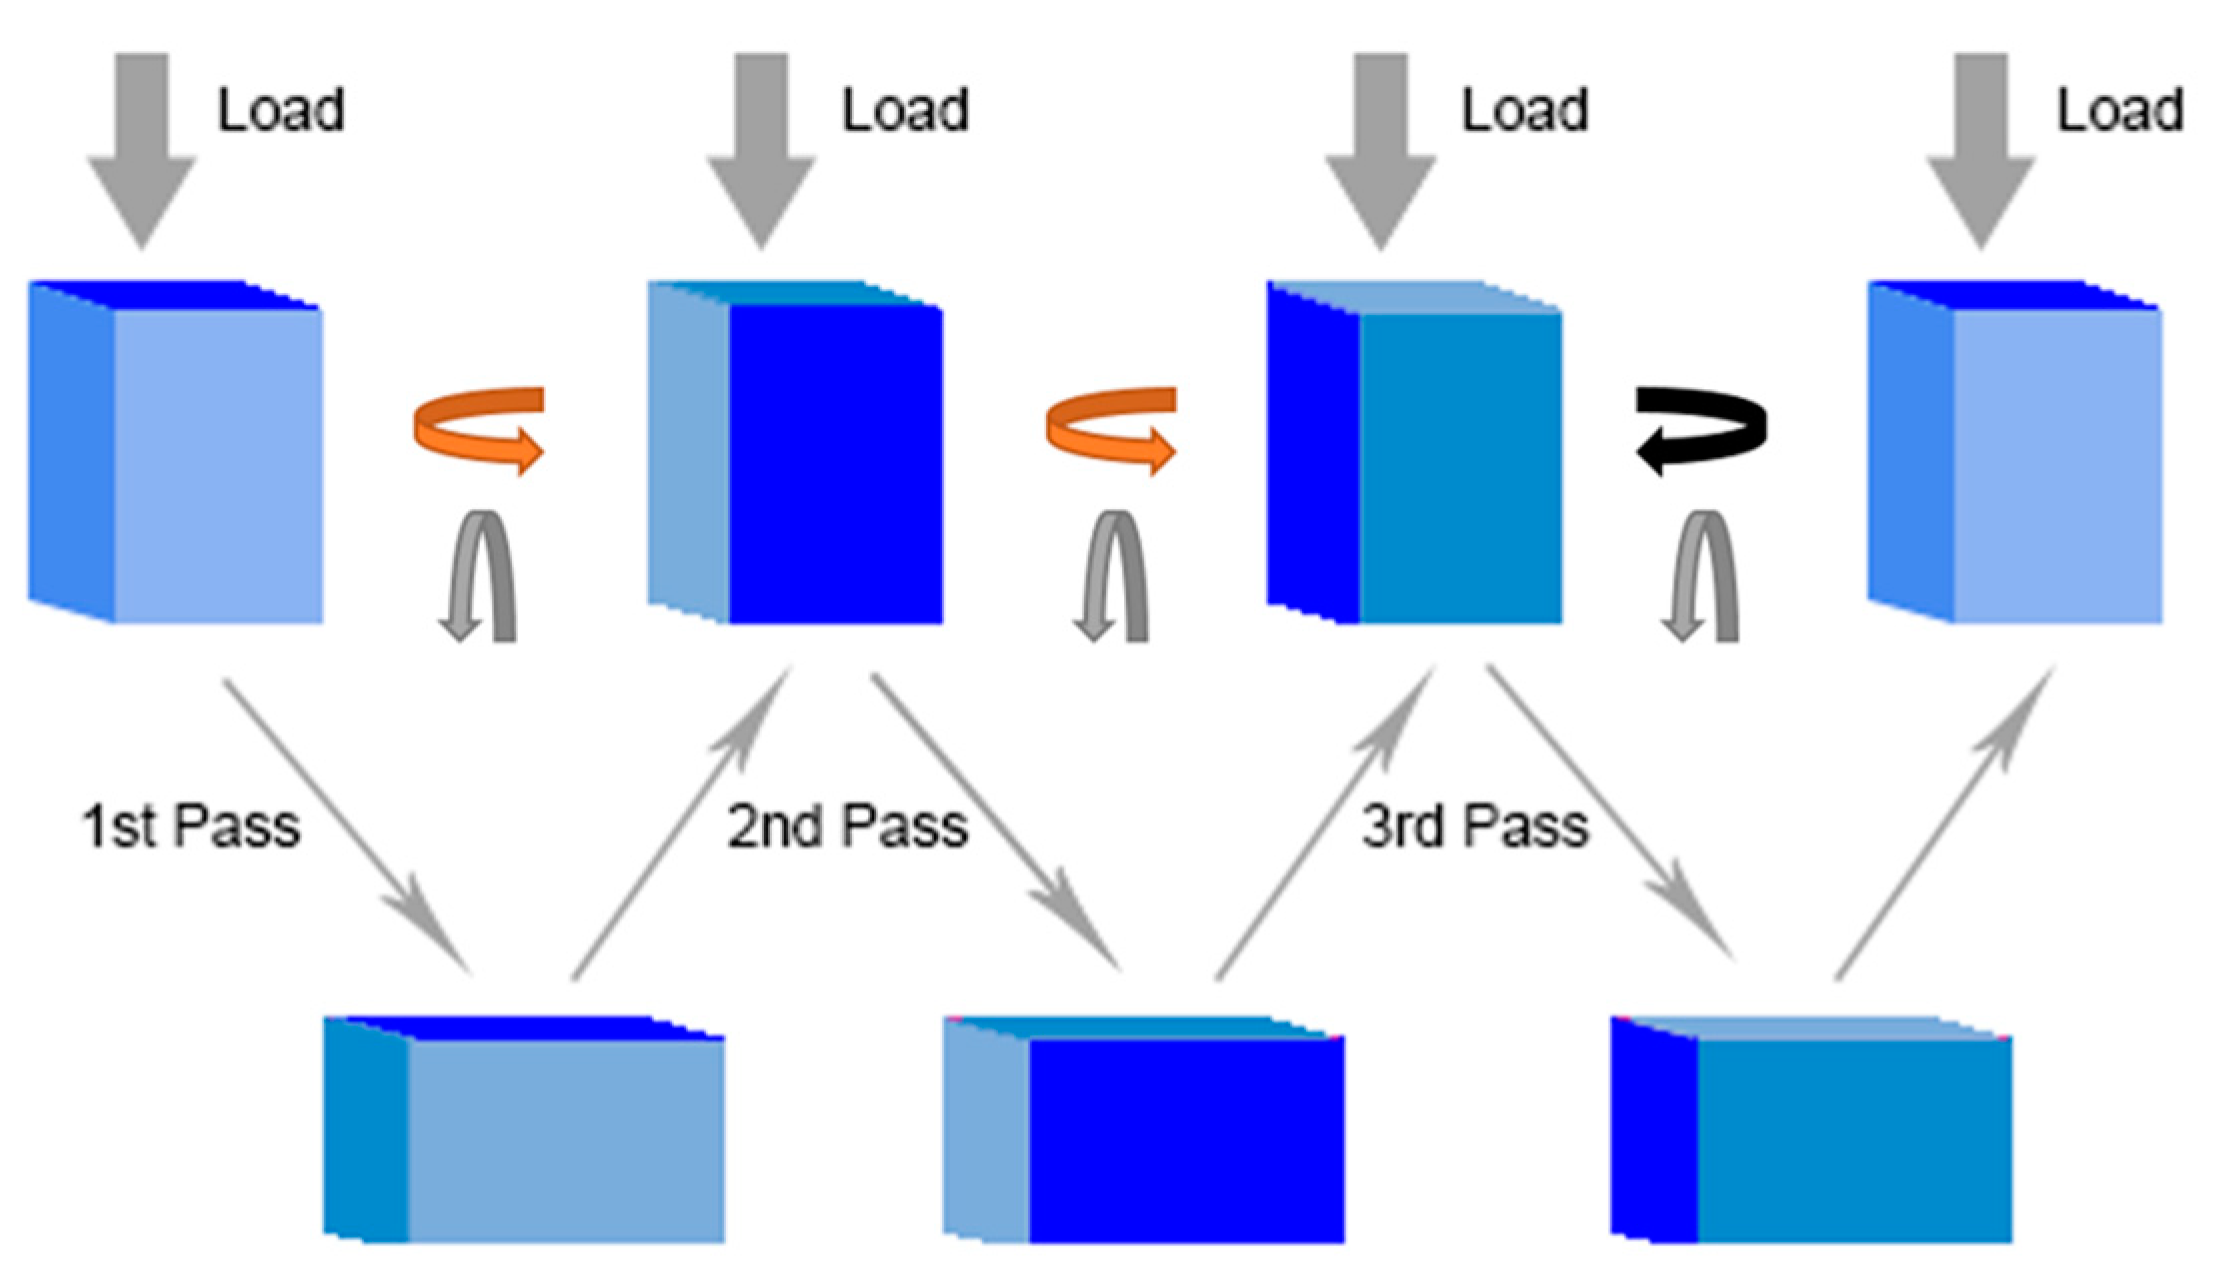
2.2. MAC Processing
2.3. Microstructure and Mechanical Properties
2.4. Fretting Test
3. Results and Discussion
3.1. Microstructure Evolution
3.2. Mechanical Properties
3.3. Fretting Wear Behavior
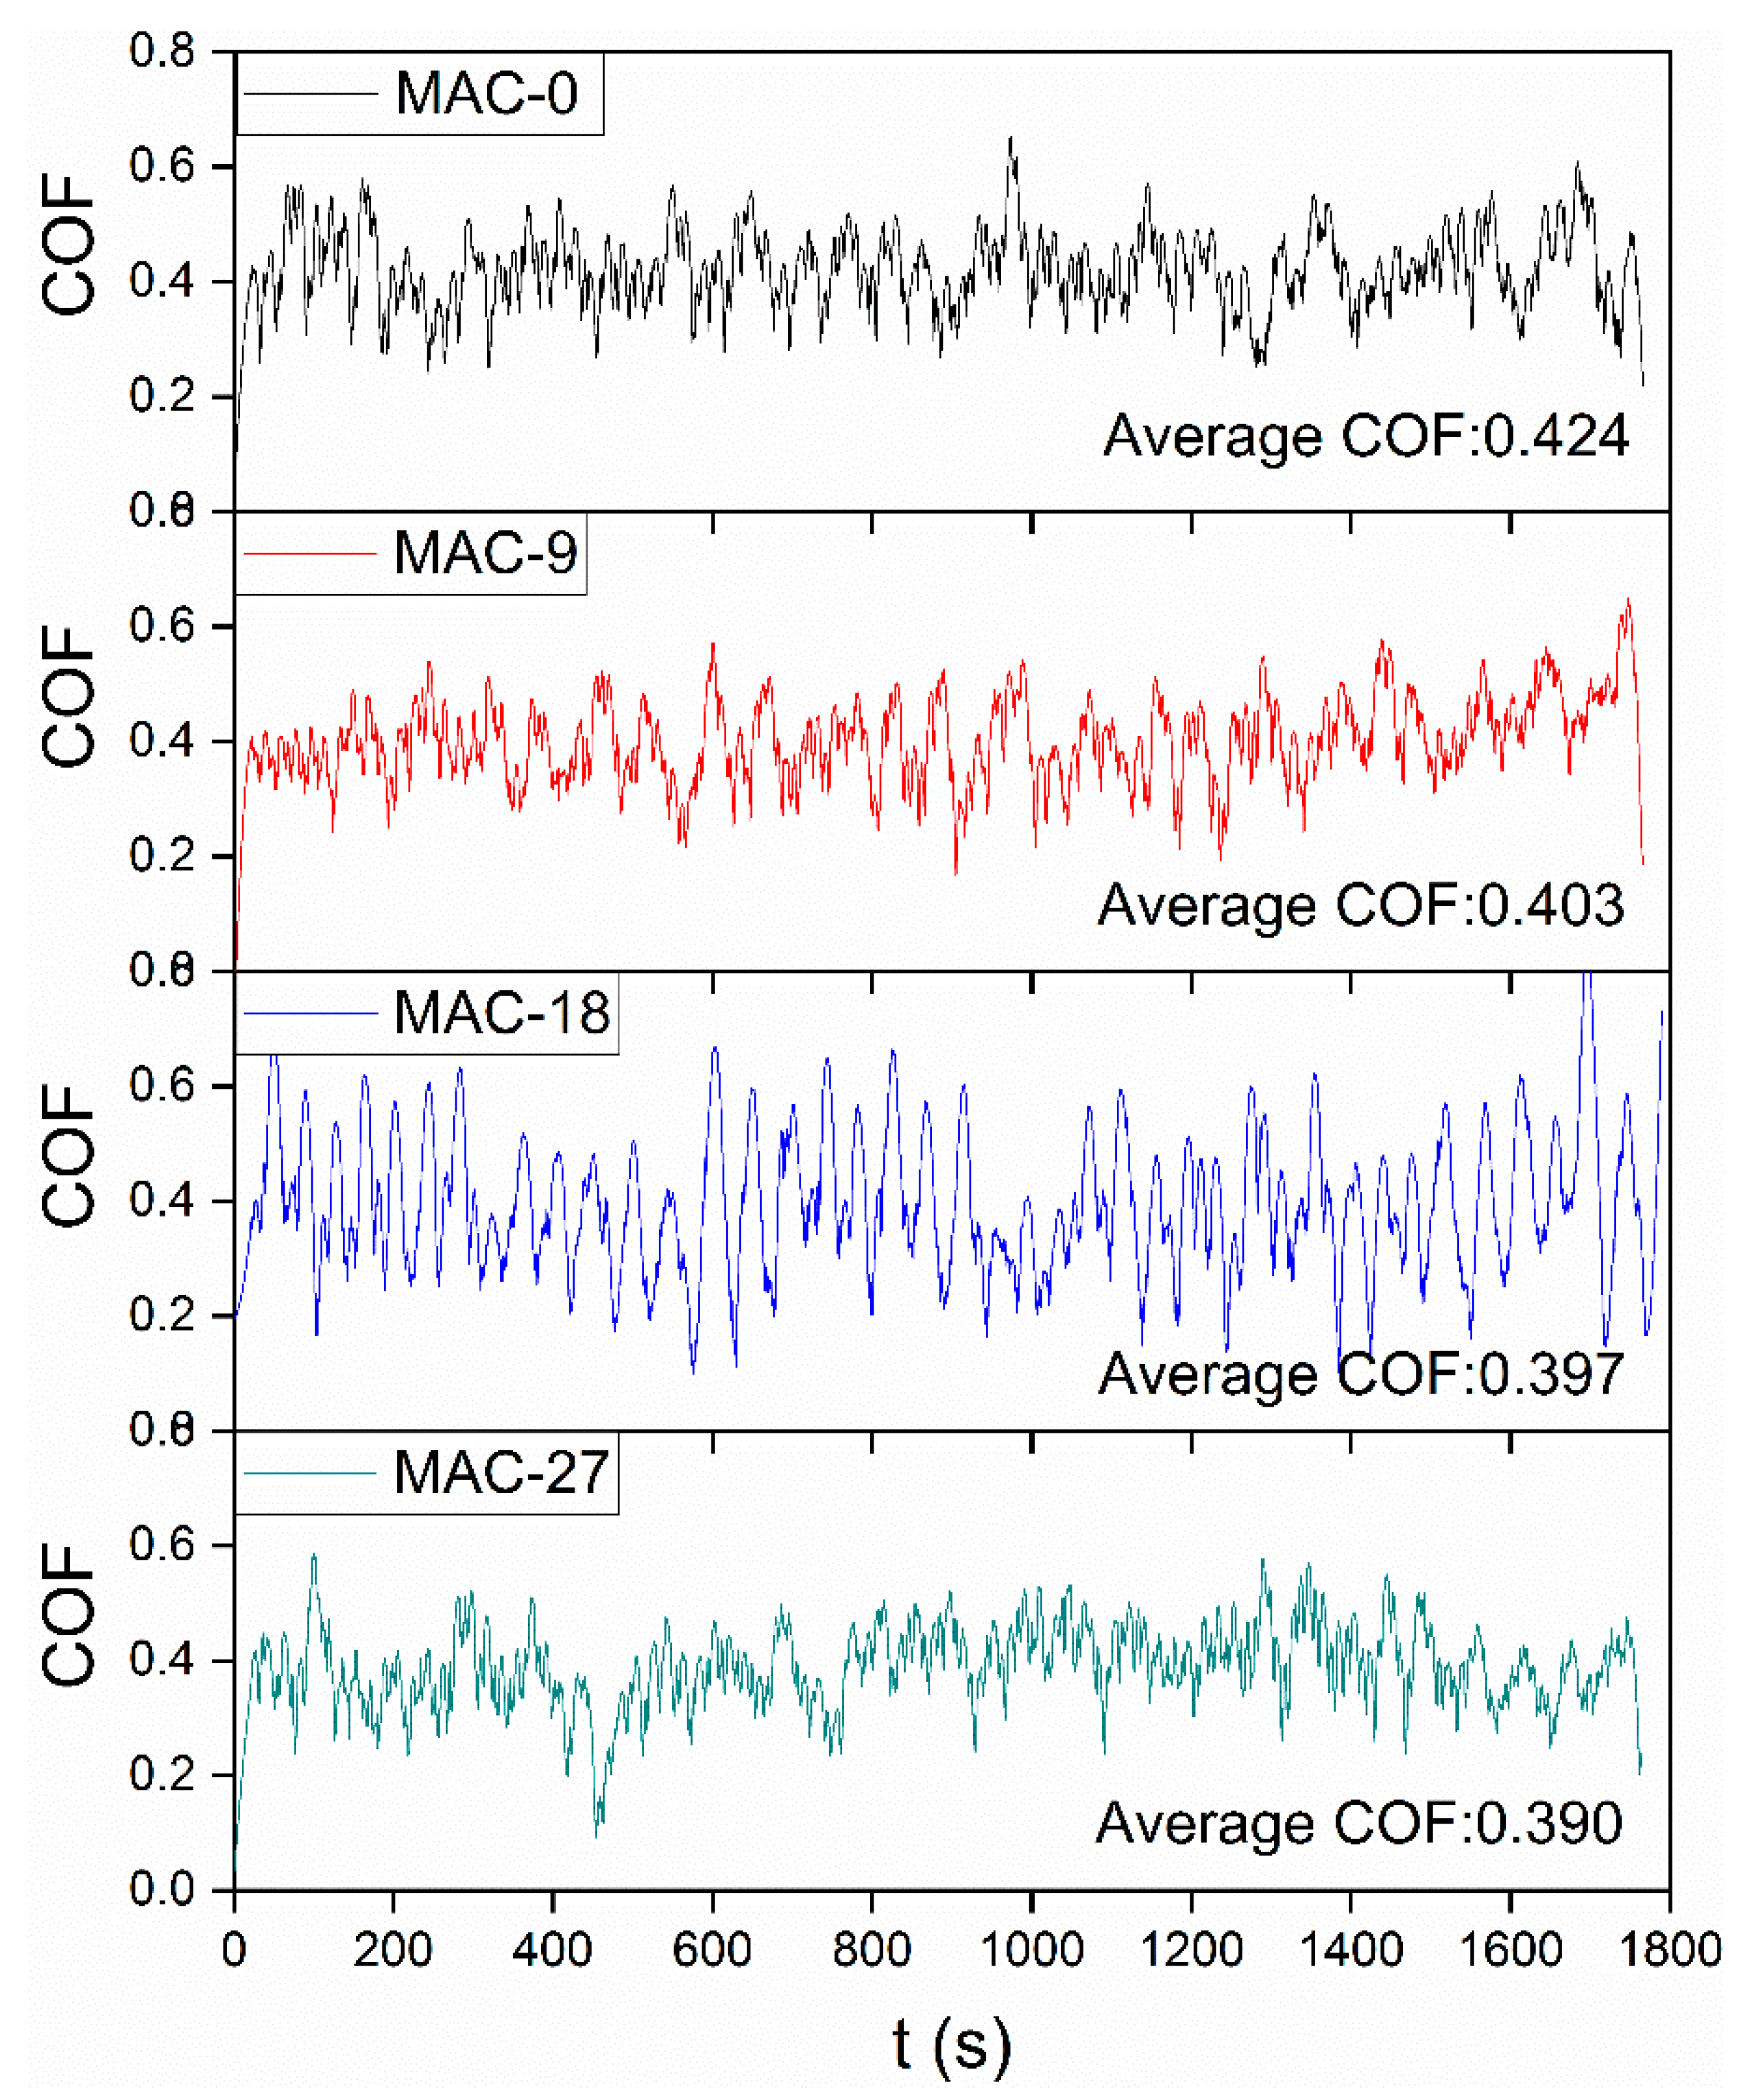
3.3.1. Friction Coefficient
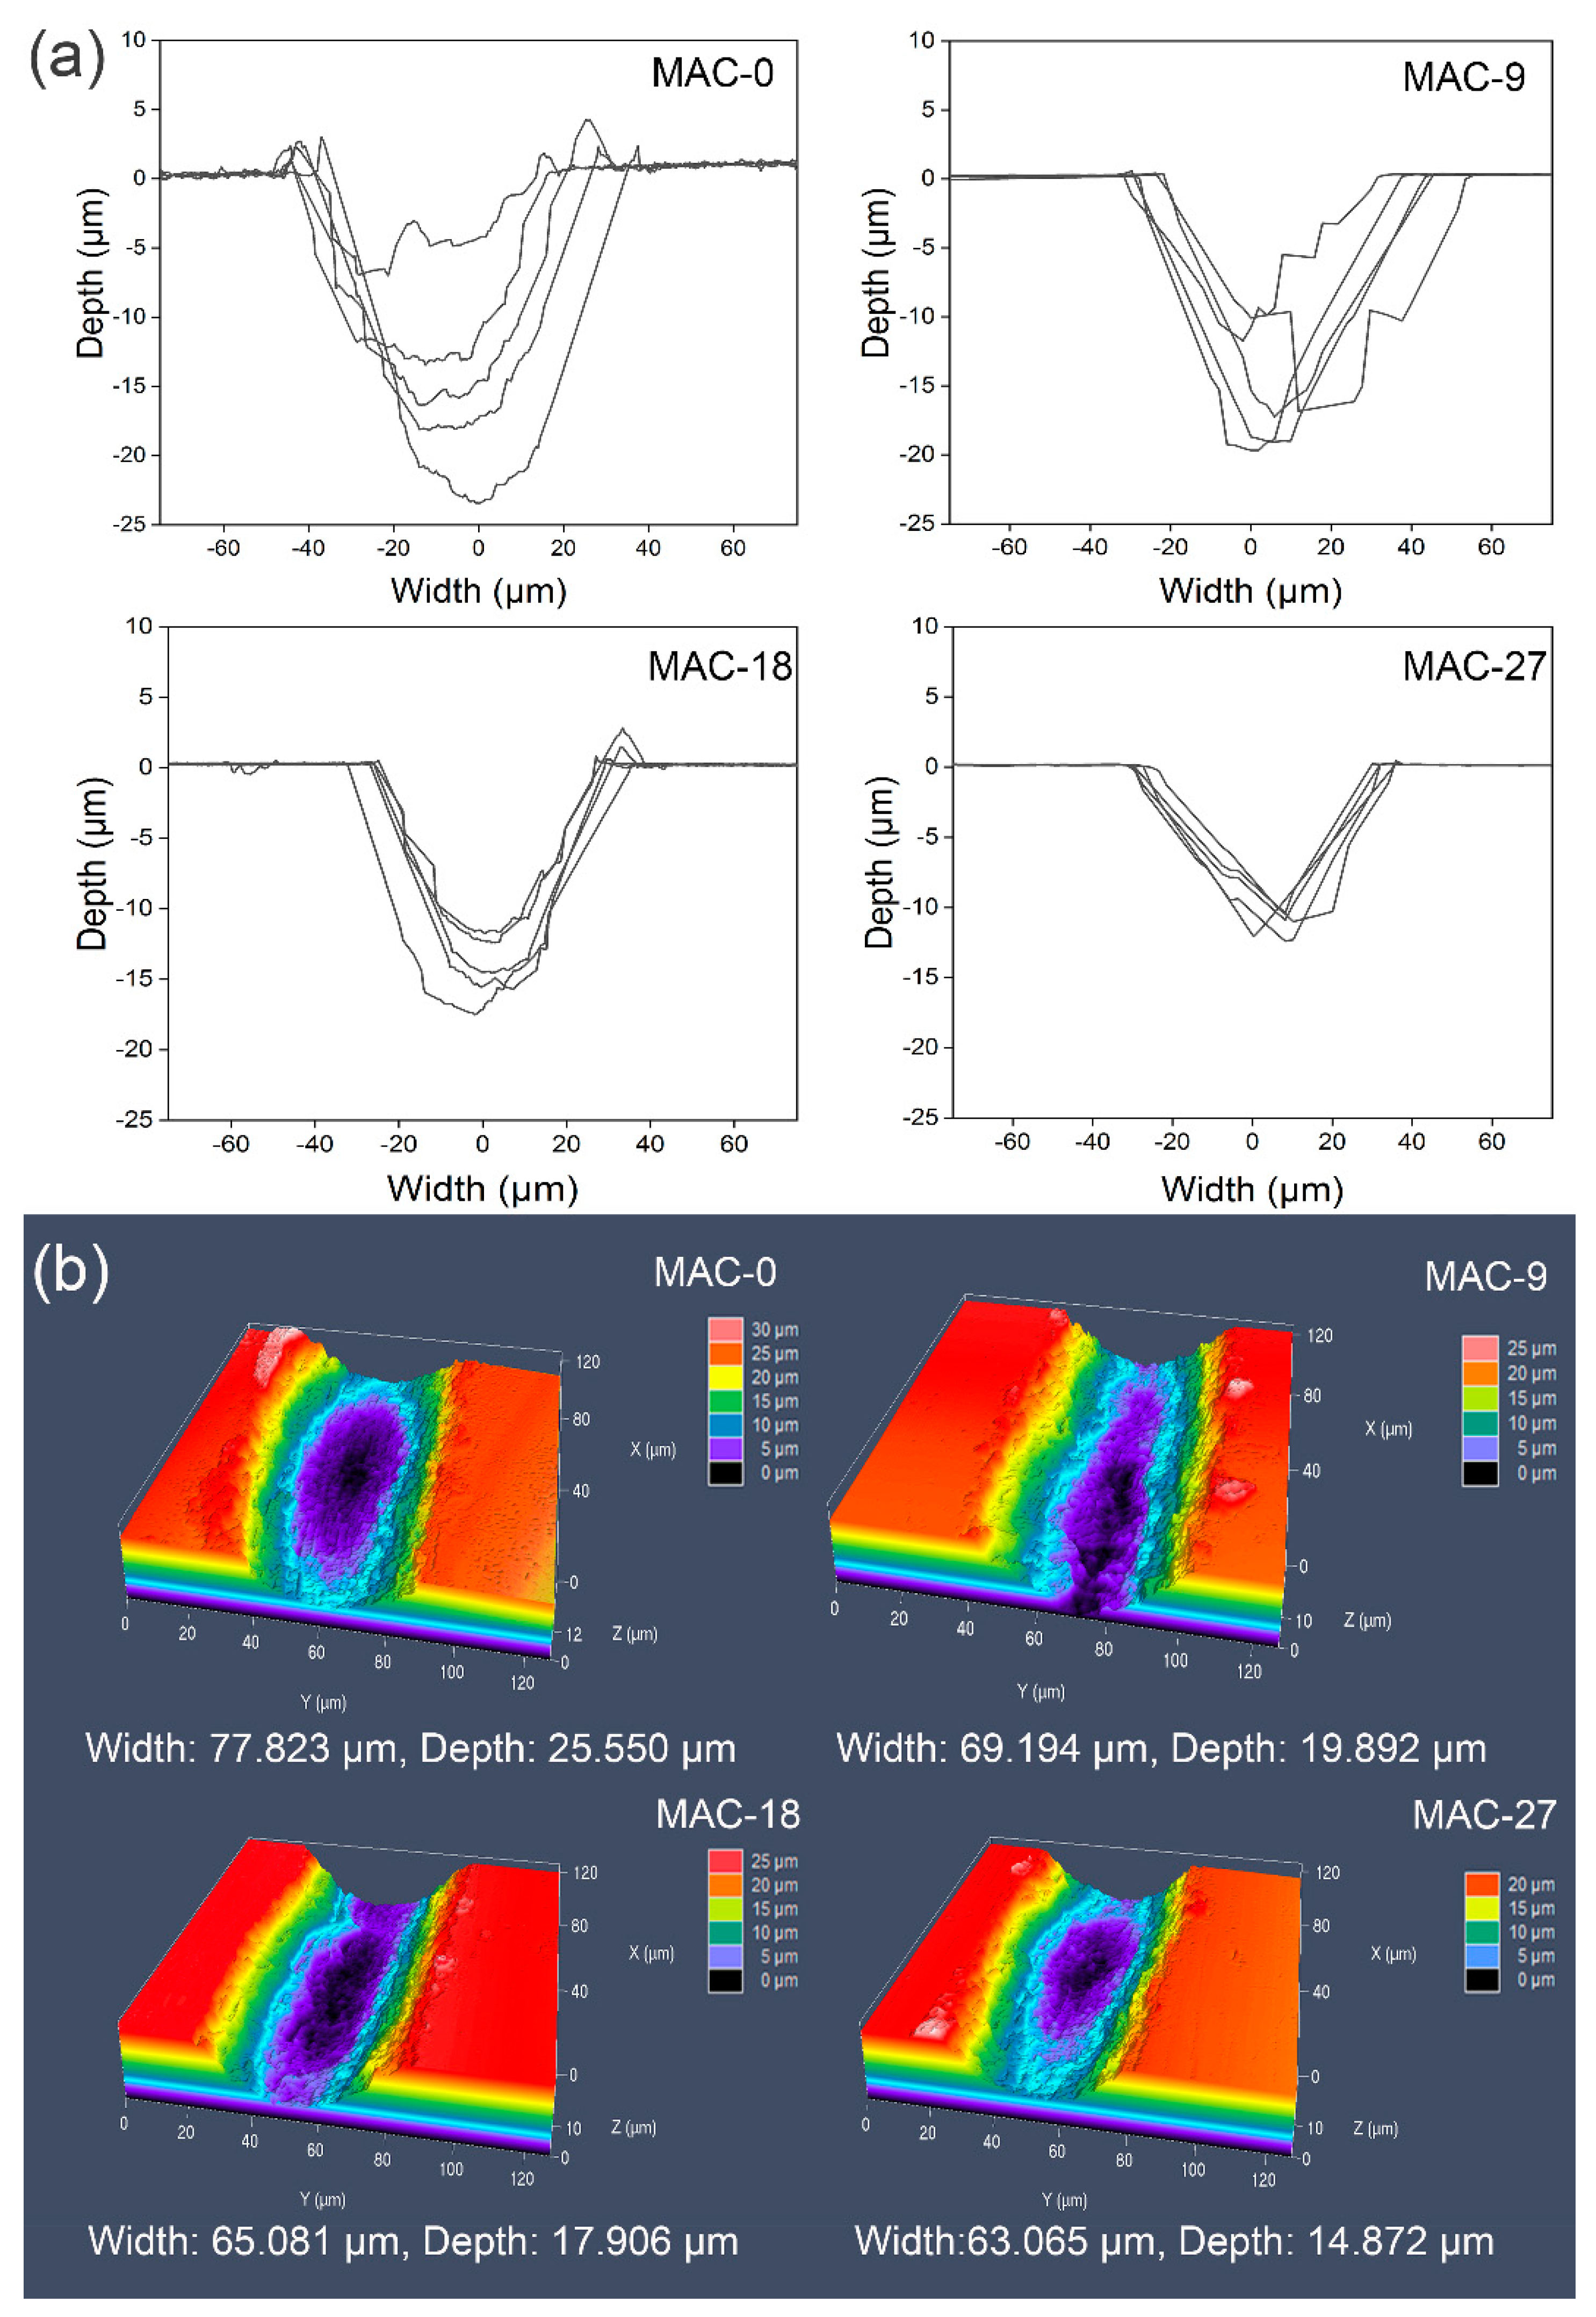
3.3.2. Wear Profile and Volume Wear Rate
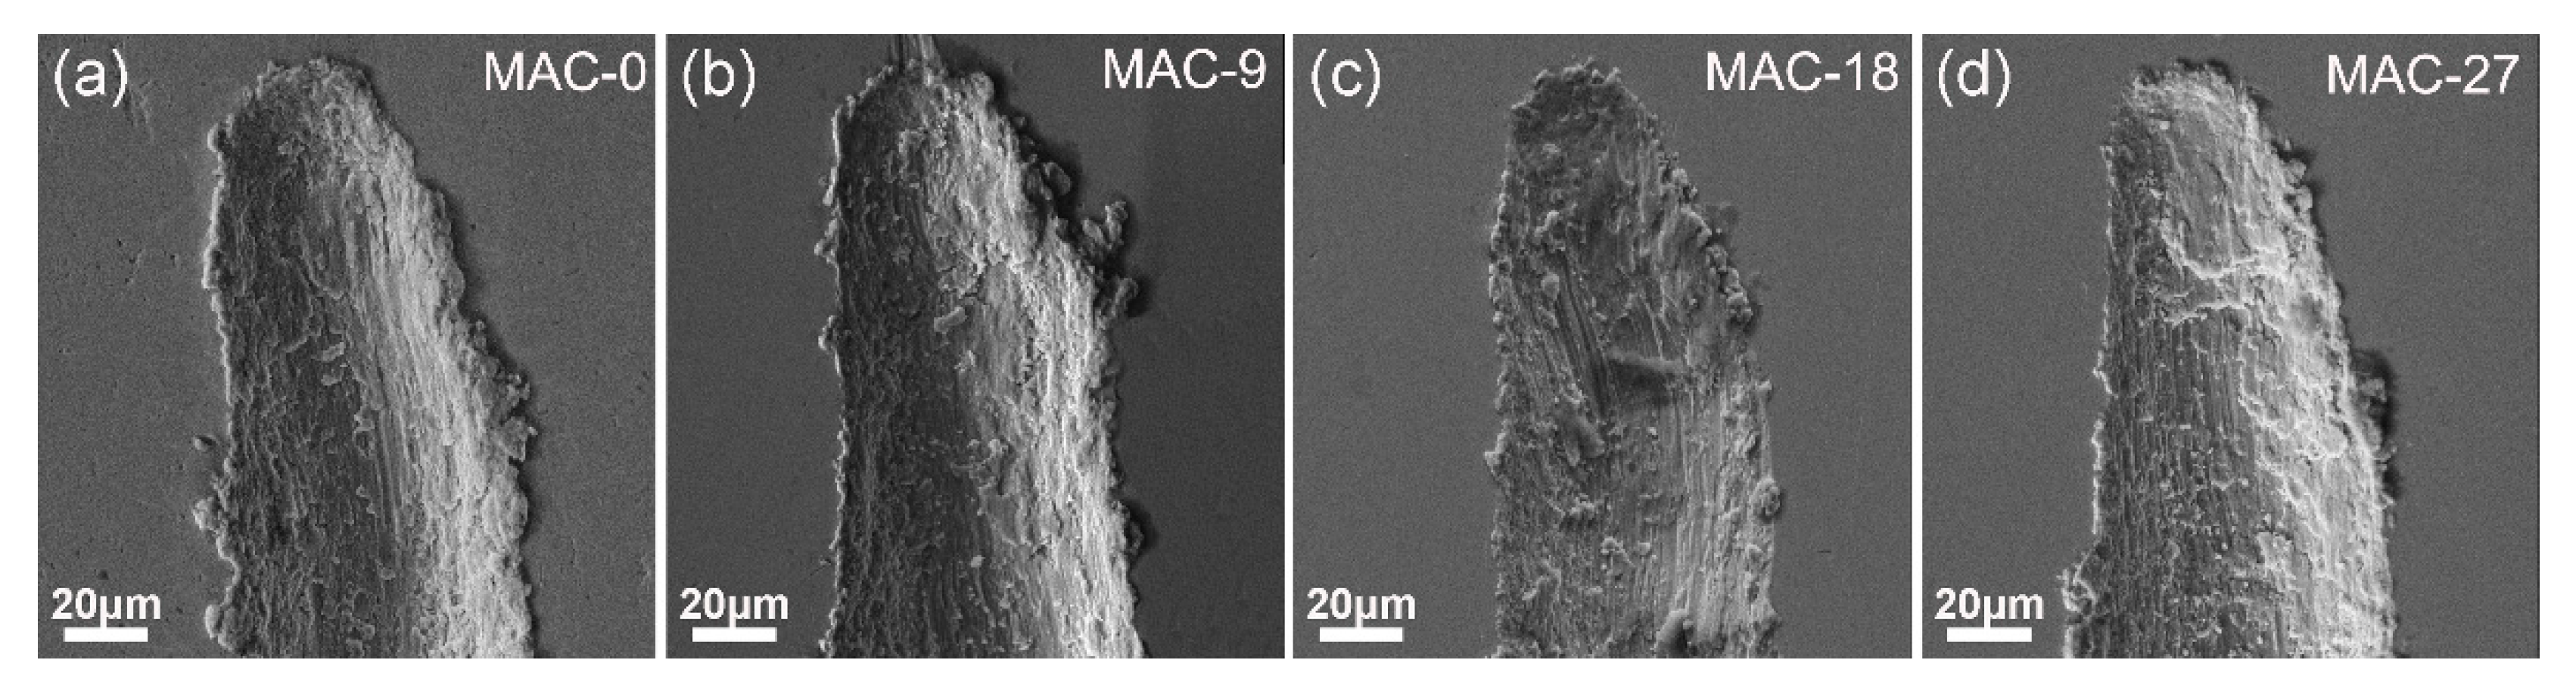
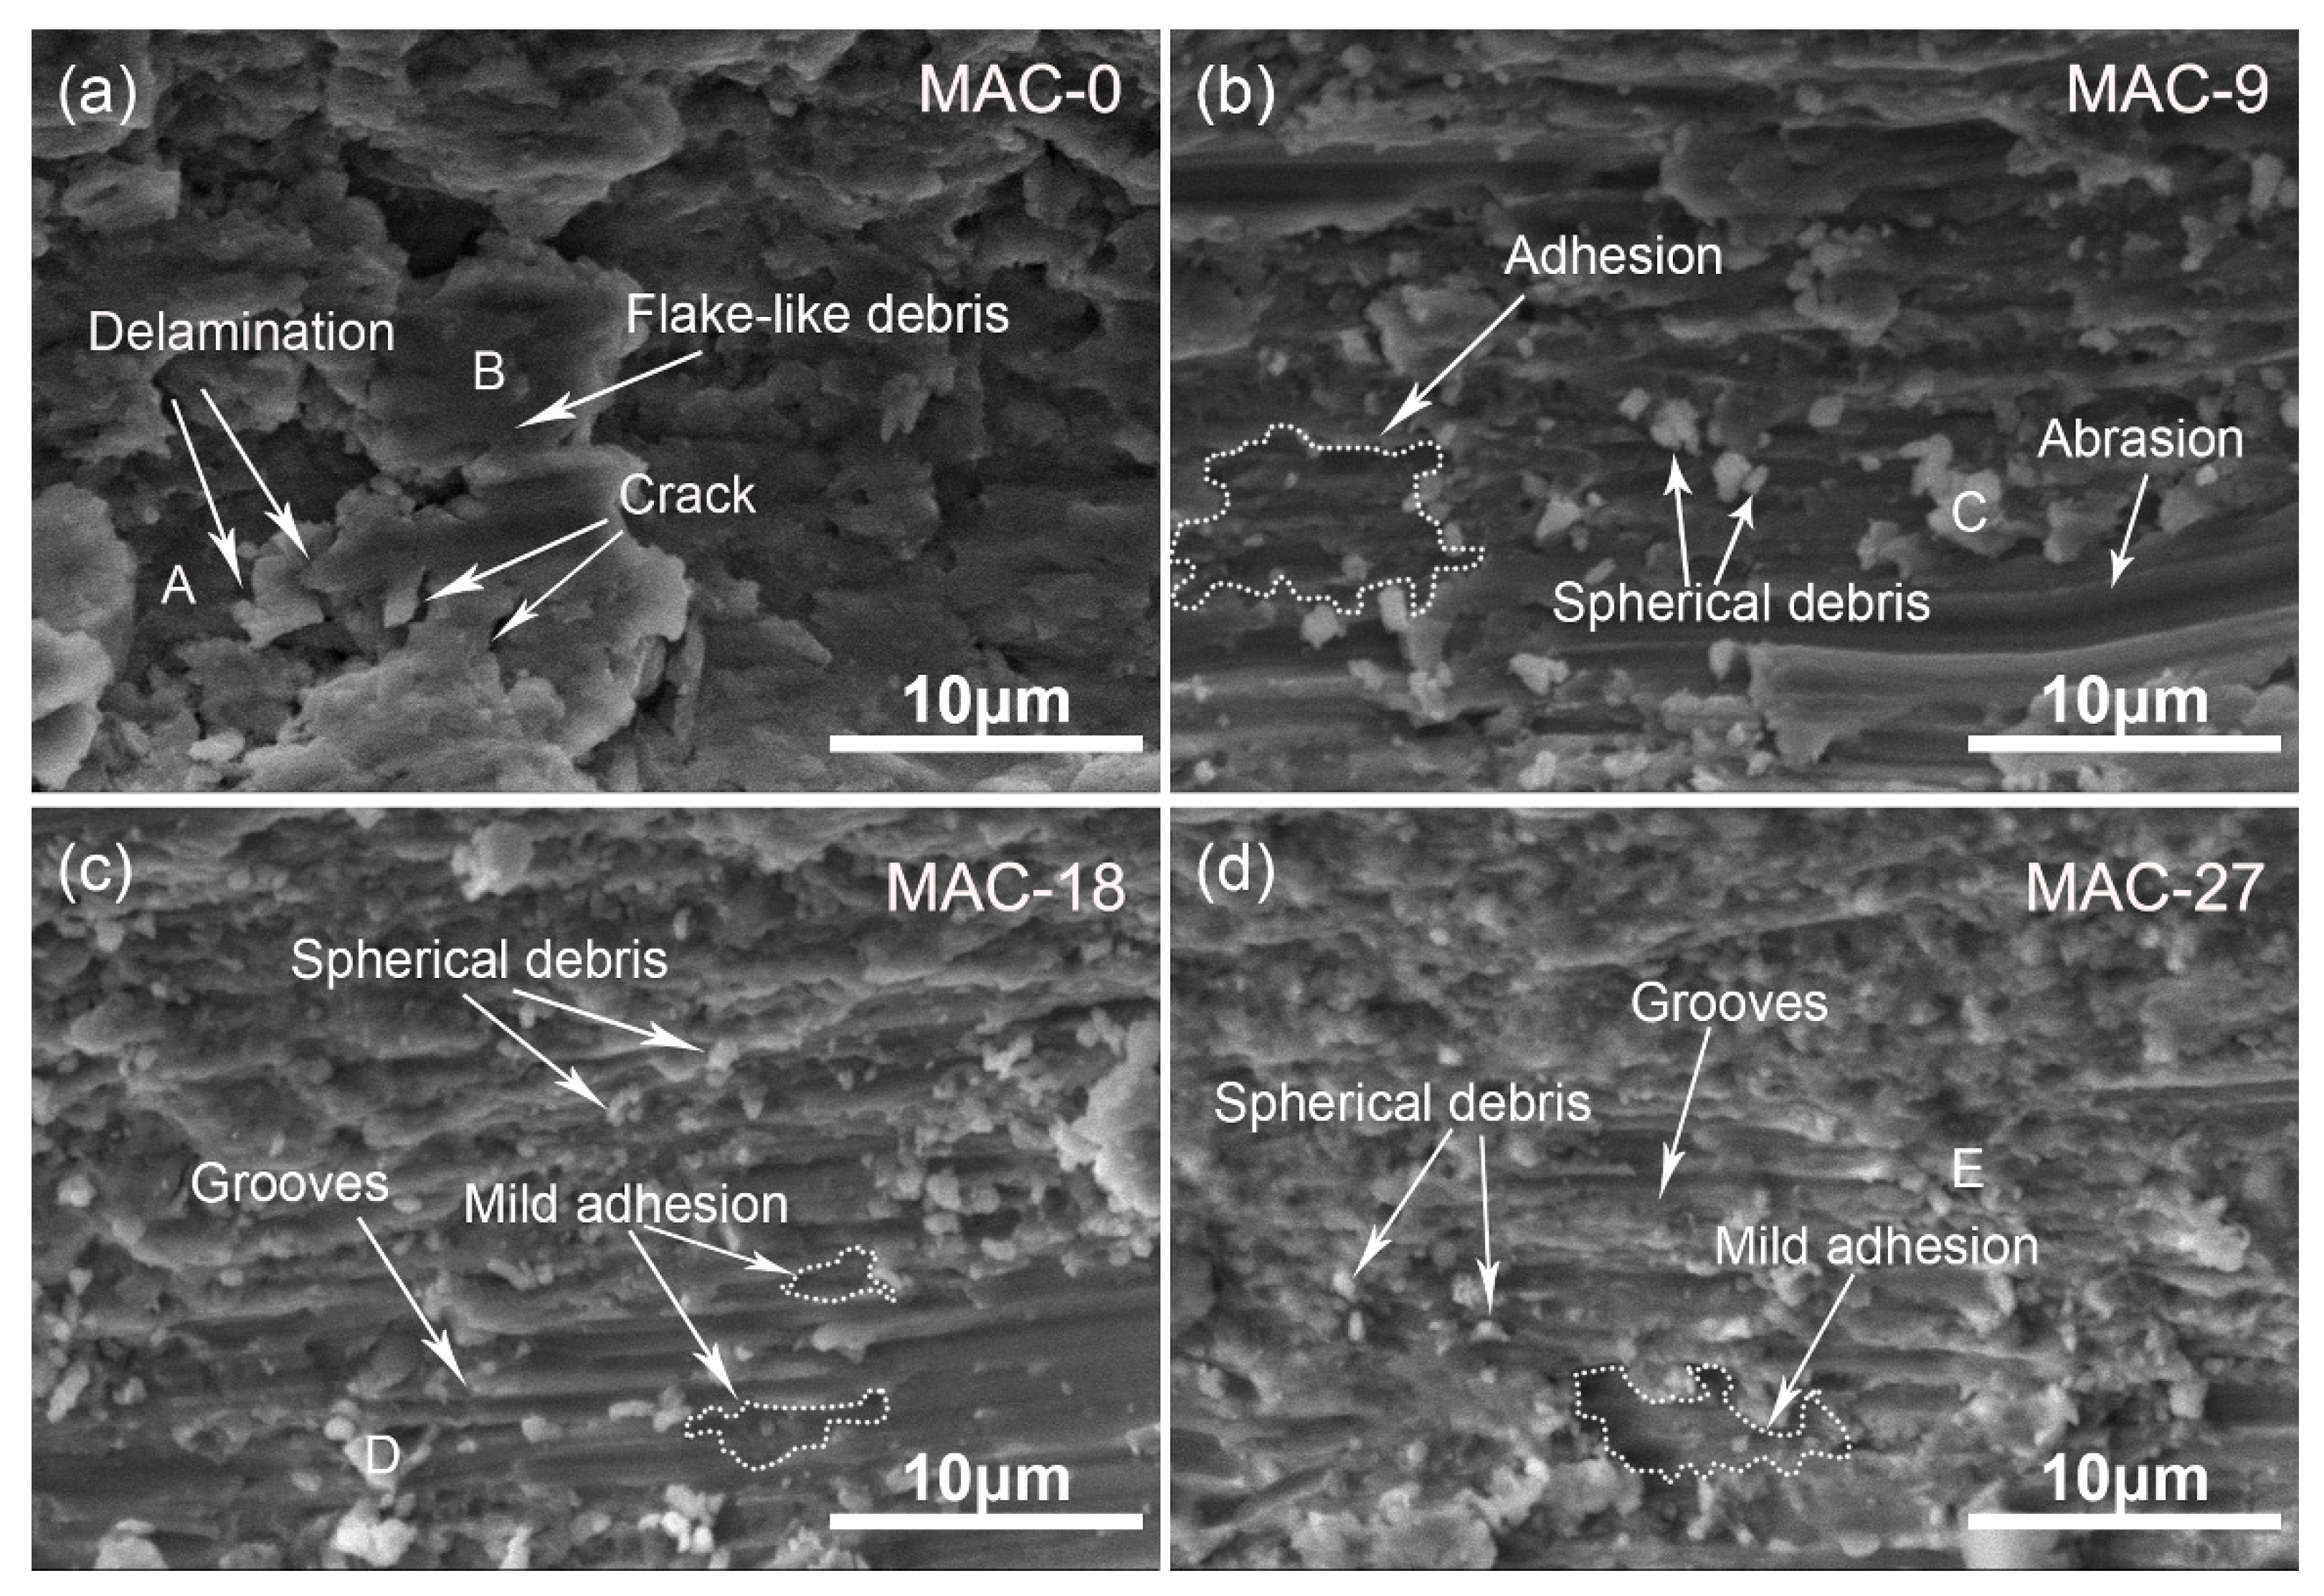
3.3.3. Fretting Wear Surface Analysis
4. Conclusions
- MAC significantly refined the grain size of the Ti-45Nb alloy and produced UFG microstructures with average grain sizes of approximately 0.3 μm (300 nm) for the MAC-9 sample, 0.2 μm (200 nm) for the MAC-18 sample, and approximately 0.1 μm (100 nm) for the MAC-27 sample compared to the MAC-0 sample with a grain size of approximately 15 μm. The dislocation density also increased from 7.09 × 10¹⁶/m2 to 5.16 × 10¹⁸/m2 after 27 passes MAC processing.
- MAC significantly improved the tensile strength and hardness of Ti-45Nb alloys. At the same time, the elongation of all samples remained above 9%, showing good strength and ductility.
- MAC reduced the fretting wear of Ti-45Nb samples which can be mainly attributed to the following aspects:
- (1)
- MAC reduced the COF of the samples, indicating that the samples processed by MAC have better lubricity and wear resistance;
- (2)
- MAC reduced the wear rates, which was attributed to the transformation of the wear mechanism in the wear scar: the severe adhesive wear, fatigue wear, and oxidative wear of the MAC-0 sample switch into slight abrasive wear and adhesive wear, accompanied by slight oxidative wear of the MAC sample after 27 passes;
- (3)
- After MAC processing, the shape of the wear debris in the wear area changed from large-size flakes to small-size spherical debris particles that moved in the form of “rolling” and acted as a third body to bear pressure and reduce friction.
Author Contributions
Funding
Conflicts of Interest
Nomenclature
| A | The area of the wear debris | mm2 |
| A | The adhesion area | mm2 |
| BF | Bright-field | - |
| CG | Coarse-grained | - |
| COF | Friction coefficient | - |
| CP | Commercial pure | - |
| d | Grain size | μm |
| DF | Dark-field | - |
| ECAP | Equal-channel angular pressing | - |
| EDS | Energy dispersive spectrometry | - |
| f | Friction coefficient | 1 |
| F | The friction force | N |
| The height after deformation | mm | |
| The original height of the MAC samples | mm | |
| Hardness constant | Hv | |
| HPT | High pressure torsion | - |
| ICP-OES | Inductively-coupled plasma optical emission spectrometry | - |
| Volume wear rate | mm3.N−1.mm−1 | |
| Km | Material properties dependant coefficient | 1 |
| A slope of the Hall-Petch relation | 1 | |
| A slope of the Hall-Petch relation | 1 | |
| MAC | Multi-axial compression | - |
| OM | Optical microscopy | - |
| pe | The furrow force per unit area | N.mm−2 |
| Pe | The furrow force in the friction process | N.mm−2 |
| RT | Room temperature | ℃ |
| S | The total sliding distance | mm |
| S | The furrow area | mm2 |
| SAED | Selected area electron diffraction | - |
| SEM | Scanning electron microscopy | - |
| SPD | Severe plastic deformation | - |
| T | The shear force in the friction process | N |
| TEM | Transmission electron microscopy | - |
| UFG | Ultra-fine-grained | - |
| UTS | Ultimate tensile strength | MPa |
| The load | N | |
| XRD | X-ray diffraction | - |
| YS | Yield strength | MPa |
| α | Material dependent constant | 1 |
| β | Coefficient related to surface properties | 1 |
| Elongation | % | |
| ΔV | The wear volume | mm3 |
| Accumulative strain | 1 | |
| ρ | Dislocation density | m−2 |
| Strength constant | MPa | |
| Yield strength | MPa | |
| Yield strength | MPa | |
| τb | The shear strength of the adhesion node | MPa |
| Ψ | Reduction of area | % |
References
- Kumar, S.; Nehra, M.; Kedia, D.; Dilbaghi, N.; Tankeshwar, K.; Kim, K. Nanotechnology-based biomaterials for orthopaedic applications: Recent advances and future prospects. Mater. Sci. Eng. C 2020, 106, 110154. [Google Scholar] [CrossRef]
- Niinomi, M.; Nakai, M.; Hieda, J. Development of new metallic alloys for biomedical applications. Acta. Biomater 2012, 8, 3888–3903. [Google Scholar] [CrossRef]
- Delshadmanesh, M.; Khatibi, G.; Ghomsheh, M.Z.; Lederer, M.; Zehetbauer, M.; Danninger, H. Influence of microstructure on fatigue of biocompatible β-phase Ti-45Nb. Mater. Sci. Eng. A 2017, 706, 83–94. [Google Scholar] [CrossRef]
- Li, Y.; Yang, C.; Zhao, H.; Qu, S.; Li, X.; Li, Y. New Developments of Ti-Based Alloys for Biomedical Applications. Materials 2014, 7, 1709–1800. [Google Scholar] [CrossRef] [Green Version]
- Zhou, Z.R.; Zhu, M.H. Composite Frettig Wear; Shanghai Jiao Tong University Press: Shanghai, China, 2004. [Google Scholar]
- Geetha, M.; Singh, A.K.; Asokamani, R.; Gogia, A.K. Ti based biomaterials, the ultimate choice for orthopaedic implants-A review. Prog. Mater. Sci. 2009, 54, 397–425. [Google Scholar] [CrossRef]
- Sumitomo, N.; Noritake, K.; Hattori, T.; Morikawa, K.; Niwa, S.; Sato, K.; Niinomi, M. Experiment study on fracture fixation with low rigidity titanium alloy. J. Mater. Sci. Mater. Med. 2008, 19, 1581–1586. [Google Scholar] [CrossRef]
- Scharf, T.W.; Mogonye, J.E. Tribological properties and mechanisms of self-mated ultrafine-grained titanium. Wear 2017, 376–377, 931–939. [Google Scholar]
- Yang, C.; Song, N.; Liao, X.; Song, M.; Zhu, Y. Structural evolutions of metallic materials processed by severe plastic deformation. Mater. Sci. Eng. R-Rep. 2018, 133, 1–59. [Google Scholar]
- Starink, M.J.; Qiao, X.G.; Zhang, J.W.; Gao, N. Predicting grain refinement by cold severe plastic deformation in alloys using volume averaged dislocation generation. Acta. Mater. 2009, 57, 5796–5811. [Google Scholar] [CrossRef] [Green Version]
- Subramanian, C. Some considerations towards the design of a wear resistant aluminium alloy. Wear 1992, 155, 193–205. [Google Scholar] [CrossRef]
- Archard, J.F. Contact and Rubbing of Flat Surfaces. J. Appl. Phys. 1953, 24, 981–988. [Google Scholar] [CrossRef]
- Hall, E.O. Variation of Hardness of Metals with Grain Size. Nature 1954, 173, 948–949. [Google Scholar] [CrossRef]
- Panigrahi, A.; Sulkowski, B.; Waitz, T.; Ozaltin, K.; Chrominski, W.; Pukenas, A.; Horky, J.; Lewandowska, M.; Skrotzki, W.; Zehetbauer, M. Mechanical properties, structural and texture evolution of biocompatible Ti–45Nb alloy processed by severe plastic deformation. J. Mech. Behav. Biomed. Mater. 2016, 62, 93–105. [Google Scholar] [CrossRef]
- Kucukomeroglu, T. Effect of equal-channel angular extrusion on mechanical and wear properties of eutectic Al–12Si alloy. Mater. Des. 2010, 31, 782–789. [Google Scholar] [CrossRef]
- Kundu, A.; Kapoor, R.; Tewari, R. Severe plastic deformation of copper using multiple compression in a channel die. Scr. Mater. 2008, 58, 235–238. [Google Scholar] [CrossRef]
- Valiev, R.Z.; Islamgaliev, R.K.; Alexandrov, I.V. Bulk nanostructured materials from severe plastic deformation. Prog. Mater. Sci. 2000, 45, 103–189. [Google Scholar] [CrossRef]
- Estrin, Y.; Vinogradov, A. Extreme grain refinement by severe plastic deformation: A wealth of challenging science. Acta. Mater 2013, 61, 782–817. [Google Scholar] [CrossRef]
- Wang, B.; Liu, Z.; Li, J. Microstructure evolution in AISI201 austenitic stainless steel during the first compression cycle of multi-axial compression. Mater. Sci. Eng. A 2013, 568, 20–24. [Google Scholar] [CrossRef]
- Stolyarov, V.V.; Shuster, L.S.; Migranov, M.S.; Valiev, R.Z.; Zhu, Y.T. Reduction of friction coefficient of ultrafine-grained CP titanium. Mater. Sci. Eng. A 2004, 371, 313–317. [Google Scholar] [CrossRef]
- La, P.Q.; Ma, J.Q.; Zhu, Y.T.; Yang, J.; Liu, W.M.; Xue, Q.J.; Valiev, R.Z. Dry-sliding tribological properties of ultrafine-grained Ti prepared by severe plastic deformation. Acta. Mater. 2005, 53, 5167–5173. [Google Scholar] [CrossRef]
- Long, Y.; Huang, X.; Wang, T. Effect of Grain Refinement on the Fretting Wear Properties of Spark Plasma Sintered TC4 Alloy. Rare. Metal. Mat. Eng. 2015, 44, 1713–1718. [Google Scholar]
- Purcek, G.; Saray, O.; Kul, O.; Karaman, I.; Yapici, G.G.; Haouaoui, M.; Maier, H.J. Mechanical and wear properties of ultrafine-grained pure Ti produced by multi-pass equal-channel angular extrusion. Mater. Sci. Eng. A 2009, 517, 97–104. [Google Scholar] [CrossRef]
- Wang, C.T.; Gao, N.; Gee, M.G.; Wood, R.J.K.; Langdon, T.G. Effect of grain size on the micro-tribological behavior of pure titanium processed by high-pressure torsion. Wear 2012, 280–281, 28–35. [Google Scholar] [CrossRef]
- Shu, D.L. Mechanical Properties of Engineering Materials; China Machine Press: Beijing, China, 2004. [Google Scholar]
- Beake, B.D.; Shi, B.; Sullivan, J.L. Nanoscratch and nanowear testing of TiN coatings on M42 steel. Tribo-Mater. Surf. Interfaces 2014, 5, 141–147. [Google Scholar] [CrossRef]
- Beake, B.D.; Liskiewicz, T.W.; Pickford, N.J.; Smith, J.F. Accelerated nano-fretting testing of Si(1 0 0). Tribol. Int. 2012, 46, 114–118. [Google Scholar] [CrossRef]
- Doni, Z.; Alves, A.C.; Toptan, F.; Gomes, J.R.; Ramalho, A.; Buciumeanu, M.; Palaghian, L.; Silva, F.S. Dry sliding and tribocorrosion behaviour of hot pressed CoCrMo biomedical alloy as compared with the cast CoCrMo and Ti6Al4V alloys. Mater. Des. 2013, 52, 47–57. [Google Scholar] [CrossRef]
- Völker, B.; Maier-Kiener, V.; Werbach, K.; Müller, T.; Hohenwarter, A. Influence of annealing on microstructure and mechanical properties of ultrafine-grained Ti45Nb. Mater. Des. 2019, 179, 107864. [Google Scholar] [CrossRef]
- Williamson, G.K.; Smallman, R.E. III. Dislocation densities in some annealed and cold-worked metals from measurements on the X-ray debye-scherrer spectrum. Philos. Mag. 1956, 1, 34–46. [Google Scholar] [CrossRef]
- Kato, K. Micro-mechanisms of wear—Wear modes. Wear 1992, 153, 277–295. [Google Scholar] [CrossRef]
- Li, X.X.; Shi, J.F.; Wang, H.X.; Han, B.Q.; Feng, J.; Zhang, B. Role of tribo-layers and tribo-oxides in dry sliding wear process of Ti6Al4V alloy. Surf. Technol. 2019, 48, 245–251. [Google Scholar]
- Wen, S.Z.; Huang, P. Principles of Tribology; Tsinghua University Press: Beijing, China, 2008. [Google Scholar]
- Suh, N.P. The delamination theory of wear. Wear 1977, 25, 111–124. [Google Scholar] [CrossRef]
- Ke, J.; Liu, X.B.; Liang, J.; Liang, L.; Luo, Y.S. Microstructure and fretting wear of laser cladding self-lubricating anti-wear composite coatings on TA2 alloy after aging treatment. Opt. Laser. Technol. 2019, 119, 105599. [Google Scholar] [CrossRef]
- Zhou, L.; Liu, G.; Han, Z.; Lu, K. Grain size effect on wear resistance of a nanostructured AISI52100 steel. Scr. Mater. 2008, 58, 445–448. [Google Scholar] [CrossRef]
- Bowden, F.P.; Tabor, D.F. The friction and lubrication of solids. Am. J. Phys. 1951, 19, 428. [Google Scholar] [CrossRef]
- Wang, L.; Zhang, Q.Y.; Li, X.X.; Cui, X.H.; Wang, S.Q. Dry Sliding Wear Behavior of Ti-6.5Al-3.5Mo-1.5Zr-0.3Si Alloy. Metall. Mater. Trans. A 2014, 45, 2284–2296. [Google Scholar] [CrossRef]
- Hou, B.; Huang, W.J.; Chen, B.S.; Zhou, Z.R.; Li, C.S. Fretting wear mechanisms of AZ91D magnesium alloy in slip regime AZ91D. Tribology 2004, 24, 351–354. [Google Scholar]


| Element | Ti | Nb | O | N | H | C | Fe |
|---|---|---|---|---|---|---|---|
| Content (wt %) | Balance | 44.83 | 0.095 | 0.002 | 0.002 | 0.028 | 0.024 |
| Sample | MAC-0 | MAC-9 | MAC-18 | MAC-27 |
|---|---|---|---|---|
| Average grain size (µm) | ~ 15 | ~ 0.3 | ~ 0.2 | ~ 0.1 |
| UTS (MPa) | 410 ± 13 | 654 ± 18 | 699 ± 14 | 781 ± 11 |
| YS (MPa) | 401 ± 12 | 595 ± 23 | 634 ± 21 | 707 ± 19 |
| Elongation δ(%) | 19.8 ± 1.2 | 13.5 ± 1.7 | 10.8 ± 1.3 | 9.2 ± 1.0 |
| Reduction of area Ψ (%) | 77.9 ± 4.6 | 48.3 ± 2.3 | 37.8 ± 1.9 | 37 ± 1.5 |
| Dislocation density ρ(1/m2) | 7.09 × 10¹⁶ | 4.52 × 10¹⁷ | 2.20 × 10¹⁸ | 5.16 × 10¹⁸ |
| Hardness (Hv) | 144.5 ± 3.0 | 189.5 ± 15.5 | 222.7 ± 6.2 | 245.5 ± 3.6 |
| Average COF | 0.424 | 0.403 | 0.397 | 0.39 |
| Wear rate (10−3 mm3.N−1.mm−1) | 10.39 | 9.88 | 8.33 | 6.20 |
| Region (wt %) | Ti | Nb | O | C |
|---|---|---|---|---|
| A | 48 | 42 | - | 10 |
| B | 19 | 18 | 31 | 32 |
| C | 44 | 38 | 8 | 10 |
| D | 45 | 37 | 10 | 8 |
| E | 47 | 41 | 12 | - |
Publisher’s Note: MDPI stays neutral with regard to jurisdictional claims in published maps and institutional affiliations. |
© 2021 by the authors. Licensee MDPI, Basel, Switzerland. This article is an open access article distributed under the terms and conditions of the Creative Commons Attribution (CC BY) license (http://creativecommons.org/licenses/by/4.0/).
Share and Cite
Xu, Z.; Hu, N.; Lu, Y.; Xu, X. Effects of Multi-Axial Compression on the Mechanical and Fretting Wear Properties of Ti-45Nb Alloys. Metals 2021, 11, 454. https://doi.org/10.3390/met11030454
Xu Z, Hu N, Lu Y, Xu X. Effects of Multi-Axial Compression on the Mechanical and Fretting Wear Properties of Ti-45Nb Alloys. Metals. 2021; 11(3):454. https://doi.org/10.3390/met11030454
Chicago/Turabian StyleXu, Zhuoqing, Nan Hu, Yuan Lu, and Xiaochang Xu. 2021. "Effects of Multi-Axial Compression on the Mechanical and Fretting Wear Properties of Ti-45Nb Alloys" Metals 11, no. 3: 454. https://doi.org/10.3390/met11030454