Article

Oxidation Behavior of an Austenitic Steel (Fe, Cr and Ni), the 310 H, in a Deaerated Supercritical Water Static System

by
Aurelia Elena Tudose
1,2,
Ioana Demetrescu
2,3,
Florentina Golgovici
2,* and
Manuela Fulger
1
1
Institute for Nuclear Research Pitesti, POB 78, Campului Street, No. 1, 115400 Mioveni, Romania
2
Department of General Chemistry, University Politechnica Bucharest, Splaiul Independentei Street, No. 313, 060042 Bucharest, Romania
3
Academy of Romanian Scientists, 3 Ilfov, 050094 Bucharest, Romania
*
Author to whom correspondence should be addressed.
Metals 2021, 11(4), 571; https://doi.org/10.3390/met11040571
Submission received: 26 February 2021 / Revised: 22 March 2021 / Accepted: 27 March 2021 / Published: 1 April 2021
(This article belongs to the Section Metallic Functional Materials)

Abstract

:
The aim of this work was to study the corrosion behavior of a Fe-Cr-Ni alloy (310 H stainless steel) in water at a supercritical temperature of 550 °C and a pressure of 250 atm for up to 2160 h. At supercritical temperature, water is a highly aggressive environment, and the corrosion of structural materials used in a supercritical water-cooled nuclear reactor (SCWR) is a critical problem. Selecting proper candidate materials is one key issue for the development of SCWRs. After exposure to deaerated supercritical water, the oxides formed on the 310 H SS surface were characterized using a gravimetric analysis, a metallographic analysis, and electrochemical methods. Gravimetric analysis showed that, due to oxidation, all the tested samples gained weight, and oxidation of 310H stainless steel at 550 °C follows parabolic rate, indicating that it is driven by a diffusion process. The data obtained by microscopic metallography concord with those obtained by gravimetric analysis and show that the oxides layer has a growing tendency in time. At the same time, the results obtained by electrochemical impedance spectroscopy (EIS) measurements indicate the best corrosion resistance of Cr, and (Fe, Mn) Cr2O4 oxides developed on the samples surface after 2160 h of oxidation. Based on the results obtained, a strong correlation between gravimetric analysis, metallographic analysis, and electrochemical methods was found.

1. Introduction

At the end of last century in the environment, which needed more safe and efficient energy sources, such a concept was enforced. In this context, at the beginning of our century, the Generation IV International Forum was initiated to develop advanced nuclear reactor designs to improve sustainability with safety, reliability, and economical energy, due to better resistance and physical protection [1,2]. In the frame of Generation IV nuclear reactors, one of the six innovative concepts for nuclear domain is the supercritical cooled water reactor (SCWR) [3,4,5]. According to the U.S. Generation IV reactor integrated materials technology program, the identification of materials for SCWR, a high-temperature, high-pressure water-cooled reactor that operates above the thermodynamic critical point of water (374 °C, 218 atm), was a start for material selection [6]. At supercritical temperature, water is a highly aggressive environment, and the corrosion of structural materials used in a supercritical water-cooled nuclear reactor (SCWR) is a critical problem. Selecting proper candidate materials is one key issue for the development of a supercritical water-cooled nuclear reactor (SCWR). Materials chosen for reactors must have acceptable dimensional stability under radiation, be resistant to irradiation creep under constant radioactive stress, possess acceptable ductility, toughness, creep rupture strength, and chemical compatibility against stress corrosion cracking (SCC), and irradiation assisted SCC with supercritical water [7,8]. Corrosion, stress corrosion cracking, and the effect of irradiation are the main degradation modes of the materials. Irradiation-induced changes in the microstructure include swelling, radiation-induced segregation, hardening, phase stability, and mechanical properties. The available data about changing the mechanical properties of austenitic steels after irradiation present how such alloys exhibit hardening up to approximately 700 °C, as well as a reduction of creep resistance. Their elongation may further decrease at temperatures above 600 °C, and reach low values at above 700 °C [9]
From the beginning of the program, depending on the good corrosion resistance of the materials used in conventional nuclear reactors, ferritic–martensitic steels (HT-9, T91, T92, HCM12A), austenitic stainless steels (304, 304 L, 316, 316 L, 310), and Ni-base alloys (IN718, IN625) were considered as promising candidate materials for SCWRs, and the number of their investigations was increased [5,10,11].
Ferritic–martensitic steels have the lowest cost but the lower working temperature [7,12,13,14]. They have low neutron absorption rates, good radiation resistance, and they do not swell under radiation. During testing under supercritical water, ferritic–martensitic steels have the largest weight gain and oxide growth rate. However, the oxides formed are quite stable and do not easily spall. While the formation of thick oxides may limit ferritic–martensitic steel usage in reactors, alloy modifications, such as increases in Cr content, can be applied to reduce oxide layer thickness.
Nickel-based alloys have been considered a secondary option for SCWR applications due to the higher price and low irradiation performance. However, Ni-based alloys have advantages, as the corrosion and oxide layer growth rate are almost an order of magnitude smaller than that of steels. These alloys also have greater creep strength but pitting and stress corrosion cracking have been observed due to the segregation of alloy elements at grain boundaries and the oxidation of carbide particles within these grain boundaries. Irradiation of Ni-based alloys causes swelling and radiation embrittlement [7,13]. Based on the properties of Ni-based alloys, their potential usage lies in the out-of-core components, such as piping or turbine blades [15].
Austenitic stainless steels are being considered for SCWRs due to their higher creep resistance, improved corrosion resistance over ferritic–martensitic steels, and their improved radiation performance over nickel-based alloys. Such motivation serves material selection [16,17].
Austenitic stainless steels have been tested for corrosion and SCC susceptibility in supercritical water [11,18]. These alloys exhibit the lowest weight gains among most of the candidate alloys that are under investigation. Most reported results on austenitic stainless steels reveal that the surface oxide consists of a two- or three-layer structures [10,19,20,21,22,23]. The outer layer generally consists of magnetite, with an inner layer that is rich in chromium, and is either an iron chromium spinel or an iron chromium oxide with a hematite structure [10]. An intermediate layer can also be present between the inner layer and the base metal that appears to be supersaturated with oxygen [1,6,11].
Furthermore, 310 H stainless steel (SS) can be one of the candidate materials for internal components of SCWRs. This is an austenitic alloy with good corrosion resistance due to a relatively high content of chromium. The presence of chromium in this alloy promotes the development of a protective oxide on its surface, while the presence of nickel improves the stability of this oxide, especially during exposure to high temperatures [5]. The procedures to improve oxide layer stability were intensively studied over the last few years [24,25,26], but still need more attention.
The samples from this material were exposed, in the present paper, to supercritical water to study the effects of the environment on corrosion behavior. After exposure to deaerated supercritical water, the oxides formed on the 310 H SS surface were characterized using gravimetric analysis, metallographic analysis, electrochemical impedance spectroscopy, and linear potentiodynamic polarization. The aim of this manuscript, which is also its novelty, is worthy for research being devoted to greater understanding about protective oxides’ formation and characterization. The presence of this topic is scarce in the literature, having not been investigated in detail in deaerated supercritical water. More knowledge will help to reach greater performance in SCWR safety materials.

2. Materials and Methods

A commercial 310 H stainless steel plate with a thickness of 2 mm, purchased from Outokumpu Stainless AB Company (Degerfors, Sweden), was used. The plate was hot rolled and heat treated at 1100 °C, followed by water quenching. The chemical composition in weight percent (wt. %) of this material is given in Table 1.
The tested samples were cut in a parallelepipedic form with the dimensions 25 mm × 15 mm, and with a hole of 3 mm diameter at one end for the mounting of the samples on supports. After cutting, the samples were mechanically sanded on abrasive paper of different granulations (#120, #240, #400, #600 µm), after which they were ultrasonicated in acetone for 30 min. After the ultrasound, the samples were dried and weighted using an analytical balance with an accuracy of 1 × 10⁻⁵ g. The number of samples used for each experiment is 3.
To simulate the supercritical environment, the experiments were performed in static one-liter autoclaves in water at 550 °C under a pressure of 250 atm. The exposure time was up to 2160 h. The deionized water had a temperature of 25 °C, a conductivity of 0.2–0.25 μS/cm, and its dissolved oxygen content was maintained below 2 ppm by thermal degassing at 100 °C. The pH of the testing solution, measured at room temperature, was about 6.1–6.3. Periodically, the autoclave was opened to measure weight gain of the specimens after rinsing and drying. The autoclave solution was replaced with fresh solution after each inspection. Weight gain due to oxidation was measured using an analytical balance. Based on the initial weight and those obtained after autoclaving, the variations of the mass, ΔW, were calculated. The corrosion rates were calculated according to Equation (1):
V c o r r = m d × 0.0365 ρ
where md is the variation of mass per unit area S and exposure time t of the sample, in mg dm−2 day−1, and ρ is the density of 310 H stainless steel, 7.98 g/cm3.
To calculate the thickness of the oxide layer, consisting primarily of Cr2O3 and (Fe, Mn) Cr2O4, it was considered that the main oxide that forms on the 310 H SS surface when exposed to water at high temperatures is chromium oxide (Cr2O3), which has a density of 5.22 g/cm3 [10].
After exposure to deaerated supercritical water, the oxides formed on the 310 H stainless steel surface were characterized using gravimetric analysis, metallographic analysis, electrochemical impedance spectroscopy, and linear potentiodynamic polarization. Metallographic analysis was performed using the Olympus BX51M optical microscope (Olympus Corporation, Tokyo, Japan) to highlight the oxide thickness, the grain structure, and Vickers microhardness. Elemental composition was identified with energy dispersive spectroscopy (EDS) analysis performed on cross-section samples using a Bruker energy dispersive X-ray spectrometer, coupled with a SEM type TESCAN VEGA II-LMU (Tescan Orsay Holding, Brno- Kohoutovice, Czech Republic) device. To determine the thickness of the oxide layer, small pieces were cut from the samples and wrapped in copper foil, embedded in conductive cupric resin, and ground (P #4000 μm). The metallographic structure of the samples was highlighted by electrolytic etching in 10% oxalic acid solution, 6 V, for 5 s up to 25 s, and the Vickers microhardness (MHV0.1) was determination by an OPL tester in automatic cycle.
The electrochemical tests (potentiodynamic polarization and electrochemical impedance spectroscopy) were performed using an electrochemical system PARSTAT 2273 potentiostat/galvanostat (Princeton Applied Research, AMETEK, OakRidge, TN, USA) with an electrochemical cell which contains: a working electrode (the 310H stainless steel sample), a saturated calomel reference electrode (SCE), and two auxiliary electrodes (graphite rods). The electrochemical tests were carried out at room temperature (22 ± 2 °C) in a borate buffer solution (0.05 M boric acid with 0.001 M borax solution) with a pH = 7.7–7.8. This solution is chemically inert and did not affect the oxide layers features.
The impedance spectra [28] were obtained at open circuit potential with a scan frequency range from 100 kHz to 100 mHz and an ac amplitude of 10 mV. To obtain quantitative data, the experimental EIS results were simulated with equivalent electrical circuits as appropriate models using ZView 2 (Scribner Associates Inc., Southern Pines, NC, USA) software.
Using the PowerCorr software (PowerSuite Software, Princeton Applied Research, AMETEK, OakRidge, TN, USA) and the linear polarization method, the potentiodynamic polarization plots were recorded with a scan rate of 0.5 mV/s, and using a potential range between –0.250 V vs. OCP up to +1.0 V.

3. Results and Discussion

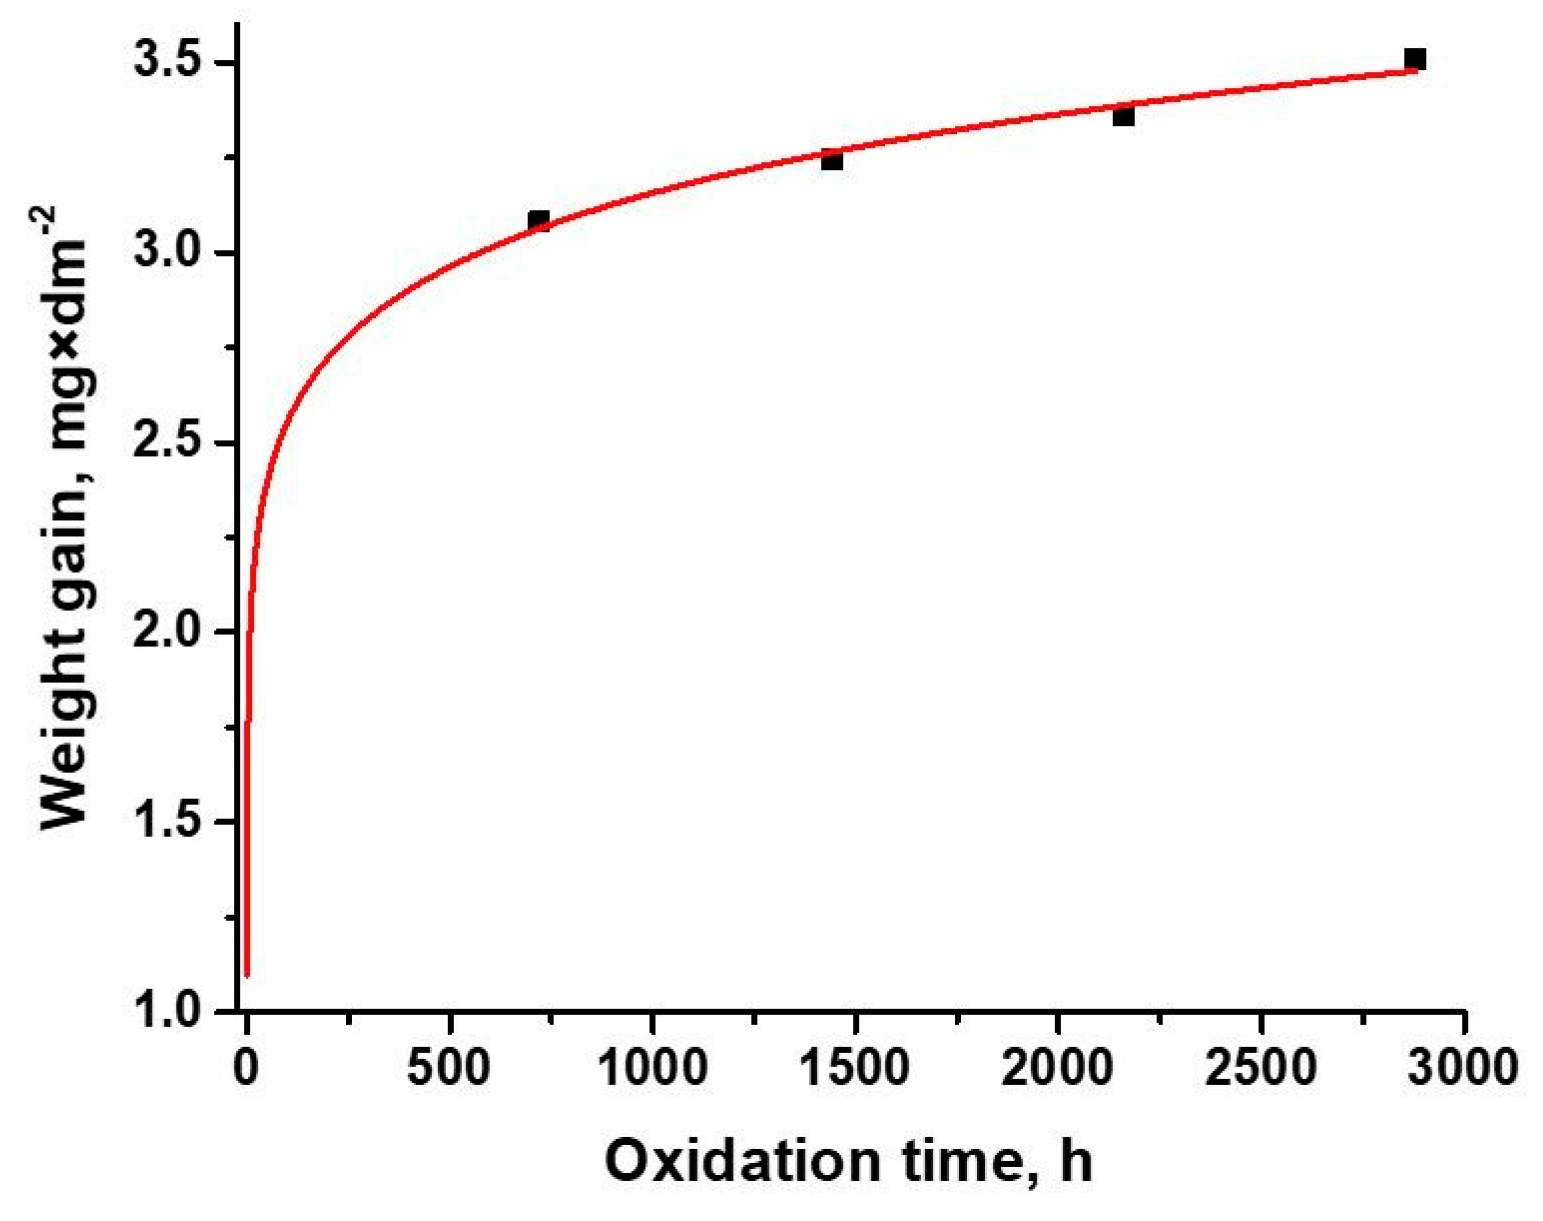
3.1. Oxidation Kinetics

For the oxidation experiment carried out at 550 °C, the weight gain values were recorded from 0 to 2880 h. In Figure 1, the weight gain data as a function of exposure time for 310 H samples in supercritical water are represented.
From this figure, it was observed that, over time and due to oxidation, all samples gained weight, but the mass gain is very small, between 3.08016 mg/dm2 and 3.50977 mg/dm2; this is consistent with the literature data noting that, after oxidation in water at high temperature, 310 H samples recorded the lowest weight gain [1,11]. With the temperature increasing, the weight gain is larger, so the oxidation rate is highly temperature dependent. Moreover, the weight gained by the specimens was used to provide the oxidation kinetics. The plots are based on limited experimental data set because the autoclave tests require long testing periods [5].
The oxidation process is observed to follow a rate law described by:
Δ m S = k p t n
where Δm/S is the oxide weight gain (mg/dm2), kp is the rate constant, t is exposure time (h), and n is the exponent. If n is close to 0.3, the law is cubic; if n is close to 0.5, the law is parabolic; and if n is close to 1, the law is linear [29].
Analyzing weight gain, following the fitting of the curve, it was established that, in the case of this austenitic alloy, the oxidation process is best described by parabolic kinetics (n = 0.564). The parabolic oxidation constants (kp) were determined by fitting the data with Equation (2). The obtained kp values and R-squared value of trend (R2) for plots are presented in Table 2. The R-squared values were calculated to determine the reliability of the trend.
Parabolic kinetics illustrate an oxidation controlled by the diffusion of metal ions and oxygen through a generally protective oxide. When the oxide growth follows a parabolic law, the oxidation kinetic is controlled by oxygen and/or cation diffusion through the oxide scale. In this case, the parabolic constant may be defined as a function of the inward oxygen diffusion and of the outward chromium (or iron) diffusion through the scale by using Wagner’s theory for metal oxidation [5].
Based on the values obtained from the weighing of the samples, the oxide thickness and the corrosion rate were calculated at different periods of oxidation. Figure 2 shows the oxide thickness and the corrosion rate behavior in deaerated water at a supercritical temperature.
From Figure 2, it is noted that the oxide thickness increases with the oxidation time increasing and, simultaneously, corrosion rate decreases. The small values of calculated corrosion rates (10−4 mm/year) indicate a good behavior to general corrosion for this austenitic alloy in water at high temperatures.

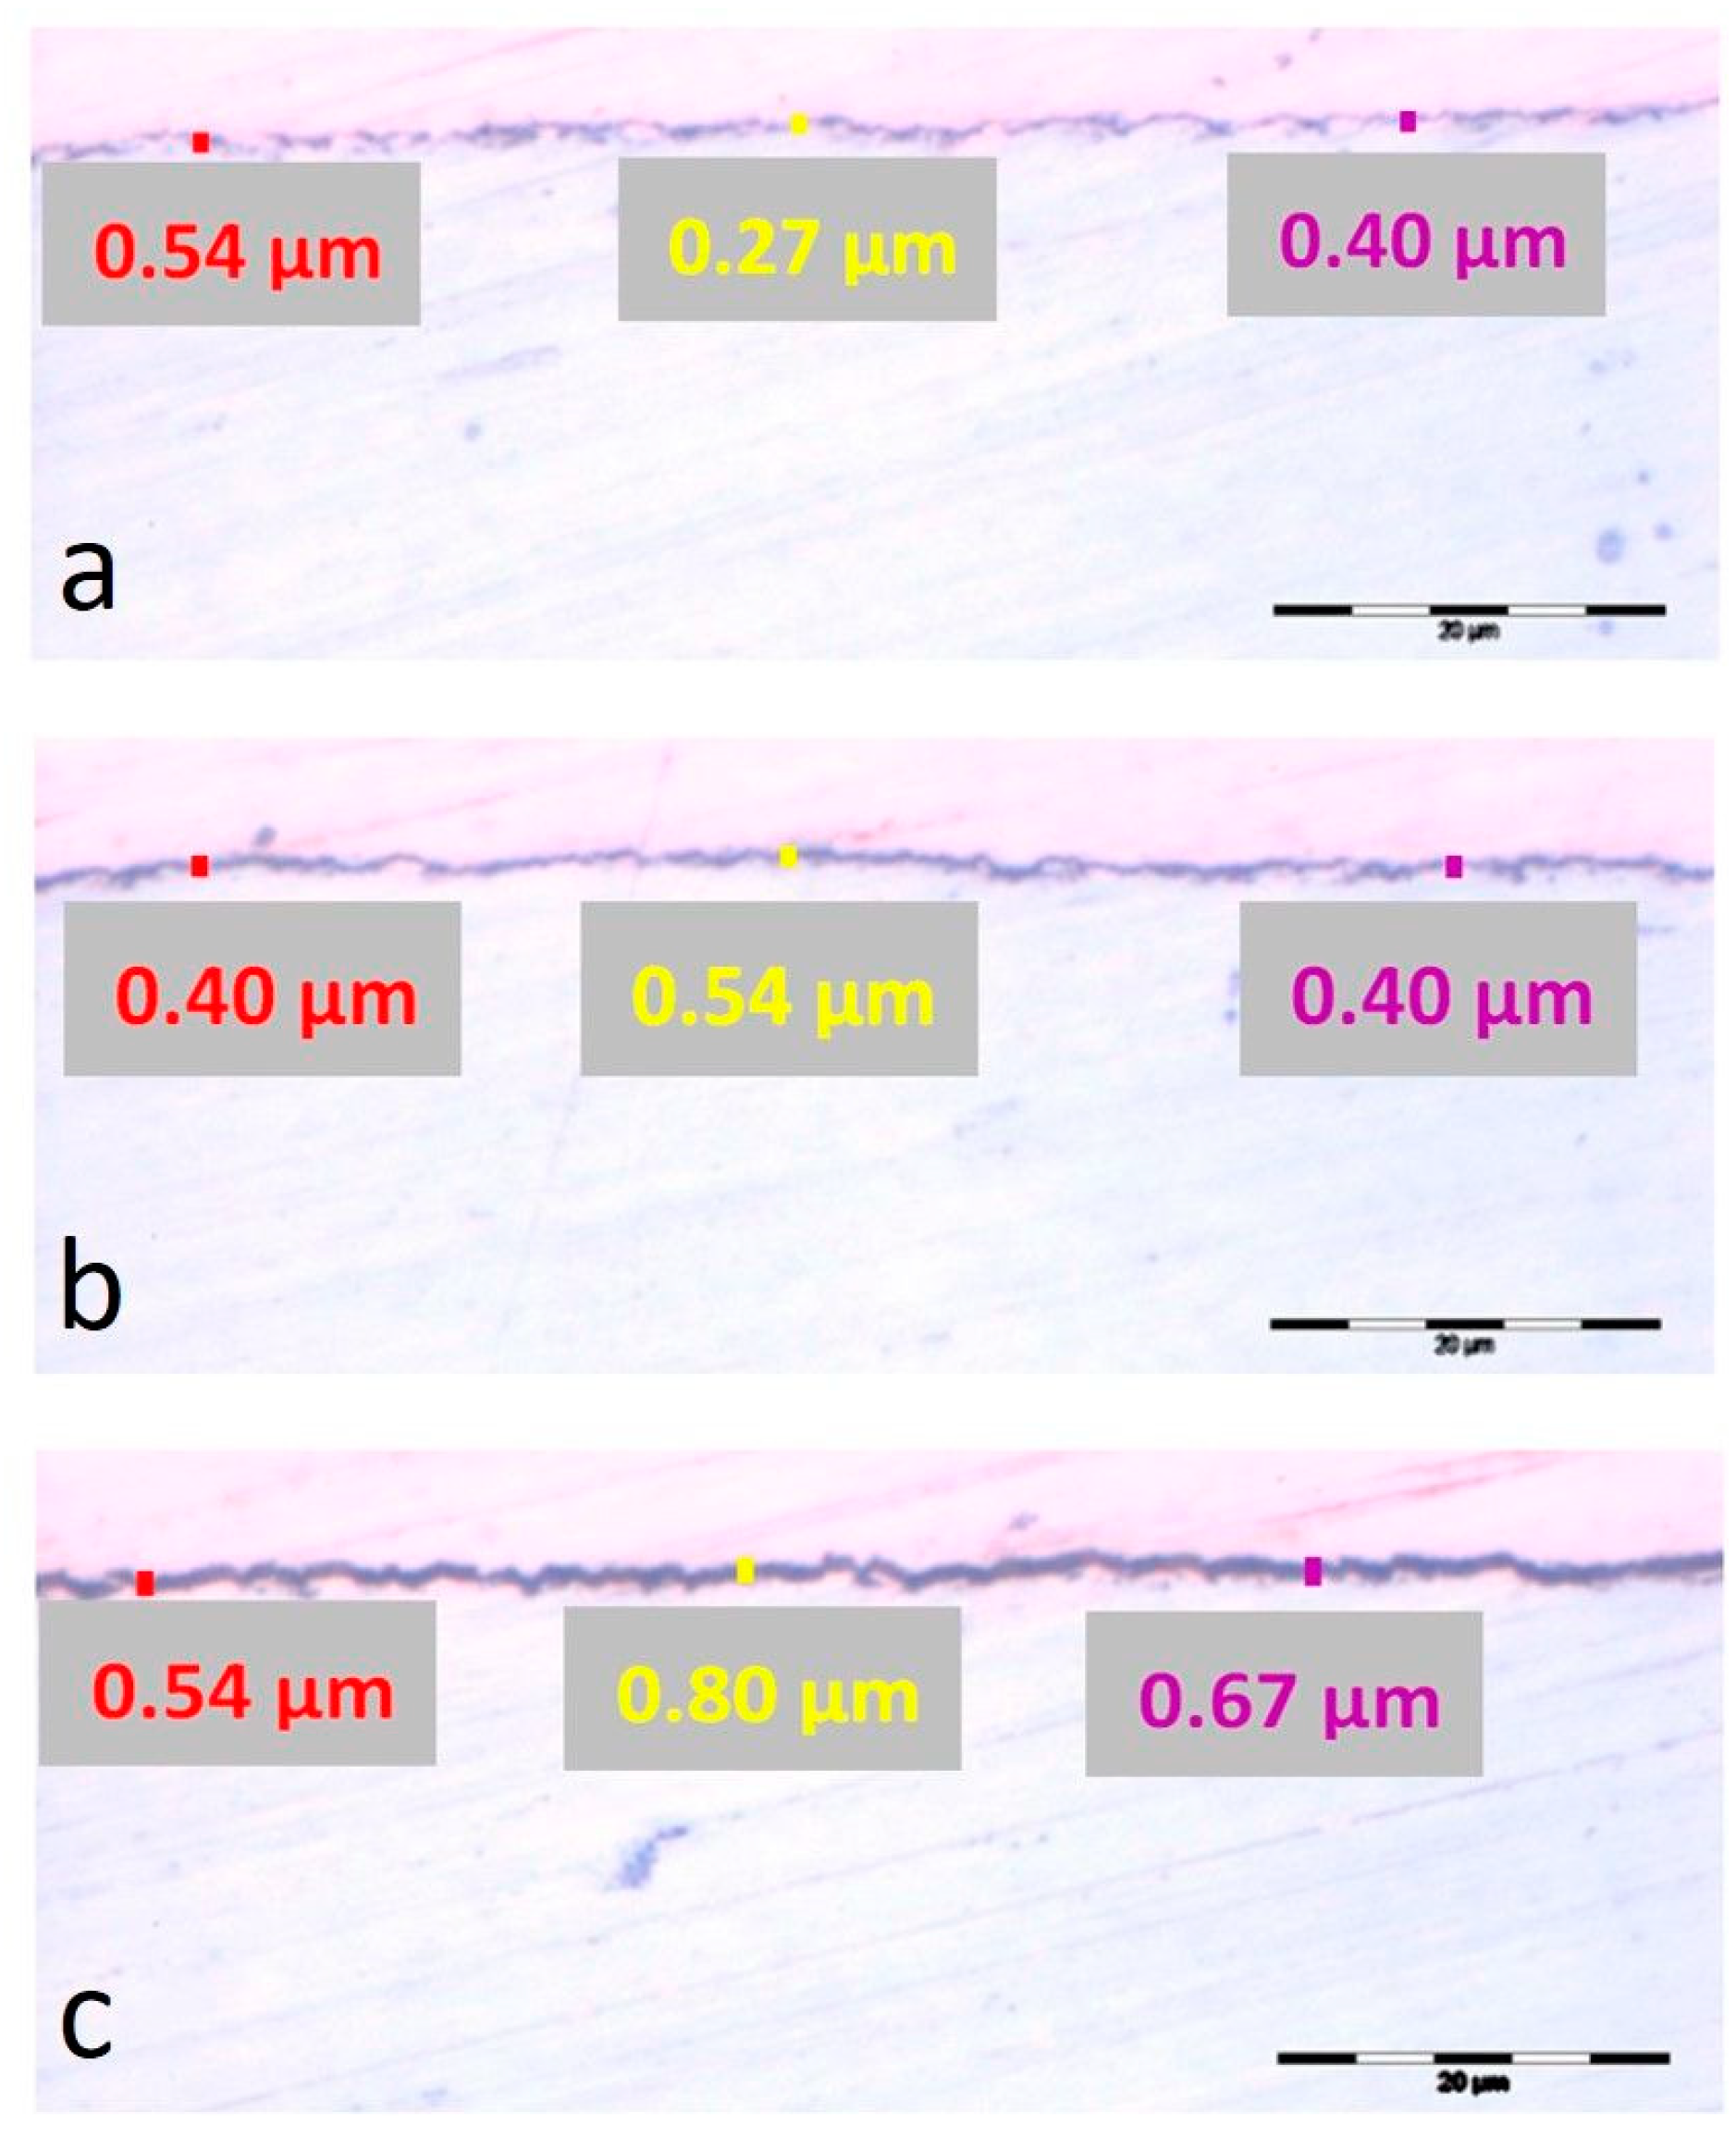
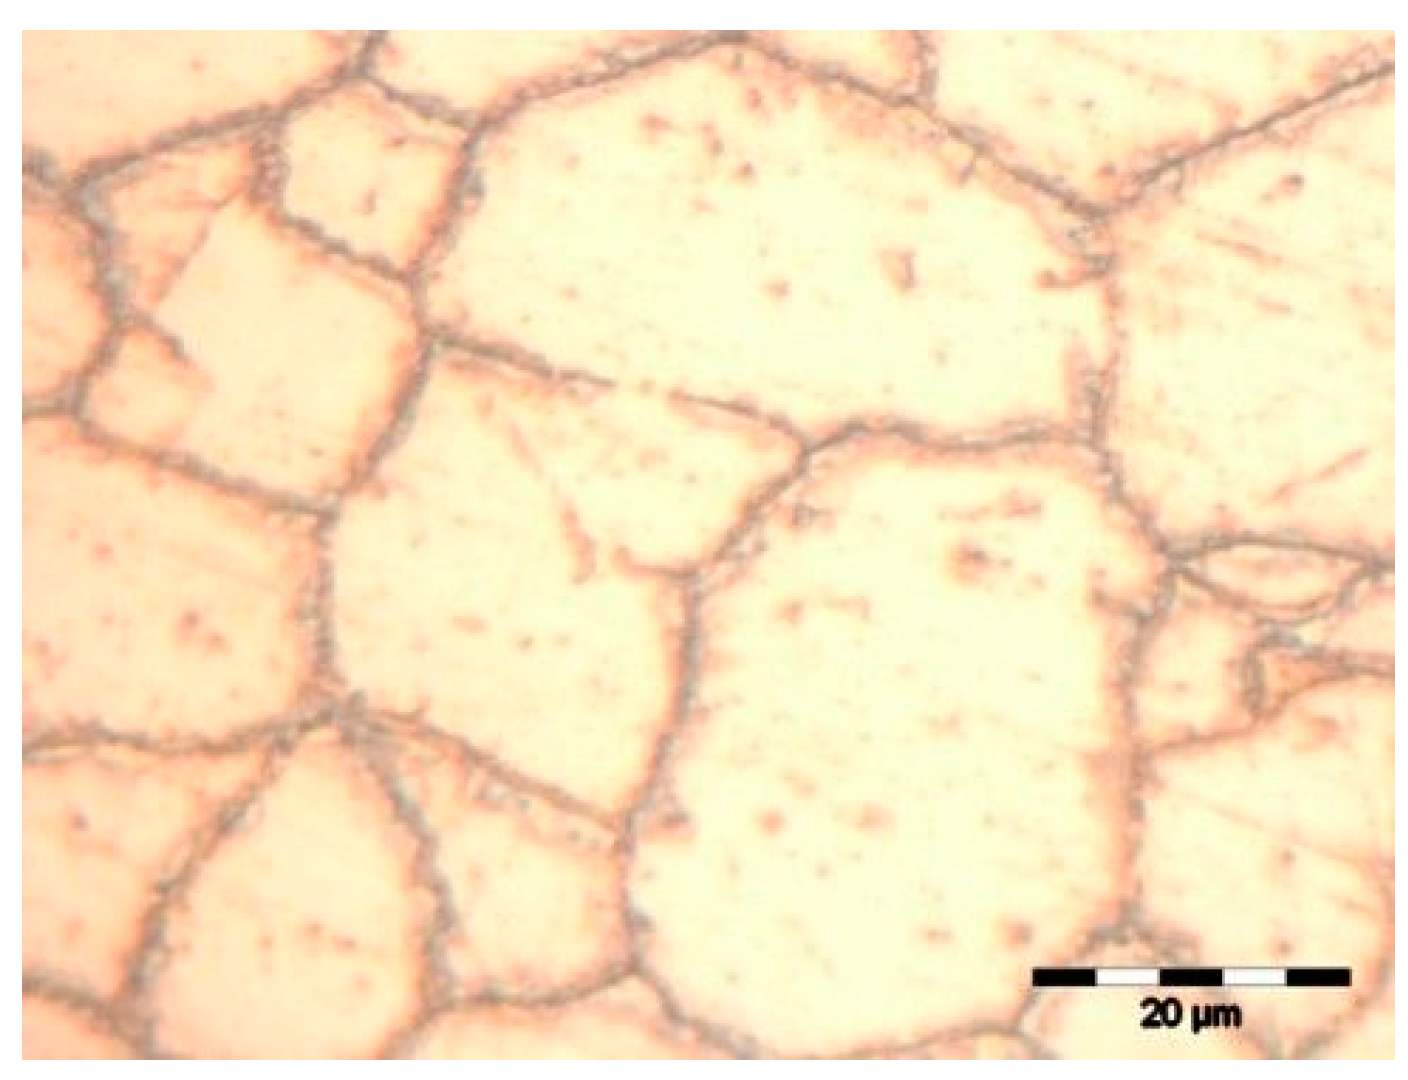
3.2. Metallographic Analysis (Optical Microscopy)

The thicknesses of the oxide layers formed on the 310 H samples surface oxidized during different periods of time in water at a supercritical temperature (500 °C and 250 atm) was measured by metallographic analysis, and is shown in Figure 3.
From Figure 3, a thickening of the oxide layer was observed once the exposure period in water at a supercritical temperature increased, with the oxide layer being very thin and nonuniform. The measuring of oxide layers on 310 H indicated an average thickness of about 0.4 μm for samples oxidized for 720 h, 0.45 μm for samples oxidized for 1440 h, and 0.67 μm for samples oxidized for 2160 h. It should be noted that, by optical microscopy, oxide thickness was measured on only a portion of the sample and did not reflect the actual oxide thickness; therefore, an average was used. The results obtained are consistent with those obtained by weight gain analysis.
The EDS analysis led to the obtaining of the elemental composition in mass percentages for the oxidized samples for 720 h, 1440 h, and 2160 h in a deaerated supercritical static water system. The results obtained are presented in Table 3.
Based on the elemental compositions from Table 3 and XRD results from the literature [10], we can propose the presence of both a Cr2O3 and a spinel [(Fe, Mn) Cr2O4] phase. It is known from the literature [19] that, according to SEM and XRD analysis, it is uncertain whether the Cr2O3 and spinel oxides are layered or in a mixed form. Due to investigations of other stainless steels [30,31,32] tested under steam, and the Cr content in 310S, there are only speculations that a layer of Cr2O3 formed between the substrate and the outer spinel layer.
The microstructure of the samples before and after exposure for 720 h, 1440 h and 2160 h in autoclave is shown in Figure 4.
The micrographs obtained at (×200) and (×500) magnifications for unoxidized samples and oxidized samples reveal an austenitic structure with polyhedral grains and well-marked grain boundaries.
In order to highlight the structure of the oxidized sample for 2160 h in a deaerated supercritical water static system, an optical image, at higher magnification, is shown in Figure 5.
Coarse grain boundary and carbides precipitated at grain boundary are evident in the oxidized samples (×1000 magnification). The microstructural analysis after exposure in water at supercritical temperature lead to a grain increase. The average grain size (G) has been determined by a linear interception method, in accordance with ASTM E-112 [33], in a cross-section, and corresponds to the ASTM number G = 7.5 for unoxidized samples and the ASTM number G = 7.5–8 for samples oxidized different periods of time. The average grain diameter corresponding to this number is between 24.6 µm (for unoxidized sample) and 26.7 µm (for oxidized samples). After 720 h of oxidation, the grain sizes do not change.
From the microhardness tests, made from oxide to alloy, it could be observed there was a slight increase of Vickers hardness values, from 179 ± 3 kgf/mm2 value recorded for unoxidized samples to 199 ± 4 kgf/mm2 for the samples oxidized for 720 h, and then passing through the value of 211 ± 2 kgf/mm2 for the samples oxidized for 1440 h until 217 ± 3 kgf/mm2 for the sample oxidized for 2160 h (with 38 units over initial microhardness). This is because the indentation caught the grain boundaries, where there are carbides.

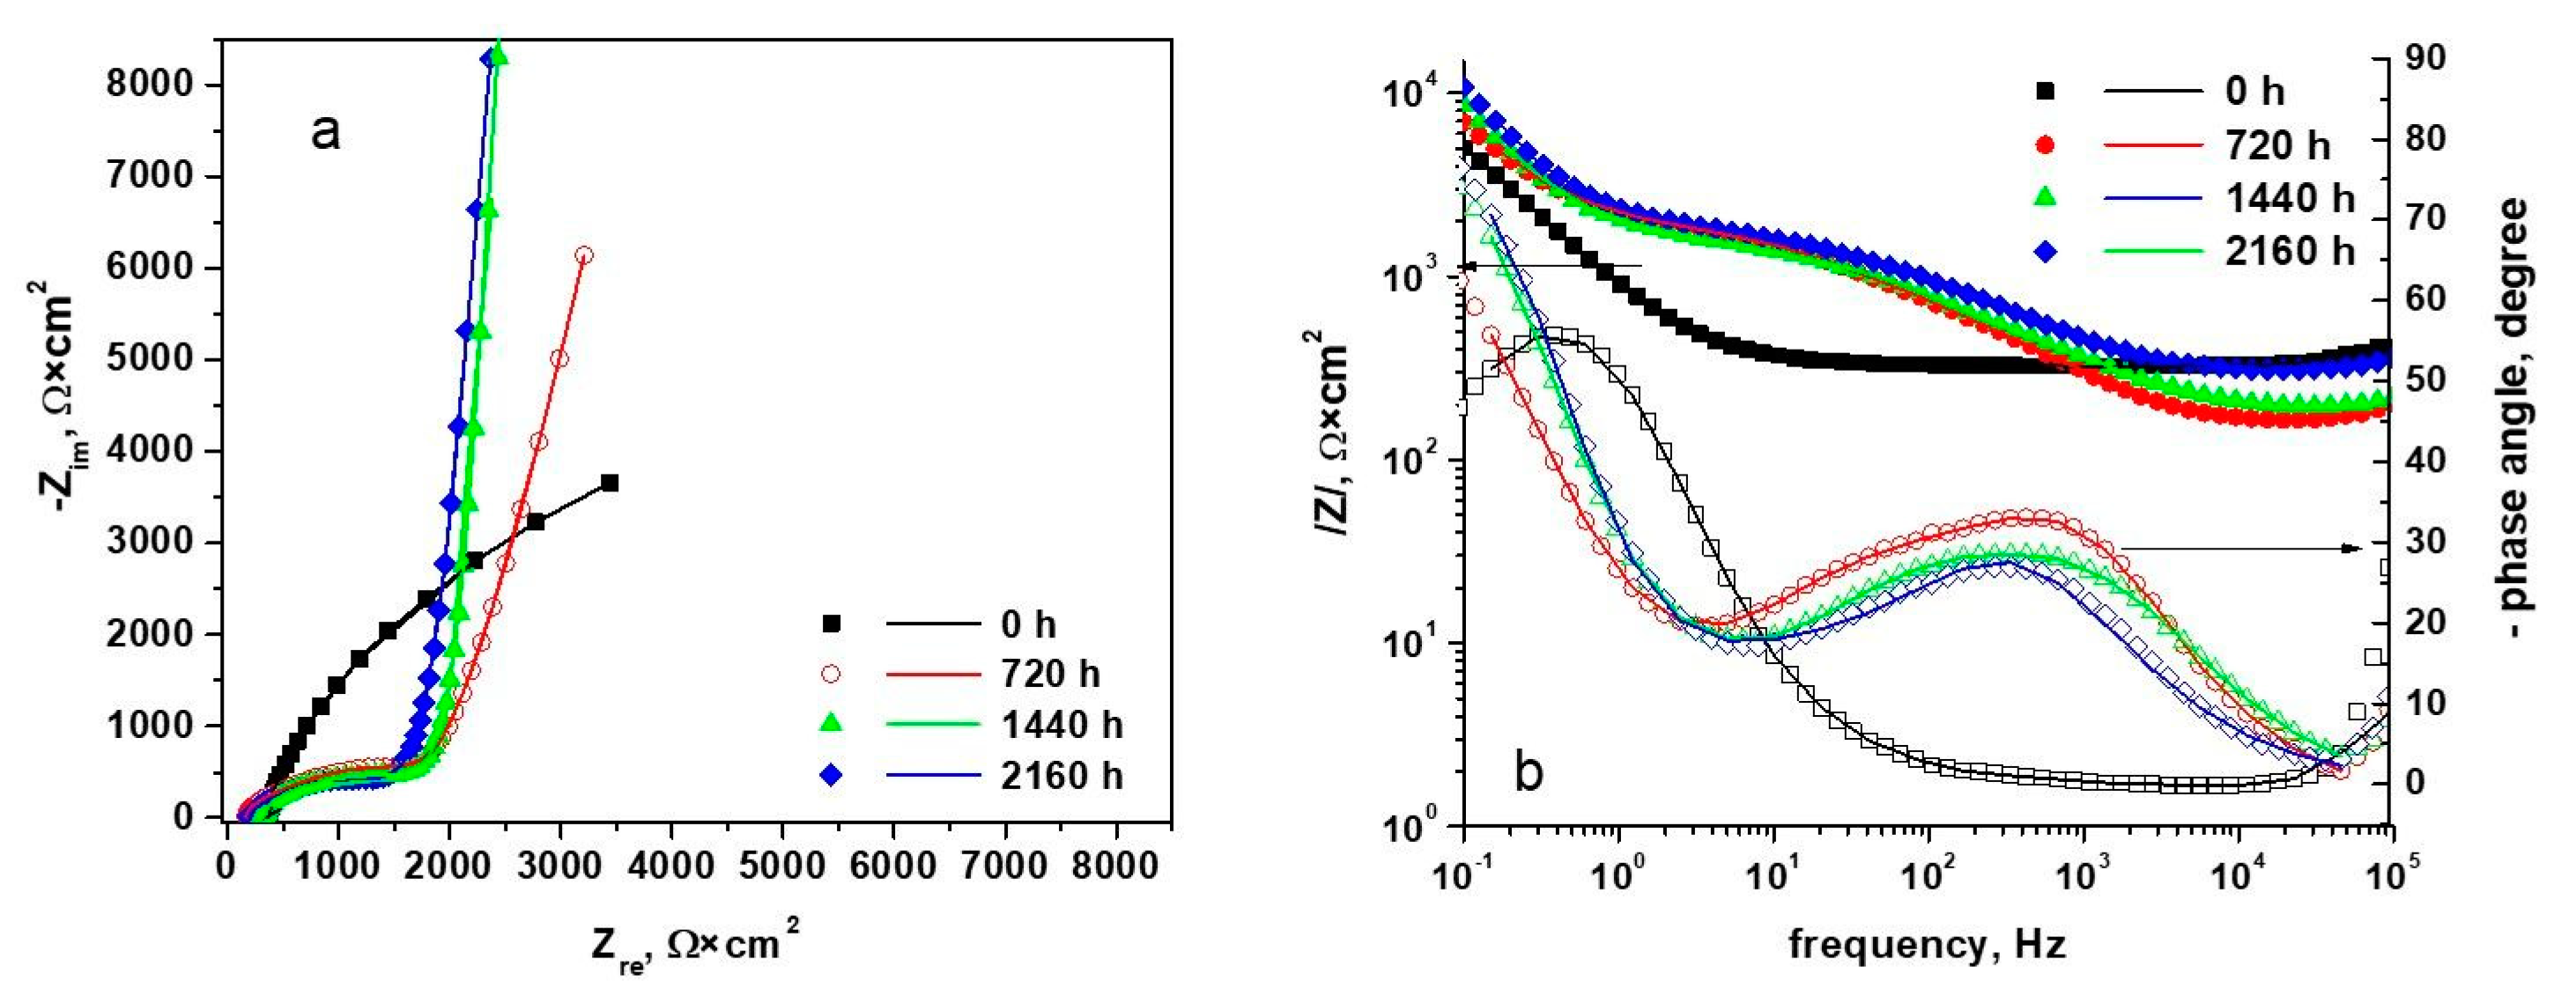
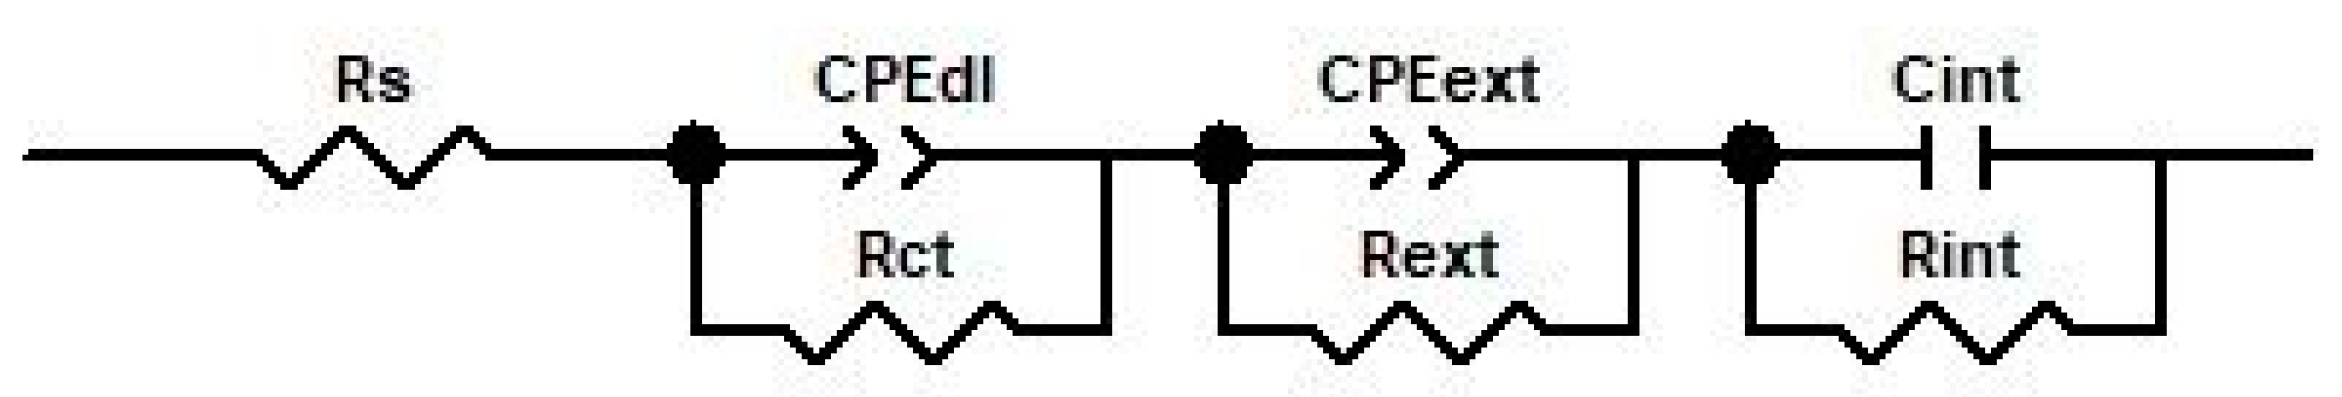
3.3. Electrochemical Impedance Spectroscopy

The characterization of oxide layers on this material has been performed by an EIS method. This method can assess the performances of superficial layers and does not accelerate the electrochemical reactions at a metal/solution interface [34]. Impedance spectra obtained for unoxidized and oxidized samples, measured at open circuit potential, are presented in Figure 6.
As can be seen from the Nyquist diagrams (Figure 6a) for the unoxidized samples, an open capacitive semicircle was obtained, while, for the oxidized samples, two open capacitive semicircles were obtained. The polarization resistances extrapolated from the Nyquist diagrams (Figure 6a) indicate a good corrosion resistance of the oxides formed after a longer period (the diameter in Nyquist diagrams is a measure of polarization resistance, Rp). From Figure 6b, we can see that Bode plots show higher values for electrical resistivity in cases where oxides grow on 310 H surfaces after 2160 h when compared with oxides that have developed after shorter periods in the same conditions. Generally, a higher electrical resistivity (impedance) at a low frequency (<10 Hz) means a higher protectiveness of the oxide. Thus, the oxides obtained on 310 H stainless steel surface after 2160 h of oxidation have better a corrosion behavior than oxides developed on the surface of 310 H stainless steel after 1440 h and 720 h, respectively. Impedance magnitude, |Z|, is proportionally in line with oxide resistance and in an inverse ratio to oxide capacity; as such, a higher impedance value indicates good corrosion resistance. Figure 6 shows a high value of about 104 Ω of impedance modulus for samples oxidized for 2160 h, and, for samples oxidized 1440 h and 720 h, the values are less than 104 Ω. Comparing the impedance magnitude order, the films formed on the oxidized samples for 2160 h in water have better corrosion resistance than the oxides formed on the surface of the oxidized samples for 1440 h and 720 h, under the same conditions. It is also observed that impedance decreases with frequency increasing, which shows that the oxide films had capacitive components.
The protective character of the oxide films formed in water at a supercritical temperature is also provided by the higher values of maximum phase angle (approx. 74.51° for the sample oxidized for 2160 h, 72.94° for the sample oxidized 1440 h, and 62.40° for the sample oxidized 720 h). Figure 6b shows that the Bode plots present a phase angle maximum smaller than 90°, indicating that the oxide films have a capacitive behavior. Generally, a phase angle closer to 90° on a wider range of frequency indicates capacitive properties and higher protectiveness of the oxide [24].
The plot corresponding to the phase angles (Figure 6b) shows the presence of two-time constants at high and low frequencies. This is due to the forming of an inhomogeneous film composed of two layers: an inner compact and protective layer (formed at low frequencies) and a less compact and porous nonprotective outer layer (formed at high frequencies).
The experimental impedance data have been modeled using an electrical equivalent circuit (EEC) using ZView software. The proposed EEC model to fit the experimental impedance spectra is presented in Figure 7. The obtained values of equivalent electrical circuits elements are presented in Table 4. When fitting our theoretical electrical-equivalent circuit, a value of Chi-quadrate (χ2) of approximately 10−3 was found, and the fitting errors were quite small. Figure 6 shows, in all cases, that the correlation between experimental data and simulated data is very strong.
Rs is ohmic resistance of the solution; CPEdl—constant phase element for double layer, and Rct—charge transfer resistance; CPEext, Rext—constant phase element and resistance of the outer oxide layer; Cint, Rint—capacity and resistance of the inner oxide layer.
The small values of the obtained electric double layer capacity characterize the materials with a small specific surface. It is also considered that the values of the electric double layer give indications of the surface roughness of the electrodes; the higher the CPEdl-T, the higher the surface roughness. The oxidized samples for 2160 h have the highest values of charge transfer resistance, so they have the lowest corrosion rate.
To model the capacity of the outer oxide layer, it was not possible to use a capacitive element, and, therefore, a distributive element consisting of the constant phase element CPE. Following the modeling, values lower than 1 were obtained for the parameter CPE-P, which denotes a deviation from an ideal capacitor, so the outer oxide layer has inhomogeneities or is more porous.
In all studied samples, the inner layer can be modeled using a capacitor and not a constant phase element. The capacities and resistances measured at low frequencies correspond to an inner, protective passive film. The inner oxide layer resistance increases with oxidation time increasing; this indicates the forming of more compact and protective oxide films, which denotes that the protective character of the films formed after a longer period. Furthermore, the values of the outer oxide layer resistances decrease with the oxidation time increasing, which denotes the fact that the inner layer develops continuously, and the outer layer is more porous and less adherent.
In all cases, it also can be observed that the values determined for the capacities of the inner layers are larger by an order of magnitude than those of the outer layer, which indicates that the inner layers of this austenitic alloy are thinner than the outer layers. Capacity decreasing and resistance increasing of the oxide, with oxidation time increasing, indicates the forming of thicker and more protective oxide films.
This is in concordance with the literature data [25] suggesting that oxide films formed on electrodes’ surfaces reduce the electrical capacity/unit area; this means that a thicker film is equivalent to a smaller capacity, and a thin layer and protector corresponds to an increased electrical capacity.
In Table 5, the Rp values established by the Nyquist diagram extrapolation and the corrosion density current calculated from Buttler–Volmer equation, are presented.
From the extrapolation of the Nyquist diagrams (Figure 6a), we can see that the oxides developed on the 310 H SS samples surface after 2160 h have the highest values of polarization resistance (2.014 × 10⁵ Ω*cm−2) and the lowest corrosion currents (0.0629 µA/cm2) (Table 5). According to the Buttler–Volmer equation, polarization resistance is inversely proportional to the density of the corrosion current, so that a higher value of polarization resistance indicates a lower value of the corrosion rate. The conclusion would be that oxidized steel samples, exposed for a longer period in a supercritical environment, have lower corrosion rates compared to non-oxidized samples and oxidized ones, respectively, for a shorter period, which is consistent with the results obtained by gravimetric experiments.
The fact that the inner layer is thinner than the outer one also results from the calculation of the thickness of the oxide layers using a parallel plane capacitor formula (Equation (3)).
C = ε ε 0 S d
C is the capacity of the oxide layer [F/cm2]; ε—dielectric constant of the oxide film; ε0—vacuum dielectric permittivity (8.85 × 10⁻¹⁴ F/cm); S—electrode surface [cm2]; d—oxide layer thickness [cm]. In the literature [26,35], a value of 15.6 was found for the dielectric constant of the oxide film formed on austenitic stainless steels. This value is reasonable because the dielectric constants of oxides formed on stainless steels (Cr2O3, FeO, Fe3O4 and Fe2O3 are between 10–20 [36]. In Table 6, the values of layer thickness obtained using the plane capacitor formula for samples oxidized for 720 h, 1440 h, and 2160 h, in supercritical medium (water at 550 °C and 250 atm.), are presented and, comparatively, the values of layer thickness are determined gravimetrically.
From this table, we can see that the values of the layer thickness, determined by the impedance spectroscopy method, have the same order of magnitude (10−3 µm) with the values obtained by the gravimetric analysis method. In conclusion, it can be noted that the results obtained by the EIS method are in strong agreement with the results obtained by gravimetric analysis, and they confirm that the oxide formed on the 310 H SS surface for a longer period is something thicker and more protective compared to the film formed on the surface of oxidized samples, for a shorter period, which is thinner and less protective.

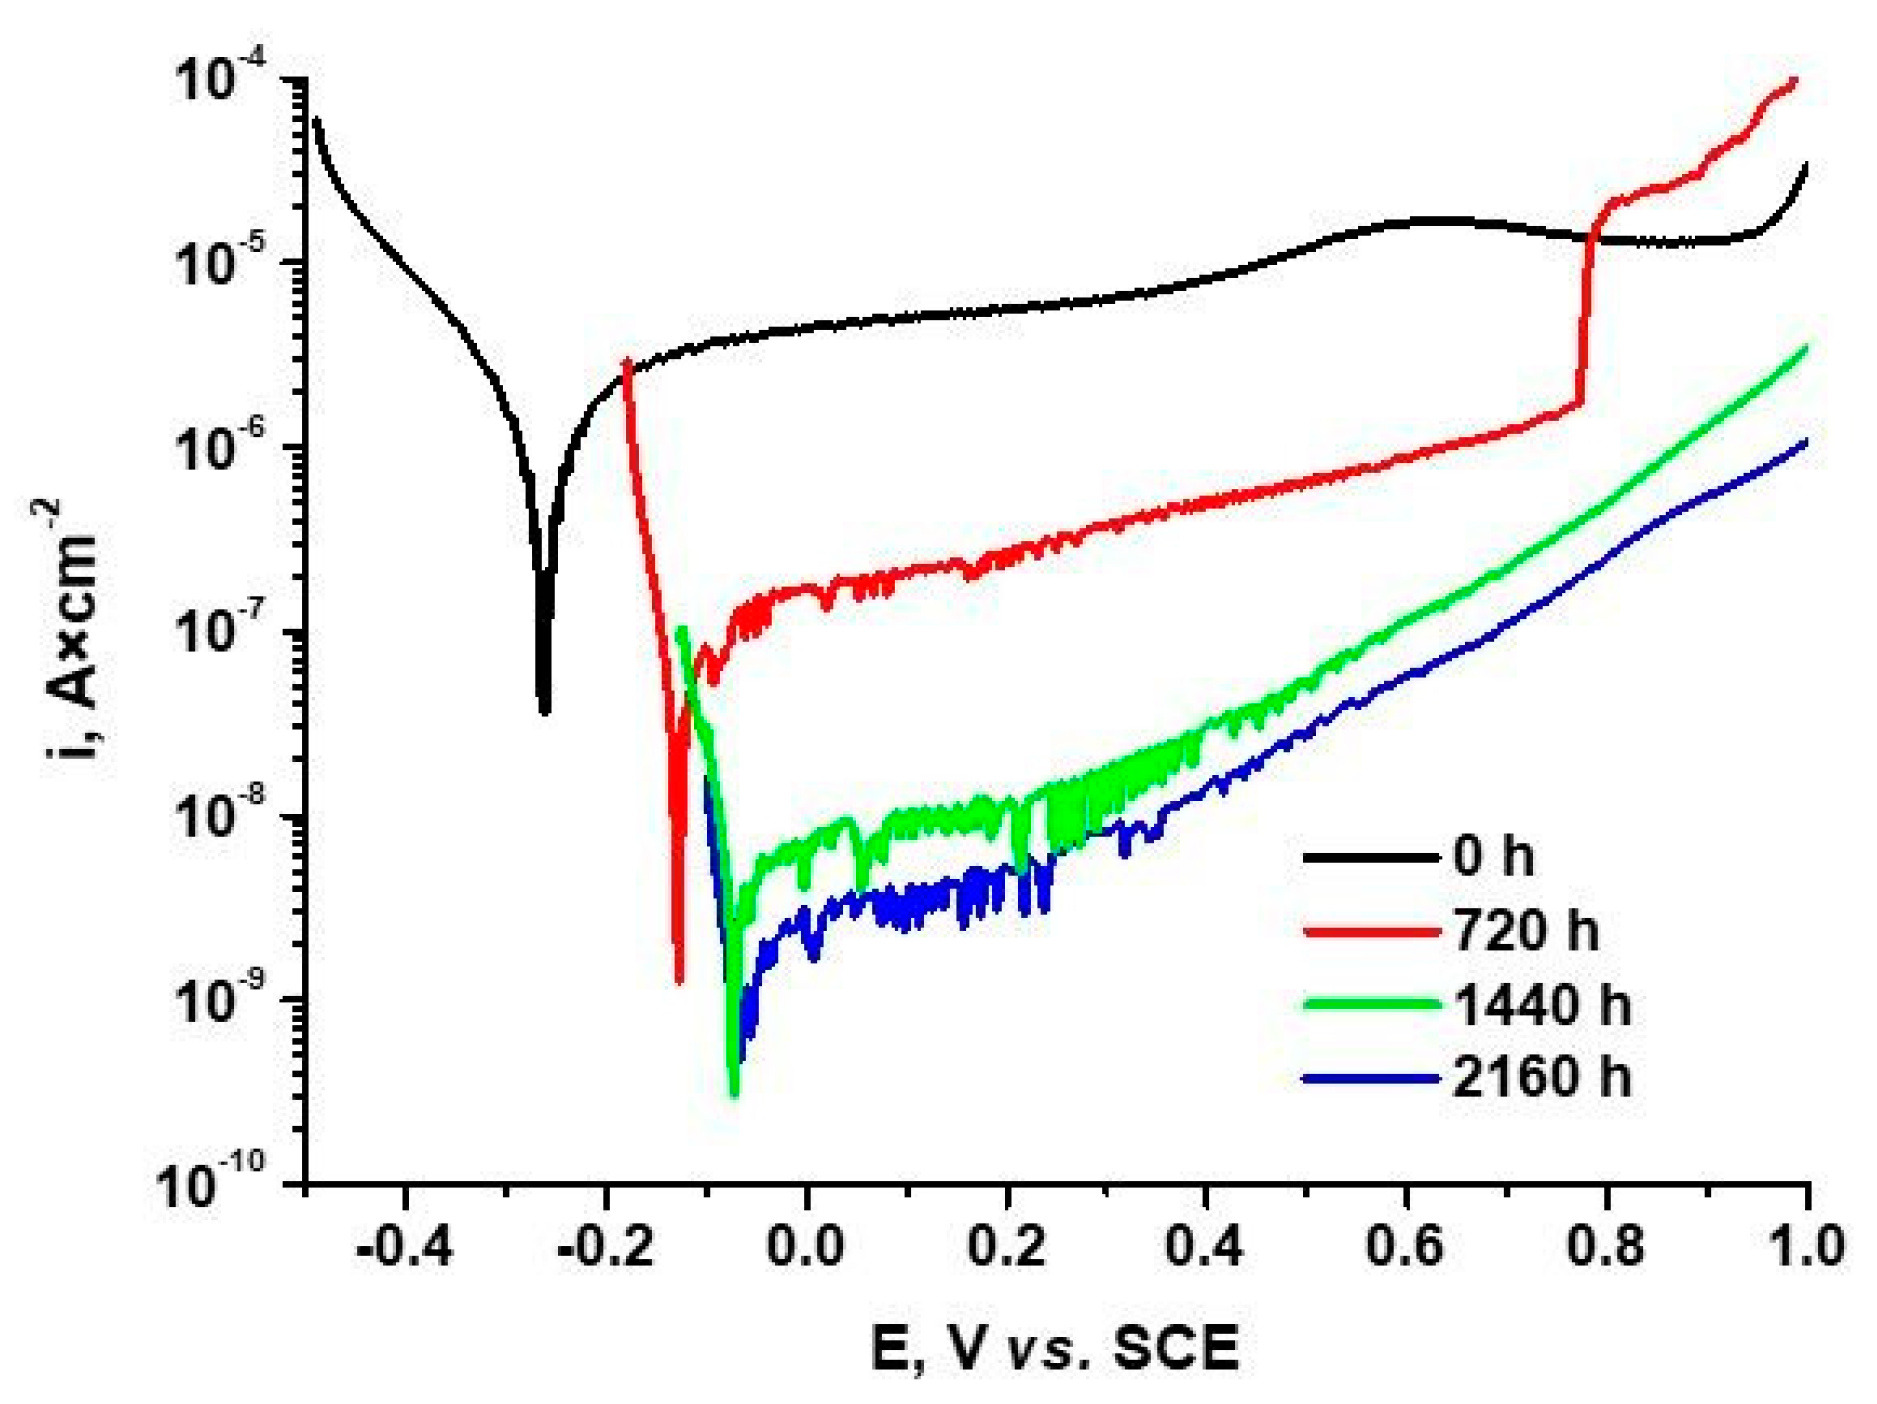
3.4. Potentiodynamic Polarization

The protective character of oxides formed in water at a supercritical temperature was electrochemically investigated by linear polarization tests in boric acid/borax solution with a pH between 7.7–7.8. This solution is chemically inert and did not affect the oxide layers’ features.
Using the linear polarization method, potentiodynamic polarization plots were recorded and presented in Figure 8.
The electrochemical parameters (corrosion rate, polarization resistance, corrosion potential and current density) calculated from the extrapolation of Tafel slopes and polarization resistances (Rp) are presented in Table 7. Based on the electrochemical parameters obtained, the protective efficiency, Pi (%), and the porosity, P (%), of the oxide films were determined according to Equations (4) and (5). Porosity is an important parameter for evaluating defect densities [37]. Low porosity indicates favorable protective efficiency. In evaluating porosity, various electrochemical techniques can be used, with the simplest being the polarization resistance method [38,39].
P i % = 1 i c o r r i c o r r 0 × 100
where: icorr and icorr0 are the corrosion current density of the oxide film and substrate, respectively.
P % = R p s R p × 10 E c o r r β a
where: P is the total oxide film porosity; Rps and Rp are the polarization resistance of the substrate and the oxide, respectively; βa is the anodic Tafel slope of the substrate; and ΔEcorr is the difference between the corrosion potentials of the coating and the substrate.
From Figure 8 and Table 7, it can be observed that the samples oxidized in water at a supercritical temperature are protective and provide better corrosion resistance. This is indicated by lower values of passivation current densities, more electropositive values of corrosion potentials, and lower values of corrosion rate. The low corrosion rates (an order of 10−5 mm/year) obtained in the case of oxidized 310 H samples for a longer period in a supercritical environment indicate that the oxides formed at a supercritical temperature give passivity to the alloy. Generally, on a potentiodynamic polarization plot, passivation is characterized by a decrease in current density values by several orders of magnitude.
Moreover, we can see that the samples oxidized in water at 550 °C for 2160 h have the highest protective efficiency (98.25%) and the lowest porosity (0.27%), the highest polarization resistance, and the lowest corrosion current density (and thus the lowest corrosion rate). This indicates the formation of more protective films on the surface of 310 H samples oxidized for a longer period in supercritical water, and the formation of less protective films on the surface samples oxidized for a shorter period (720 h and 1440 h) under the same conditions.
This is in concordance with the literature data [40,41,42] noting that the samples with lower porosity, lower corrosion current densities and lower corrosion rates, higher polarization potentials, and resistances higher polarization indicated the best oxide protective efficiencies (and have the best ability to prevent corrosion); this indicates a correlation between porosity, which is a measure of the density of the oxide defect, and its corrosion behavior.

4. Conclusions

Morphological and electrochemical behaviors of oxide formed on austenitic stainless steel, 310 H, as one of the candidate materials for internal components of SCWRs, in water at a supercritical temperature, were studied.
Gravimetric analysis showed that oxidation of 310H stainless steel at 550 °C follows parabolic rate, indicating that is driven by a diffusion process. As the oxidation period increased, the thickness of the oxides increased and the corrosion rates decreased. The low values of the calculated corrosion rates indicated a good, generalized corrosion behavior of this austenitic alloy in water at a high temperature.
Microstructural analysis highlighted an austenitic structure with polyhedral grains and well-marked grain boundaries.
The polarization resistances extrapolated in the Nyquist diagrams indicated a good corrosion resistance of the oxides formed after a longer period.
The experimental results, fitted with ZView software, indicated a good correlation between experimentally measured and calculated values. Very low corrosion rates, of the order of 10−5 mm/year, obtained in the case of oxidized samples for a longer period, indicated that the oxides formed after oxidation of this alloy in water at a supercritical temperature, are more protective and provide more corrosion resistance.
The highest protective efficiency and the lowest porosity obtained in the case of oxidized samples for a longer period indicated the formation of more protective films on 310 H stainless steel surfaces. This is also indicated by the lower values of corrosion current densities, corrosion rates, higher corrosion potentials, and higher polarization resistances obtained in the case of oxidized samples for a longer period.
The EIS analysis with Bode and Nyquist plots, equivalents circuits, and calculated kinetic parameters confirm the fact that the protective efficiency of the oxides layer increased with oxidation time increasing—a conclusion evidenced in the potentiodynamic method as well.
Based on the results obtained, a good correlation between gravimetric analysis, metallographic analysis, and electrochemical method was found.

Author Contributions

Conceptualization, I.D. and M.F.; methodology, A.E.T.; software, A.E.T. and F.G.; validation, A.E.T., I.D. and F.G.; formal analysis, A.E.T. and M.F.; investigation, M.F.; data curation, A.E.T., I.D. and F.G.; writing—original draft preparation, A.E.T. and M.F.; writing—review and editing, I.D. and F.G.; visualization, F.G.; supervision, I.D. and M.F.; project administration, F.G.; All authors have read and agreed to the published version of the manuscript.

Funding

This research was funded by Romanian Ministry of National Education, UEFISCDI, grant number NECOMAT-326PED/2020.

Institutional Review Board Statement

Not applicable.

Informed Consent Statement

Not applicable.

Data Availability Statement

The data presented in this study are available upon request.

Acknowledgments

The authors acknowledge the financial support from the Romanian Ministry of National Education, UEFISCDI (NECOMAT-326PED/2020).

Conflicts of Interest

The authors declare no conflict of interest.

References

  1. Mohammadi, T.; Huang, X. Effect of Al and Ti addition on performance of stainless steel 310 in supercritical water. Corros. Eng. Sci. Techn. 2014, 50, 292–302. [Google Scholar] [CrossRef]
  2. US DOE. Nuclear Energy Research Advisory Committee. Generation IV International Forum, A Technology Roadmap for Generation IV Nuclear Energy System; Technical Report; U.S. Department of Energy Office of Scientific and Technical Information: Oak Ridge, TN, USA, 2002; pp. 1–18. [CrossRef] [Green Version]
  3. Buongiorno, J.; Corwin, W.; MacDonald, P.; Mansur, L.; Nanstad, R.; Swindeman, R.; Rowcliffe, A.; Was, G.; Wilson, D.; Wright, I. The Supercritical Water Reactor (SCWR) Survey of Materials Experience and R&D Needs to Assess Viability; INEEL/EXT-0300693 Rev.1; Idaho National Laboratory: Idaho Falls, ID, USA, 2003. [Google Scholar]
  4. Corwin, W.R. U.S. Generation IV reactor integrated materials technology program. Nucl. Eng. Technol. 2006, 38, 591–618. [Google Scholar]
  5. Fulger, M.; Mihalache, M.; Ohai, D.; Fulger, S.; Valeca, S.C. Analyses of oxide films grown on AISI 304L stainless steel and Incoloy 800HT exposed to supercritical water. J. Nucl. Mater. 2011, 415, 147–157. [Google Scholar] [CrossRef]
  6. Huang, X.; Yang, Q.; Guzonas, D. Performance of Chemical Vapor Deposition and Plasma Spray-Coated Stainless Steel 310 in Supercritical Water. J. Nucl. Eng. Radiat. Sci. 2016, 2, 021011. [Google Scholar] [CrossRef]
  7. Murty, K.L.; Charit, I. Structural Materials for Gen-IV Nuclear Reactors: Challenges and Opportunities. J. Nucl. Mater. 2008, 383, 189–195. [Google Scholar] [CrossRef]
  8. Tapping, R.L. Materials performance in CANDU reactors: The first 30 years and the prognosis for life extension and new designs. J. Nucl. Mater. 2008, 383, 1–8. [Google Scholar] [CrossRef]
  9. Xu, S.; Zheng, W.; Yang, L. A review of irradiation effects on mechanical properties of candidate SCWR fuel cladding alloys for design considerations. CNL Nuclear Rev. 2016, 5, 309–331. [Google Scholar] [CrossRef]
  10. Galan, F.; Ducu, M.C.; Fulger, M.; Negrea, D.A. Investigation of oxidation behavior of 304l and 310s steels with potential application in supercritical water-cooled nuclear reactors. Rev. Chim. 2020, 71, 98–105. [Google Scholar] [CrossRef]
  11. Guzonas, D.A.; Wills, J.S.; McRae, G.A.; Sullivan, S.; Chu, K.; Heaslip, K.; Stone, M. Corrosion-Resistant Coatings for Use in a Supercritical Water CANDU Reactor. In Proceedings of the 12th International Conference on Environmental Degradation of Materials in Nuclear Power System-Water Reactors, The Minerals, Metals & Materials Society, Salt Lake City, UT, USA, 14–18 August 2005. [Google Scholar]
  12. Was, G.S.; Ampornrat, P.; Gupta, G.; Teysseyre, S.; West, E.A.; Allen, T.R.; Sridharan, K.; Tan, L.; Chen, Y.; Ren, X.; et al. Corrosion and stress corrosion cracking in supercritical water. J. Nucl. Mater. 2007, 371, 176–201. [Google Scholar] [CrossRef]
  13. Ehrlich, K.; Konys, J.; Heikinheimo, L. Materials for high performance light water reactors. J. Nucl. Mater. 2004, 327, 140–147. [Google Scholar] [CrossRef]
  14. Nakazono, Y.; Iwai, T.; Abe, H. General corrosion properties of modified PNC1520 austenitic stainless steel in supercritical water as a fuel cladding candidate material for supercritical water reactor. J. Phys. Conf. Ser. 2010, 215, 012094. [Google Scholar] [CrossRef]
  15. Selvig, A.; Huang, X.; Kim, D.J.; Guzonas, D. Surface oxide formation on IN625 and plasma sprayed NiCrAlY after high density and low density supercritical water testing. Mater. Corros. 2012, 65, 768–777. [Google Scholar] [CrossRef]
  16. Li, J. Materials Selection for the Canadian Supercritical Water-Cooled Nuclear Reactor Concept. JOM 2016, 68, 452–453. [Google Scholar] [CrossRef] [Green Version]
  17. Zeng, Y.; Guzonas, D. Corrosion Assessment of Candidate Materials for Fuel Cladding in Canadian SCWR. JOM 2016, 68, 475–479. [Google Scholar] [CrossRef]
  18. Allen, T.; Chen, Y.; Tan, L.; Ren, X.; Sridharan, K. Corrosion of Candidate Materials for Supercritical Water-Cooled Reactor. In Proceedings of the 12th International Conference on Environmental Degradation of Materials in Nuclear Power System-Water Reactors, Salt Lake City, UT, USA, 14–18 August 2005; Allen, T.R., King, P.J., Nelson, L., Eds.; TMS (The Minerals, Metals & Materials Society): Pittsburgh, PA, USA; pp. 1397–1405. [Google Scholar]
  19. Bsat, S.; Huang, X. Corrosion Behaviour 310 Stainless Steel in Superheated Steam. Oxid. Met. 2015, 84, 621–631. [Google Scholar] [CrossRef]
  20. Huang, X.; Sanchez, R. Effect of water or steam pressure on the oxidation behaviour of alloy 625 and A286 at 625 °C. CNL Nucl. Rev. 2016, 5, 333–343. [Google Scholar] [CrossRef] [Green Version]
  21. Bsat, S.; Xiao, B.; Huang, X.; Penttilä, S. Oxidation Behaviour of Alloys 800H, 3033 and 304 in High-Temperature Supercritical Water. Oxid. Met. 2018, 89, 151–163. [Google Scholar] [CrossRef]
  22. Bsat, S.; Huang, X.; Penttila, S. Corrosion behaviour of bare and nicraly coated alloy 214 in supercritical water at 700 °C. J. Nucl. Eng. Radiat. Sci. 2018, 4, 021007. [Google Scholar] [CrossRef] [Green Version]
  23. Xiao, B.; Tepylo, N.; Huang, X.; Zhou, Z.; Penttilä, S. Oxidation behavior of alumina-forming austenitic steels in superheated steam at 700 °C. J. Nucl. Eng. Radiat. Sci. 2020, 6, 031109. [Google Scholar] [CrossRef]
  24. Gomez-Briceno, D.; Castro, L.; Biazquez, F. Oxidation of stress corrosion cracking of stainless steels in SCWR. In Structural Materials for Innovative Nuclear Systems; Forschangszentrum Karlsruhe: Karlsruhe, Germany, 2007. [Google Scholar]
  25. Radulescu, M.; Pirvan, I.; Lucan, D.; Fulger, M. The use of some electrochemical methods in the study of the superficial films formed on some carbon steel used in a CANDU NPS. In Proceedings of the 7th European Symposium on Corrosion Inhibitors, Ferrara, Italy, 17–21 September 1990. [Google Scholar]
  26. Hakiki, N.E.; Boudin, S.; Rondot, B.; Da Cunha Belo, M. The electronic structure of passive films formed on stainless steels. Corros. Sci. 1995, 37, 1809–1822. [Google Scholar] [CrossRef]
  27. Outokumpu Stainless AB Company. Inspecţion Certificate No. 1293516/18.05.2007-1.4484; Outokumpu Stainless AB Company: Dalarna, Sweden.
  28. Fattah-al Hosseini, A.; Taheri Shoja, S.; Heydari Zebardast, B.; Mohamadian Samim, P. An electrochemical impedance spectroscopic study of the passive state on AISI 304 stainless steel. Int. J. Electrochem. 2011, 152143, 1–8. [Google Scholar] [CrossRef] [Green Version]
  29. Morcillo, M.; Chico, B.; Díaz, I.; Cano, H.; de la Fuente, D. Atmospheric corrosion data of weathering steels. A review. Corros. Sci. 2013, 77, 6–24. [Google Scholar] [CrossRef] [Green Version]
  30. Huang, X.; Xiao, K.; Fang, X.; Xiong, Z.; Wei, L.; Zhu, P.; Li, X. Oxidation behavior of 316L austenitic stainless steel in high temperature air with long-term exposure. Mater. Res. Express 2020, 7, 066517. [Google Scholar] [CrossRef]
  31. Behnamian, Y.; Mostafaei, A.; Kohandehghan, A.; Zahiri, B.; Zheng, W.; Guzonas, D.; Chmielus, M.; Chen, W.; Luo, J.L. Corrosion behavior of alloy 316L stainless steel after exposure to supercritical water at 500 °C for 20,000 h. J. Supercritic. Fluid 2017, 127, 191–199. [Google Scholar] [CrossRef]
  32. Hakan, U. Oxidation Behavior of Very High Temperature Reactor (VHTR) Candidate Materials: 316L Stainless Steel, Alloy 617, and Incoloy-800H. Ph.D. Thesis, University of Missouri, Columbia, MI, USA, 2016. [Google Scholar]
  33. ASTM E 112-96. Standard Test Methods for Determining Average Grain Size; ASTM International: West Conshohocken, PA, USA, 2004. [Google Scholar]
  34. Cicek, V. Corrosion Engineering; Martin Scrivener, Phillip Carmical: Beverly, MA, USA, 2014. [Google Scholar] [CrossRef]
  35. Simoes, A.M.P.; Ferreira, M.G.S.; Rondot, B. Study of passive films formed on AISI 304 stainless steel by impedance measurements and photoelectrochemistry. J. Electrochem. Soc. 1990, 137, 82–87. [Google Scholar] [CrossRef]
  36. Boudalia, M.; Guenbour, A.; Bellaouchou, A.; Fernandez-Domene, R.M.; Garcia-Anton, J. Corrosion behaviour of a highly alloyed austenitic Alloy UB6 in contaminated phosphoric acid. Int. J. Corros. 2013, 363826, 363826. [Google Scholar] [CrossRef] [Green Version]
  37. Olasunkanmi, J.A. Surface Defects Characterization and Electrochemical Corrosion Studies of TiAlN, TiCN and AlCrN PVD Coatings. Materials and Processes of Sustainable Energetics KAYM09. Master’s Thesis, Tallinn University of Technology, Tallinn, Estonia, 2016. [Google Scholar]
  38. Lakatos-Varsányi, M.; Falkenberg, F.; Olefjord, I. The influence of phosphate on repassivation of 304 stainless steel in neutral chloride solution. Electrochim. Acta 1998, 43, 187–197. [Google Scholar] [CrossRef]
  39. Yoo, Y.H.; Hong, J.H.; Kim, J.G.; Lee, H.Y.; Han, J.G. Effect of Si addition to CrN coatings on the corrosion resistance of CrN/stainless steel coating/substrate system in a deaerated 3.5 wt% NaCl solution. Surf. Coat. Technol. 2007, 201, 9518–9523. [Google Scholar] [CrossRef]
  40. Zhang, L.; Chen, Y.; Feng, Y.P.; Chen, S.; Wan, Q.L.; Zhu, J.F. Electrochemical characterization of AlTiN, AlCrN and AlCrSiWN coatings. Int. J. Refract. Met. Hard Mater. 2015, 53, 68–73. [Google Scholar] [CrossRef]
  41. Yoo, Y.H.; Le, D.P.; Kim, J.G.; Kim, S.K.; Van Vinh, P. Corrosion behavior of TiN, TiAlN, TiAlSiN thin films deposited on tool steel in the 3.5 wt.% NaCl solution. Thin Solid Films 2008, 516, 3544–3548. [Google Scholar] [CrossRef]
  42. William Grips, V.K.; Barshilia, H.C.; Selvi, V.E.; Rajam, K.S. Electrochemical behavior of single layer CrN, TiN, TiAlN coatings and nanolayered TiAlN/CrN multilayer coatings prepared by reactive direct current magnetron sputtering. Thin Solid Films 2006, 514, 204–211. [Google Scholar] [CrossRef]
Figure 1. Oxidation kinetics of 310 H samples in supercritical water.
Metals 11 00571 g001
Figure 2. Oxide thickness and corrosion rate dependence on exposure time in deaerated supercritical static water of the 310 H samples.
Metals 11 00571 g002
Figure 3. Optical micrographs for oxide layer thickness of oxidized samples for 720 h (a), 1440 h (b), and 2160 h (c) in water at 550 °C and 250 atm. (×500 magnification).
Metals 11 00571 g003
Figure 4. Optical micrographs showing the microstructure for unoxidized (a,b) and oxidized samples in supercritical static water for 720 h (c,d), 1440 h (e,f), and 2160 h (g,h) at 550 °C at (×200) and (×500) magnifications.
Metals 11 00571 g004
Figure 5. Optical micrography for 310H oxidized in supercritical static water for 2160 h at ×1000 magnification.
Metals 11 00571 g005
Figure 6. Nyquist (a) and Bode (b) diagrams for 310H samples after different oxidation times at 500 °C and 250 atm. Symbols show experimental data, whereas lines represent fitted data using the electrical equivalent circuit (EEC).
Metals 11 00571 g006
Figure 7. Model for the equivalent electrical circuits proposed for fitting the experimental impedance spectra.
Metals 11 00571 g007
Figure 8. Potentiodynamic plots for unoxidized and oxidized 310 H samples in water at a supercritical temperature (550 °C and 250 atm.).
Metals 11 00571 g008
Table 1. Chemical composition of 310 H SS (provided by the supplier) [27].
Alloying Elements, [wt. %]
CSiMnPSCrNiNFe
0.0630.711.610.0160.00124.1319.030.0454.34
Table 2. Kinetic parameters for 310 H samples in supercritical water.
Kinetic EquationknR2
y = 0.051 × t0.5640.0510.5640.9953
Table 3. Elemental concentration (wt. %) from EDS results of 310H oxidized samples for different periods in supercritical static water at 550 °C.
Sample Oxidized forElements, (wt. %)
CSiMnPSVCrNiOFe
720 h4.891.541.620.010.050.1321.4715.6310.1944.48
1440 h4.861.621.580.020.090.1321.3315.3510.6844.34
2160 h6.741.321.540.060.070.1320.8415.1710.9143.22
Table 4. The values of equivalent electrical circuits elements for unoxidized and oxidized samples for different periods in water at 550 °C and 250 atm.
Element CircuitUnoxidized SampleOxidized Sample
720 h1440 h2160 h
Rs, Ω·cm2331.4159182299.7
CPEdl—T, F·cm−22.608 × 10−44.39 × 10−65.25 × 10−67.54 × 10−6
CPEdl—P0.8560.8820.8160.767
Rct, Ω·cm28810265.6183.1641.7
CPEext—T, F·cm−2-3.33 × 10−53.456 × 10−65.84 × 10⁻⁵
CPEext—P-0.650.6020.629
Rext, Ω·cm2-175715001196
Cint, F·cm−2-2. 28 × 10−41. 823 × 10−41.489 × 10−4
Rint, Ω·cm2-2.258 × 1047.06 × 1041.528 × 105
Chi-squared (χ2)1.7 × 10−31.9 × 10−39.8 × 10−48.9 × 10−4
Table 5. Rp values established by Nyquist diagram extrapolation and the corrosion density current calculated from Buttler–Volmer equation.
Sample TypePolarization Resistance from the Extrapolation of Nyquist Diagrams, (Ω*cm2)i0 Calculated from Rp,
(µA/cm2)
Unoxidized sample 3.381 × 1040.374
Sample oxidized 720 h1.146 × 1050.11
Sample oxidized 1440 h1.585 × 1050.0799
Sample oxidized 2160 h2.014 × 1050.0629
Table 6. Layer thickness values obtained using the plane capacitor formula for samples oxidized for different periods of time in water at 550 °C and 250 atm.
Oxidation TimeInner Oxide Layer Thickness,
μm
Outer Oxide Layer Thickness,
μm
Oxide Thickness from EIS,
μm
Oxide Thickness from Gravimetric Analysis,
μm
720 h0.949 × 10−36.976 × 10−37.925 × 10−31.96 × 10⁻³
1440 h1.202 × 10−37.149 × 10−38.351 × 10−32.06 × 10⁻³
2160 h1.488 × 10−37.333 × 10−38.821 × 10−32.13 × 10⁻³
Table 7. Electrochemical parameters from Tafel slopes and polarization resistance for unoxidized and oxidized samples in water at a supercritical temperature (550 °C and 250 atm).
Sample
Type
Electrochemical Parameters from Tafel SlopesElectrochemical Parameters from Polarization Resistance Rp ValuesPi,
%
P,
%
Ecorr, mV icorr,
μA/cm2
Vcorr,
mm/year
Ecorr, mV Rp,
KΩ × cm2
icorr,
μA/cm2
Vcorr,
mm/year
--
Unoxidized sample−256.091.032.56 × 10−3−260.9426.071.1902.97 × 10−3--
Sample oxidized for 720 h−126.625.32 × 10−21.34 × 10⁻⁴−127.48232.936.522 × 10−21.64 × 10−494.825.48
Sample oxidized for 1440 h−63.022.62 × 10−26.54 × 10⁻⁵−68.16612.212.187 × 10−25.47 × 10−597.450.74
Sample oxidized for 2160 h−60.691.79 × 10−24.48 × 10⁻⁵−57.5878.591.428 × 10−23.57 × 10−598.250.27
Publisher’s Note: MDPI stays neutral with regard to jurisdictional claims in published maps and institutional affiliations.

