Article

Anisotropies in Elasticity, Sound Velocity, and Minimum Thermal Conductivity of Low Borides VxBy Compounds

1
School of Materials Science and Engineering, Beihang University, Beijing 100191, China
2
School of Mechanical and Electrical Engineering, Shanxi Datong University, Datong 037009, China
3
School of Science, North University of China, Taiyuan 030051, China
4
School of Materials Science and Engineering, North University of China, Taiyuan 030051, China
*
Authors to whom correspondence should be addressed.
Metals 2021, 11(4), 577; https://doi.org/10.3390/met11040577
Submission received: 7 March 2021 / Revised: 29 March 2021 / Accepted: 30 March 2021 / Published: 1 April 2021

Abstract

:
Anisotropies in the elasticity, sound velocity, and minimum thermal conductivity of low borides VB, V5B6, V3B4, and V2B3 are discussed using the first-principles calculations. The various elastic anisotropic indexes (AU, Acomp, and Ashear), three-dimensional (3D) surface contours, and their planar projections among different crystallographic planes of bulk modulus, shear modulus, and Young’s modulus are used to characterize elastic anisotropy. The bulk, shear, and Young’s moduli all show relatively strong degrees of anisotropy. With increased B content, the degree of anisotropy of the bulk modulus increases while those of the shear modulus and Young’s modulus decrease. The anisotropies of the sound velocity in the different planes show obvious differences. Meanwhile, the minimum thermal conductivity shows little dependence on crystallographic direction.

1. Introduction

Superhard materials have long attracted tremendous attention for a wide range of applications, such as high-temperature applications, surface protection, and abrasive materials [1,2,3,4,5,6,7,8,9,10,11,12,13,14,15]. Diamond is the hardest substance, which maintains records of bulk modulus, shear modulus, and high hardness of 432 GPa, 535 GPa, and 60–150 GPa, respectively. Meanwhile, it is the material with the highest thermal conductivity, ~2000 W/m·K. However, the weak thermal stability of diamond at temperatures higher than 800 °C restricts the application in industry [3]. Therefore, the search for and design of new superhard materials with other unique properties is an important topic in the field of materials research. Previous studies of superhard materials have usually focused on short covalent materials [4,5,6], however, pure covalent materials show poor metallicity. The balance of high hardness and excellent metallicity is a central challenge to design superhard metals. However, great success has been achieved with the discovery of transition-metal (TM) light-element (LE) compounds [7,8,9,10,11,12,13,14,15]. It is generally believed that their high hardness stems from a combination of high valence-electron concentration to resist volume compression and strong covalent bonding to counteract shape deformation [7,8]. In addition, the TM-TM bonds of TM-LE compounds provide electron transporting paths in the crystals. Therefore, it is possible for TM-LE compounds to achieve high hardness and electrical (thermal) conductivity at the same time.
Transition-metal borides (TMxBy) with low boron content reduce the level of covalent bonding and significantly improve the degree of metallic bonding, which improves metallicity of materials, but not for high hardness due to the low resistance against the formation and propagation of dislocations. Surprisingly, the hardness over 40 GPa had been firstly found in low borides W0.5Ta0.5B by substituting W with Ta of WB [12]. Subsequently, Liang et al. had reported that a series of transition-metal monoborides exhibited surprisingly anomalous hardening behavior using the first-principles calculations [13]. Li et al. also reported that increasing boron content did not lead to higher hardness in boron-rich tungsten borides [11]. These exciting materials have raised great expectations to design superhard metals.
As candidates for hard materials, vanadium borides show favorable mechanical properties and are quite easily synthesized at normal temperatures and pressures [14,15,16,17]. The studies of low borides are surprisingly scarce, contrary to studies of other boron-rich vanadium borides [15,16]. Liang et al. analyzed the mechanical properties and mechanism of anomalous hardness of VB, V5B6, V3B4, and V2B3 [14]. Pan et al. had pointed out that the high elastic modulus and hardness of vanadium borides with low B content are determined by the bond strength and direction [17]. The anisotropy of a crystal reflects the periodicity of the atom arrangement along the different crystallographic orientations in the lattices, which results in the different physical properties of crystals along the different directions. A more detailed exploration of the anisotropic features of VxBy compounds with low boron content is helpful to understand superhard metal. In this paper, the anisotropies of VB, V5B6, V3B4, and V2B3 in mechanical properties (bulk modulus, shear modulus, and Young’s modulus, sound velocity) and minimum thermal conductivity are discussed.

2. Method and Computation Details

Four different vanadium borides, including VB (space group: Cmcm), V5B6 (space group: Cmmm), V3B4 (space group: Immm), and V2B3 (space group: Cmcm), were considered in this paper. The primitive cell was used to complete the calculations in the present work. The first-principles method based on density functional theory was used with the Perdew–Burke–Ernzerhof form of generalized gradient approximation for the electronic exchange-correlation interaction implemented in MedeA VASP [18,19]. All calculations were completed with a cutoff energy of plane wave basis ~550 eV and Monkhorst–Pack k point meshes ≤0.02 Å−1 [20]. The tolerances of geometry optimization were set as the difference in the total energy being within 5.0 × 10⁻⁶ eV/atom with a maximum force per atom 0.01 eV/Å, a maximum stress of 0.02 GPa, and a maximum displacement of 5.0 × 10⁴ Å. The elastic constants were obtained using the stress-strain method [21] with six strain steps for each optimized structure. Based on the elastic constants, the polycrystalline bulk modulus B and shear modulus G are obtained through the Voigt–Reusse–Hill (VRH) approximation [22]. Young’s modulus E is given by
E = 9 B G 3 B + G
Based on the assumption that the indentation size is correlated with the shear modulus G and the width of a formed imprint is proportional to the bulk modulus B, Chen et al. proposed a semi-empirical model to describe the Vickers hardness of materials [23]. This model has been widely used to predict the Vickers hardness of many materials and is given by
H V = 2 ( G 3 B 2 ) 0.585 3

3. Results and Discussion

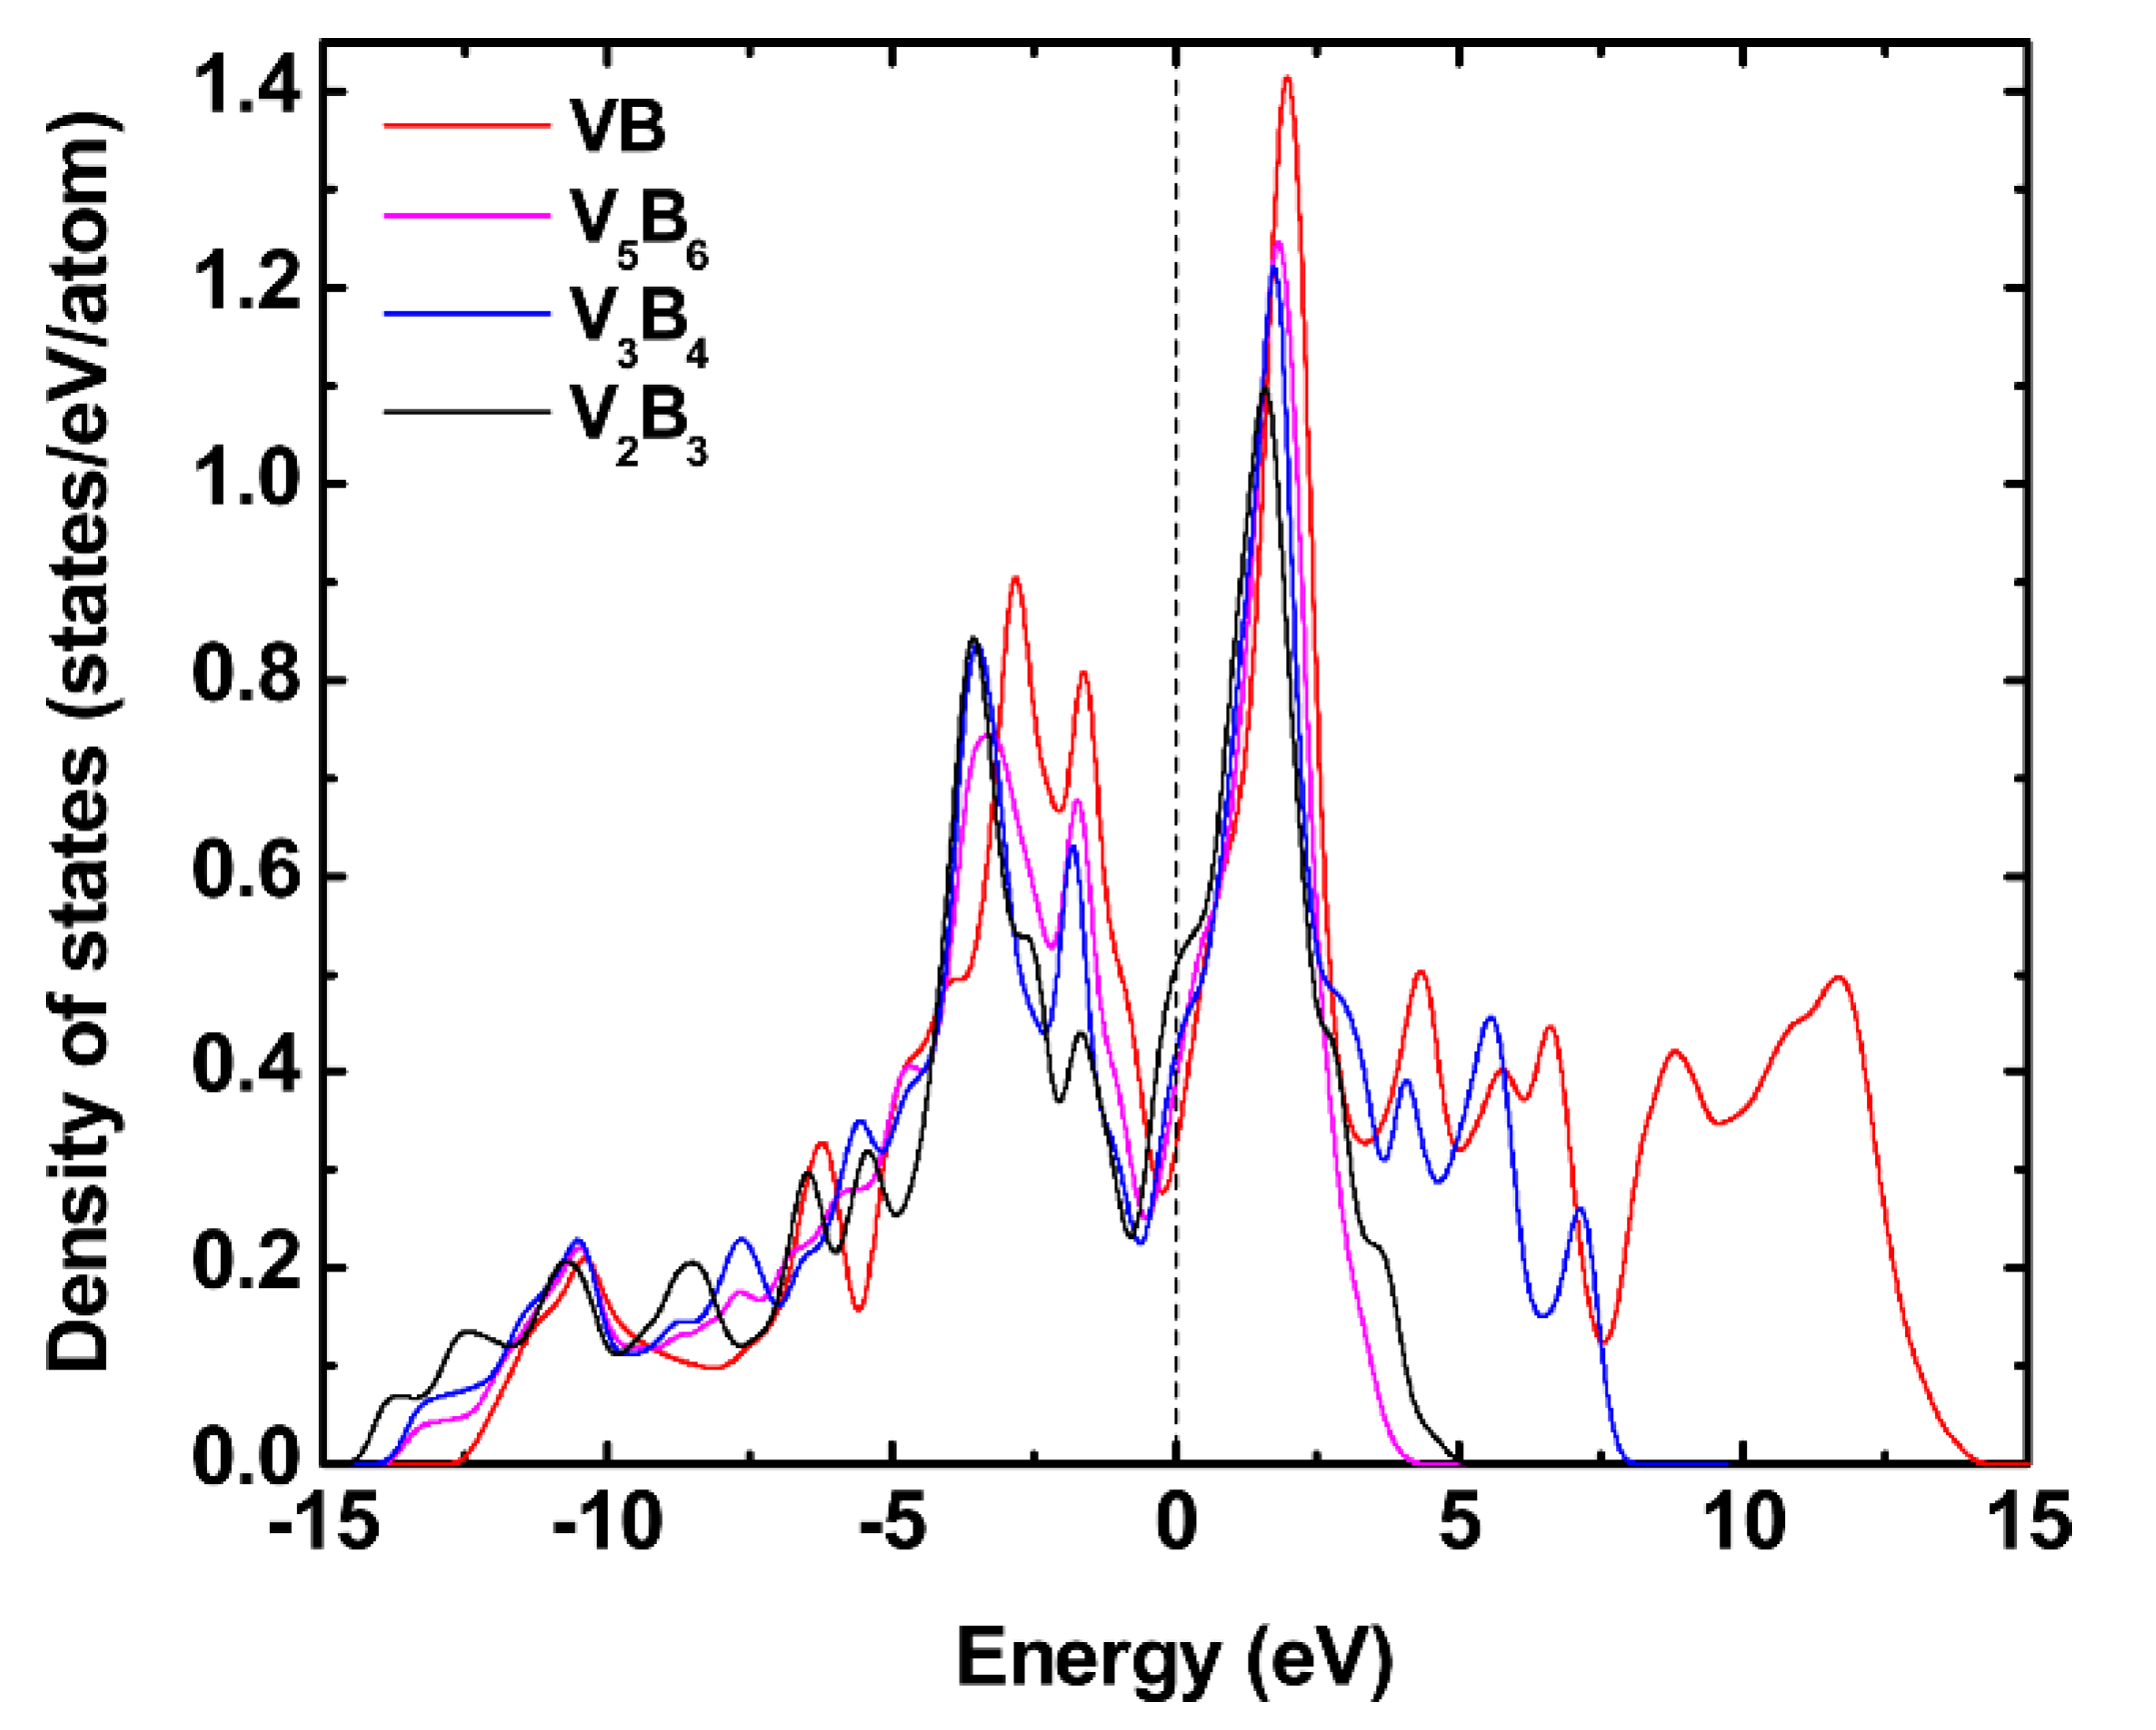
3.1. Equilibrium Structure and Stability

To estimate the structural stability, the cohesive energy (Ecoh) and formation enthalpy (Eeff) are investigated.
E coh = 1 x + y ( E total x E V atom y E B atom )
E eff = 1 x + y ( E total x E V g y E B g )
where x (y) is the number of V (B) atoms in the unit cell, E total is the total energy of the VxBy compound, E V atom and E B atom are the energies of the free V and B atoms, E V g and E B g are the energy per atom in its ground state. The optimized lattice constants, cohesive energy, and formation enthalpy are listed in Table 1, together with the available theoretical and experimental results. The negative cohesive energy and formation enthalpy indicate that these structures are thermodynamically stable. The stability follows the order VB > V5B6 > V3B4 > V2B3; the same result can also be obtained from the position of Fermi level (EF) of the total density of states (see Figure 1). The structural stability of materials can be judged from the position of Fermi surface in the density of states curve [24]. The higher the value of EF, the lower the stability of the structure.

3.2. Elastic Properties

The present elastic moduli and Vickers hardness HV data are shown in Table 2. Generally, the compressibility of solids under pressure is expressed by the bulk modulus. The greater the bulk modulus of solids, the less compressible they are. The shear modulus reflects the resistance to shape change under shear force. Young’s modulus is related to the stiffness of materials. It can be seen that the bulk, shear, and Young’s moduli of VxBy all follow the order V2B3 > V3B4 > V5B6 > VB. Furthermore, the values are very close to each other. Table 2 shows the theoretical Vickers hardness value of VxBy compounds is close to 40 GPa, indicating these VxBy compounds are potential superhard materials [25].

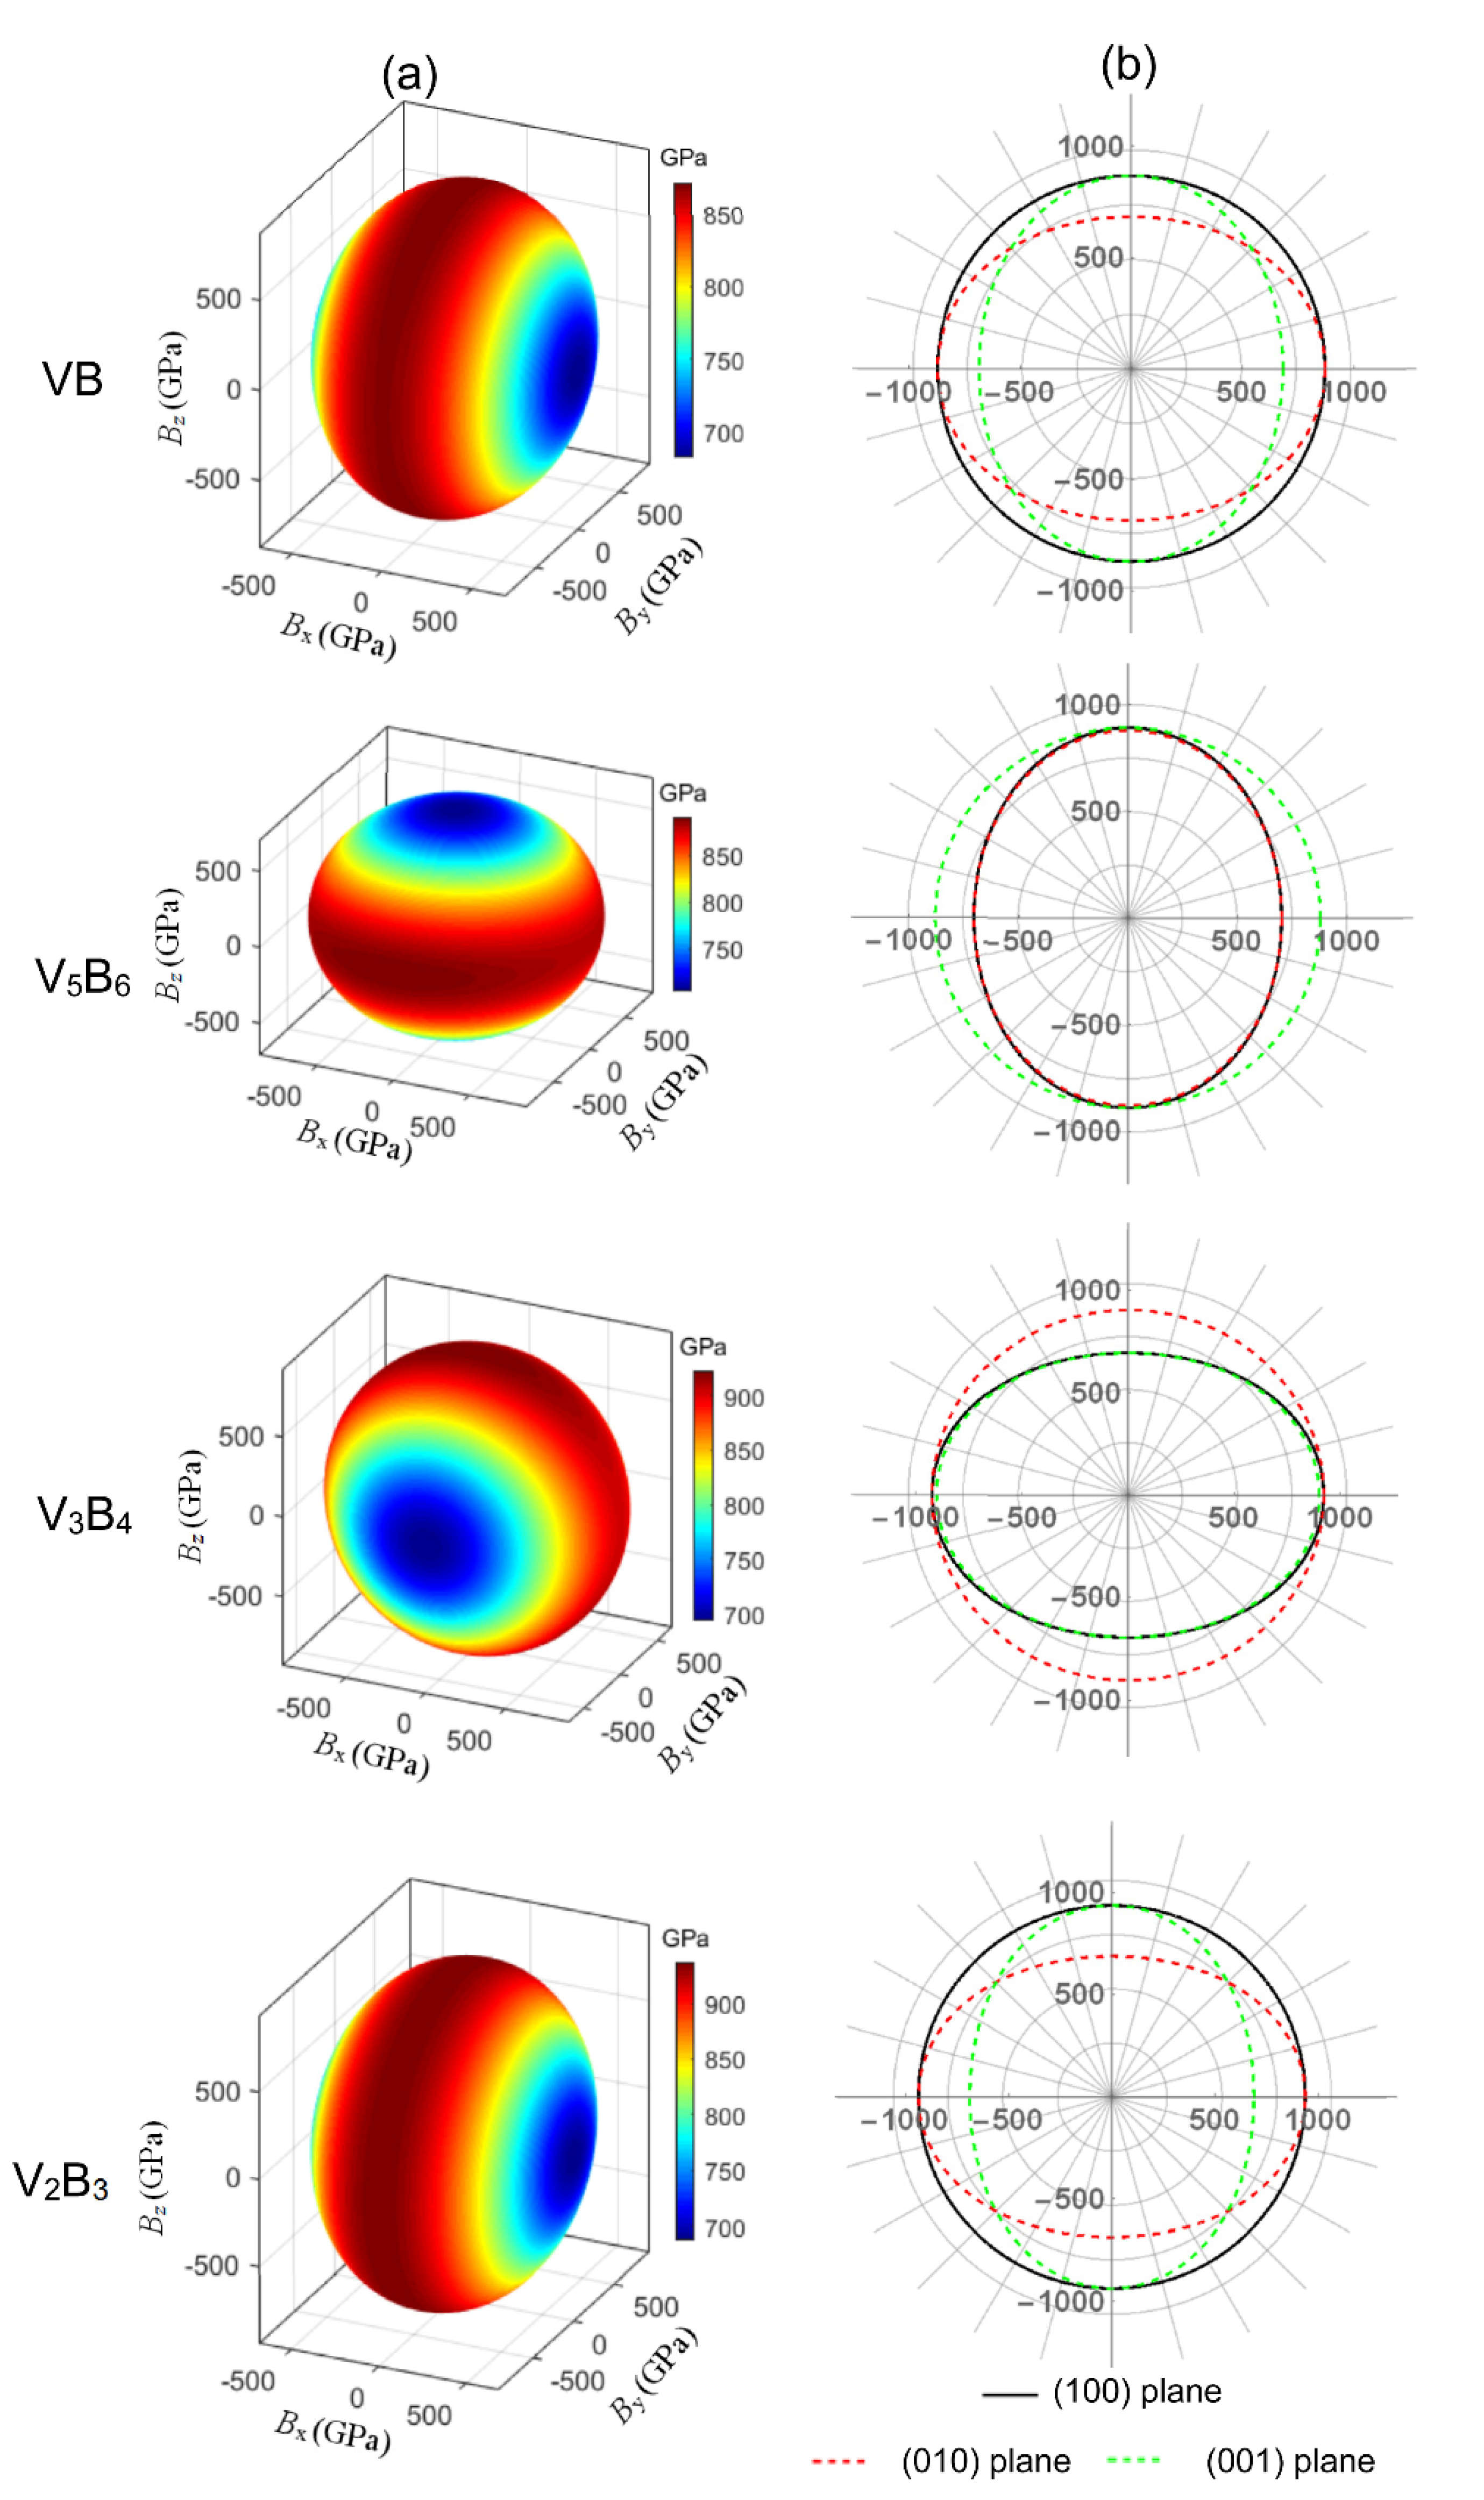
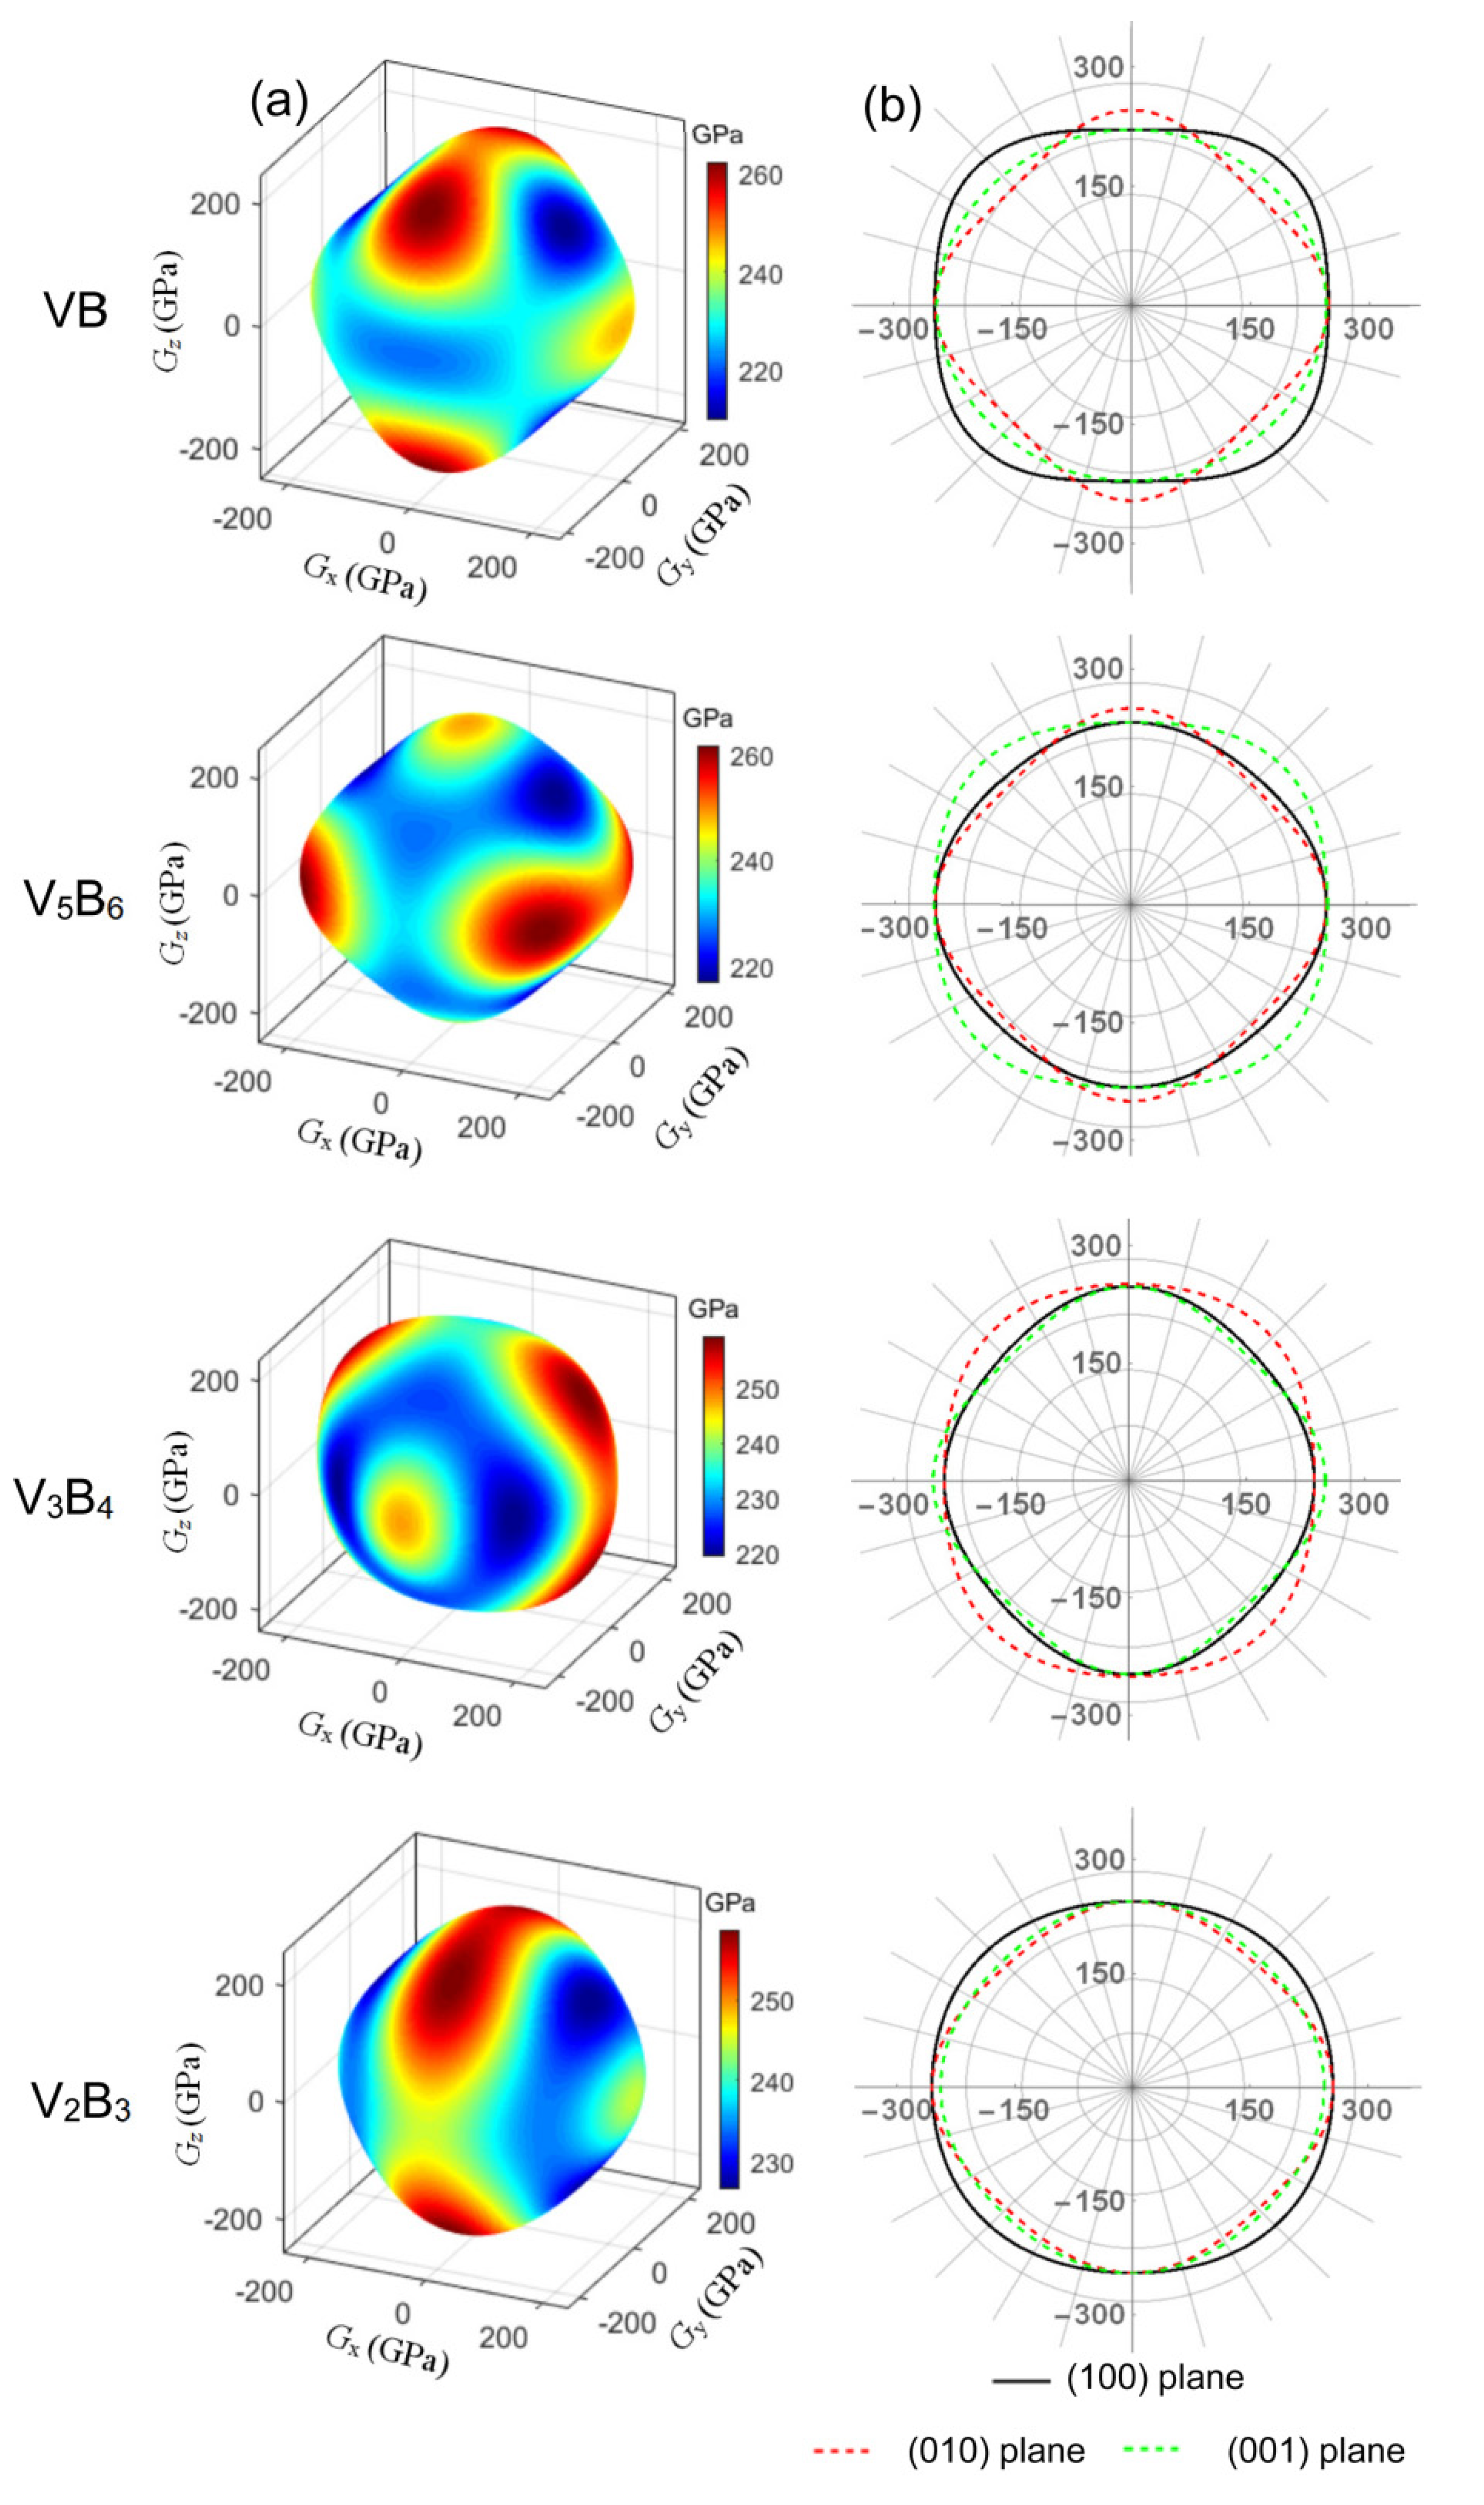
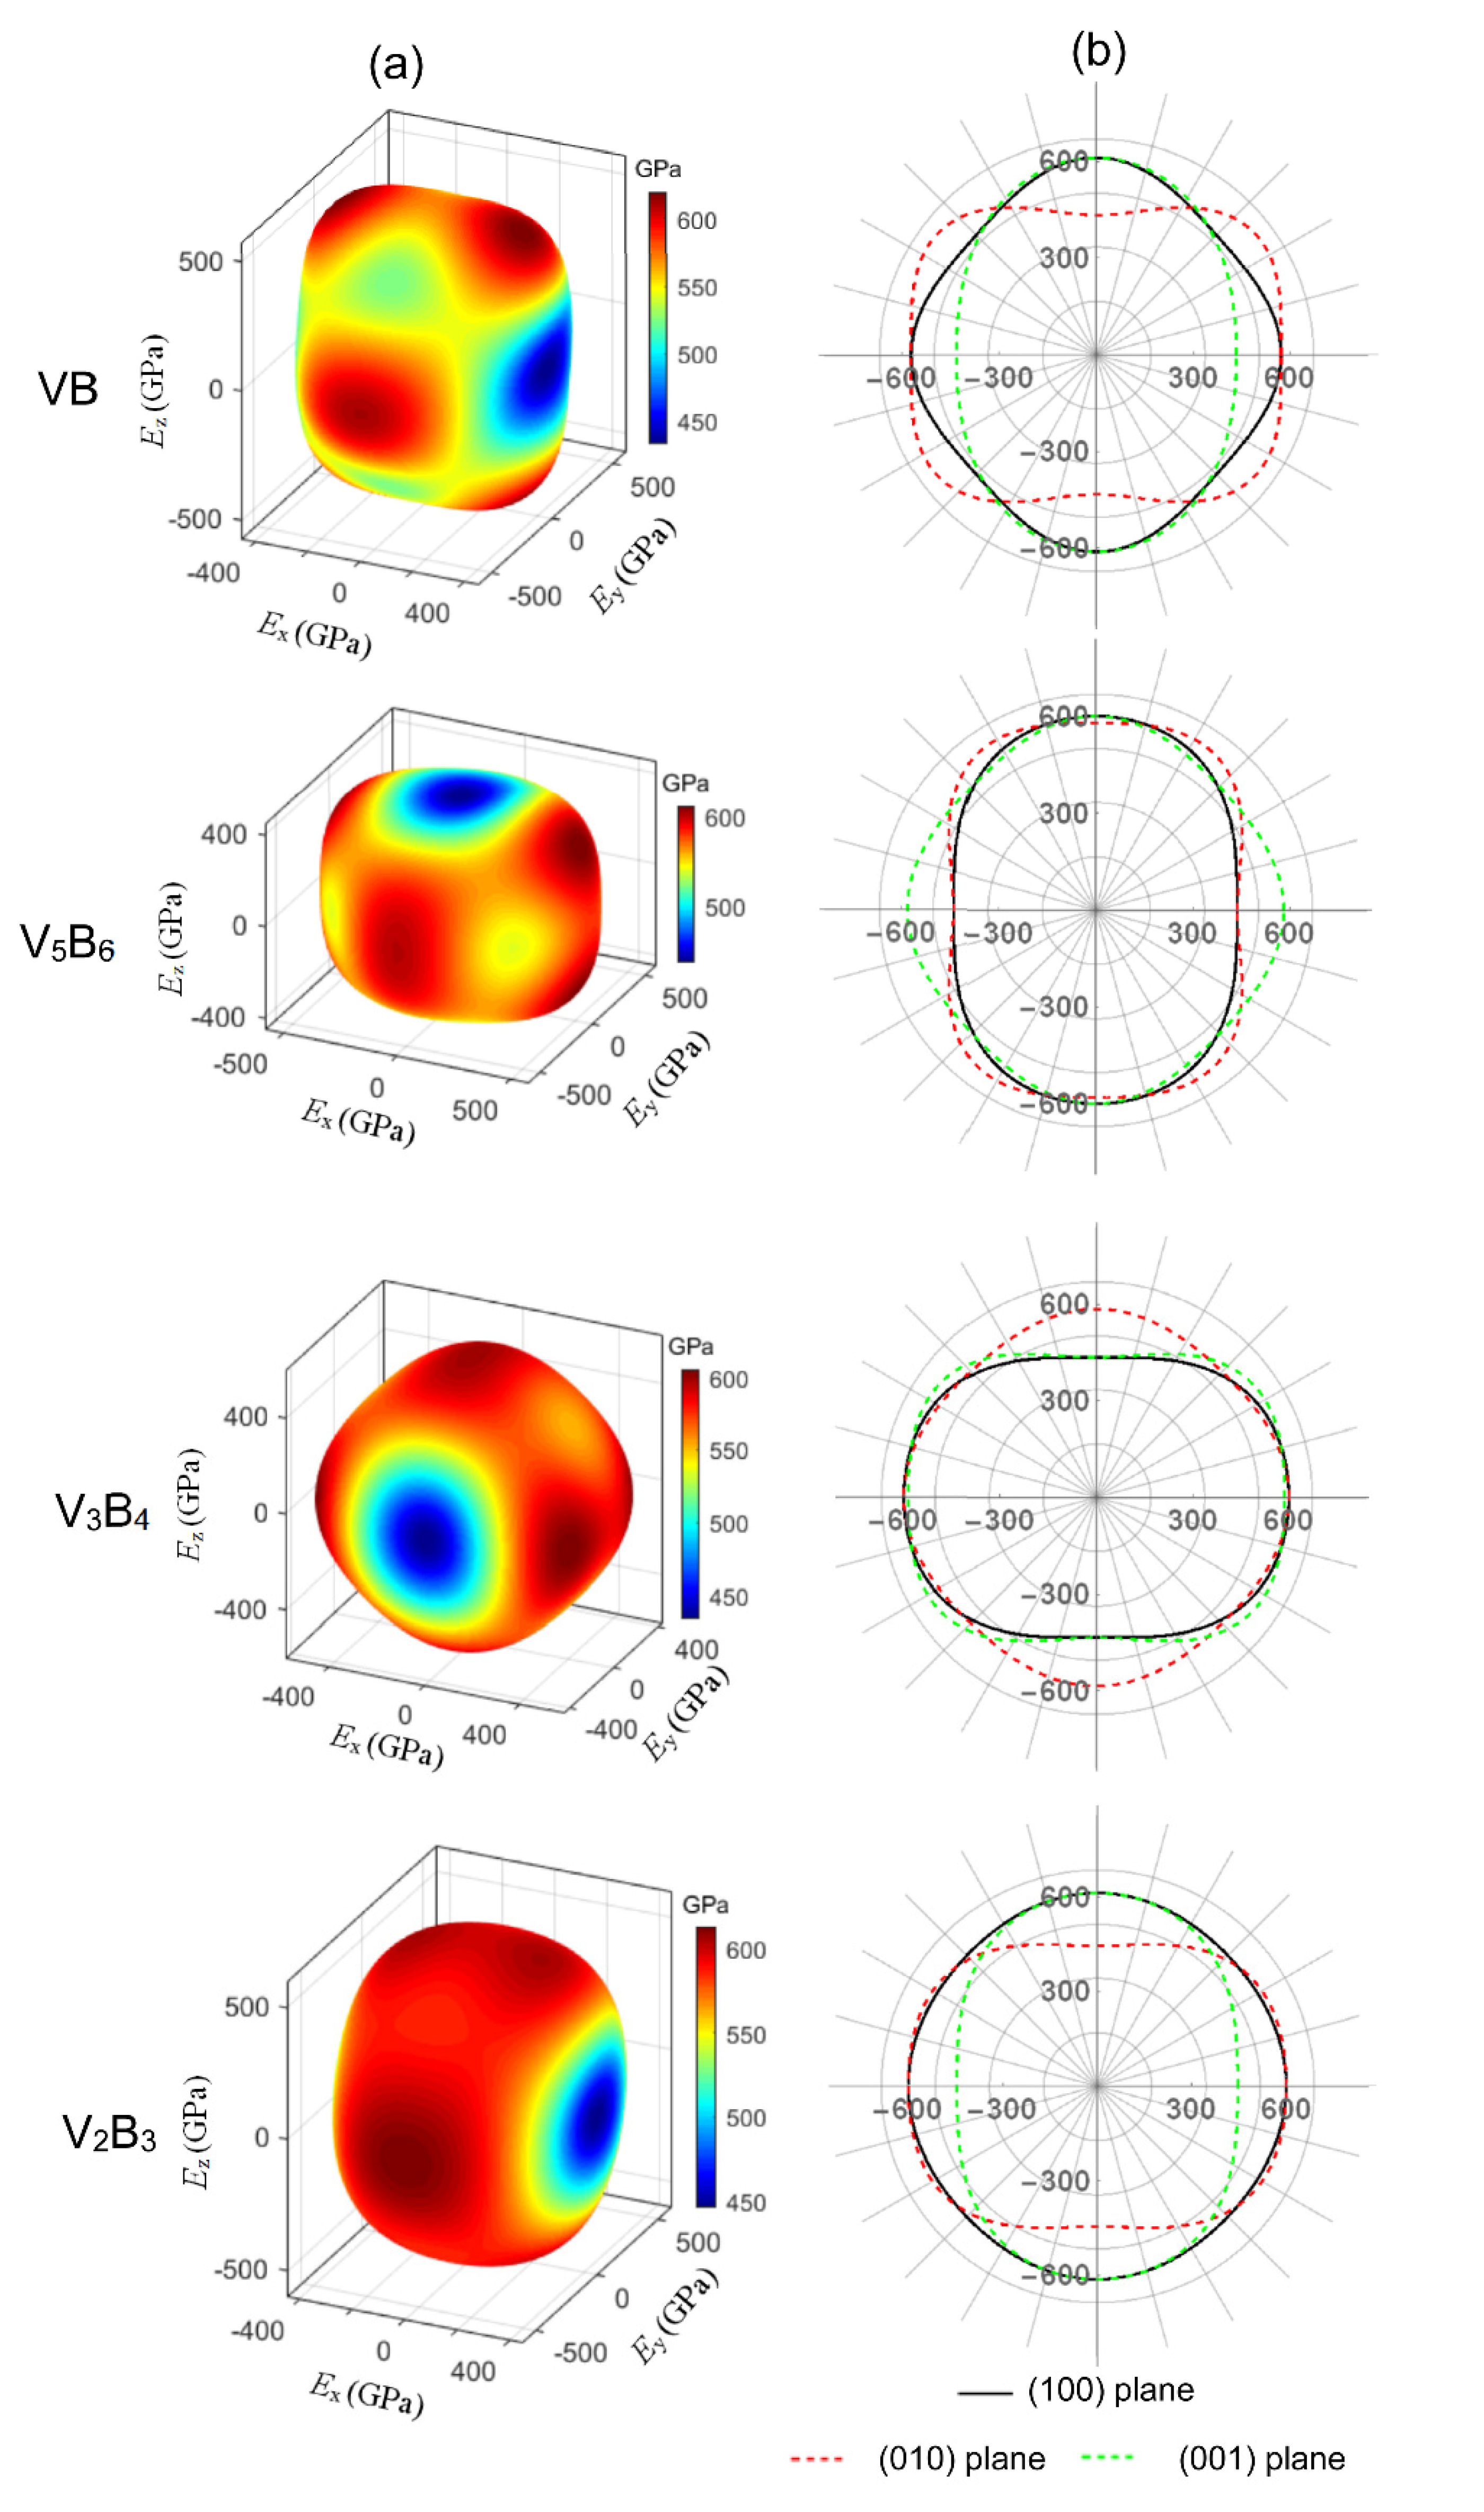
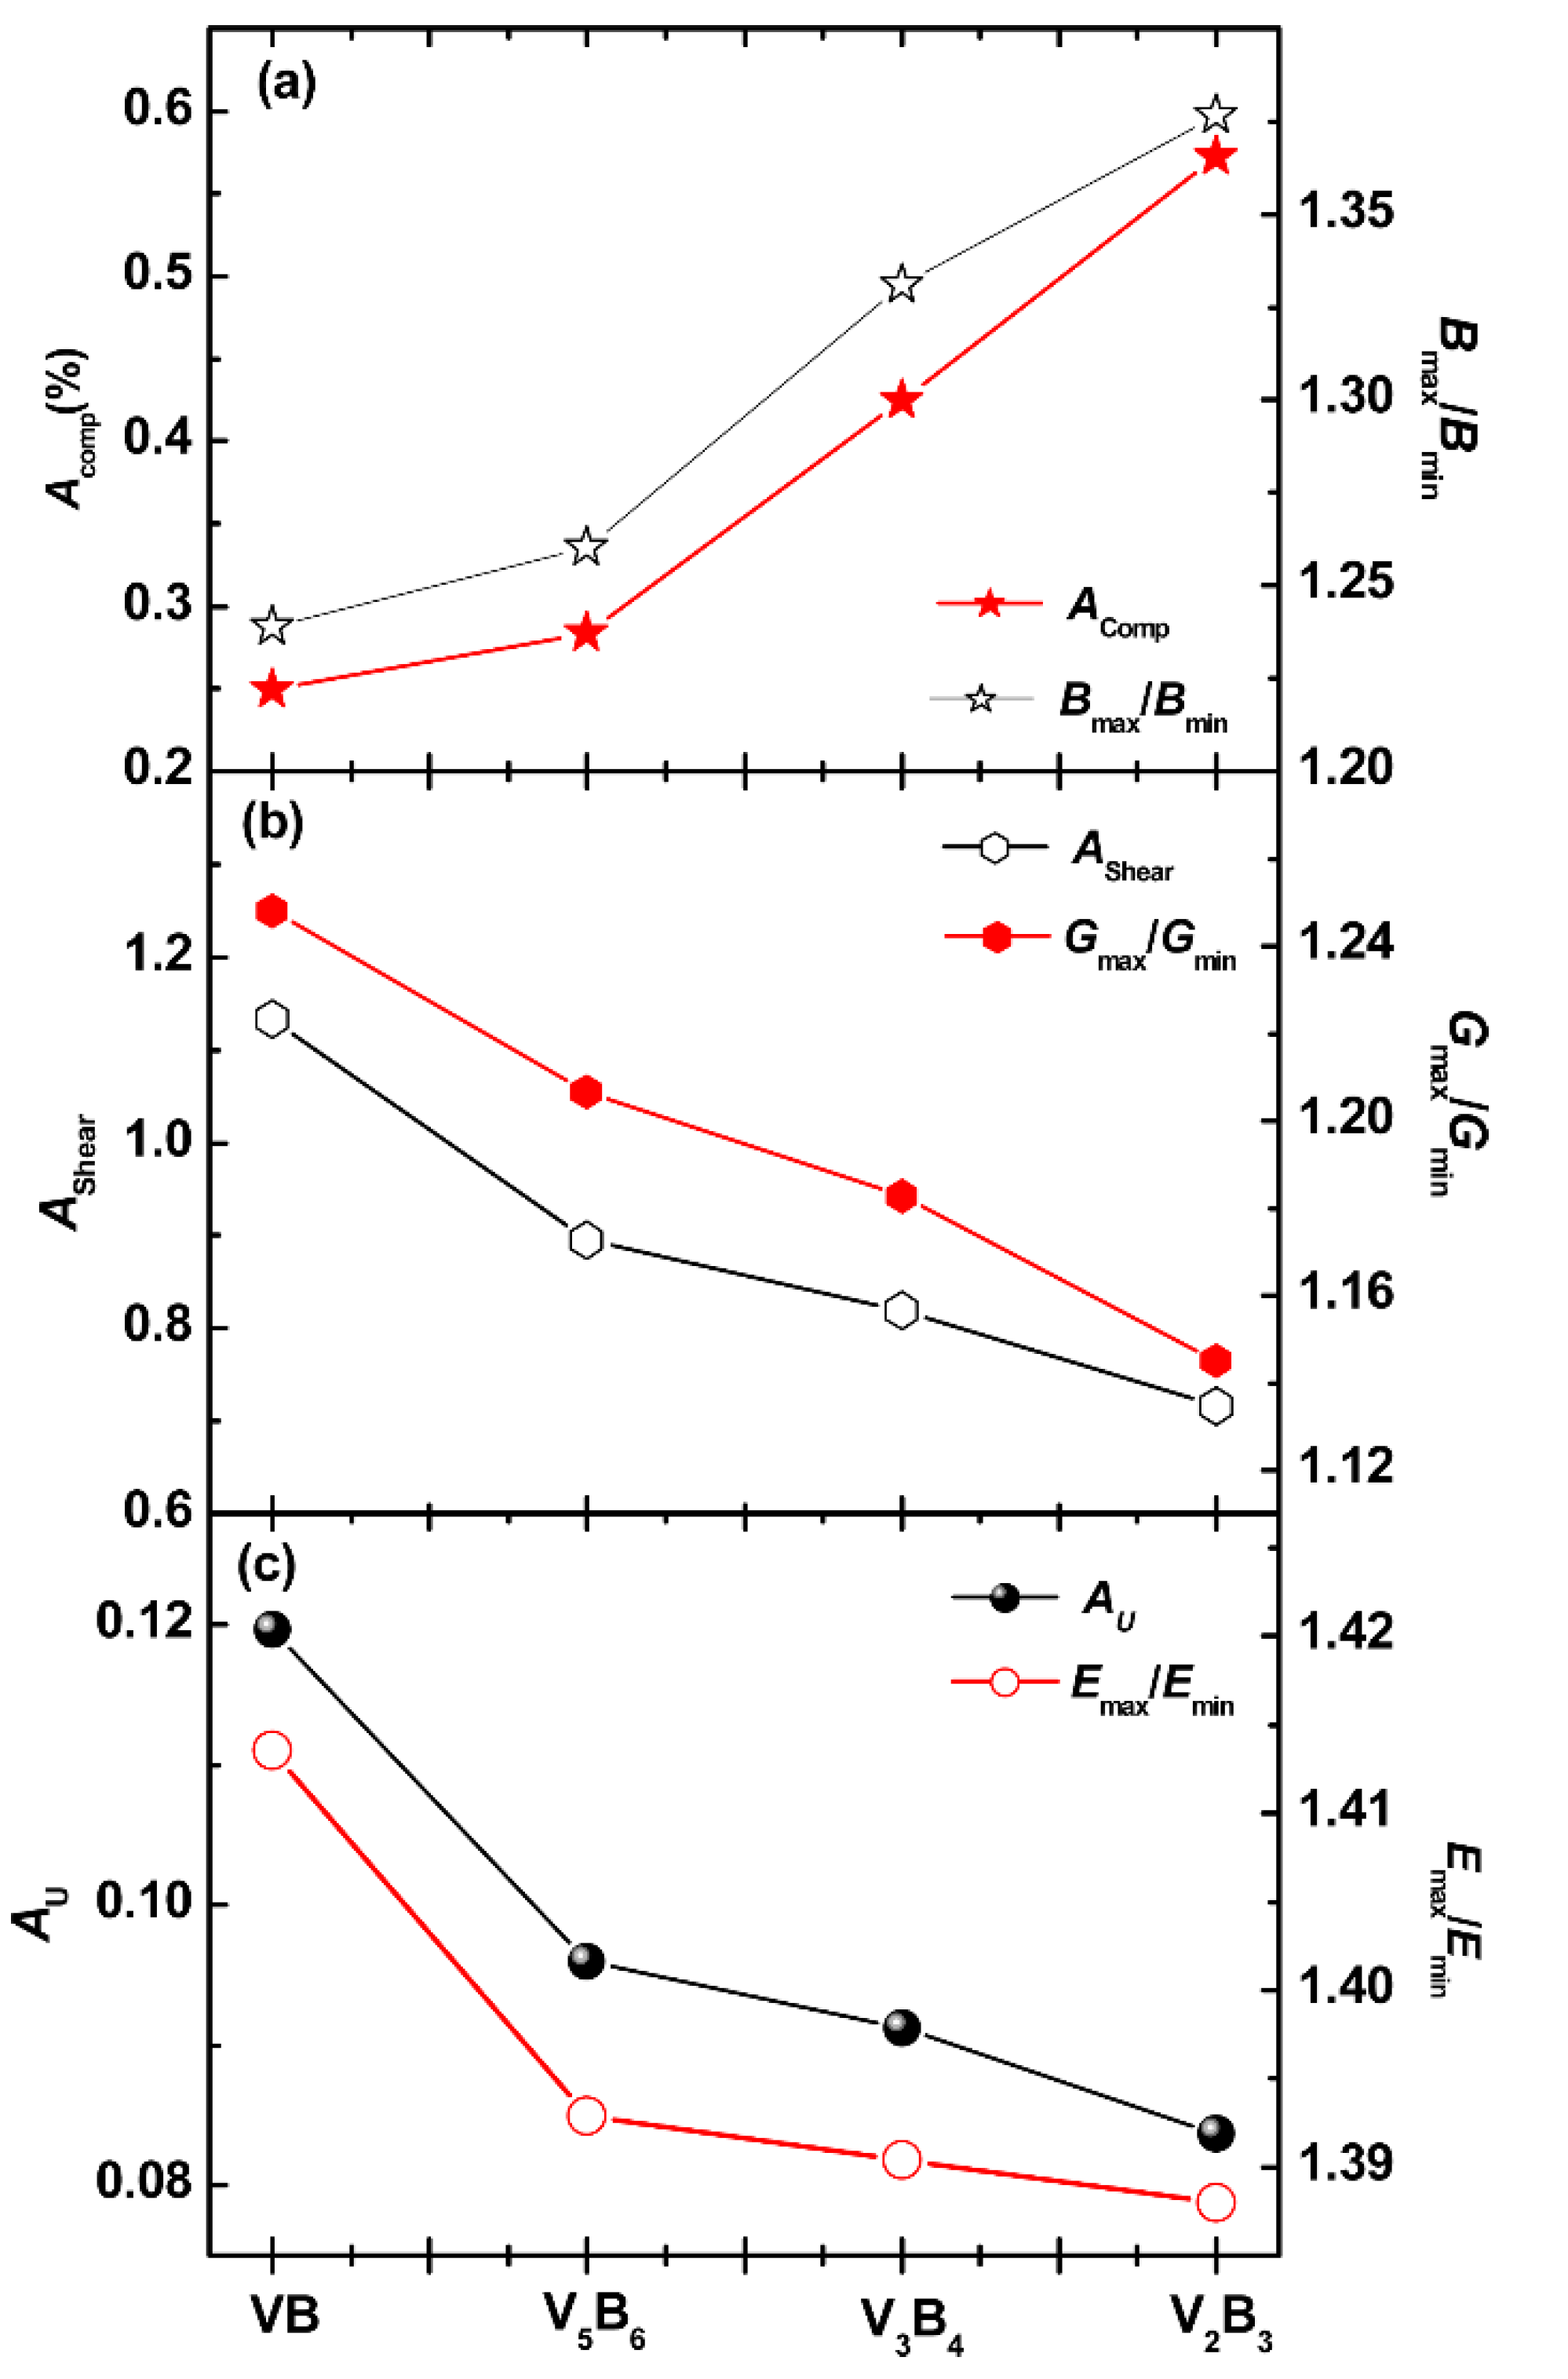
3.3. Elastic Anisotropy

Elastic anisotropy has great research value for ceramics due to its correlation with the generation of microcracks and lattice deformation [26,27]. The orientation dependence of three-dimensional (3D) elastic moduli are typically used to describe the elastic anisotropy of a crystal. Considering the effects of shear surface and direction on shear modulus, the average shear modulus over all possible directions is calculated. The formulae of bulk modulus, shear modulus, and Young’s modulus of an orthorhombic structure can be obtained from the direction cosines (l1, l2, and l3) and elastic compliance constant Sij [28], and are given by
1 B = ( S 11 + S 12 + S 13 ) l 1 2 + ( S 12 + S 22 + S 23 ) l 2 2 + ( S 13 + S 23 + S 33 ) l 3 2
1 G = 2 l 1 2 ( 1 l 1 2 ) S 11 + 2 l 2 2 ( 1 l 2 2 ) S 22 + 2 l 3 ( 1 l 3 2 ) S 33 4 l 1 2 l 2 2 S 12 4 l 1 2 l 3 2 S 13 4 l 2 2 l 3 2 S 23 + 1 2 ( 1 l 1 2 4 l 2 2 l 3 2 ) S 44 + 1 2 ( 1 l 2 2 4 l 1 2 l 3 2 ) S 55 + 1 2 ( 1 l 3 2 4 l 1 2 l 2 2 ) S 66
1 E = l 1 4 S 11 + l 2 4 S 22 + l 3 4 S 33 + 2 l 1 2 l 2 2 S 12 + 2 l 1 2 l 3 2 S 13 + 2 l 2 2 l 3 2 S 23 + l 2 2 l 3 2 S 44   + l 1 2 l 3 2 S 55 + l 1 2 l 2 2 S 66
Figure 2 shows the 3D surface contours and their projections in different planes of the bulk modulus. In this context, a 3D plot is spherical for an isotropic material, and the deviation from a sphere describes the degree of anisotropy. The ellipsoids of the 3D bulk modulus of four structures indicate relatively strong anisotropy in linear compressibility. Furthermore, the 3D contours of VB and V2B3 are similar. The shrinking of the 3D plot depicted in blue indicates the small linear incompressibility along that direction. Based on the ratio of maximum to minimum of directional bulk modulus Bmax/Bmin, the order of anisotropy in the bulk modulus is VB < V5B6 < V3B4 < V2B3. In their planar projections, the nearly circular shape of VB and V2B3 in (100) plane is due to the approximately equal values of C22 and C33. The larger distorted shapes in the (010) and (001) planes indicate its strong anisotropy in linear compressibility. For V5B6, the similar anisotropy is observed due to the coincident profiles in the (100) and (010) planes, while the anisotropy of the linear compressibility in the (001) plane is very weak due to the small difference of C11 and C22. The anisotropies of the linear compressibility in the (100) and (001) planes are also similar for V3B4, while that in the (010) plane is also very weak.
Figure 3 shows the 3D surface contours and their projections of shear modulus in different planes. The strongly curved surface shapes suggest strong anisotropy in the shear modulus. Based on the ratio of the maximum to minimum value of the directional shear modulus Gmax/Gmin, the order of anisotropy in the shear modulus is VB > V5B6 > V3B4 > V2B3. For VB, the shear moduli in all planes show relatively strong anisotropy. However, the weakest anisotropy is found in the (100) plane for V5B6 with Gmax/Gmin~1.096, in the (100) and (010) planes for V3B4 with Gmax/Gmin~1.095 and ~1.097, and in the (100) and (001) planes for V2B3 with Gmax/Gmin~1.056 and ~1.044, respectively.
Similarly, the 3D surface contours of the Young’s modulus shown in Figure 4 are also distorted, suggesting the strongly anisotropic feature. According to the ratio of maximum to minimum of directional Young’s modulus Emax/Emin, the order of anisotropy in the Young’s modulus is VB > V5B6 > V3B4 > V2B3. The projections of the Young’s modulus in the different planes indicate relatively strong anisotropy, except in the (010) plane for V3B4 with Emax/Emin~1.084 and in the (001) plane for V2B3 with Emax/Emin~1.048. The anisotropy of the Young’s modulus reflects a change of strength of the chemical bonds.
The elastic anisotropy can be estimated by the universal elastic anisotropic index A U = 5 G V G R + B V B R 6 (where BV (GV) and BR (GR) are the bulk (shear) modulus in Voigt and Reuss approximations) [29] and percent anisotropy in compression A comp = B V B R B V + B R and shear A shear = G V G R G V + G R [30], respectively. For an elastic isotropic crystal, AU = Acomp = Ashear = 0 [29,30]. A larger deviation degree from zero means a stronger anisotropy.
Figure 5 gives the variation trends of various elastic anisotropic indexes and the ratios of Bmax/Bmin, Gmax/Gmin, and Emax/Emin of VxBy. It is obvious that the variation trends of the anisotropy in Acomp, Ashear, and AU agree well with the results obtained from 3D surface contours of the bulk, shear, and Young’s modulus. The compression anisotropy increases, while the shear anisotropy decreases with the increased content of B atoms. The universal elastic anisotropic index includes the contributions of polycrystalline shear and bulk modulus [31]. The elastic anisotropy is mainly determined by the shear anisotropy due to the similar variation tendency between Ashear and AU. According to the values AU and Emax/Emin, the order of elastic anisotropy is VB > V5B6 > V3B4 > V2B3.

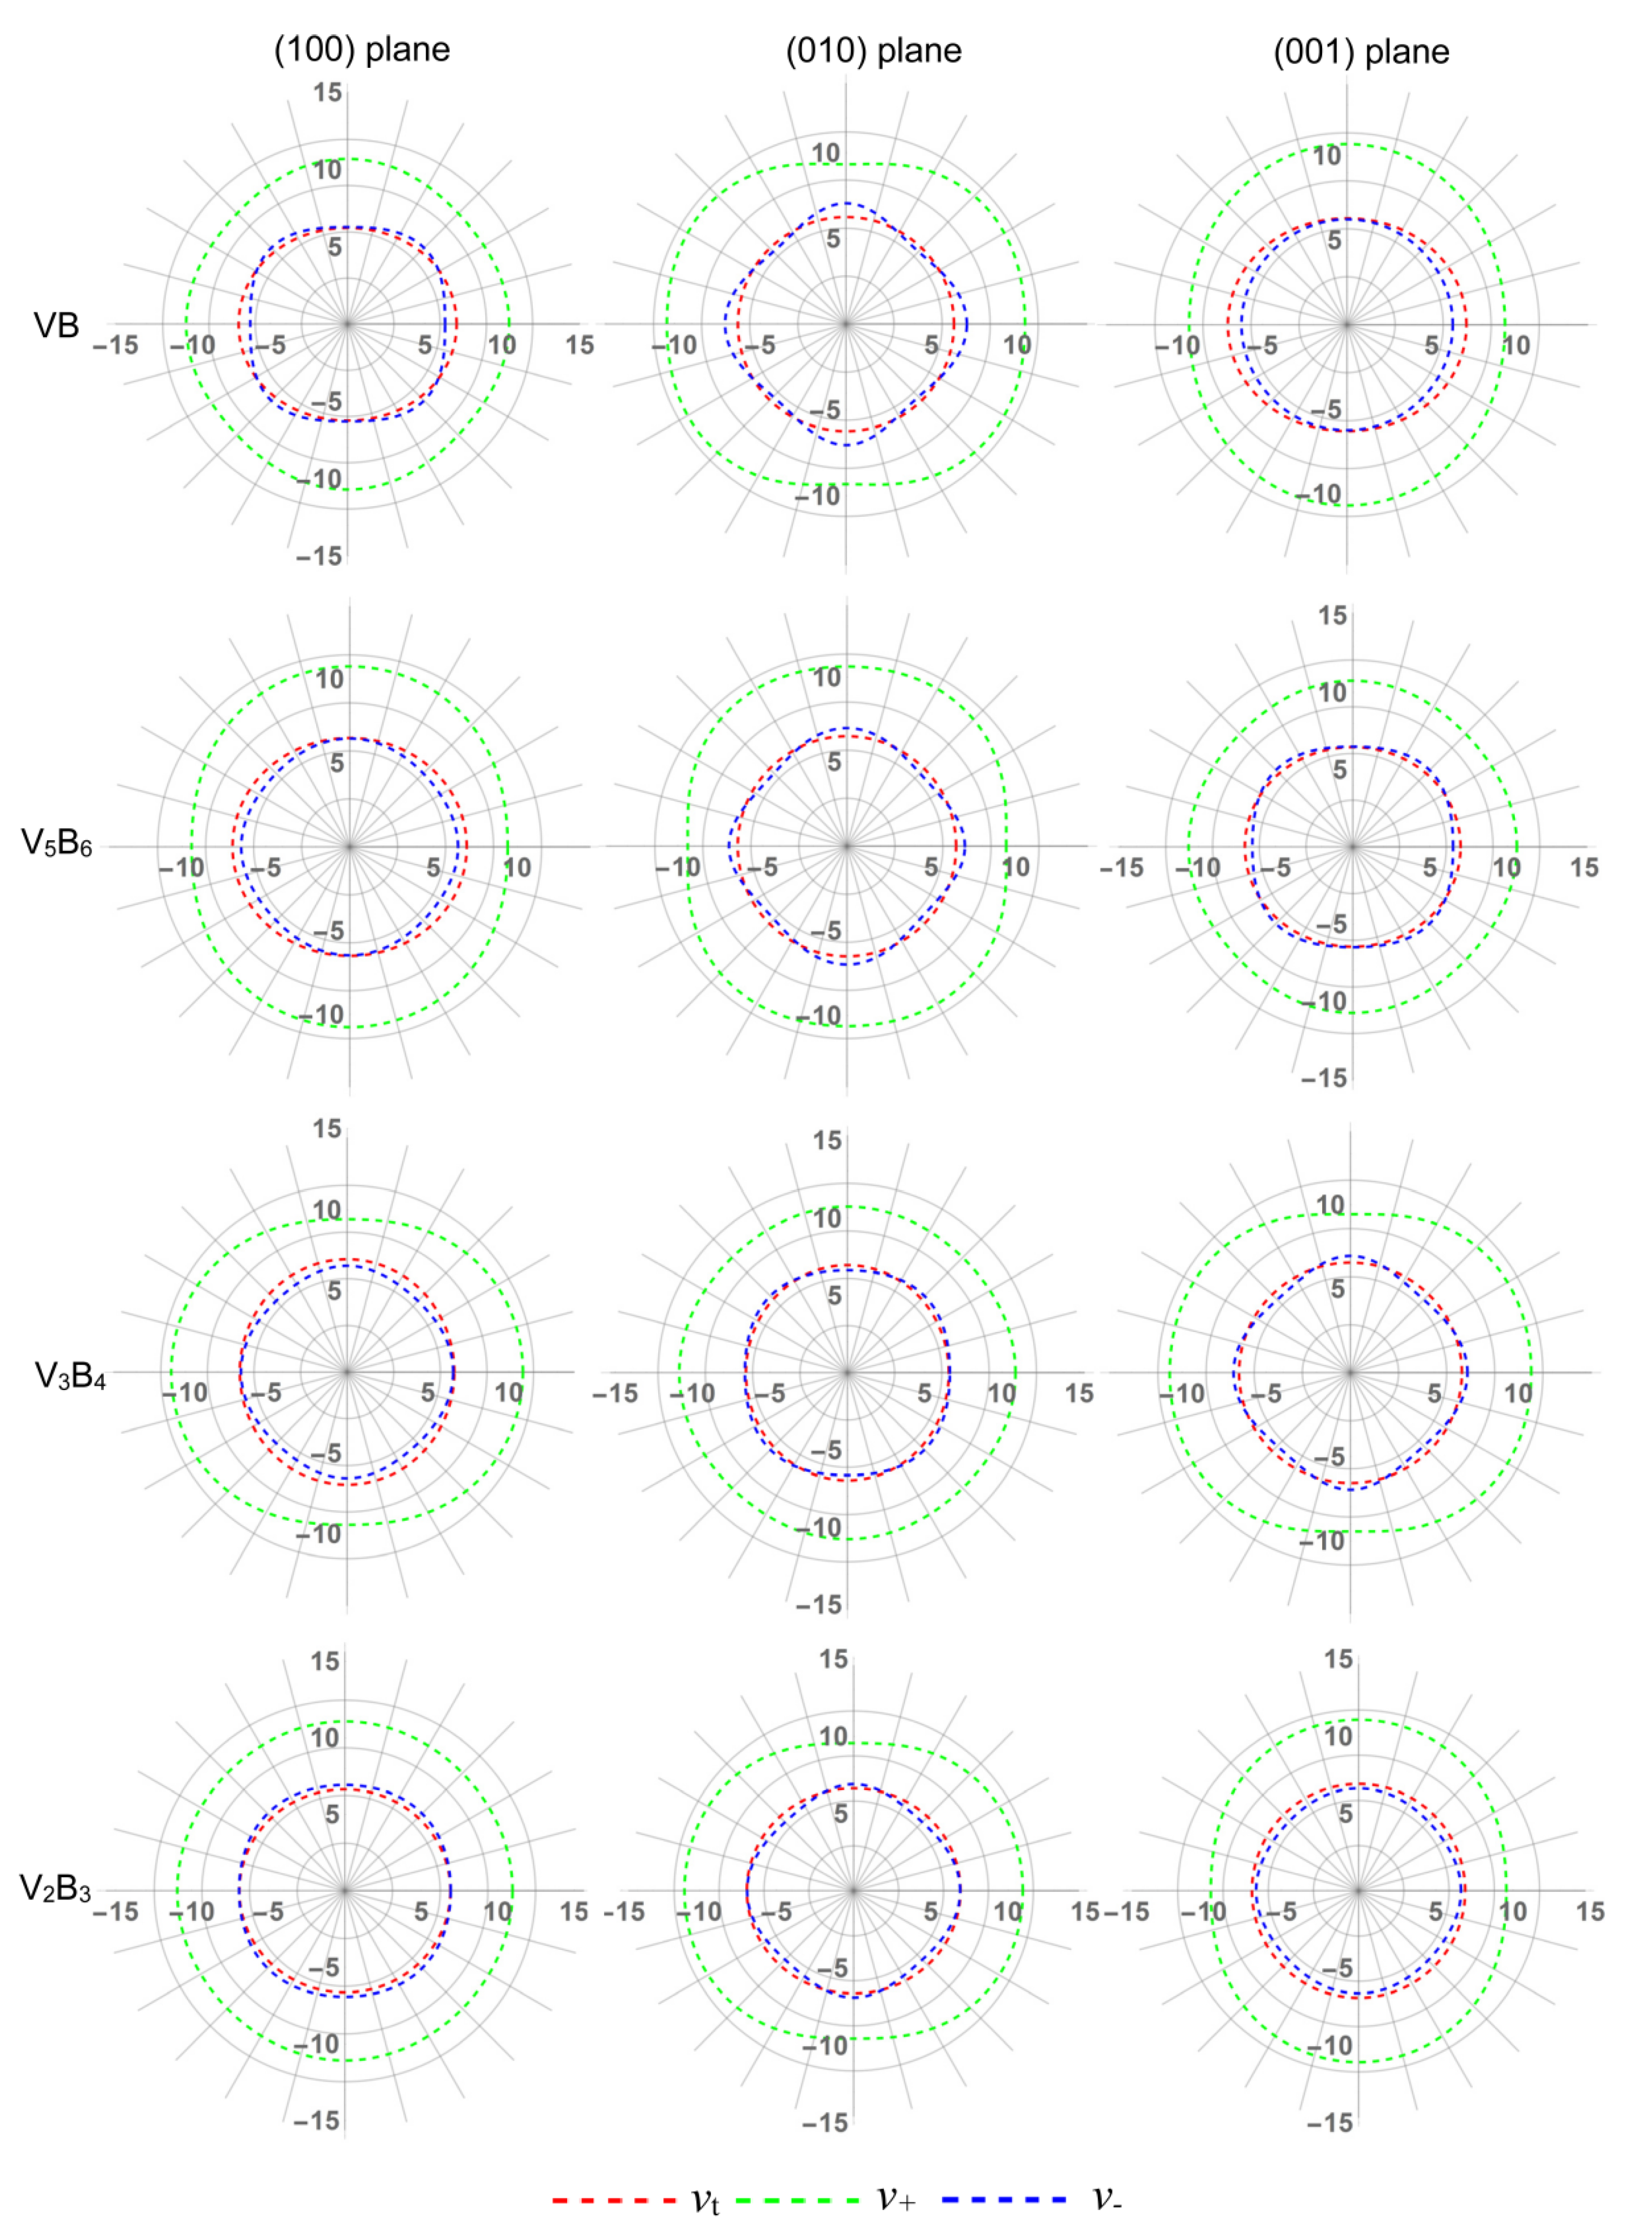
3.4. Anisotropy in Sound Velocity

Based on the classic theory of transportation of phonon gas solid, the sound velocity of a crystal structure can be employed to estimate the thermal conductivity [32]. In a specific crystallographic plane, the sound velocity consists of three orthogonal modes, a pure transverse mode vt and two mixed modes v±, by solving the Christoffel equation [33]. The three modes of velocity are given by
ρ v t 2 = a 1 sin 2 θ k + a 2 cos 2 θ k
2 ρ v ± 2 = a 3 sin 2 θ k + a 4 cos 2 θ k ± [ ( a 5 sin 2 θ k a 6 cos 2 θ k ) 2 + ( 2 a 7 sin θ k cos θ k ) 2 ]   1 / 2
where the values of ai can be obtained using the elastic constants, and θk is the angle of wave vector k with respect to one of the symmetry axes.
The projections of sound velocity (vt and v±) in the different crystallographic planes for VxBy are plotted in Figure 6. Table 3 gives the ratio of maximum to minimum of sound velocity of VxBy. It can be seen that the faster mode v+ is larger than pure transverse mode vt and slow mode v-, and the values of vt and v- are comparable. The profiles of three acoustic branches (vt and v±) of four structures are different in (100), (010), and (001) planes. The ratio of maximum to minimum of sound velocity in different planes (Table 3) indicates the degree of anisotropy. The anisotropies in vt of V5B6, V3B4, and V2B3 are relatively weak at (100), (010), and (001) planes, which is mainly determined by the small difference of elastic constants C44, C55, C66. The degree of anisotropy of two mixed modes is determined by the diagonal and off-diagonal elements of the elastic constant matrix.

3.5. Anisotropy in Minimum Thermal Conductivity

The minimum thermal conductivity is an important parameter for high-temperature applications of materials, which can be evaluated via the Cahill model [34]. The obtained three sound modes (vt and v±) by solving the Christoffel equation are also used.
κ min = k B 2.48 ( n V ) 2 / 3 ( v t + v + + v )
Here, kB is Boltzmann’s constant, n is the number of atoms per molecule, and V is the volume per molecule. The unit of κ min is W/(m·K). Figure 7 gives the planar projections of minimum thermal conductivity in (100), (010), and (001) crystallographic planes for VxBy. It can be found that the differences in profiles of minimum thermal conductivities in different planes are small. Furthermore, these curves show little dependence on crystallographic direction, indicating the anisotropy of minimum thermal conductivity is very weak, which also can be obtained from the ratio of maximum to minimum of minimum thermal conductivity in the different crystallographic planes (Table 4). Based on the Callaway–Debye theory, the minimum thermal conductivity is correlated to the Debye temperature [35]. Thus, the anisotropic feature of minimum thermal conductivity also reflects the anisotropy of the Debye temperature.

4. Conclusions

The first-principles method is used to investigate the stability, anisotropies in elasticity, sound velocity, and minimum thermal conductivity of low borides VB, V5B6, V3B4, and V2B3. All compounds are thermodynamically stable. The stability follows the order VB > V5B6 > V3B4 > V2B3. The calculated Vickers hardness of VB, V5B6, V3B4, and V2B3 are close to 40 GPa, indicating that these VxBy compounds are potential superhard materials. The elastic anisotropic indexes (AU, Acomp, and Ashear), 3D surface contours, and their planar projections in different crystallographic planes of bulk, shear, and Young’s moduli are used to characterize the elastic anisotropy. All VxBy compounds show a relatively strong elastic anisotropic feature, which is mainly determined by the shear anisotropy. The order of elastic anisotropy is VB > V5B6 > V3B4 > V2B3. The anisotropies of sound velocity in different crystallographic planes show obvious differences. The minimum thermal conductivities for all VxBy compounds in different planes are comparable and show very weak anisotropy.

Author Contributions

J.Y.: Conceptualization, Software, Data curation, Writing—Original draft preparation, Formal analysis; Y.Z. (Yongmei Zhang): Methodology; Y.Z. (Yuhong Zhao): Software, Validation; Y.M.: Writing—Reviewing and Editing, Project administration. All authors have read and agreed to the published version of the manuscript.

Funding

This research received no external funding.

Institutional Review Board Statement

Not applicable.

Informed Consent Statement

Not applicable.

Data Availability Statement

The data presented in this study are available on request from the corresponding authors.

Conflicts of Interest

The authors declare no conflict of interest.

References

  1. Kaner, R.B.; Gilma, J.J.; Tolbert, S.H. Designing superhard materials. Science 2005, 308, 1268–1269. [Google Scholar] [CrossRef] [Green Version]
  2. Burrage, K.C.; Lin, C.M.; Chen, W.C.; Chen, C.C.; Vohra, Y.K. Experimental and computational studies on superhard material rhenium diboride under ultrahigh pressures. Materials 2020, 13, 1657. [Google Scholar] [CrossRef] [PubMed] [Green Version]
  3. Joha, P.; Polwart, N.; Troupe, C.E.; Wilson, J.I.B. The oxidation of (100) textured diamond, Diamond. Relat. Mater. 2002, 11, 861. [Google Scholar]
  4. Dub, S.; Lytvyn, P.; Strelchuk, V.; Nikolenko, A.; Stubrov, Y.; Petrusha, I.; Taniguchi, T.; Ivakhnenko, S. Vickers hardness of diamond and CBN single crystals: AFM approach. Crystals 2017, 7, 369. [Google Scholar] [CrossRef] [Green Version]
  5. Lonsdale, K. Further comments on attempts by H. Moissan, J.B. Hannay and Sir Charles Parsons to make diamonds in the laboratory. Nature 1962, 196, 104–106. [Google Scholar] [CrossRef]
  6. Mohammadi, R.; Xie, M.; Lech, A.T.; Turner, C.L.; Kavner, A.; Tolbert, S.H.; Kaner, R.B. Toward inexpensive superhard materials, Tungsten tetraboride-based solid solutions. J. Am. Chem. Soc. 2012, 134, 20660–20668. [Google Scholar] [CrossRef]
  7. Chung, H.Y.; Weinberger, M.B.; Levine, J.B.; Kavner, A.; Yang, J.M.; Tolbert, S.H.; Kaner, R.B. Synthesis of ultra-incompressible superhard rhenium diboride at ambient pressure. Science 2007, 316, 436–439. [Google Scholar] [CrossRef]
  8. Akopov, G.; Pangilinan, L.E.; Mohammadi, R.; Kaner, R.B. Perspective: Superhard metal borides: A look forward. APL Mater. 2018, 6, 070901. [Google Scholar] [CrossRef]
  9. Akopov, G.; Yeung, M.T.; Kaner, R.B. Rediscovering the Crystal Chemistry of Borides. J. Adv. Mater. 2017, 29, 1604506. [Google Scholar] [CrossRef]
  10. Yeung, M.T.; Mohammadi, R.; Kaner, R.B. Ultraincompressible, superhard materials. Annu. Rev. Mater. Res. 2016, 46, 465–485. [Google Scholar] [CrossRef]
  11. Li, Q.; Zhou, D.; Zheng, W.; Ma, Y.; Chen, C. Anomalous Stress Response of Ultrahard WBn Compounds. Phys. Rev. Lett. 2015, 115, 185502. [Google Scholar] [CrossRef] [PubMed] [Green Version]
  12. Yeung, M.T.; Lei, J.; Mohammadi, R.; Turner, C.L.; Wang, Y.; Tolbert, S.H.; Kaner, R.B. Superhard Monoborides: Hardness Enhancement through Alloying in W1−xTaxB. Adv. Mater. 2016, 28, 6993–6998. [Google Scholar] [CrossRef] [PubMed]
  13. Liang, Y.; Gao, Z.; Qin, P.; Gao, L.; Tang, C. The mechanism of anomalous hardening in transition-metal monoborides. Nanoscale 2017, 9, 9112–9118. [Google Scholar] [CrossRef]
  14. Liang, Y.; Qin, P.; Jiang, H.; Zhang, L.; Zhang, J.; Tang, C. Designing superhard metals: The case of low borides. AIP Adv. 2018, 8, 045305. [Google Scholar] [CrossRef] [Green Version]
  15. Wei, S.L.; Li, D.; Lv, Y.Z.; Liu, Z.; Tian, F.B.; Duan, D.F.; Liu, B.B.; Cui, T. Strong covalent boron bonding induced extreme hardness of VB3. J. Alloys Compd. 2016, 688, 1101–1107. [Google Scholar] [CrossRef]
  16. Wu, L.; Wan, B.; Zhao, Y.; Zhang, Y.; Liu, H.; Wang, Y.; Zhang, J.; Gou, H. Unraveling stable vanadium tetraboride and triboride by first-principles computations. J. Phys. Chem. C. 2015, 119, 21649–21657. [Google Scholar] [CrossRef]
  17. Pan, Y.; Lin, Y.H.; Guo, J.M.; Wen, M. Correlation between hardness and bond orientation of vanadium borides. RSC Adv. 2014, 4, 47377. [Google Scholar] [CrossRef]
  18. Perdew, J.P.; Burke, K.; Ernzerho, M.F. Generalized Gradient Approximation Made Simple. Phys. Rev. Lett. 1996, 77, 3865. [Google Scholar] [CrossRef] [Green Version]
  19. Kresse, G.; Furthmuller, J. Efficient iterative schemes for ab initio total-energy calculations using a plane-wave basis set. Phys. Rev. B 1996, 54, 11169. [Google Scholar] [CrossRef]
  20. Monkhorst, H.J.; Pack, J.D. Special points for Brillouin-zone integrations. Phys. Rev. B 1976, 13, 5188–5192. [Google Scholar] [CrossRef]
  21. Fan, C.Z.; Zeng, S.Y.; Li, L.X.; Zhan, Z.J.; Liu, R.P.; Wang, W.K.; Zhang, P.; Yao, Y.G. Potential superhard osmium dinitride with fluorite and pyrite structure: First-principles calculations. Phys. Rev. B 2006, 74, 125118. [Google Scholar] [CrossRef] [Green Version]
  22. Hill, R. The elastic behaviour of a crystalline aggregate. Proc. Phys. Soc. A 1952, 65, 349–354. [Google Scholar] [CrossRef]
  23. Chen, X.Q.; Niu, H.; Li, D.; Li, Y. Modeling hardness of polycrystalline materials and bulk metallic glasses. Intermetallics 2011, 19, 1275. [Google Scholar] [CrossRef] [Green Version]
  24. Du, J.L.; Wen, B.; Melnik, R.; Kawazoe, Y. First-principles studies on structural, mechanical, thermodynamic and electronic properties of NieZr intermetallic compounds. Intermetallics 2014, 54, 110–119. [Google Scholar] [CrossRef]
  25. Solozhenko, V.L.; Gregoryanz, E. Synthesis of superhard materials. Mater. Today 2005, 8, 44–51. [Google Scholar] [CrossRef]
  26. Kong, Z.; Peng, M.; Sun, Y.; Qu, D.; Bao, L. Theoretical predictions of elastic anisotropies and thermal properties of TMRe2 (TM = Sc, Y, Zr and Hf). Phys. B Condens. Matter 2019, 571, 222. [Google Scholar] [CrossRef]
  27. Qu, D.; Bao, L.; Kong, Z.; Duan, Y. Anisotropy of elastic and thermal properties of TMOs2(TM = Sc, Y, Ti, Zr and Hf) from first-principles explorations. Mater. Res. Express 2019, 6, 116569. [Google Scholar] [CrossRef]
  28. Zhang, M.G.; Yan, H.Y. Elastic anisotropy and thermodynamic properties of iron tetraboride under high pressure and high temperature. Solid State Commun. 2014, 187, 53–58. [Google Scholar] [CrossRef]
  29. Ranganathan, S.I.; Ostoja-Starzewski, M. Universal elastic anisotropy index. Phys. Rev. Lett. 2008, 101, 055504–055507. [Google Scholar] [CrossRef] [Green Version]
  30. Chung, D.H.; Buessem, W.R. The elastic anisotropy of crystals. J. Appl. Phys. 1967, 38, 2010–2012. [Google Scholar] [CrossRef]
  31. Zhang, Y.M.; Liu, D.; Shi, Y.D.; Sun, Z.Y.; Wu, L.; Gao, Y.Q. Elastic anisotropy and physical properties of semi-transition-metal borides: First- principles calculation. Appl. Phys. Express 2020, 13, 015501. [Google Scholar] [CrossRef]
  32. Feng, J.; Xiao, B.; Zhou, R.; Pan, W. Anisotropy in elasticity and thermal conductivity of monazite-type REPO4 (RE = La, Ce, Nd, Sm, Eu and Gd) from first-principles calculations. Acta Mater. 2013, 61, 7364–7383. [Google Scholar] [CrossRef]
  33. Lau, K.; McCurdy, A.K. Elastic anisotropy factor fot orthorhomic, tetragonal, and hexagonal crystals. Phys. Rev. B 1998, 58, 8980. [Google Scholar] [CrossRef]
  34. Cahill, D.G.; Watson, S.K.; Pohl, R.O. Lower limit to the thermal conductivity of disordered crystals. Phys. Rev. B 1992, 46, 6131. [Google Scholar] [CrossRef] [PubMed]
  35. Luo, Y.; Wang, J.; Li, J.; Hu, Z.; Wang, J. Theoretical study on crystal structures, elastic stiffness, and intrinsic thermal conductivities of β-, γ-, and δ-Y2Si2O7. J. Mater. Res. 2015, 30, 493. [Google Scholar] [CrossRef]
Figure 1. The total density of states with Fermi level EF (vertical dashed line) of VxBy.
Metals 11 00577 g001
Figure 2. (a) Orientation dependence of bulk modulus and (b) planar projections in (100), (010), and (001) planes of VxBy.
Metals 11 00577 g002
Figure 3. (a) Orientation dependence of shear modulus and (b) planar projections in (100), (010), and (001) planes of VxBy.
Metals 11 00577 g003
Figure 4. (a) Orientation dependence of Young’s modulus and (b) planar projections in (100), (010), and (001) planes of VxBy.
Metals 11 00577 g004
Figure 5. (ac) Variation trends of elastic anisotropic indexes of VxBy. For comparison, the ratios of Bmax/Bmin, Gmax/Gmin, and Emax/Emin are also plotted.
Metals 11 00577 g005
Figure 6. Anisotropies of sound velocity (vt and v±) in (100), (010), and (001) planes for VxBy.
Metals 11 00577 g006
Figure 7. Anisotropies of minimum thermal conductivity in the (100), (010), and (001) planes for VxBy.
Metals 11 00577 g007
Table 1. Calculated lattice constants a, b, and c (Å), cohesive energy Ecoh (eV), and formation enthalpy Eeff (eV) of VB, V5B6, V3B4, and V2B3 with the available data for comparison.
- VBV5B6V3B4V2B3
apresent3.0472.9722.9753.039
Ref. [13]3.0502.9762.9803.039
Exp. [21]3.1003.058-3.060
bpresent8.03521.2133.04118.392
Ref. [13]8.03621.2203.04218.408
Exp. [22]8.17021.250-18.429
cpresent2.9663.04613.1992.977
Ref. [13]2.9693.04913.2082.982
Exp. [23]2.9802.974-2.984
Ecohpresent−8.517−8.414−8.354−8.280
Eeffpresent−0.851−0.833−0.822−0.801
Table 2. Calculated bulk modulus B (in Gpa), shear modulus G (in Gpa), Young’s modulus E (in Gpa), and Vickers hardness HV (in GPa) of VxBy.
-VBV5B6V3B4V2B3
B266.5272.8276279.2
G235.5237.7237.9242.4
E545.7552.5554.4564
HV39.338.838.339.1
Table 3. Ratio of maximum to minimum of sound velocity (vt and v±, km/s) in the different crystallographic planes of VxBy.
-VBV5B6V3B4V2B3
vt(100) plane1.1291.0751.0501.041
(010) plane1.0091.0051.0611.044
(001) plane1.1191.0811.0111.003
v+(100) plane1.0571.1421.1511.019
(010) plane1.1431.1391.0311.147
(001) plane1.1461.0411.1441.158
v-(100) plane1.1101.0431.0581.032
(010) plane1.1791.1451.0631.098
(001) plane1.0041.0841.1301.043
Table 4. Ratio of maximum to minimum of minimum thermal conductivity in the different crystallographic planes of VxBy.
-VBV5B6V3B4V2B3
κmin(100) plane1.0271.0371.0481.007
(010) plane1.0531.0541.0141.073
(001) plane1.0271.0191.0601.066
Publisher’s Note: MDPI stays neutral with regard to jurisdictional claims in published maps and institutional affiliations.

