Abstract
In this paper, the microstructure, defects, hardness, and tensile strength of the 17-4PH specimens manufactured additively using the selective laser melting (SLM) technique were studied. The analyzed parts (10 mm size cubic specimens and tensile specimens) were manufactured with different defocus parameter values (−1, 0, +1 mm) in order to evaluate this effect with a low power laser (38 W). The study was carried out on three different sections of each cubic specimen, one perpendicular to the laser beam or SLM manufacturing direction (transversal section), and another two parallel to the laser beam direction (longitudinal sections). The specimens microstructures were analyzed with an X-ray diffraction technique, as well as optical, scanning electron, and transmission electron microscopes. Image J software was used to characterize the defects and phase ratio. In addition, hardness and tensile tests were performed according to the corresponding standards. The results show that the amount of austenitic phase and the average grain size varied with defocusing. The percentage of defective area was less than 0.25%. The analyzed defocus distance did not affect the number and average size of the defects. Adjusting the defocusing SLM parameter is important for manufacturing parts with good mechanical properties.
1. Introduction
Additive manufacturing (AM) processes build near net shape three-dimensional (3D) parts by progressively adding thin layers of materials guided by a digital model [1]. Alloy powders are widely used as raw material in laser beam AM techniques because of their ease of feeding and controlled melting [1].
Selective laser melting (SLM) is one of the powder bed fusion (PBF) processes [2] that is widely used in the AM industry to manufacture near-net-shape metal parts for aerospace, medical, or automotive applications [3]. SLM is considered to be the most versatile AM process, as it can process a wide range of materials, including alloys based on Al, Ti, Ni, Co, Cu, and Fe [4].
To ensure optimal manufacturing conditions, the influence of different process parameters such as the powder processing and gas environment in the building chamber [5], laser power and defocusing [6], scanning speed [7], hatch spacing [8], layer thickness [9], and scanning strategy have to be considered [10,11,12]. Many of these are directly related to the input energy of the manufacturing process.
In general, the net energy input of the melting process can be defined as volumetric energy density (VED) (J/mm3). Several researchers have considered different formulations for VED. Some of them have focused their studies on the influence analysis of different parameters related to VED on the molten track morphology of the SLM parts [13]. For them, the amount of VED received by metallic powder is defined by Equation (1), where P is the laser power (W), v is the scanning speed (mm/s), h is the hatch spacing (mm), and lt is the layer thickness (mm).
According to the authors of [14], this equation cannot be used as an absolute quantity for parameter optimization. Alternative equations have been proposed by Gunenthiram et al. [15] considering only the parameters related to the laser irradiation (laser power, scanning speed, and laser spot diameter) in order to define the VED (J/mm3). Similarly, Bertoli et al. [16] calculated VED (J/mm3) as a function of laser power, scanning speed, laser spot diameter and layer thickness. Other researchers have studied the correlation between the melt pool and the surface energy density (J/mm2), defined by the ratio between the laser power and the product of scanning speed and laser spot diameter [17]. Yadroitsev et al. [18] analyzed the degree of influence of power density (MW/cm2), scanning speed, and layer thickness on the geometrical characteristics of single tracks, and found that the most influential parameter was laser power. For the density control of SLM parts, other researchers use energy per layer as an input process parameter [19].
The net energy input influences the type of heat flow produced by metal melting during the manufacturing process “conduction mode” or “keyhole mode”. In the first mode, heating occurs by conduction [20]. The keyhole mode generates a vapor cavity that favors a deeper penetration through energy internal reflection. According to Messler [20], for this heating mode to occur, an energy density greater than 109–1010 W/m2 (103–104 W/mm2) is required. The transversal section of the melt pool in conduction mode heating is characterized by a semi-circular shape, whereas in keyhole mode, the melt pool is deeper and narrower [20,21,22,23]. When energy is transferred from a source to the workpiece producing a melt pool, the transfer is not perfect, there may be losses due to the change in the laser beam with the distance [20,23].
There are several process parameters that can affect the energy density during the manufacturing process. Among them being the defocus distance. The role of laser defocusing is shown to be significant, changing the microstructure when varying the spot size and, consequently, the energy density [20,23,24]. Particularly, when keeping the laser power and scanning speed constant, the defocus distance (positive and negative sense) can affect the microstructure and defect presence. The defocus distance is the position of the focal plane relative to the powder bed. According to the definition given by other authors of [20,23,24], a negative defocus distance occurs when the focal plane is placed under the powder bed, whereas in positive defocus, the focal plane is above it. The defocus sign considers the convergent or divergent nature of the laser beam. The negative defocus leads to a deeper melt pool because of its convergent nature, compared with the positive defocus. Significant differences in the melt pool size and other aspects can lead to different microstructures, mainly due to different cooling rates. When the defocus is positive, the process stability improves, although this occurs at the expense of losing input energy due to beam divergence [23]. According to Kim et al.’s study on welds [24], the melting width decreases from a positive to negative defocus, but the depth increases. In the SLM study done by Metelkova et al. [23], the variation of the width with defocusing is less evident. Ponnusamy et al. [25] evaluated the influence of the laser defocus distance on the surface properties, microstructure, and hardness of the SLM parts, when applying a high constant input energy. This research shows increasing hardening with a negative defocus.
Our study analysed the effect of the defocus distance on the microstructure and defects of the SLM parts manufactured with a fixed input power of 38 W. To date, no studies have been conducted investigating the role of defocusing in SLM at a low energy input. This study shows that even small variations in the defocus distance sign can lead to differences in the microstructure and mechanical properties (hardness and tensile strength) of the manufactured 17-4PH. The 17-4PH alloy is a martensitic precipitation hardened (PH) stainless steel characterized by resistance to corrosion of up to 300 °C, and tailorable strengthening by copper precipitates. 17-4PH stainless steel is widely used as a structural material in marine environments, power plants, and chemical industries [5]. Its excellent weldability and its ability to be heat treated in order to improve its mechanical properties make it a good material option for SLM. The microstructure evolution induced by AM processes is quite different from that of traditionally processed components. Using high density processes (laser beam or electron beam), a higher cooling rate is induced in the melt pool, favoring a very fine microstructure and a significant metastability. Such a metastability may give rise to mechanical properties largely different from those of the as-cast and wrought materials. For example, the 17-4PH stainless steel component produced by SLM contains, after cooling, a high amount of metastable untransformed austenite because of its very fine microstructure [26]. The microstructure evolution is also a function of the process parameters and gas environment (for both powder processing and SLM processes) [5].
2. Material and Methods
A SLM metal 3D Systems ProX 100 machine (333 Three D Systems Circle | Rock Hill, SC 29730 | USA) [27] was used to manufacture cubic specimens 10 mm in size and tensile specimens with a different focus distance in an inert nitrogen atmosphere chamber. The manufactured parts were separated from the build-up plate by wire electrical discharge machining (WEDM). Table 1 shows the composition of the nitrogen atomized 17-4PH powder [28,29]. The specimens named D0, Dd1, and Dc1 were processed with the laser beam in focus, defocusing 1 mm above the focal plane (divergent beam through the powder bed) and defocusing 1 mm under the focal plane (convergent beam), respectively. The focus of the laser beam was calibrated according to the manufacturer recommendations (corresponding to D0 specimen). The defocusing values were selected after carrying out previous tests in which specimens with defocusing values higher than 1 mm (in both positive and negative distance) showed a high surface roughness. The rest of parameters were the same for the three parts (Table 2). To achieve a high density and good mechanical properties in the manufactured parts, a hexagonal scanning strategy was used. This strategy divides each layer to be manufactured into hexagonal patches. The direction scanning paths changed from 45° to −45° in each layer. Moreover, the hexagonal pattern position changed each layer, repeating the same position every three layers [30].

Table 1.
Chemical composition (Wt. %) of the 17-4PH stainless steel powder, adapted from [28,29].

Table 2.
Invariant process parameters of the SLM machine.
Microstructure, defect, and hardness analyses were carried out on three different sections of each cubic specimen (Figure 1)—one section (transversal or T section) perpendicular to the laser beam or building direction (Z axis) and the other two parallel to it (longitudinal or L1 and L2 sections). The L1 and L2 sections were perpendicular to the Y and X axes of the SLM machine, respectively. The sections were cut at the same distance, 2 mm from the part surface.
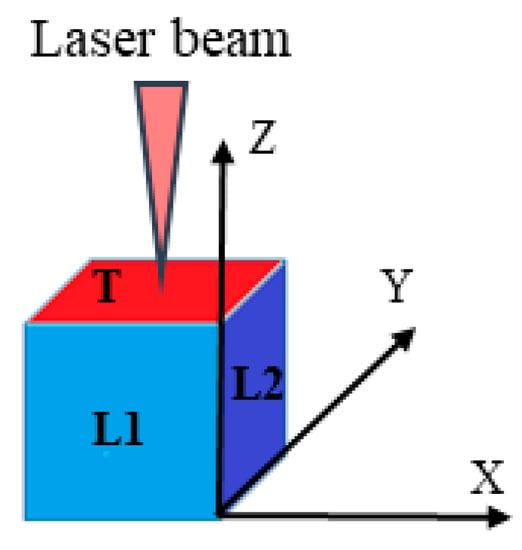
Figure 1.
Cubic specimen sections with orientations of T, L1, and L2 with respect to the laser beam.
An optical microscope (OM), scanning electron microscope (SEM) and transmission electron microscope (TEM) were used. Specifically, a Nikon Ephipot 200 OM a ZEISS EVO SEM equipped with a Bruker energy-dispersive X-ray (EDX) spectrometer and a PhilipsTM CM-200® TEM were used. The sections were prepared following standard procedures. For the OM analysis, the microstructure was revealed through Vilella etching.
TEM thin foils were prepared by mechanical grinding and polishing down to a thickness of 0.2–0.3 mm. The 3 mm discs were punched and then dimpled down to a central thickness of 25–30 µm. The final thickness for the electron transparency was obtained by double-tilt GatanTM precision ion polishing system (PIPS) with incident angles of 8, 6, and 4° for the first, second quarter, and last half process duration, respectively. Microstructural inspections were carried out at 200 kV using a double-tilt specimen holder. Converged-beam electron diffraction (CBED), with a nominal electron beam of 5–6 nm, was used to determine the lattice parameters of the existing phases.
An X-ray diffraction (XRD) analysis was performed on the T section of the cubic specimens. A Rigaku D/MAX-Ultima X-Ray system was employed for this analysis. Cu (Kα) X-radiation was used.
On the longitudinal (L1 and L2) sections of the cubic specimens, the average grain size, depth, and width of the melt pools were evaluated using NIS Nikon software (version 2.1, Nikon) for the image analysis, supplied by the optical microscope.
The area fraction corresponding to the different phases highlighted by etching, as well as the amount and area of defects, were evaluated using ImageJ software. The L1, L2, and T sections were reconstructed into a mosaic of the optical micrographs. These images were made into binary (black and white) in order to calculate the area fraction of the martensite (dark color area divided by the section area). The fraction of the defectiveness area (defects area divided by section area) was also determined for the three sections. Moreover, the distribution of defects in the different classes of areas and morphology were analyzed. The defects morphology was identified by the shape factor (fcircularity) [31], defined by Equation (2), where P is the perimeter and A is the defect area.
Thus, for a perfect circle (spherical defect), the shape factor (fcircularity) would be one, while for a strongly elongated defect and therefore laminar, the fcircularity would be very close to zero. The identified defects were classified according to the following three types:
- Laminar shaped defects (0 < fcircularity ≤ 0.5).
- Random shaped defects (0.5 < fcircularity ≤ 0.75).
- Spherical shaped defects (0.75 < fcircularity ≤ 1).
The hardness value (HV) was measured using a Vickers Affri Wiky 200JS digital instrument employing a 1 Kgf load (HV1), according to the vickers hardness ISO 6507-1(2018) standard [32]. The average hardness values were calculated from 10 measurements of each section.
A Servosis ME-402/5 universal testing machine (Servosis S.L. 28320 Pinto, Madrid, Spain) was used to carry out the tensile tests according to the tensile testing ISO 6892-1(2019) standard [33].
3. Results and Discussion
3.1. Microstructure
Figure 2 shows the microstructure of the transversal and longitudinal sections after chemical etching. T sections were characterized by footprints of visible laser tracks as parallel lines. In the longitudinal sections (L1 and L2), the microstructure was characterized by the bowl-like texture of the melt pools. The boundary of the melt pool appeared lighter and enclosed a darker area after the Vilella etching.
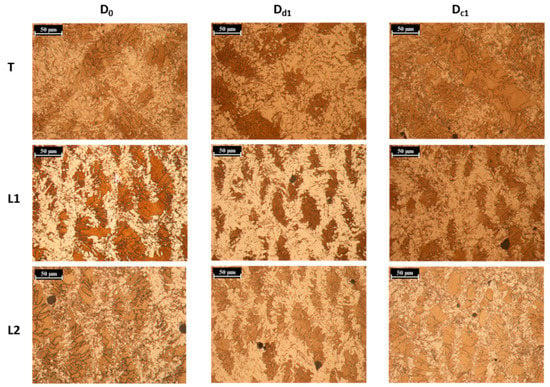
Figure 2.
Microstructure of the D0, Dd1, and Dc1 specimens in the T, L1, and L2 sections after the Vilella chemical etching.
The higher magnification micrographs from the optical (Figure 3a–c) microscope show the elongated grains inside the melting pool that were outlined after the Vilella etching. From both the optical (Figure 3a–c) and SEM migrographs (Figure 3c–e), some traces of the boundary phase (light area) appear distributed inside the melting pool.
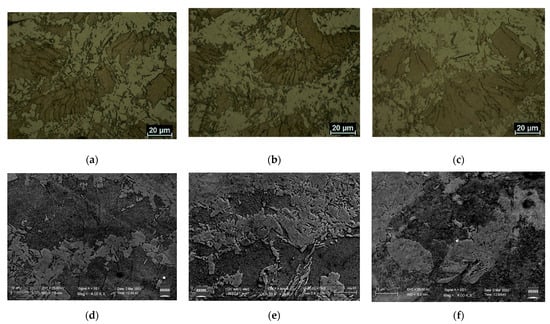
Figure 3.
High magnification (1000×) optical (a–c) and scanning electron microscope (SEM) (4000×) (d–f) micrographs of the D0 specimen in (a,d) Dd1 in (b,e) and Dc1 in (c,f) showing elongated grains inside the melting pool (a–c) with some traces of boundary phase distributed also in the inner of the melting pool (c–e).
The XRD pattern for the T sections of the D0, Dd1, and Dc1 specimens (Figure 4) shows the presence of peaks related to both martensite or ferrite (α phase) and austenite (γ phase). In fact, because of the very low carbon concentration in this alloy (<0.04 wt% [28]), the magnitude of the lattice distortion in the body-centered tetragonal (BCT) martensite was very small, and it was not possible to distinguish between the body centered cubic (BCC) ferrite and the BCT martensite [34]. No significant differences in the X-ray pattern were highlighted for the D0, Dd1, and Dc1 diffraction patterns.
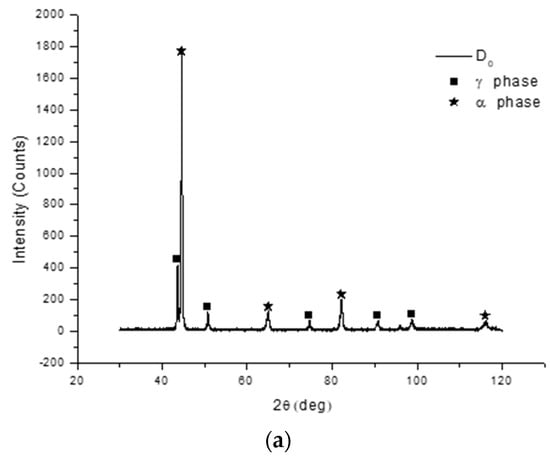
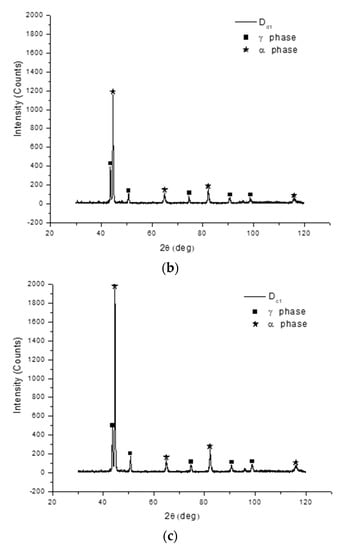
Figure 4.
X-ray diffraction (XRD) patterns of the (a) D0, (b) Dd, (c) and Dc specimens.
A TEM analysis of the transversal section was performed on the D0 sample in order to define the nature of the phases highlighted by Vilella etching and to clarify the XRD results. The TEM analysis showed the absence of a ferritic phase and the presence of austenite (Figure 5a) distributed mainly at the boundary of the melt pool (light zone in Figure 2 and Figure 3) with martensite inside the melting pool (dark zone in Figure 2 and Figure 3). In some zones, the microstructure showed the co-existence of martensite laths and austenite grains (Figure 5b,c). This was characterized by the diffuse presence of twinning between martensite laths (M) and austenite grains (A), as highlighted by a red circle in the selected-area electron diffraction patterns (SAEDPs), shown in Figure 5c.
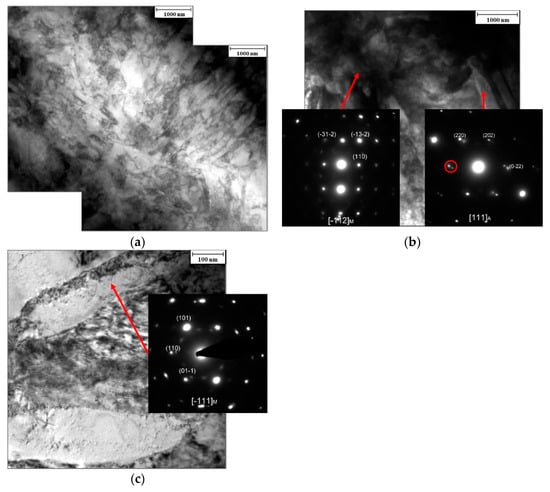
Figure 5.
D0 specimen transmission electron microscope (TEM) micrographs taken on the T section showing (a) the presence of austenite at the boundary of the melting pool and martensite inside the melting pool; (b) martensite laths (M) and twinned austenite grains (A) with a selected-area electron diffraction patterns (SAEDP) inset showing a red circle for the twinning diffraction spots; (c) martensite laths.
Typically, 17-4PH exhibits a martensitic structure with a small fraction of ferrite. The microstructure of the specimens characterized in this study also exhibited an austenitic phase because of the high-density energy that favors significant metastability [5,26,35,36,37]. Moreover, the type of gas used for both the SLM process and/or powder processing affected the built microstructure. For example, Rafi et al. [36] observed a higher portion of retained austenite in the as-built 17-4PH specimen when nitrogen atomized powder was processed under a nitrogen SLM atmosphere instead of argon. Subsequently, Meredith et al. [37] showed that nitrogen atomization plays a prominent role with respect to the gas used during the building process when promoting a high level of retained austenite. For the analyzed specimens in this study, both the powder atomization and building processes were developed using nitrogen gas, so the occurrence of austenite was expected.
Cheruvatur et al. [38] found retained austenite in additively manufactured 17-4PH stainless steel parts. In particular, a core–shell dendritic structure with a α’ phase (martensite) in the core and γ phase (austenite) in the shell was detected. The main reason for this was nitrogen absorption, which stabilized the austenitic phase and lowered the martensite transition start temperature (Ms) at a high solidification rate. Furthermore, in the AISI 431 martensitic stainless-steel laser cladding, an increased amount of retained austenite at the interface boundary was found because of the higher thermal subcooling [39]. Even in the 17-4PH hybrid laser-arc welding, Liu et al. [40] found an increase in the austenitic content in the root of the 17-4PH hybrid joint, where the solidification rate increased with respect to the upper area, which was more affected by the arc power.
The melt pool boundaries were influenced by a high subcooling as a result of contact with a colder powder or a previous solidified layer if preheating of powders was not applied. As a result, the microstructure at the boundary was expected to be different from the inside of the melt pool because of different thermodynamic conditions. When the 17-4PH alloy solidified, phase transformation usually took place: ferrite δ (BCC) → austenite γ (FCC) → ferrite α or α’ (BCC). At high cooling rates, less time was spent forming the δ (BCC) phase, resulting in a uniform primary austenitic phase [38,39]. Therefore, the very rapid decrease in temperature at the melt pool boundary led to the development of a very fine-grain austenitic microstructure that developed without diffusion [39]. The austenite grain refinement had a considerable effect on the martensite formation. Grain refinement led to a decrease in the tendency to form martensite and sometimes inhibited the transformation completely [40]. Moreover, the oversaturation of the austenite element stabilized the boundary microstructures upon cooling after solidification. The presence of retained austenite was therefore mainly detected at the boundary of the melt pool.
The abundance of the austenitic phase in the D0, Dd1, and Dc1 specimens was evaluated using ImageJ software along transversal and longitudinal sections. Images were processed in binary to calculate the percentage of the austenite (light area) relative to the section area. The results of the analysis (shown in Table 3) indicate that a higher amount of austenitic phase was detected in the Dd1 specimen.

Table 3.
Amount of austenitic phase evaluated as ratio between austenitic phase area and total area (%), average depth and width of the melt pool (µm).
The depth of the melt pools was evaluated in the longitudinal sections (L1 and L2) of the specimens (Table 3). In our analysis, the depth of the melt pool was similar to half its width, indicating the predominance of a conduction mode for the heat flow [16,22,23,40]. The lowest melt pool depth was obtained in the Dd1 specimen, a result consistent with previous studies [23,24], because of the higher energy losses when positive defocusing was applied [23]. For the analyzed samples, the reduced heat input also led to the lowest width of the melt pool for the Dd1 sample, as shown in Table 3. In order to verify the role of defocusing on the scale of the microstructure, the grain size in the martensite area of the melt pools along the L1 and L2 sections was evaluated (Figure 6). This figure shows that the Dd1 specimen had the highest number of smaller diameter grains (between 0–10 μm), followed by Dc1 and D0.
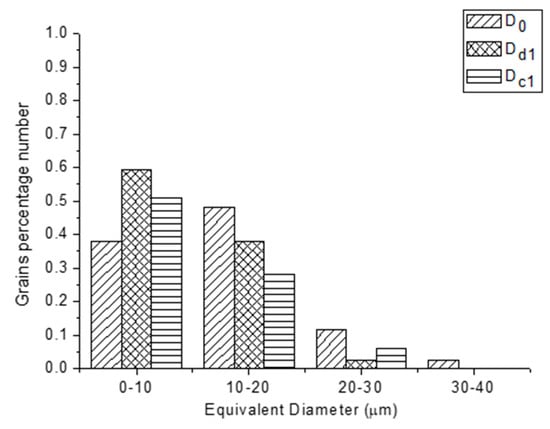
Figure 6.
Distribution of the grain equivalent diameter evaluated in the L1 and L2 sections.
The last result, regarding the average grain size of the samples, indicated that if the size of melting pool decreased, the solidification rate was faster and the microstructure was finer [20,22,41,42,43]. The grain size or the scale of the microstructure was controlled by the product of the temperature gradient (G) and the solidification rate (R) [20,22,41,42,43]. To determine G and R, Rosenthal’s analysis of heat flow was applied to different high temperature alloys processed by laser power bed fusion [22,43]. The condition behind the Rosenthal analysis led to a predicted semi-circular melt pool perpendicular to the beam travel, as in our study. This shape indicated that the conduction mode governed the heat flow [16,20,21,22,23,42,43]. A semi-circular pool was observed at a low heat input, while at a high heat input, the key hole mode governed the heat flow and the width of the melting pool became narrower with respect to the depth [20,21,23,42]. The Rosenthal analysis predicted that G or the average temperature of the melted region was reduced as the heat input increased, because of the larger melting pool, which attenuated the temperature gradient [20,22,41,42,43]. If the average temperature in the melting pool was decreased, the solidification rate R also decreased and hence the cooling rate (GxR), leading to a coarse microstructure. On the contrary, a smaller melting pool led to an increase of G and R and to a refined microstructure. In this study, the sample processed with a divergent defocused beam (Dd1) was characterized by the smaller melting pool and grain size, in agreement with the Rosenthal’ analysis. So, because of the smaller grain size developed in the Dd1 sample, the Ms transformation temperature was further reduced with respect to the other analyzed samples, and, as a consequence, a higher austenitic microstructure was developed [38,39,40] at the fusion line, as shown in Table 3. In fact, at the boundary of the melting pool, the efficiency of the heat transfer towards the cold substrate was the highest and the finest grain size was therefore expected, so the martensitic transformation was inhibited and the austenitic phase remained in the microstructure upon cooling [38,39,40].
3.2. Defects
All sections (T, L1, and L2) had defects, mainly because of the unmelted powder (Figure 7a), which was sometimes associated with voids (Figure 7b). For each section (T, L1, and L2), the fraction of defect area as considered to be the defect area divided by the total area of the section. No significant differences were observed between the three specimens. The average fractions of the defect area were 0.25% ± 0.09, 0.24% ± 0.02, and 0.24% ± 0.02 for the D0, Dd1, and Dc1 specimens, respectively.
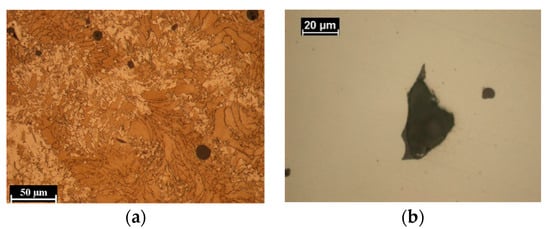
Figure 7.
Optical micrographs of the T section of the Dd1 sample showing (a) unmelted powders in the etched section and (b) unmelted powder associated with the void in the as polished T section.
Figure 8 shows the distribution of the defect numbers according to the defect area. The highest number of defects (about 60%) occurred in the defects with an area less than 50 µm2. Defects with areas between 50–150 µm2 represented 30%. The occurrence of defects with an area greater than 150 µm2 was not significant. Figure 9 compares the distribution of defects number based on their shape for the three specimens in the T, L1, and L2 sections. For each specimen, more than 80% of the defects were characterized by a spherical shape.
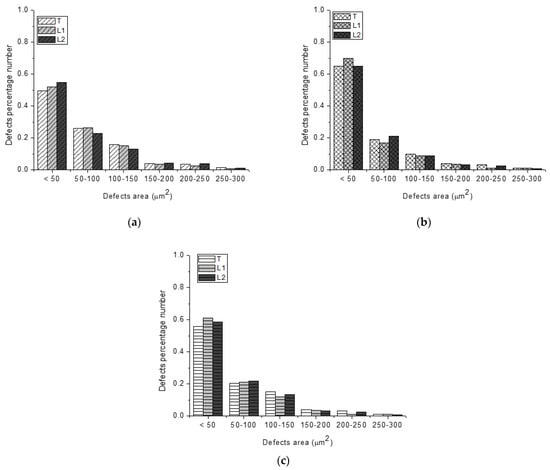
Figure 8.
Distribution of defect numbers based on defect areas in the following specimens: (a) D0, (b) Dd1, and (c) Dc1.
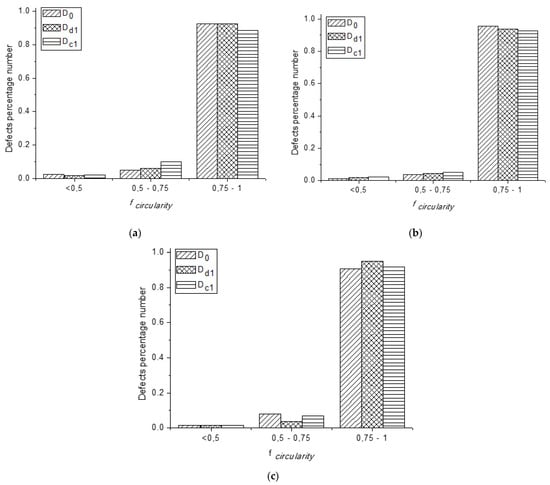
Figure 9.
Distribution of the defect numbers based on the shape factors of the D0, Dd1, and Dc1 specimens in the following sections: (a) T, (b) L1, and (c) L2.
3.3. Hardness and Tensile Strength
Ten hardness measurements were made in the three sections (T, L1, and L2) of specimens, and the average results are shown in Table 4. The lowest hardness values were obtained for the Dd1 specimen (despite the lower grain size of the melt pool) mainly due because of the increase in retained austenite volume. Similarly, Hemmati et al. [39] obtained a lower hardness value in the parts with the AISI 431 laser deposited coating with the most refined microstructure because of the higher amount of austenitic phase. Likewise, Ponnusamy et al. [25] obtained a lower hardness value in the Dd1 specimen using a selective laser melted 17-4PH alloy.

Table 4.
Average hardness values (HV1).
Table 5 shows the average results after performing the tensile test on two specimens of each type (D0, Dd1, and Dc1). As in the hardness tests, the lowest values for the elasticity modulus (E), yield tensile strength (YTS), and ultimate tensile strength (UTS) were obtained for the Dd1 specimen. Regarding the D0 specimen, E decreased by about 9 GPa for the Dc1 specimen and about 37 GPa for the Dd1 specimen. In the case of the UTS and percentage reduction of area (Z), the difference between the average values of the D0 specimen and the other two was negligible. On the other hand, the YTS values of the Dc1 specimen were about 17 MPa greater than those for the D0 specimen, while those of the Dd1 specimen were about 23 MPa less than this.

Table 5.
Average tensile test values.
4. Conclusions
In this paper, the microstructure, defects, hardness, and tensile strength of 17-4PH parts manufactured using the SLM technique with a low power laser energy were studied. In particular, the input power was 38 W. The specimens were processed with a fixed set of parameters and were differed from each other only by the defocus distance values.
The following were the main conclusions:
- − The specimens showed a mixed microstructure of austenite and martensite. The austenitic microstructure was detected mainly at the boundary of the melt pool and the martensitic microstructure inside the melt pool.
- − The analyzed specimens showed a percentage of defect area less than 0.25% and the defects were mainly circular (more than 80%). The defocus parameter did not affect the number of defects. No significant difference was observed in the defect area fraction for the three specimens. Furthermore, all sections had defects with small area size (lower than 50 µm2).
- − The defocus distance altered the melt pool size, the average grain size, and the amount of austenite content. The Dc1 specimen and the focused beam specimen (D0) exhibited a higher hardness, greater average melt pool depth and grain size, and lower austenitic content than the Dd1 specimen.
- − Regarding the tensile tests, hardness-like results were obtained, with the D0 and Dc1 specimens having the best properties.
Proper adjustment of the defocus distance was important for obtaining high-quality SLM parts. In particular, for SLM machines that worked with a low laser power, small variations in the defocus value produced significant changes in the part properties.
The results of this research have encouraged us to continue studying the effect of these changes as a result of defocus, when a low input energy was applied, on mechanical properties and geometrical and dimensional quality of the 17-4PH parts manufactured using SLM.
Author Contributions
Conceptualization, P.L.; Formal analysis, P.L.; Investigation, P.L., M.C., A.D.P. and S.G.; Methodology, P.L.; Resources, S.M. and J.B.; Writing – original draft, P.L.; Writing – review & editing, P.L., S.G., S.M. and J.B. All authors have read and agreed to the published version of the manuscript.
Funding
This research received no external funding.
Institutional Review Board Statement
Not applicable.
Informed Consent Statement
Not applicable.
Acknowledgments
Authors gratefully acknowledge the financial support provided by the Junta de Castilla y León and FEDER (project ref. LE027P17).
Conflicts of Interest
The authors declare no conflict of interest.
References
- DebRoy, T.; Wei, H.L.; Zuback, J.S.; Mukherjee, T.; Elmer, J.W.; Milewski, J.O.; Beese, A.M.; Wilson-Heid, A.D.; De, A.; Zhang, W. Additive manufacturing of metallic components—Process, structure and properties. Prog. Mater. Sci. 2018, 92, 112–224. [Google Scholar] [CrossRef]
- ISO/ASTM 52900:2015. Additive Manufacturing—General Principles—Terminology; ISO Office: Geneva, Switzerland, 2015. [Google Scholar]
- Caffrey, T.; Campbell, I.; Wohlers, T. Wohlers Report 2016. In Additive Manufacturing and 3D Printing State of the Industry; Annual Worldwide Progress Report; Wohlers Associates: Fort Collins, CO, USA, 2016. [Google Scholar]
- Gokuldoss, P.K.; Kolla, S.; Eckert, J. Additive Manufacturing Processes: Selective Laser Melting, Electron Beam Melting and Binder Jetting—Selection Guidelines. Materials 2017, 10, 672. [Google Scholar] [CrossRef]
- Murr, L.E.; Martinez, E.; Hernandez, J.; Collins, S.; Amato, K.N.; Gaytan, S.M.; Shindo, P.W. Microstructures and Properties of 17-4 PH Stainless Steel Fabricated by Selective Laser Melting. J. Mater. Res. Technol. 2012, 1, 167–177. [Google Scholar] [CrossRef]
- Rashid, R.A.R.; Ali, H.; Palanisamy, S.; Masood, S.H. Effect of process parameters on the surface characteristics of AlSi12 samples made via Selective Laser Melting. Mater. Today Proc. 2017, 4, 8724–8730. [Google Scholar] [CrossRef]
- Yuan, W.; Chen, H.; Cheng, T.; Wie, Q. Effects of laser scanning speeds on different states of the molten pool during selective laser melting: Simulation and experiment. Mater. Des. 2020, 189, 108542. [Google Scholar] [CrossRef]
- Xia, M.; Gu, D.; Yu, G.; Dai, D.; Chen, H.; Shi, Q. Influence of hatch spacing on heat and mass transfer, thermodynamics and laser processability during additive manufacturing of Inconel 718 alloy. Int. J. Mach. Tool. Manuf. 2016, 109, 147–157. [Google Scholar] [CrossRef]
- Sufiiarov, V.S.; Popovich, A.A.; Borisov, E.V.; Polozov, I.A.; Masaylo, D.V.; Orlov, A.V. The Effect of Layer Thickness at Selective Laser Melting. Procedia Eng. 2017, 174, 126–134. [Google Scholar] [CrossRef]
- Cheng, B.; Shrestha, S.; Chou, K. Stress and deformation evaluations of scanning strategy effect in selective laser melting. Addit. Manuf. 2016, 12, 240–251. [Google Scholar] [CrossRef]
- Wan, H.Y.; Zhou, Z.J.; Li, C.P.; Chen, G.F.; Zhang, G.P. Effect of scanning strategy on grain structure and crystallographic texture of Inconel 718 processed by selective laser melting. J. Mater. Sci. Technol. 2018, 34, 1799–1804. [Google Scholar] [CrossRef]
- Olakanmi, E.O.; Cochrane, R.F.; Dalgarno, K.W. A review on selective laser sintering/melting (SLS/SLM) of aluminium alloy powders: Processing, microstructure, and properties. Prog. Mater. Sci. 2015, 74, 401–477. [Google Scholar] [CrossRef]
- Ciurana, J.; Hernandez, L.; Delgado, J. Energy density analysis on single tracks formed by selective laser melting with CoCrMo powder material. Int. J. Adv. Manuf. Technol. 2013, 68, 1103–1110. [Google Scholar] [CrossRef]
- Prashanth, K.G.; Scudino, S.; Maity, T.; Das, J.; Eckert, J. Is the energy density a reliable parameter for materials synthesis by selective laser melting? Mater. Res. Lett. 2017, 5, 386–390. [Google Scholar] [CrossRef]
- Gunenthiram, V.; Peyre, P.; Schneider, M.; Dal, M.; Coste, F.; Koutiri, I.; Fabbro, R. Experimental analysis of spatter generation and melt-pool behavior during the powder bed laser beam melting process. J. Mater. Process. Technol. 2018, 251, 376–386. [Google Scholar] [CrossRef]
- Bertoli, U.S.; Wolfer, A.J.; Matthews, M.J.; Delplanque, J.P.R.; Schoenung, J.M. On the limitations of Volumetric Energy Density as a design parameter for Selective Laser Melting. Mater. Des. 2017, 113, 331–340. [Google Scholar] [CrossRef]
- Riquelme, A.; Rodrigo, P.; Escalera-Rodriguez, M.D.; Rams, J. Effect of the process parameters in the additive manufacturing of in situ Al/AlN samples. J. Manuf. Process. 2019, 46, 271–278. [Google Scholar] [CrossRef]
- Yadroitsev, I.; Yadroitsava, I.; Bertrand, P.; Smurov, I. Factor analysis of selective laser melting process parameters and geometrical characteristics of synthesized single tracks. Rapid Prototyp. J. 2012, 18, 201–208. [Google Scholar] [CrossRef]
- Rashid, R.; Masood, S.H.; Ruan, D.; Palanisamy, S.; Rashida, R.A.R.; Elambasseril, J.; Brandt, M. Effect of energy per layer on the anisotropy of selective laser melted AlSi12 aluminium alloy. Addit. Manuf. 2018, 22, 246–439. [Google Scholar] [CrossRef]
- Messler, R.W., Jr. Principles of Welding: Processes, Physics, Chemistry, and Metallurgy; Wiley: New York, NY, USA, 1999. [Google Scholar]
- King, W.E.; Barth, H.D.; Castillo, V.M.; Gallegos, G.F.; Gibbs, J.W.; Hahn, D.E.; Kamath, C.; Rubenchik, A.M. Observation of keyhole-mode laser melting in laser powder-bed fusion additive manufacturing. J. Mater. Process. Technol. 2014, 214, 2915–2925. [Google Scholar] [CrossRef]
- Promoppatum, P.; Yao, S.C.; Pistorius, P.C.; Rollett, A.D. A Comprehensive Comparison of the Analytical and Numerical Prediction of the Thermal History and Solidification Microstructure of Inconel 718 Products Made by Laser Powder-Bed Fusion. J. Eng. 2017, 3, 685–694. [Google Scholar] [CrossRef]
- Metelkova, J.; Kinds, Y.; Kempen, K.; de Formanoir, C.; Witvrouw, A.; Hooreweder, B.V. On the influence of laser defocusing in Selective Laser Melting of 316L. Addit. Manuf. 2018, 23, 161–169. [Google Scholar] [CrossRef]
- Kim, J.W.; Jang, B.S.; Kim, Y.T.; Chun, K.S. A study on an efficient prediction of welding deformation for T-joint laser welding of sandwich panel PART I: Proposal of a heat source model. Int. J. Naval. Archit. Ocean Eng. 2013, 5, 348–363. [Google Scholar] [CrossRef]
- Ponnusamy, P.; Masood, S.H.; Palanisamy, S.; Rashid, R.A.R.; Ruan, D. Characterization of 17-4PH alloy processed by selective laser melting. Mater. Today Proc. 2017, 4, 8498–8506. [Google Scholar] [CrossRef]
- Facchini, L.; Vicente, N., Jr.; Lonardelli, I.; Magalini, E.; Robotti, P.; Molinari, A. Metastable Austenite in 17–4 Precipitation-Hardening Stainless Steel Produced by Selective Laser Melting. Adv. Eng. Mater. 2010, 12, 184–188. [Google Scholar] [CrossRef]
- 3DSystems. Direct metal printers. In Metal Additive Manufacturing with the ProX DMP 3D Printers Brochure; 3D Systems: Rock Hill, SC, USA, 2017. [Google Scholar]
- Zapico, P.; Giganto, S.; Barreiro, J.; Martínez-Pellitero, S. Characterisation of 17-4PH metallic powder recycling to optimise the performance of the selective laser melting process. J. Mater. Res. Technol. 2020, 9, 1273–1285. [Google Scholar] [CrossRef]
- 3DSystems. LaserForm 17-4PH (B) for ProX DMP 100, 200 and 300 Direct Metal Printers; 3D Systems: Rock Hill, SC, USA, 2020. [Google Scholar]
- Giganto, S.; Zapico, P.; Castro-Sastre, M.A.; Martínez-Pellitero, S.; Leo, P.; Perulli, P. Influence of the scanning strategy parameters upon the quality of the SLM parts. Procedia Manuf. 2019, 41, 698–705. [Google Scholar] [CrossRef]
- Sutton, A.T.; Kriewall, C.S.; Leu, M.C.; Newkirk, J.W. Powder characterisation techniques and effects of powder characteristics on part properties in powder-bed fusion processes. Virtual Phys. Prototyp. 2017, 12, 3–29. [Google Scholar] [CrossRef]
- ISO 6507-1:2018. Metallic Materials–Vickers Hardness Test—Part 1: Test Method; ISO office: Geneva, Switzerland, 2018. [Google Scholar]
- ISO 6892-1:2019. Metallic Materials–Tensile Testing—Part 1: Method of Test at Room Temperature; ISO office: Geneva, Switzerland, 2019. [Google Scholar]
- Sun, Y.; Hebert, R.J.; Aindow, M. Effect of heat treatments on microstructural evolution of additively manufactured and wrought 17-4PH stainless steel. Mater. Des. 2018, 156, 429–440. [Google Scholar] [CrossRef]
- Starr, T.L.; Rafi, K.; Stucker, B.; Scherzer, C.M. Controlling phase composition in selective laser melted stainless steels. Power 2012, 195, 439–446. [Google Scholar]
- Rafi, H.K.; Pal, D.; Patil, N.; Starr, T.L.; Stucker, B.E. Microstructure and Mechanical Behavior of 17-4 Precipitation Hardenable Steel Processed by Selective Laser Melting. J. Mater. Eng. Perform. 2014, 23, 4421–4428. [Google Scholar] [CrossRef]
- Meredith, S.D.; Zuback, J.S.; Keista, J.S.; Palmer, T.A. Impact of composition on the heat treatment response of additively manufactured 17–4 PH grade stainless steel. Mater. Sci. Eng. A 2018, 738, 44–56. [Google Scholar] [CrossRef]
- Cheruvathur, S.; Lass, E.A.; Campbell, C.E. Additive Manufacturing of 17-4 PH Stainless Steel: Post-processing Heat Treatment to Achieve Uniform Reproducible Microstructure. JOM 2016, 68, 930–942. [Google Scholar] [CrossRef]
- Hemmati, I.; Ocelík, V.; de Hosson, J.T.M. Microstructural characterization of AISI 431 martensitic stainless steel laser-deposited coatings. J. Mater. Sci. 2011, 46, 3405–3414. [Google Scholar] [CrossRef]
- Liu, W.; Ma, J.; Atabaki, M.M.; Pillai, R.; Kumar, B.; Vasudevan, U.; Sreshta, H.; Kovacevic, R. Hybrid Laser-arc Welding of 17-4 PH Martensitic Stainless Steel. Lasers Manuf. Mater. Process. 2015, 2, 74–90. [Google Scholar] [CrossRef]
- Yadroitseva, I.; Krakhmalevb, P.; Yadroitsavaa, I.; Johanssonc, S.; Smurova, I. Energy input effect on morphology and microstructure of selective laser melting single track from metallic poder. J. Mater. Process. Technol. 2013, 213, 606–613. [Google Scholar] [CrossRef]
- Kou, S. Welding Metallurgy, 2nd ed.; Wiley: Hoboken, NJ, USA, 2003. [Google Scholar]
- Bontha, S.; Klingbeil, N.W.; Kobryn, P.A.; Fraser, H.L. Effects of process variables and size-scale on solidification microstructure in beam-based fabrication of bulky 3D structures. Mater. Sci. Eng. A 2009, 513, 311–318. [Google Scholar] [CrossRef]
Publisher’s Note: MDPI stays neutral with regard to jurisdictional claims in published maps and institutional affiliations. |
© 2021 by the authors. Licensee MDPI, Basel, Switzerland. This article is an open access article distributed under the terms and conditions of the Creative Commons Attribution (CC BY) license (https://creativecommons.org/licenses/by/4.0/).