Article

Effect of Water Flow on Underwater Wet Welded A36 Steel

Department of Mechanical Engineering, Universitas Sebelas Maret, Surakarta 57126, Indonesia
*
Authors to whom correspondence should be addressed.
Metals 2021, 11(5), 682; https://doi.org/10.3390/met11050682
Submission received: 23 March 2021 / Revised: 16 April 2021 / Accepted: 19 April 2021 / Published: 21 April 2021

Abstract

:
Underwater wet welding (UWW) combined with the shielded metal arc welding (SMAW) method has proven to be an effective way of permanently joining metals that can be performed in water. This research was conducted to determine the effect of water flow rate on the physical and mechanical properties (tensile, hardness, toughness, and bending effect) of underwater welded bead on A36 steel plate. The control variables used were a welding speed of 4 mm/s, a current of 120 A, electrode E7018 with a diameter of 4 mm, and freshwater. The results show that variations in water flow affected defects, microstructure, and mechanical properties of underwater welds. These defects include spatter, porosity, and undercut, which occur in all underwater welding results. The presence of flow and an increased flow rate causes differences in the microstructure, increased porosity on the weld metal, and undercut on the UWW specimen. An increase in water flow rate causes the acicular ferrite microstructure to appear greater, and the heat-affected zone (HAZ) will form finer grains. The best mechanical properties are achieved by welding with the highest flow rate, with a tensile strength of 534.1 MPa, 3.6% elongation, a Vickers microhardness in the HAZ area of 424 HV, and an impact strength of 1.47 J/mm2.

1. Introduction

Indonesia is a maritime country with water territory that has a lot of potential in the industrial sector, food production, mineral mining, pharmaceuticals, maritime service development, and tourism [1]. This potential arises from the fact that Indonesia has territorial waters with an area of 284,210.90 km2 and waters of the Exclusive Economic Zone (ZEE) with an area of 2,981,211.00 km2 and is supported by abundant marine resources [2]. Utilization of marine resources has begun to develop along with the emergence of marine technology such as offshore oil platforms, submerged pipelines, marine power plants, maintaining nuclear power equipment, and other underwater constructions [3,4]. In its operation, the construction certainly requires continuous maintenance and repairs in case of damage. The connection and cutting of damaged construction components such as pipes that are underwater are carried out by welding directly in the water [4].
Underwater welding technology has become essential and is often used to repair damage to underwater infrastructure such as bridges, offshore structures, and other submerged constructions. Underwater welding technology allows repairs to be carried out directly without moving the water construction onto land, which is less time consuming and more cost efficient [4,5]. The wet welding process that is conducted directly in the water would affect the welding arc, the weld’s droplet transition, and the heating and cooling cycle due to the water environment, such as water flow rate and water pressure.
Underwater welding is an extension of the welding process that is commonly used. Broadly speaking, underwater welding has two methods that can be applied depending on the tool and the properties of the welding results you want to obtain. These methods are underwater wet welding (UWW) and dry underwater welding [5]. Wet welding is carried out directly in a wet environment using special electrodes, and welding is carried out manually similar to welding in general, in the sense that the electrode and the workpiece are in direct contact with water [6], whereas in welding on land, the method used is no different from welding in the open air. This can be carried out with the help of a piece of high-pressure equipment called the dry hyperbaric weld chamber, which is designed to be waterproof similar to a submarine [4].
Underwater wet welding is carried out at ambient pressure by submersion into the water, and there is no mechanical barrier between the water and the welding arc, as shown in Figure 1. The simple welding process makes it possible to weld geometrically complex structures onto the water construction, such as submerged pipelines and cranes and offshore oil platforms [7].
The electrodes used in UWW are special electrodes that are water resistant or have been modified to be so. The welding methods commonly used in underwater welding are shielded metal arc welding (SMAW) and flux-cored arc welding (FCAW), which include welding with a self-shielded wire. Wet welding with these covered electrodes is considered the most versatile method of operation in underwater environments [7,8].
Poor quality of welds can occur in wet environments, resulting from uneven heat transfer distribution, lack of visibility of the welder, and the presence of hydrogen in the arc during the penetration process, which can cause porosity [9]. When the base metal and arc weld area are surrounded by water and there is no heat build-up on the metal from the arc weld, it creates a quench effect in the weld metal, which traps some hydrogen and also results in weld solidification, thereby reducing toughness and ductility [9,10]. A water environment produces such things as waves and a high water flowrate, which can be determining factors of the welding result due to shrinkage of the welding arc and unstable droplet transition [4].
Heat transfer due to high convection that occurs in water will cause heat loss in the welding process. Welding with water flow will have a greater heat transfer capability than welding without water flow. This can be seen from the Nusselt number which reflects the intensity of heat convection. Chen et al. stated that the heat loss will increase due to the heavier water flow, and it is proven by the Dittus–Boelter equation:
Nu = 0.023Re0.8Pr0.3,
Re = Du ρ/μ,
where Nu is the Nusselt number, Re is the Reynolds number, Pr is the Prandtl number, D is the linear dimension characteristic, u is the characteristic velocity of water, ρ is the density of water, and μ is the dynamic viscosity of water. Based on these two equations, it can be concluded that heat loss will increase with increasing water flow rate [4].
Chen et al. conducted research on the effect of water flow rate on arc stability which affected the weld characterization using underwater welding conditions. The study explains that the transfer process in upstream welding will make the metal transfer behind the electrode because it is carried away by the water flow [4]. Zhang et al. studied the effect of metal transfer on the weld and demonstrated that the repelled grobular transfer mode is the main cause of the asymmetric and less uniform appearance of the weld [11]. Zhai et al. studied metal transfer modes and weld morphology in local welding on land and found that the widths of the slag column transfer and continuous liquid transfer welds were greater than those of the no-contact transfer [5]. Guo et al. found that the size of the protective bubble increased dramatically, increasing the arc stress [12]. Feng et al. found that welding current and arc voltage exert strong pressure on dynamic bubbles, with increasing change of shape and frequency [13].
The stability of the welding arc transfer mode and the metal transfer process play a key role in the welding quality. This stability is influenced by various factors in the water environment such as flow rate, temperature, water type, and water pressure. The fluid flow rate in terms of visual velocity can be divided into two: uniform and non-uniform flow. In natural environments, such as seas, rivers, and lakes, non-uniform flow types are often encountered. This non-uniform flow has characteristics such as the shape, direction, and velocity vector of the fluid which change according to the path of the fluid. In this research, we adjusted the variables by using baffle plates or not using baffle plates for non-uniform flow.
Non-uniform flow with baffle plates tends to have a smaller flow rate so that its vector and direction are more uniform than those without baffle plates. Whereas, non-uniform flow without baffle has a relatively high flow rate and results in a complex flow; the paths of motion of the particles are more irregular. The two flow factors will result in different welding arc stability and different weld characterization.
Given the limited information regarding comparison between the physical and mechanical properties of welding on land and underwater wet welding using SMAW without flow and non-uniform flow with baffles and without baffle, research is needed for further understanding the effect of water flow on welding. In this study, the results of weld penetration, microstructures, tensile strength, impact strength, and Vickers microhardness are presented.

2. Materials and Methods

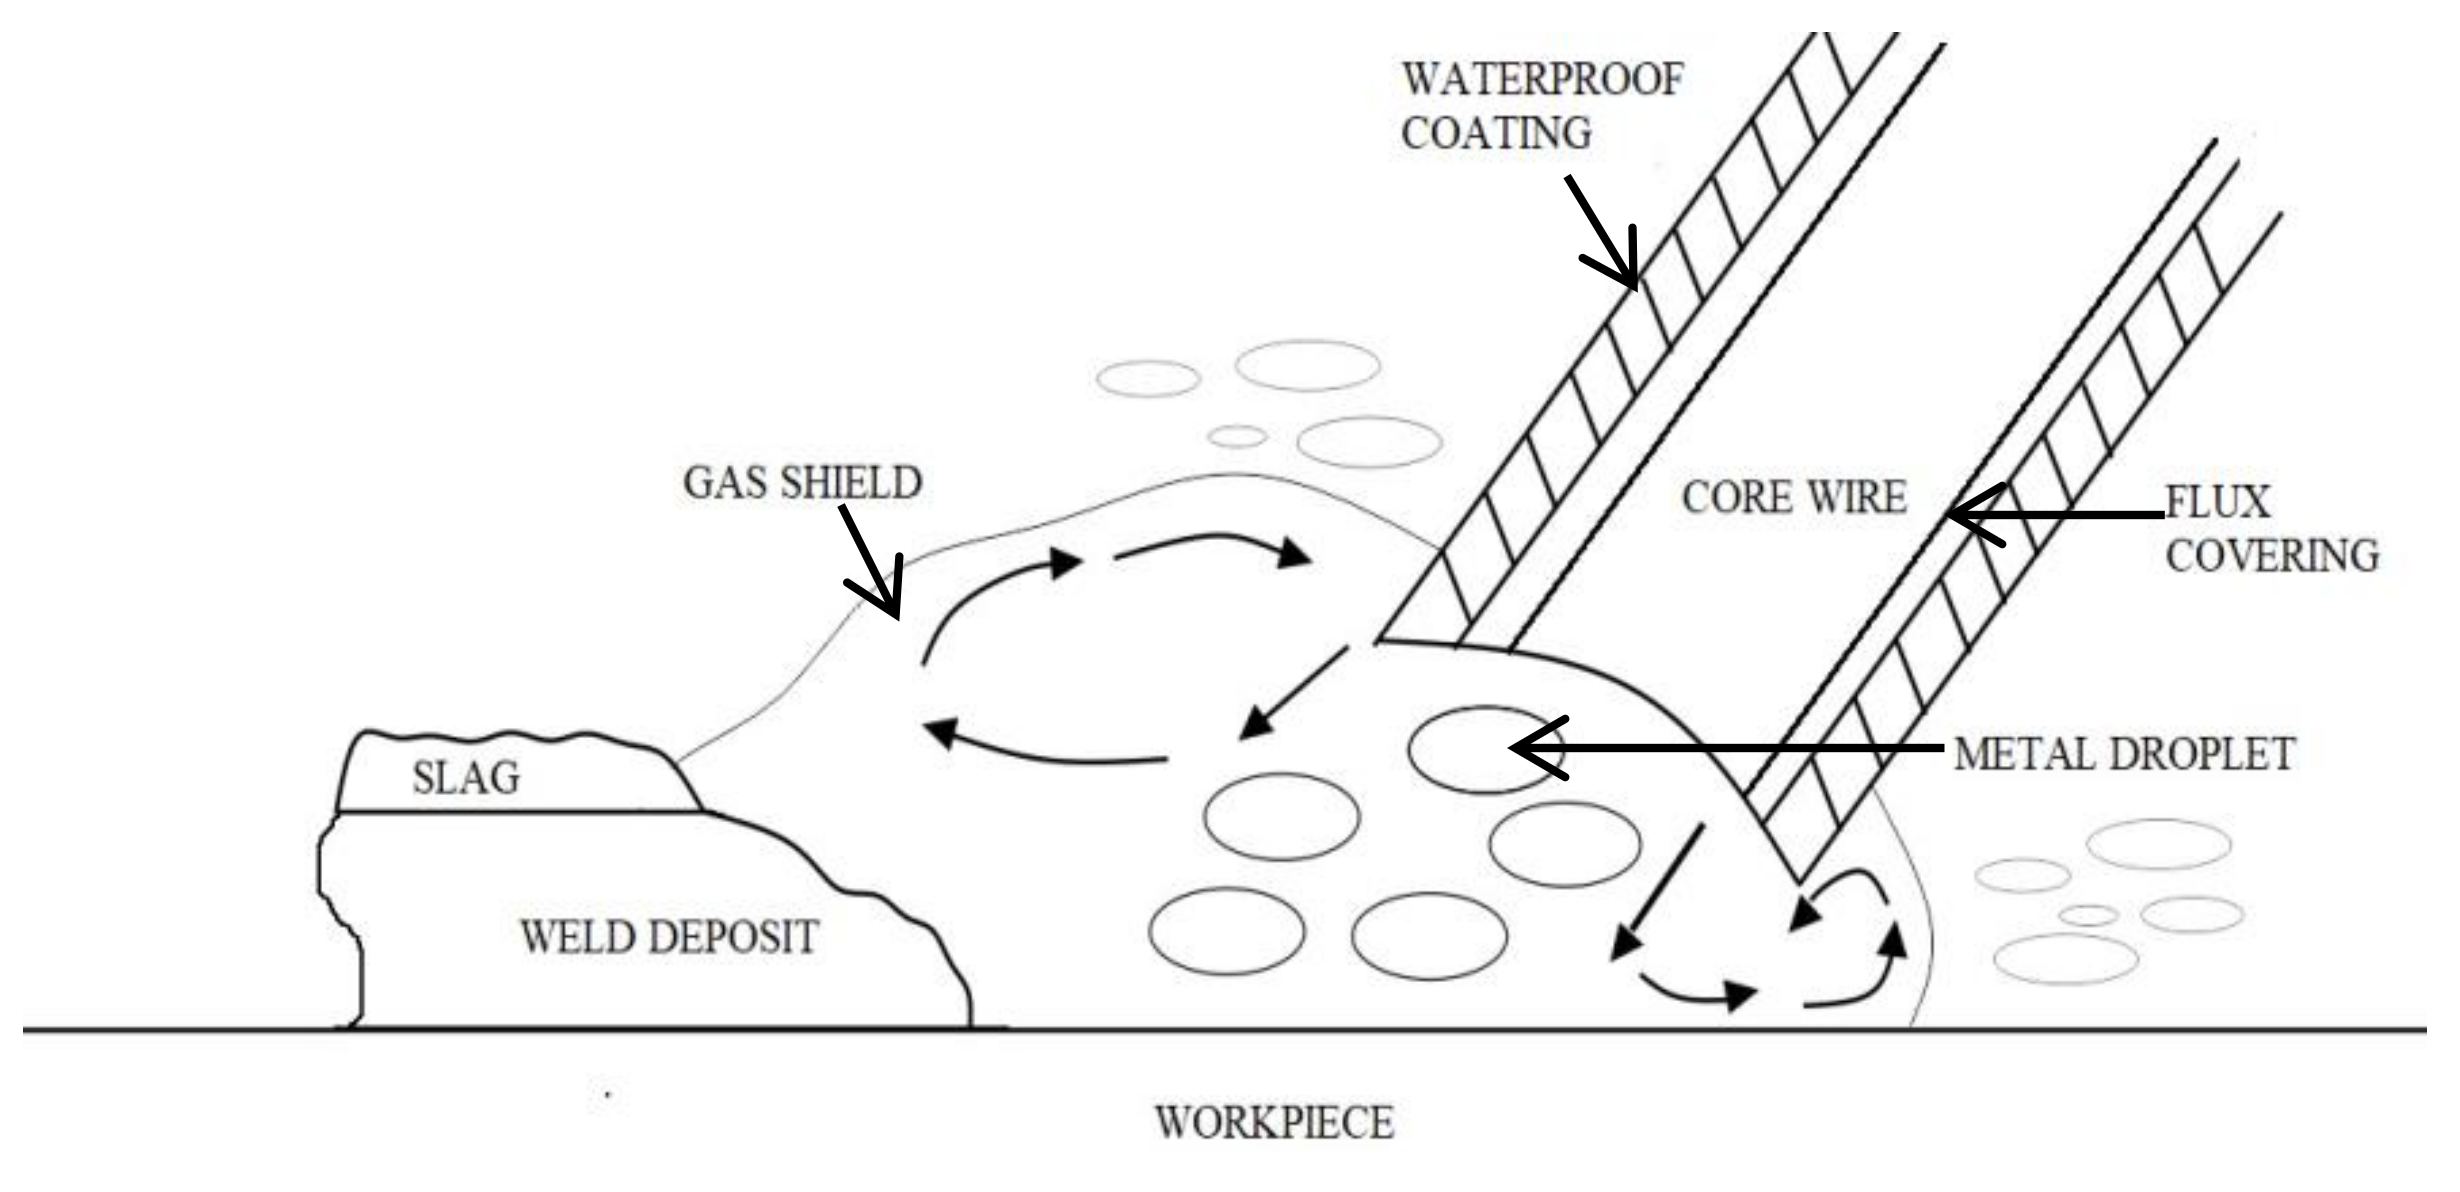
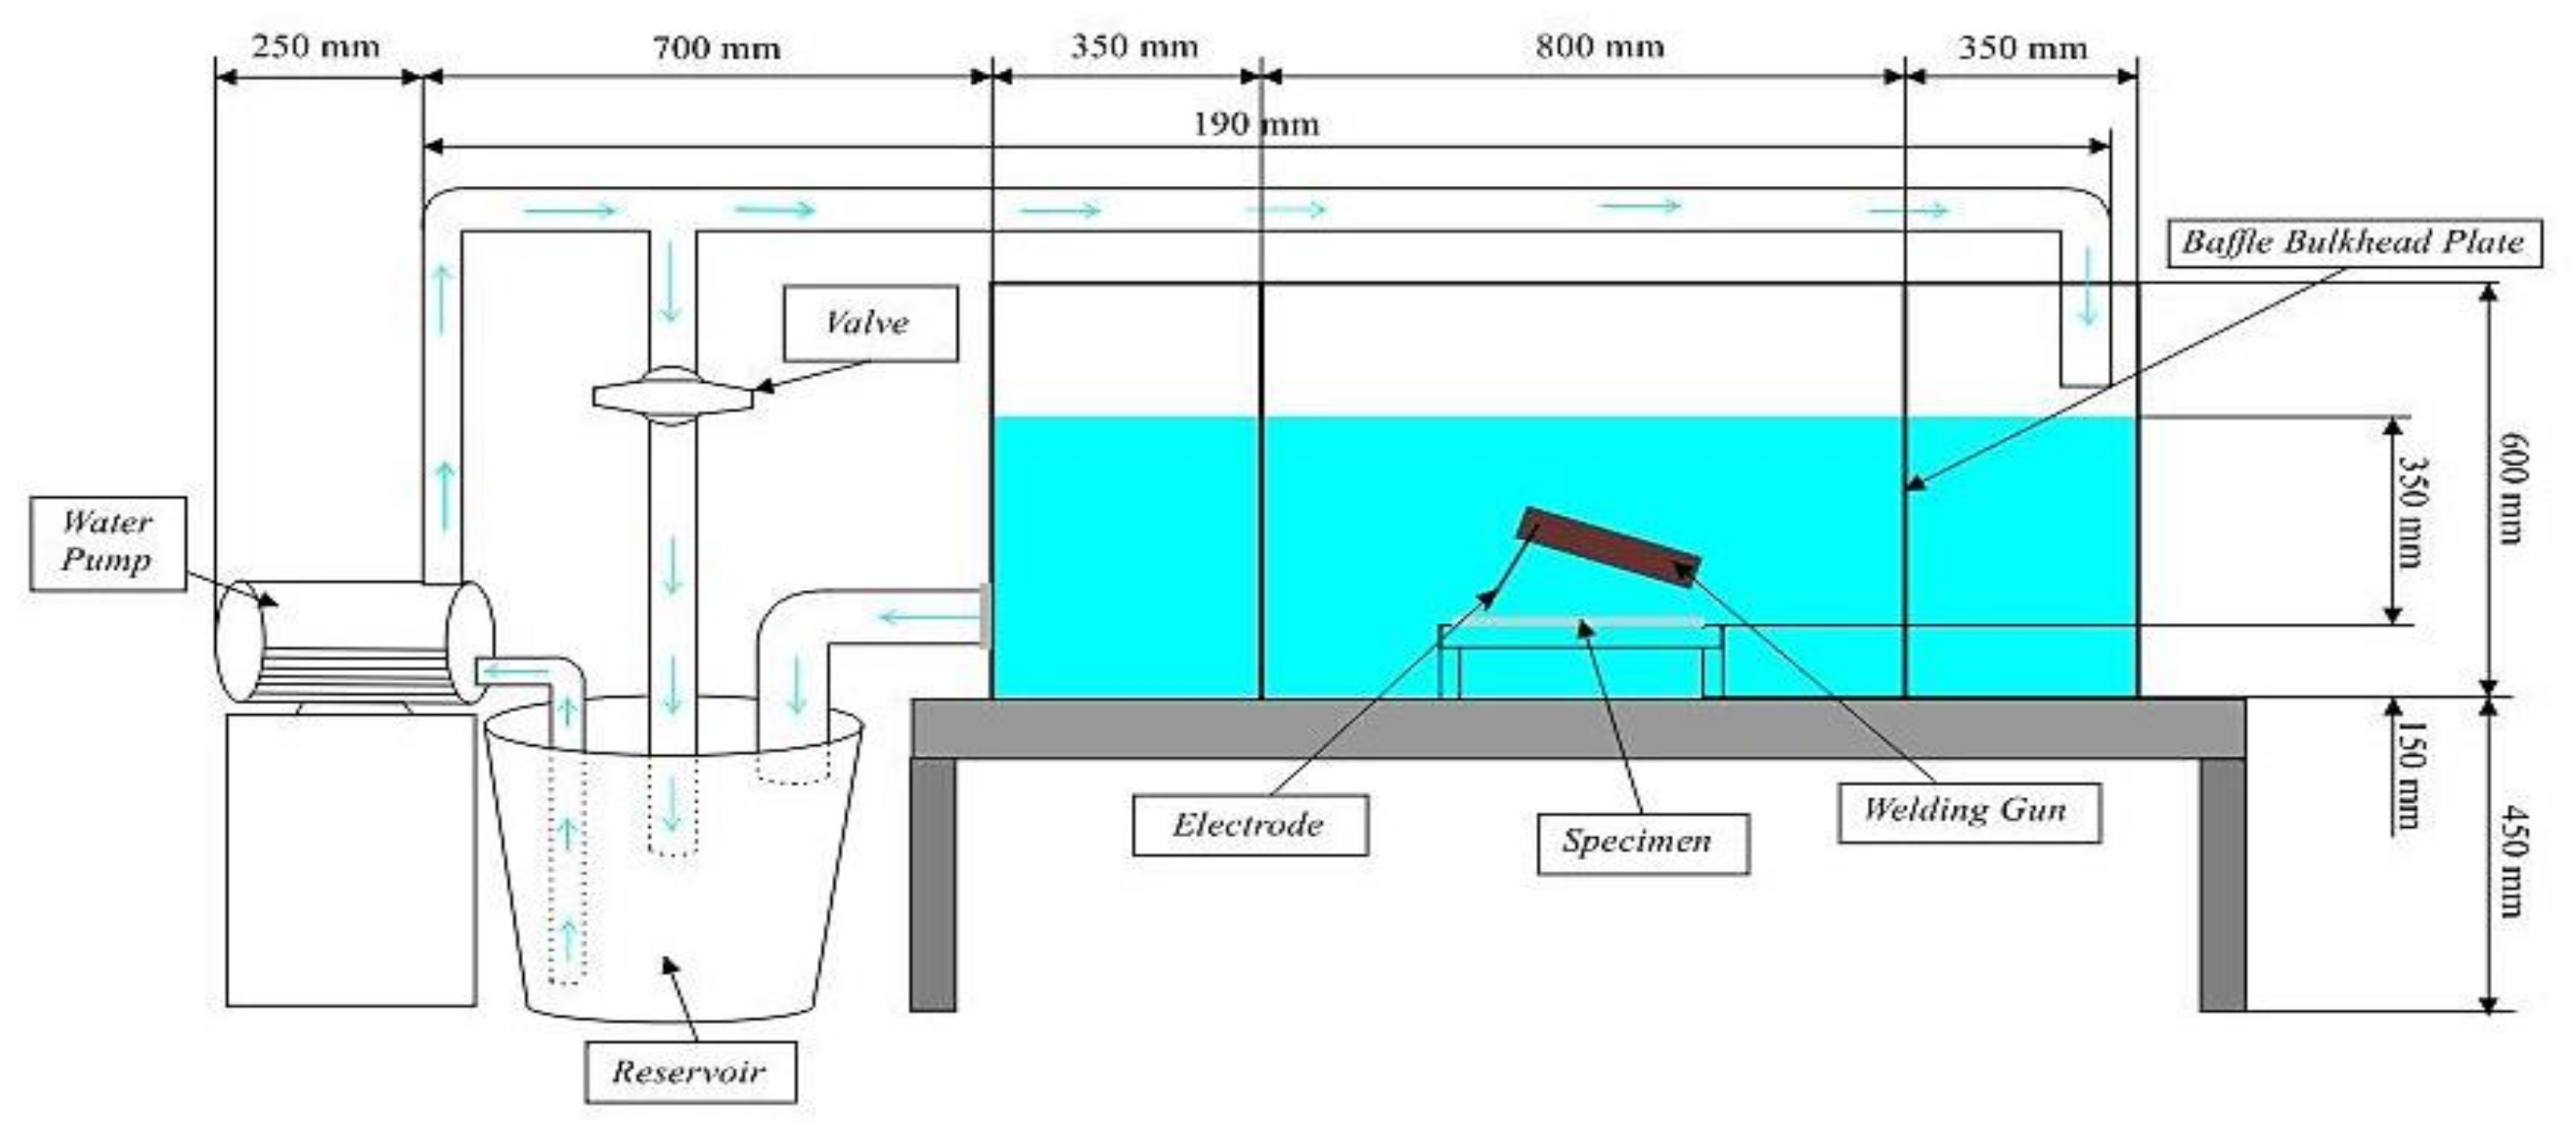
2.1. Welding Process

The material used in this experiment is ASTM A36 low-carbon steel (see Table 1 for the chemical composition) with dimensions of 300 mm × 400 mm × 4 mm, which was cleaned on the surface using grit 150 sandpaper before welding. The welding process was carried out in the water in the test stand with a spray pump that was made in such a way to obtain a specified water flow rate. This test stand had a water stream of 1.25 l/s and pipe diameter of 50.8 mm as an inlet equipped with a valve to regulate the flow rate and a 101.6 mm outlet equipped with a plate to control the drain flow. The water flow rate was 0.6 m/s, with a water level of 0.5 m from the bottom of the test stand. The water used in this research was fresh water at a temperature of 27 °C. Dry and underwater welding was performed with welding travel speeds of 3 mm/s and 4 mm/s. These speeds were chosen to avoid too much heat input, which could lead to welding defects. A KOBEWEL KA-602 welding machine was used, with a welding current of 120 A, a voltage of 24 V, and an E7018 electrode of 4 mm diameter (see Table 2 for the chemical composition). The test stand system is shown in Figure 2.

2.2. Test Preperation

Macro observation was used to identify the weld penetration depth, and it was measured with a stereomicroscope Olympus type SZ2 ILST (Tokyo, Japan)with a magnification of 1.5×. Microstructure observations were made using a Euromex optical microscopy with 100× magnification. The standard procedure for microstructure observation, including cutting, polishing with 150 to 3000 grit sandpaper, and etching, was followed. The etching solution was 95% alcohol, 5% NHO3. The observed areas were base metal, heat-affected zone (HAZ), and weld metal.
A Vickers Highwood test machine type HWMMT-X7 (Fukushima, Japan) was used for the Vickers microhardness test in cross-section to study the hardness value in the microstructure of the weld and the HAZ. The indenter used was a pyramid-shaped diamond with load of 200 gf, due to the small size of the specimen, for 10 s according to ASTM E384 for microindentation testing. A Universal Testing Machine (UTM) SANS type SHT4106 (Guangdong, China) was used for tensile testing with reference to the JIZ 2201 standard, the coupon test, as shown in Figure 3. The tensile test was conducted at a tensile speed of 11.25 mm/s and a cross-section of 25 mm2. The bend tests used the same UTM as the tensile test, with a 55 mm depth penetration of punch. The bend’s coupon test refers to the standard of AWS D1.1. For impact testing, TATONAS type TG-820 (Yogyakarta, Indonesia) was used, with swing load of 9.5 kg and arm length of 0.85 m, at room temperature. The tensile, bend, and impact testing was repeated three times with a different specimen for each variable.

3. Results and Discussion

3.1. Physical Characteristics

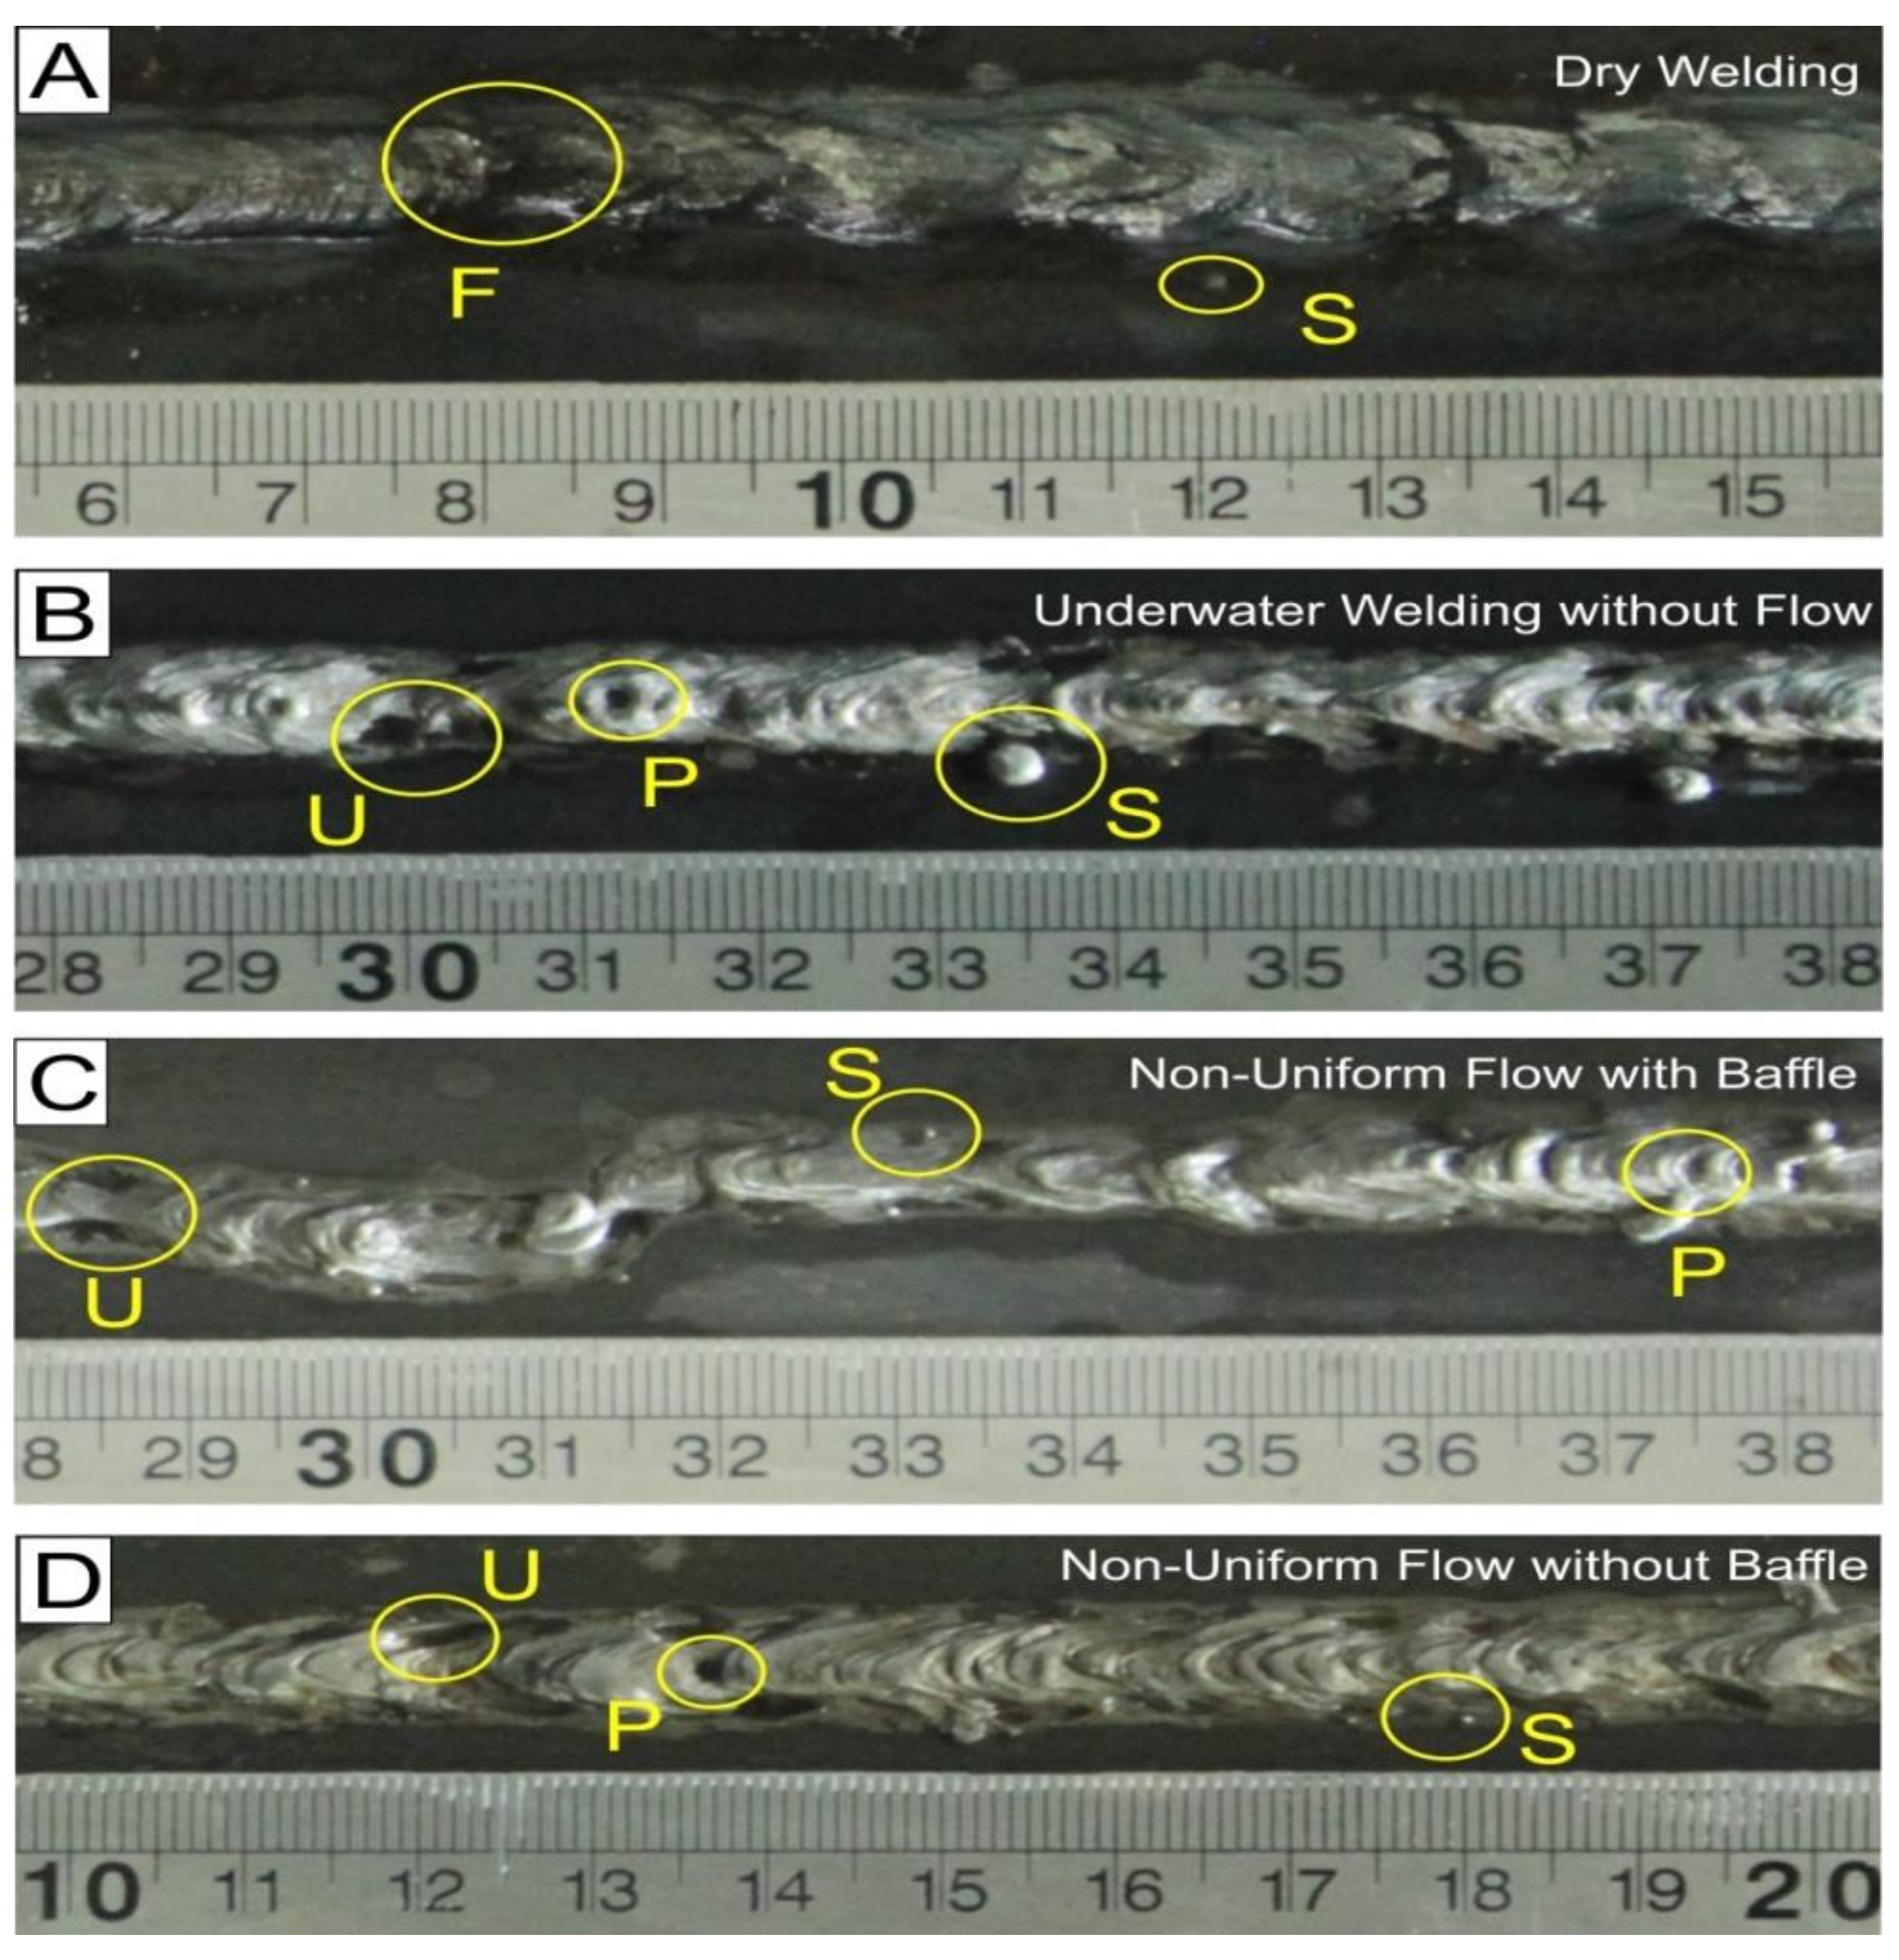
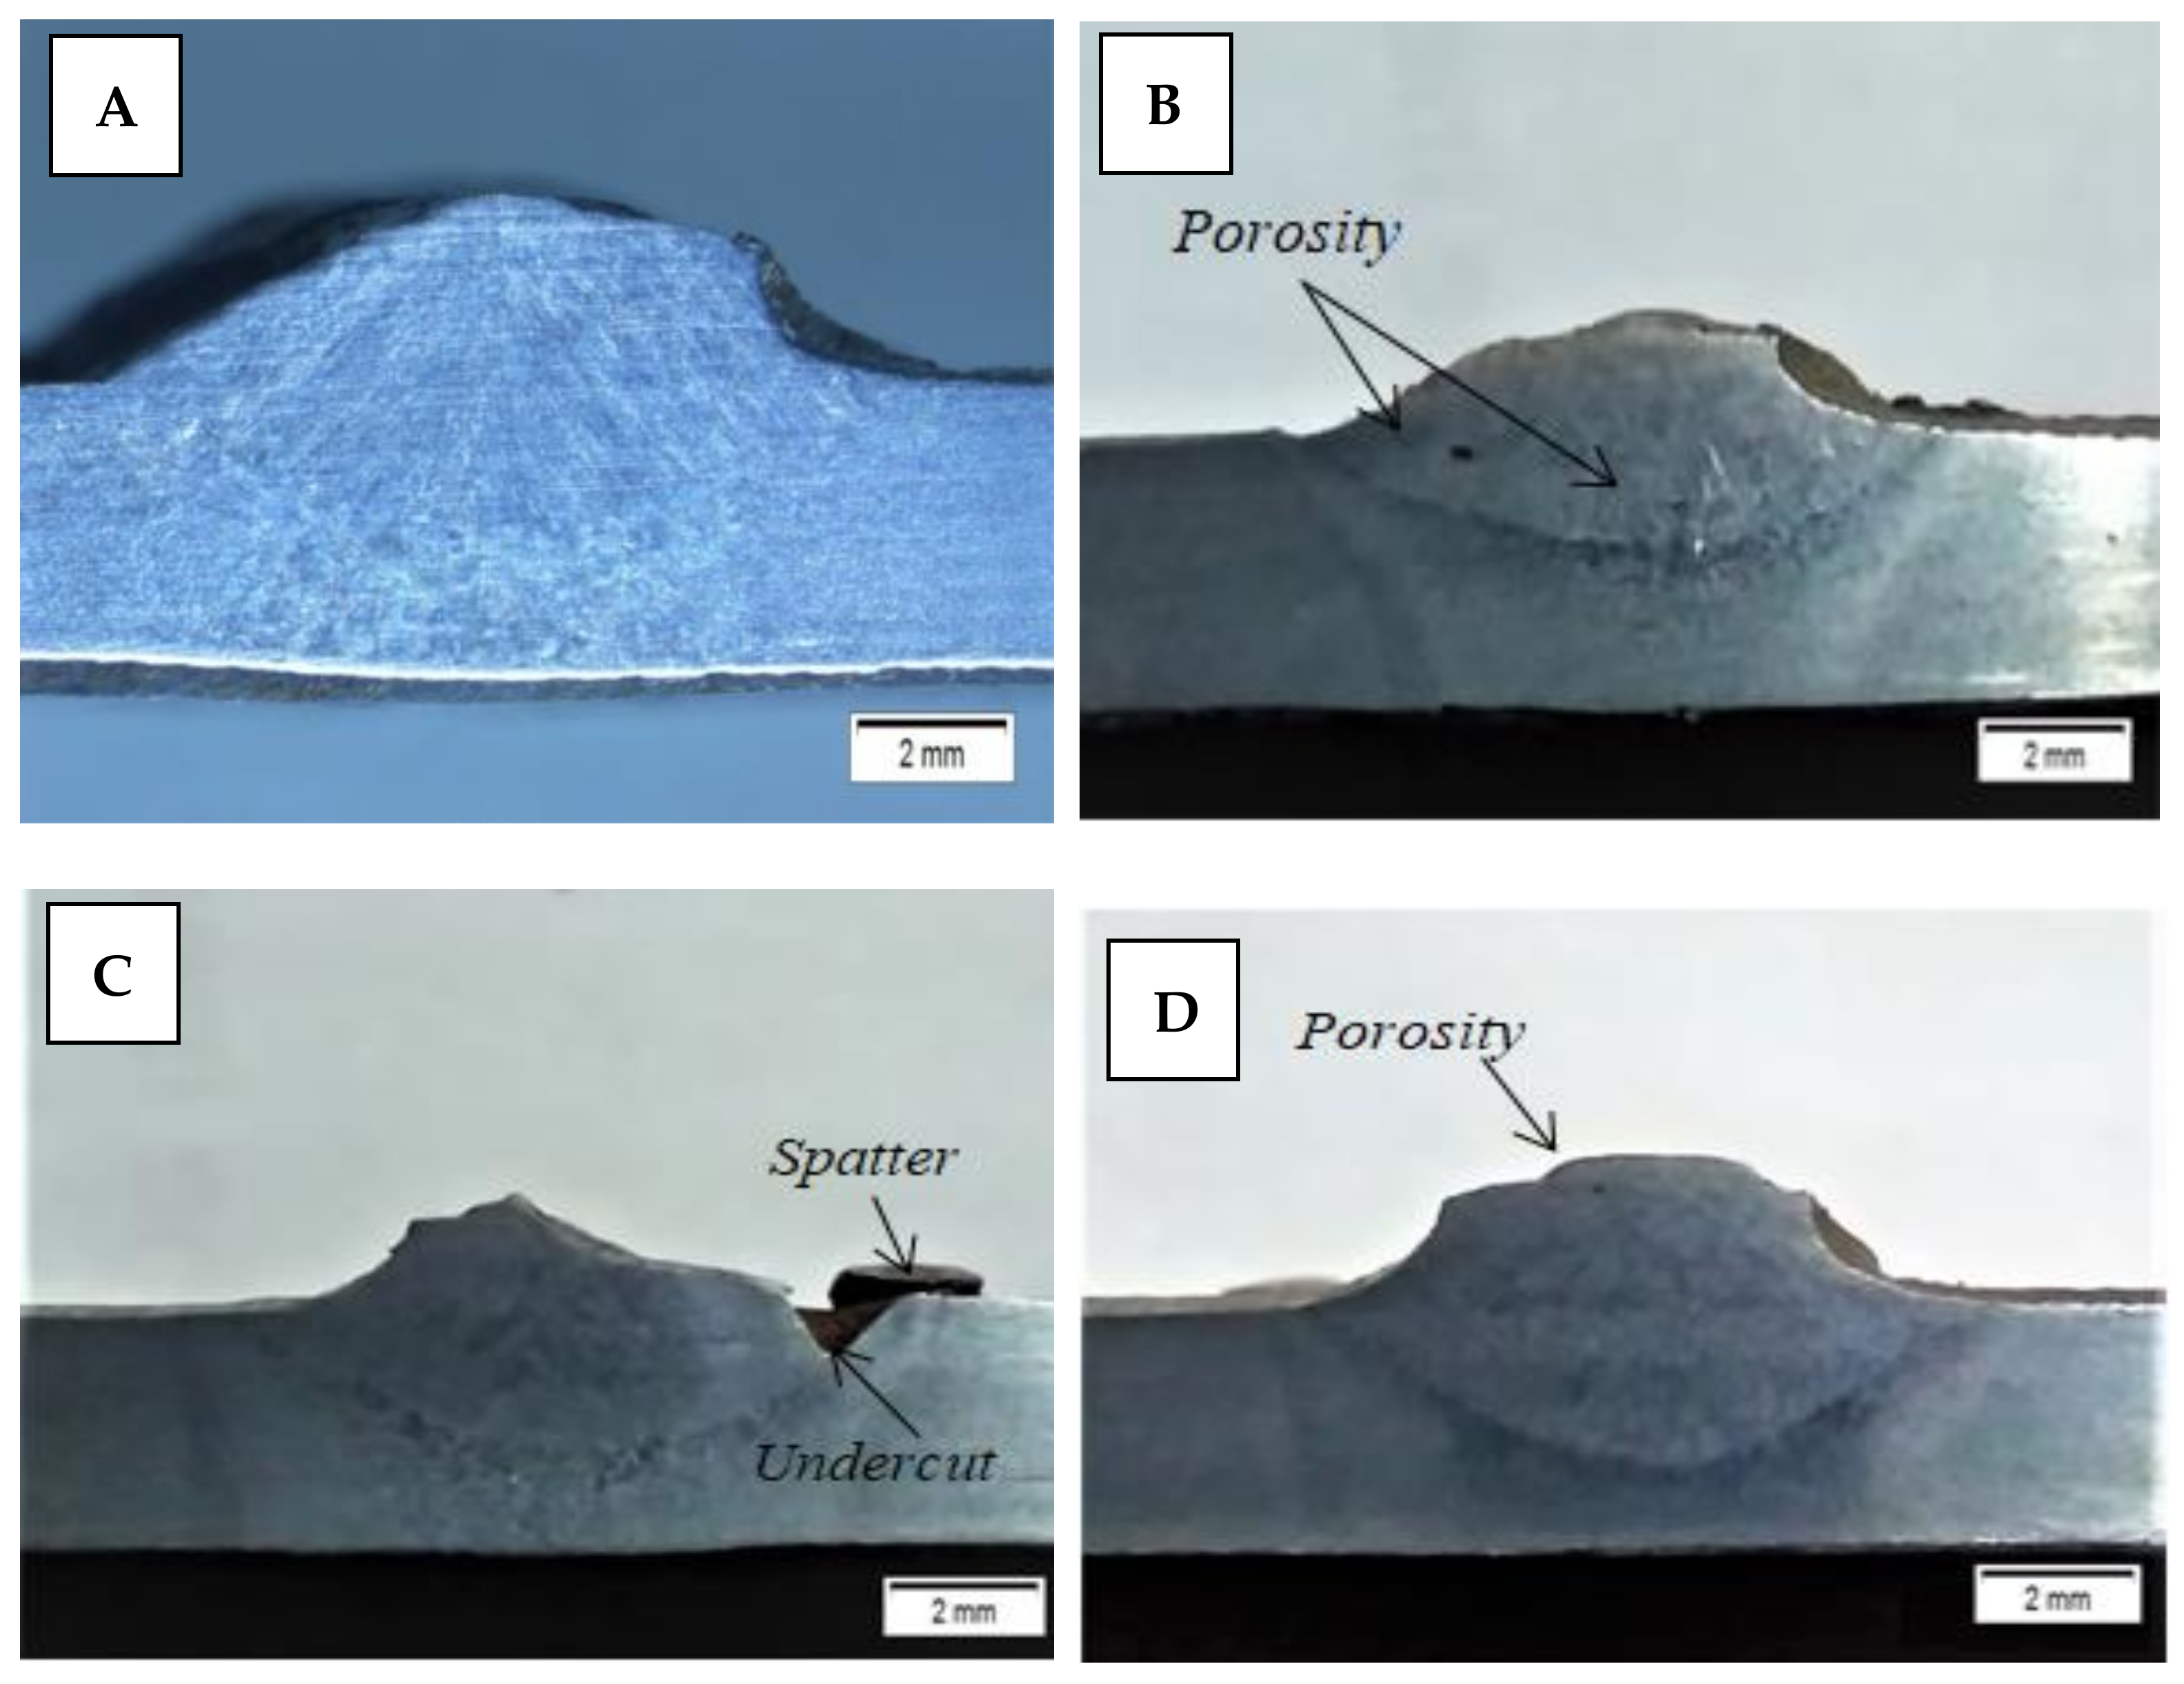
3.1.1. Bead Defects Observation

The underwater welding process is very susceptible to welding defects. This is due to the cooling rate and water flow rate, which are always changing in the welding environment [14]. Therefore, it is necessary to observe the underwater welding results of experts in compliance with EN ISO 5817. Figure 4 shows the results of visually identifying defects in dry and underwater welding. Based on visual observation of the underwater welding results, various kinds of defects in the welded joint occur in wet underwater welding conditions. The defects that occur include spatter (S), porosity (P), undercut (U), concavity (V), irregular surface (Z), and underfilled (F) [15].
Table 3 shows the various types of defect identification, the number of defects, and the largest dimensions of the defect in each specimen measured on a plate with an area of 400 mm × 300 m. Welding on land has the most spatter defects of all specimens. Slow cooling also causes the spatter to solidify in the base metal and makes it difficult to remove. The decrease in the amount of spatter in underwater welding is caused by low welding arc temperature due to forced convection during the welding process, which results in less molten metal spatter. This difference is caused by flow turbulence due to the random direction of the water flow, which is not uniform, carrying droplets during the welding process and propagating them following the random and opposite flow of water from the welding direction [16].
Underfilled welding defect is found in specimens from welding on land. This defect arises from the specimen surface of the base metal not being filled with weld metal, because the distribution of the weld metal is not even, resulting in an empty and unfilled weld pool area [15]. The lack of filling in the grooves in the base metal during the welding process is caused by the welding speed being too fast or by electrode changes during the welding process.
Wet underwater welding is very susceptible to the formation of porosity defects as shown in Figure 4B–D. Porosity defects are caused by gas bubbles that arise from water dissociation due to direct contact with the welding arc during the welding process. This results in the breakdown of hydrogen gas, which is trapped in the weld metal because it does not have time to escape due to the fast cooling and solidification rate of the weld metal [14,17,18]. Random water flow and increasing flow rate can cause an increase in the number and size of the weld porosity [19]. Table 3 shows the difference in the largest number and size of porosity that occurs in underwater welding. Underwater welding without flow has the least porosity compared to welding with non-uniform flow with baffle, which has more porosity, and non-uniform flow without baffle, which has the most porosity. This indicates that the increased water flow rate increases the amount of porosity in the underwater welding specimen weld metal.
Undercut defects in underwater welding can occur due to a decrease in arc temperature by heat dissipation and arc shrinkage [4,18]. According to Nguyen et al., shrinkage of the weld arc will cause an imbalance in the metal transfer process and the formation of a weld pool vortex, so that the heat transfer process does not occur properly and causes undercut defects and burn through [20]. The existence of the flow rate in underwater welding will further reduce the arc temperature and arc shrinkage and increase the current density, thereby exacerbating undercut defects [18,20,21]. If the undercut defect is not removed, it can interfere with the mechanical properties of the welding result [20].

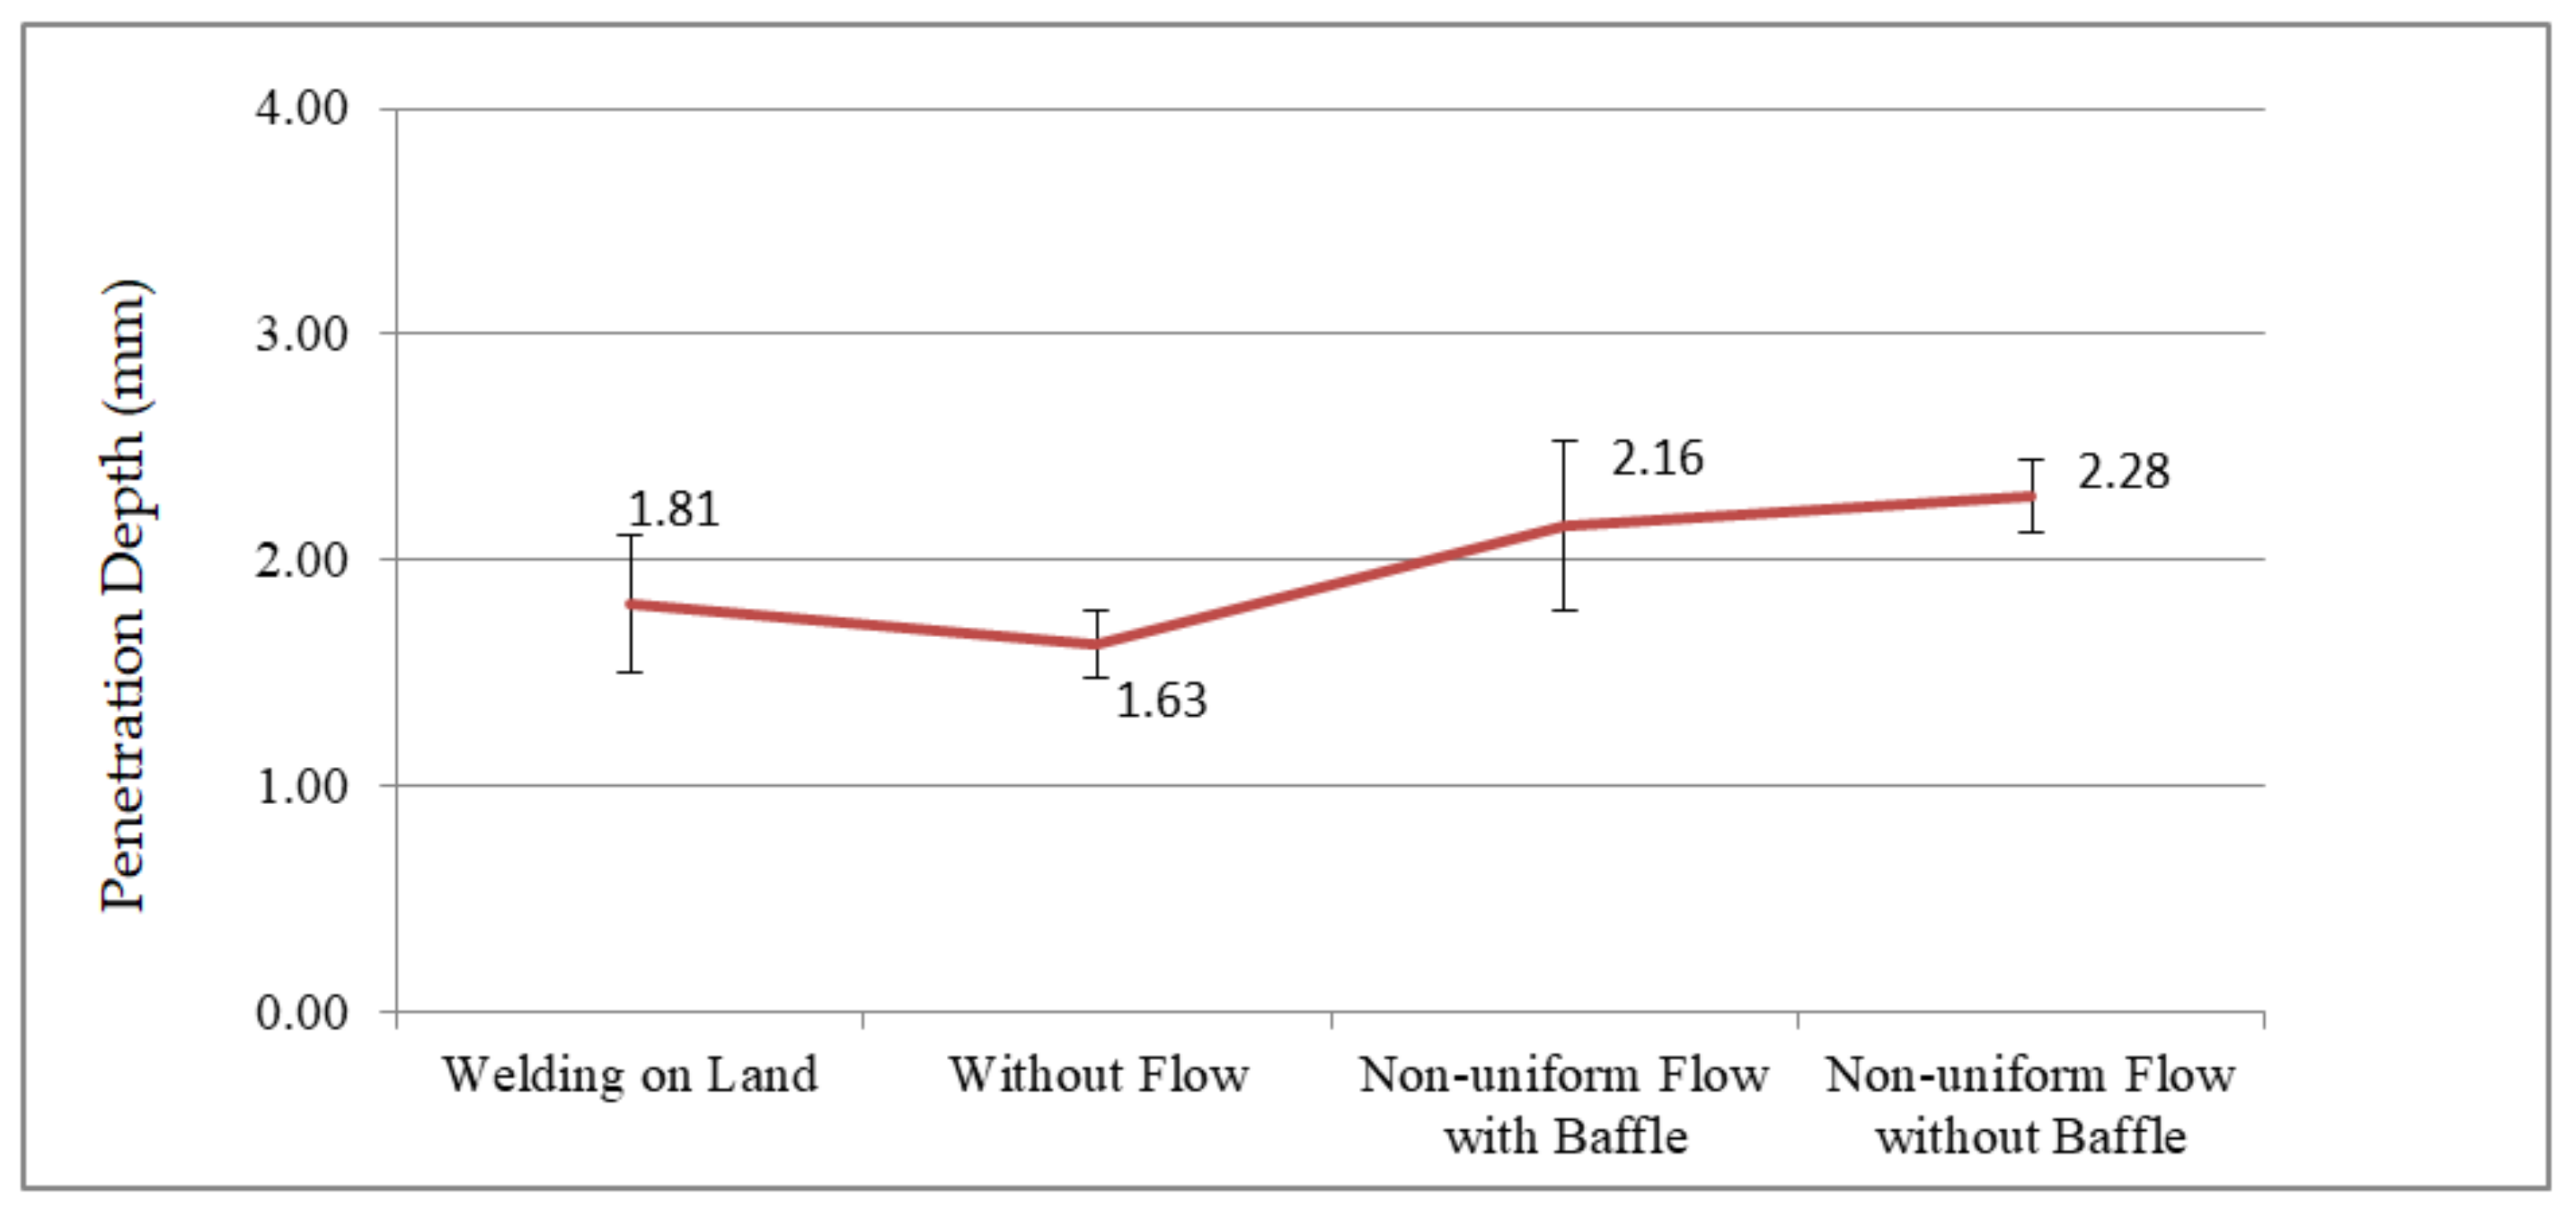
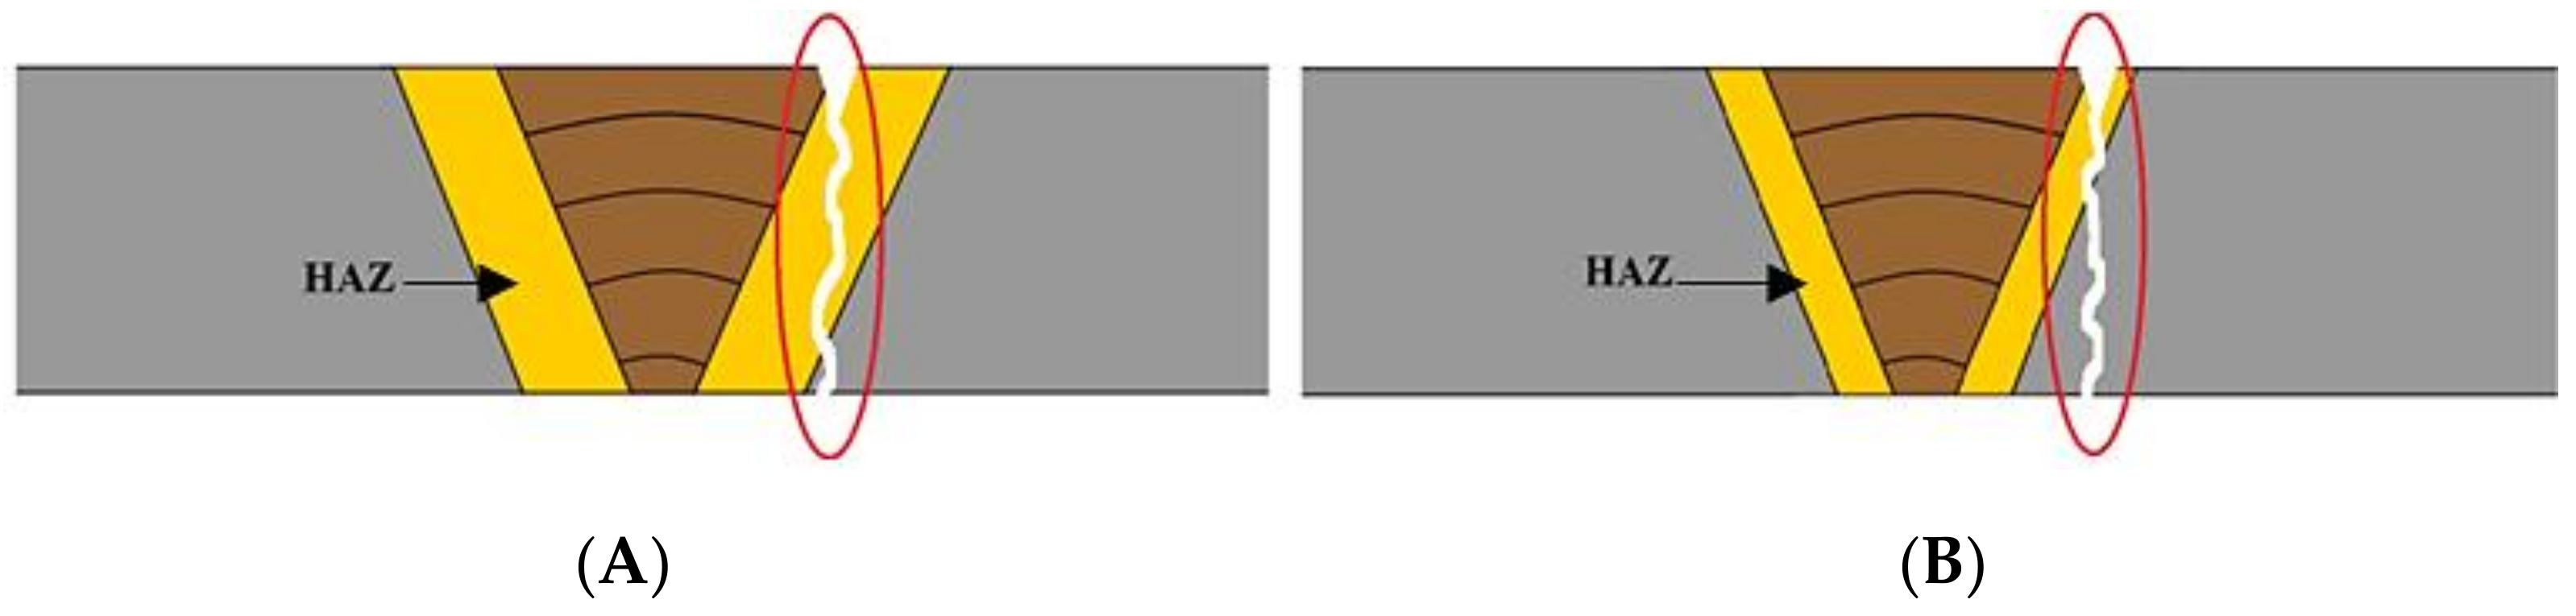
3.1.2. Weld Penetration

The results of measuring the penetration depth of the weld metal are shown in Figure 5, proving that the water flow in the welding process affects the penetration of the weld metal. The depth of penetration in welding on land specimens is higher than underwater welding specimens without flow for several reasons. The emergence of heat loss in the welding arc due to convection by water and shrinkage of the welding arc due to hydrostatic pressure will interfere with the penetration process, and the formation of a weld pool on the base metal results in sub-optimal penetration of the underwater welding specimen without flow [4,20,22].
Increased penetration occurs in underwater welding specimens that are welded using water flows in the opposite direction to the welding direction (upstream). The increase in penetration is due to the water flow rate, which reduces the droplet size of the weld metal but increases the transition frequency of the fallen metal. The liquid droplet from the weld metal collects and increases the pressure on the base metal surface because the droplets are pushed by the water flow opposite the welding direction toward the back of the electrode [4].
The weld penetration of the welding on land specimens has an average depth of 1.8 mm. Underwater welding without flow produces the shallowest penetration depth of 1.6 mm. The depth of penetration in wet underwater welding with non-uniform flow with baffle is 2.16 mm. Specimens with non-uniform flow without baffle have the deepest penetration depth of 2.28 mm. A graph comparing the penetrative depth of the four specimens is presented in Figure 6.
Greater movement and flow rates have a greater heat transfer capability. The ability of the flow to transmit heat better causes the heat loss to be greater, thus reducing the heat received by the base metal [4]. Heat loss will interfere with arc penetration in underwater welding conditions without flow and downstream welding as evidenced by the shallower penetration, but the increasing heat loss along with the increasing water flow rate in upstream welding will increase the weld current density and decrease the arc, concentrating the heat. The increasing of the welding current density and heat concentrated in the arc will increase weld penetration [4,19].

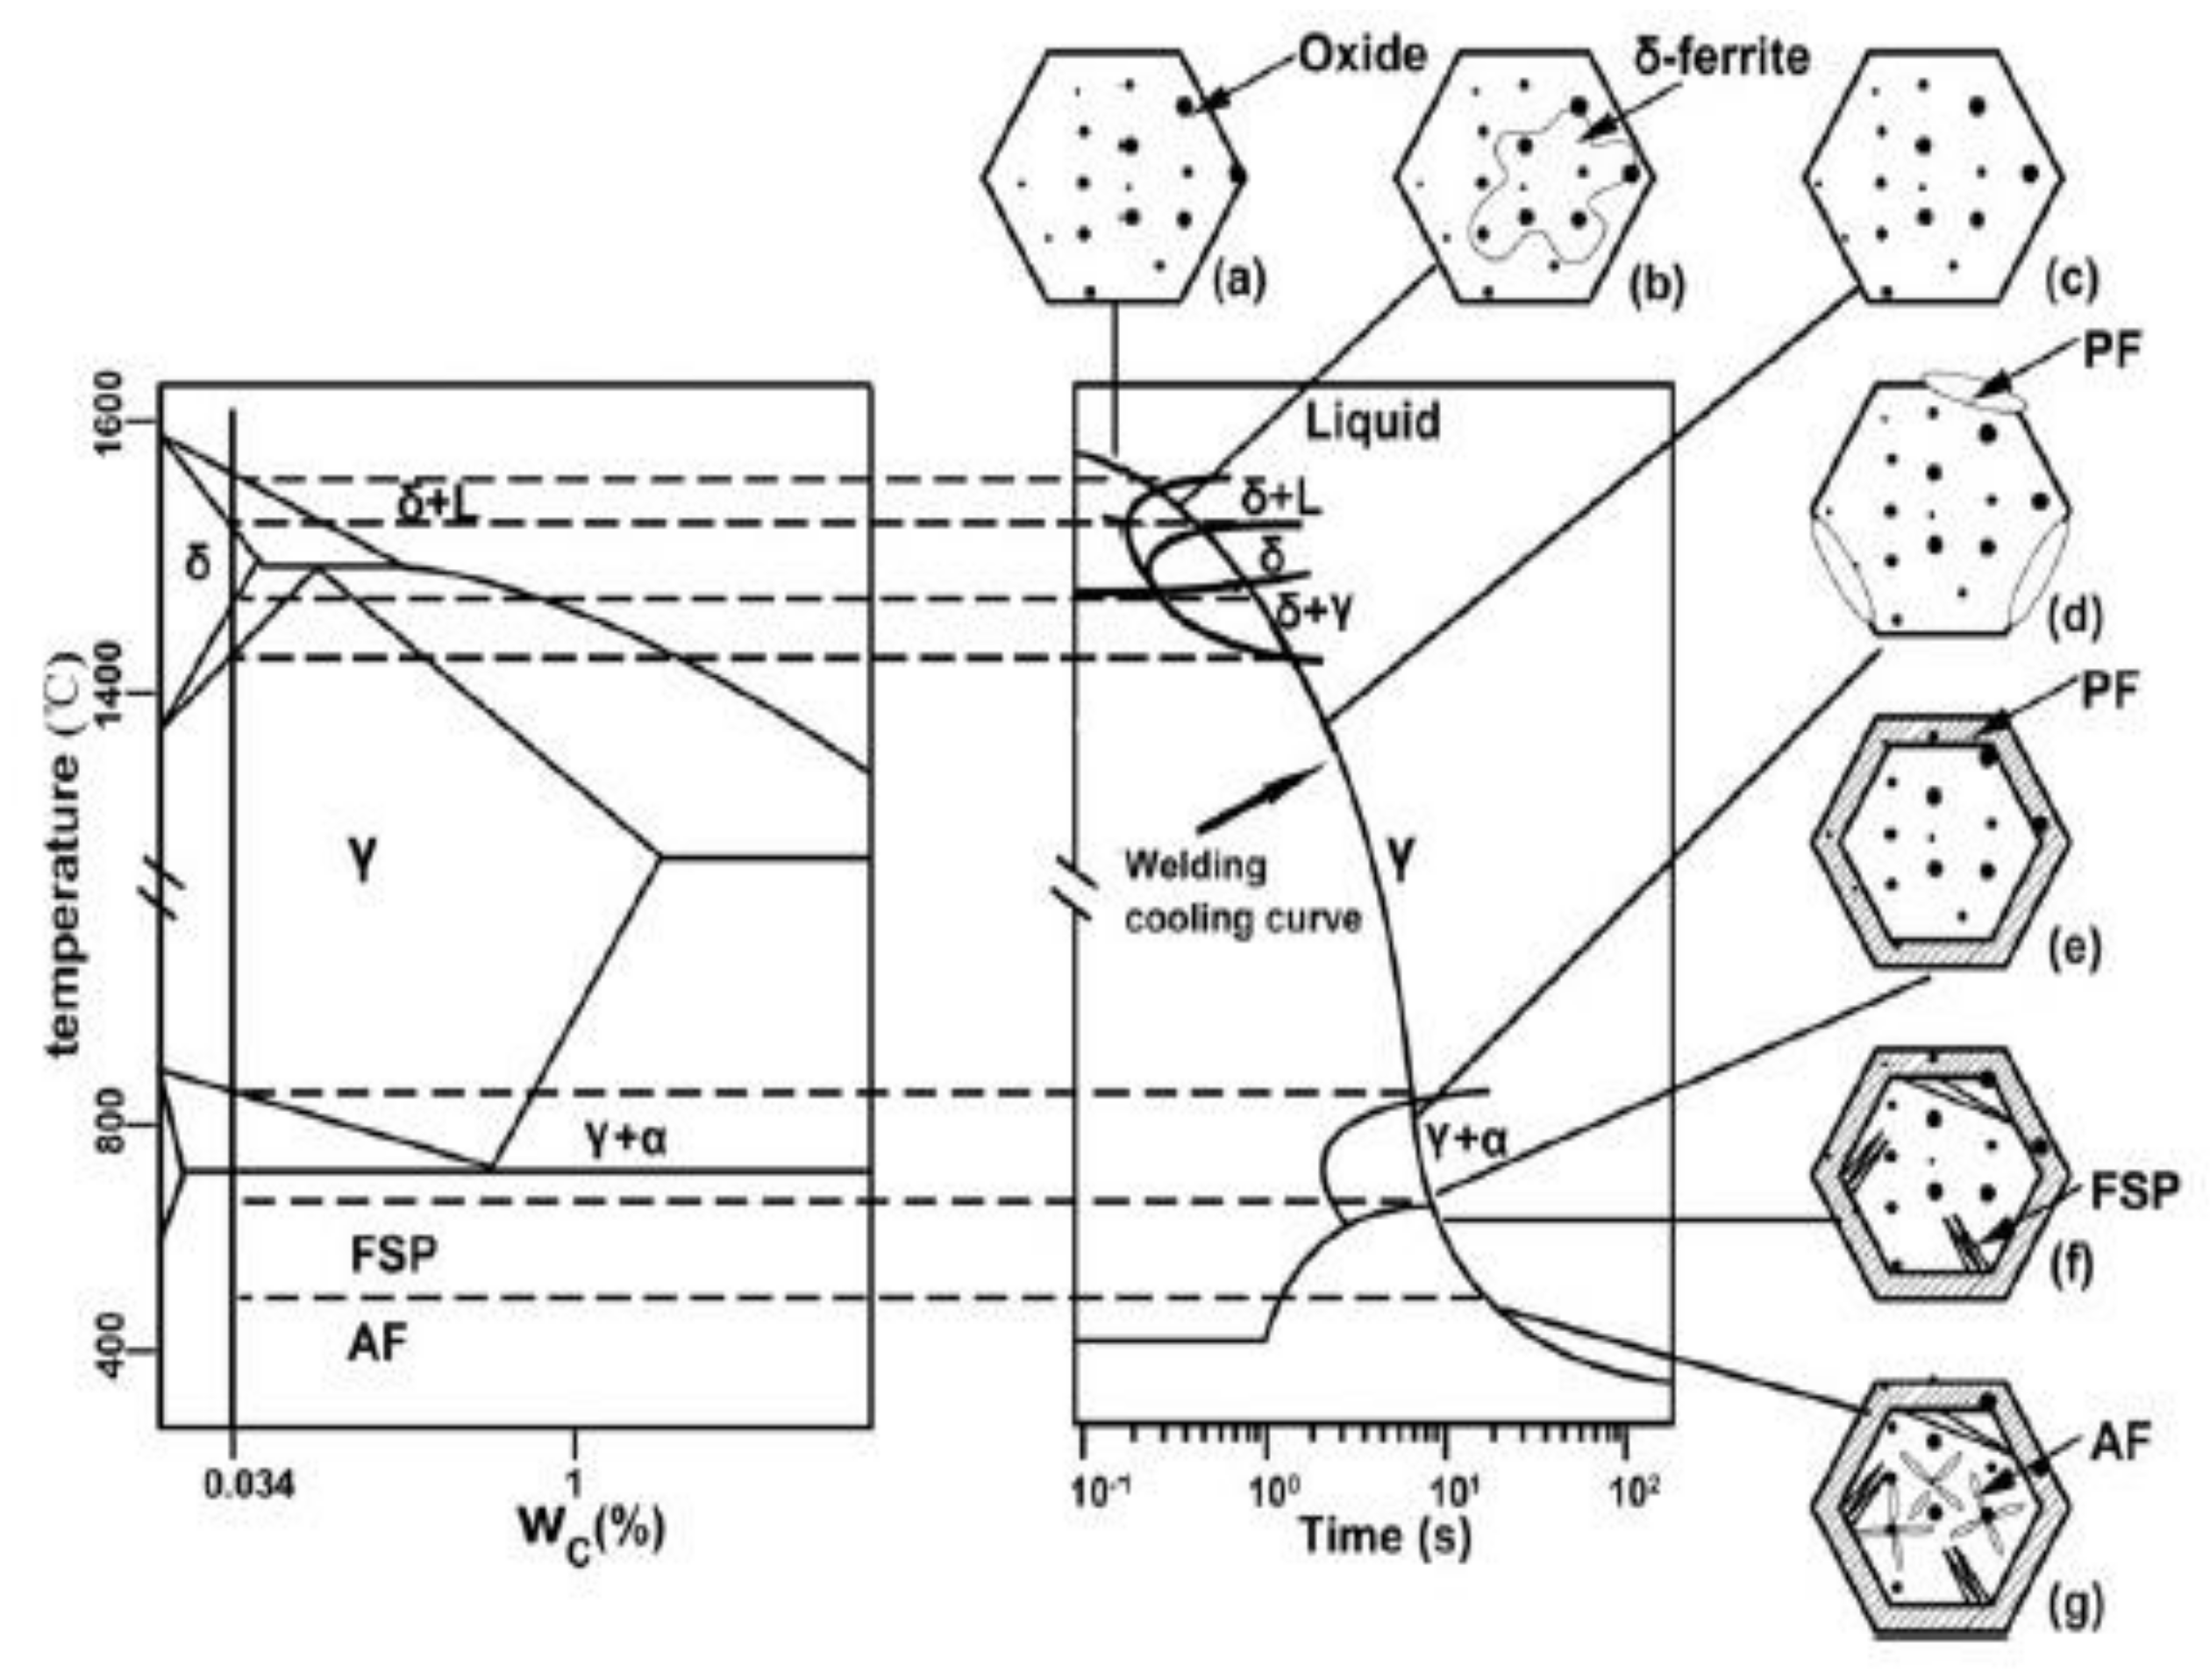
3.1.3. Microstructure

Weld metal in welding on land has three types of mixture: grain boundary ferrite (GBF), ferrite with second phase (FSP), and polygonal ferrite (PF). The microstructure of weld metal in underwater welding is almost the same as in welding on land but with the addition of the appearance of the acicular ferrite (AF) structure.
The weld pool region is heated to temperatures as high as 1900–1600 °C (Figure 7a), the dissolved oxygen and deoxidizing elements in liquid steel react to form complex oxide inclusions. In the temperature range 1530–1400 °C (Figure 7b), solidification to δ-ferrite starts and envelops these oxide inclusions; and this δ-ferrite transforms to austenite. The PF structure is nucleates at the prior γ–γ boundaries and grows by a diffusional mechanism and eventual coverage of these boundaries at a temperature of 850–680 °C (Figure 7d,e) after the formation of austenite at a temperature of 1400 to 850 °C (Figure 7c). GBF is formed at a temperature of 1000–650 °C along the grain boundaries of the austenite and will be the formation site for the FSP core, which is formed at a temperature of 700–550 °C (Figure 7f). This explains why the FSP is always close to the GBF. Further cooling to around 500 °C (Figure 7g), the acicular ferrite would nucleate on the inclusions located in the austenite grain interiors and grow in needle form. Table 4 shows that the appearance of PF and GBF structures, which are larger and more dominant than wet underwater welding. This is because the heat input received by the welding on land is relatively large, so that the grain size increases and the relative amount of FSP and AF decreases with increasing GBF and PF [17,23,24]. The HAZ and weld metal photo of every variation was taken in a fine grain area.
Each phase in the weld metal area has different mechanical properties. AF structures have higher tensile strength and hardness than GBF and PF structures. The FSP phase has the same tensile strength as the AF structure but with lower ductility [17,25].
The microstructure of underwater weld metal shows the presence of AF which is formed at a temperature of 600–400 °C, with a fast cooling rate as shown in the CCT diagram in Figure 7. Underwater welding has water-cooled media, and the heat input received by the specimen is relatively small, which will make the cooling rate even higher, thus increasing AF formation. The high cooling rate in underwater welding results in GBF and PF structures that are flattened and smaller compared to those for welding on land structures [17]. This is in accordance with the observation results shown in Table 4.
Non-uniform flow underwater welding with or without baffle has the smallest GBF and PF compared to other weld specimens because of the flow rate which makes the cooling rate increase. This structural observation is adjusted to the CCT (continuous cooling transformation) diagram according to the carbon content of the steel used. Figure 7 shows a diagram of the CCT phase transformation of the electrode with a C content of 0.09% [26]. Calculation of the cooling rate ∆t8/5 in underwater welding was performed by using the equation from Di et al. and Wengbin et al., which has been validated by experiments and simulations.
The microstructure of the HAZ in both underwater and welding on land contained ferrite and pearlite, as shown in Table 4. The microstructure of HAZ is almost the same as that of the base metal but has different grain sizes and concentrations. Welding on land has a more dominant ferrite concentration than pearlite, as in the base metal structure, whereas in underwater welding the dominance of ferrite is reduced and pearlite appears more, resulting in an increased hardness value. The underwater welding process also makes the grain structure of the HAZ smaller, smoother, and denser. The smallest grains are found in wet underwater welding with non-uniform flow without baffle of 5–10 μm, while the microstructure of welding on land has a much larger grain size of 20–30 μm. Increasing the turbulence in water flow and the water flow rate will increase the heat transfer ability of water, so that the cooling rate will be even greater [15]. An increased cooling rate causes disturbance in grain growth, so that the grain size in the HAZ area of underwater welding is much smaller than in welding on land [11].

3.2. Mechanical Properties

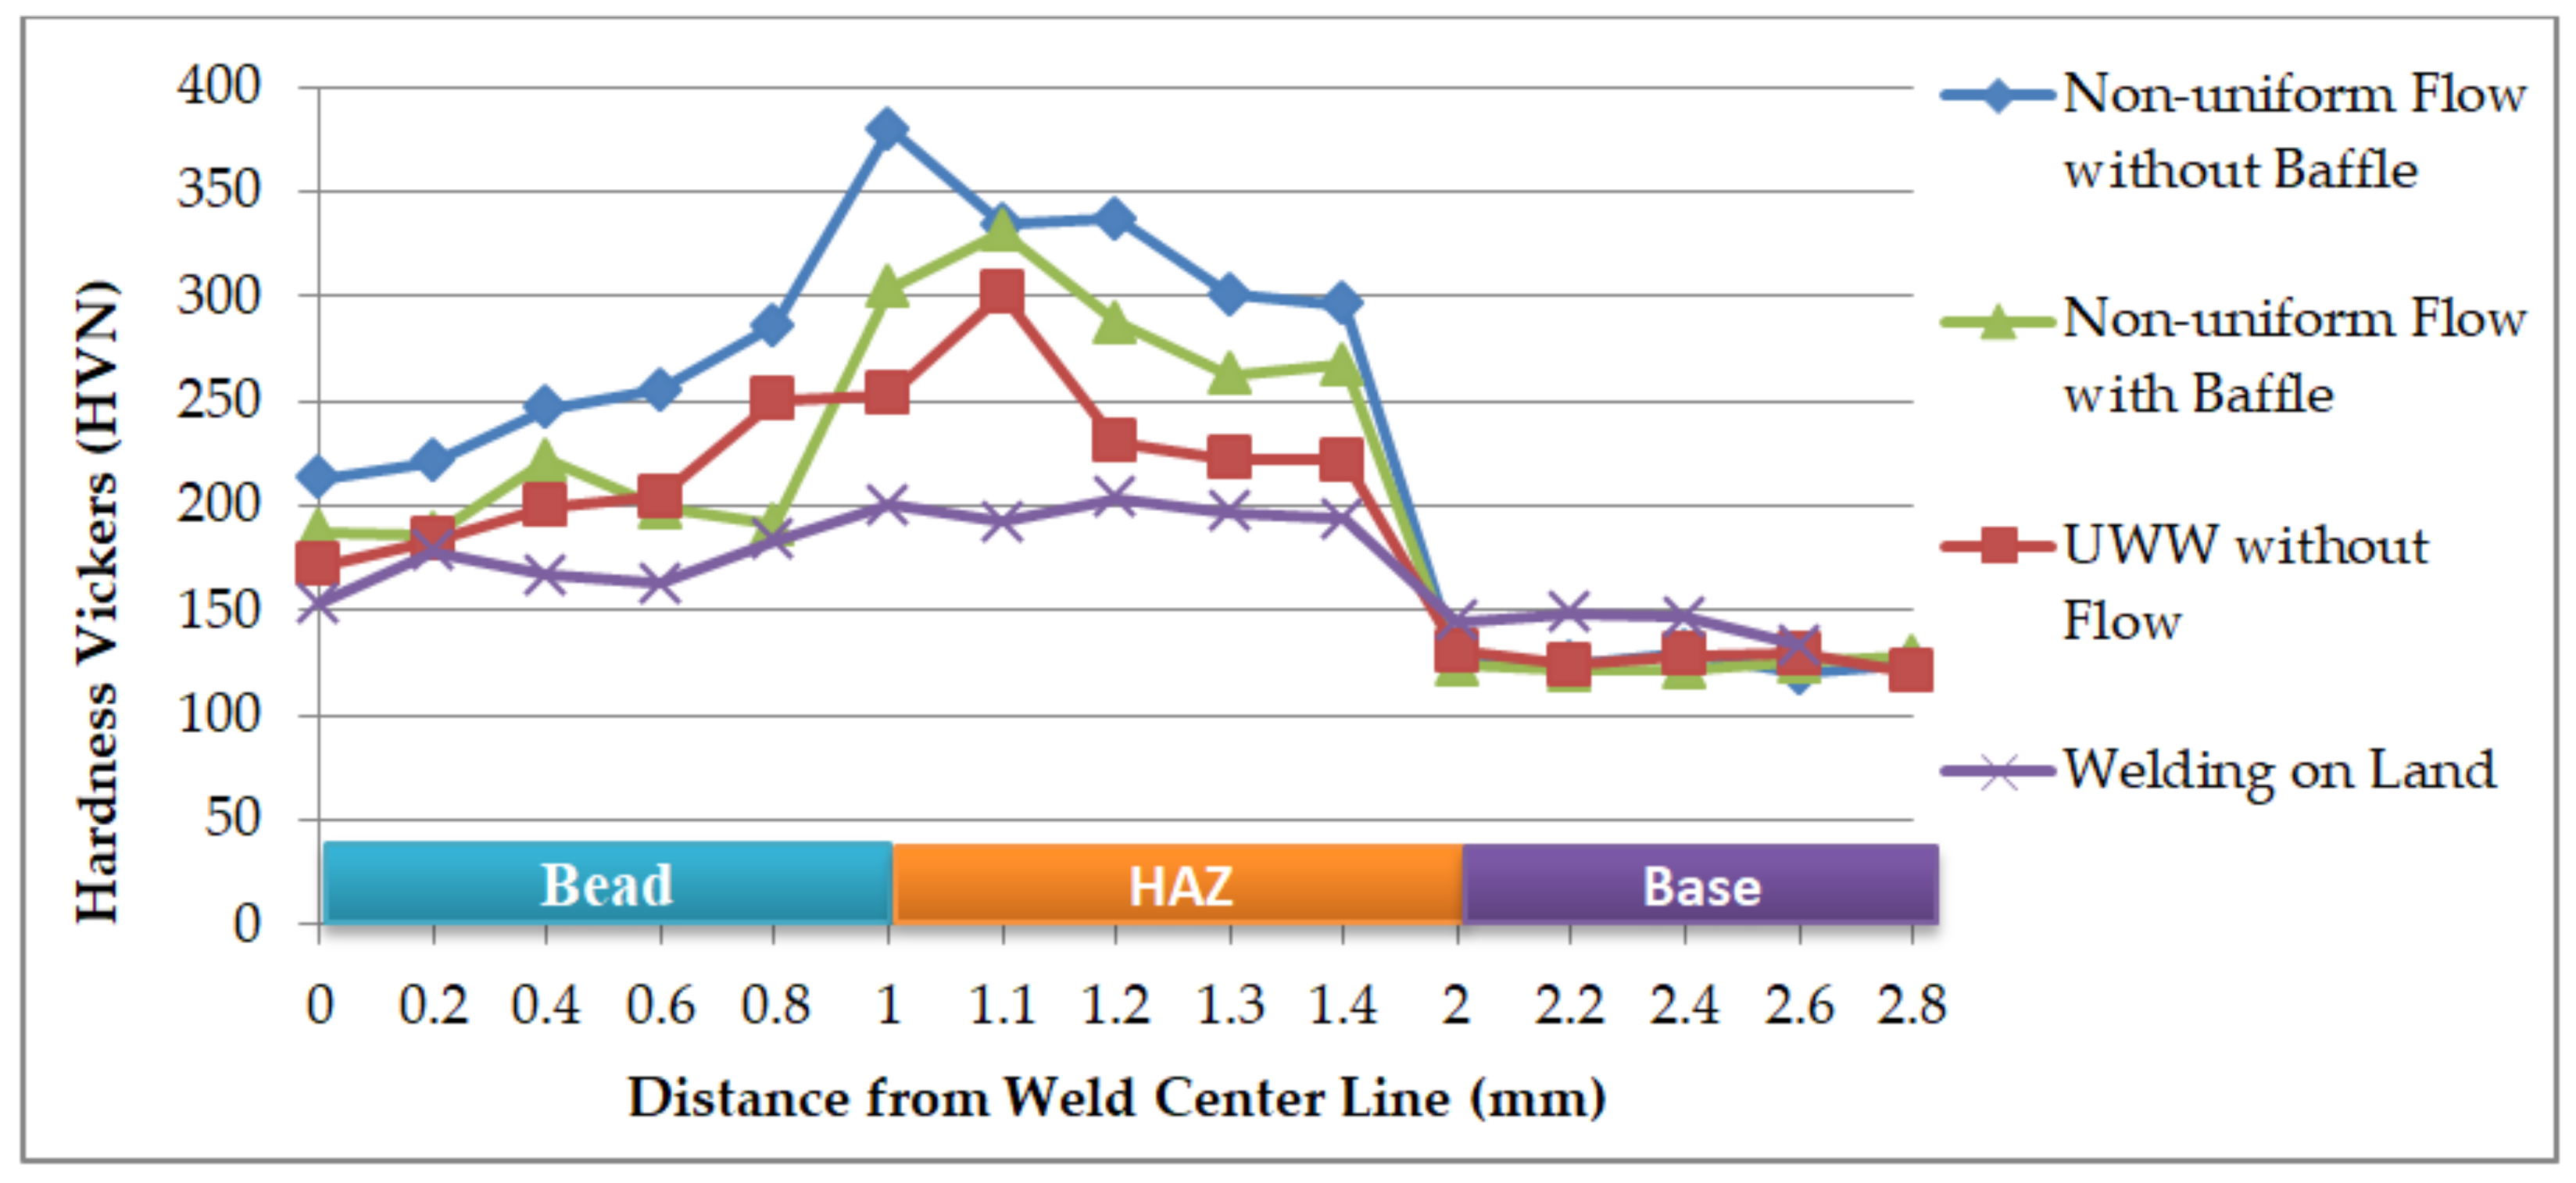
3.2.1. Vickers Microhardness

The hardness profile of the welded joint generally increases from the weld metal to the HAZ and then decreases sharply to the base metal [17]. The lowest hardness value is found in welding on land, with a value of 176 HV for weld metal, 204 HV HAZ area, and 149 HV in base metal. The wet underwater welding specimen with non-uniform flow without baffle has the highest hardness of the four other variations, the value of the weld metal is 287 HV, the HAZ area is 424 HV, and the base metal is 144 HV. The hardness value in wet underwater welding without flow has the lowest hardness compared to other underwater welds, with the highest hardness at 204 HV for weld metal, 304 HV in HAZ area, and 132 HV in base metal. The hardness value in wet underwater welding with non-uniform flow with baffle includes 331 HV weld metal, 340 HV HAZ area, and 138 HV base metal. The results of the Vickers test of four welding variations are shown in Figure 8.
The diagram in Figure 8 shows that the weld metal of non-uniform flow underwater welding without baffle has the highest hardness of the weld metal specimens, although it also has the highest number of porosity defects. Meanwhile, the hardness value in dry weld metal is the lowest, although there is no porosity defect. This is due to the predominance of AF in the microstructure of the underwater weld [17]. The increase in the cooling rate causes the growth of AF and FSP to also increase [24]. Without-flow underwater weld metal has the lowest hardness of the underwater welding groups. This condition is caused by porosity defects, large and rough GBF, and less AF dominance. The hardness of the weld metal in non-uniform flow with baffle underwater welding has the second highest hardness value due to the dominance of AF and the finer GBF structure of the underwater welding without flow.

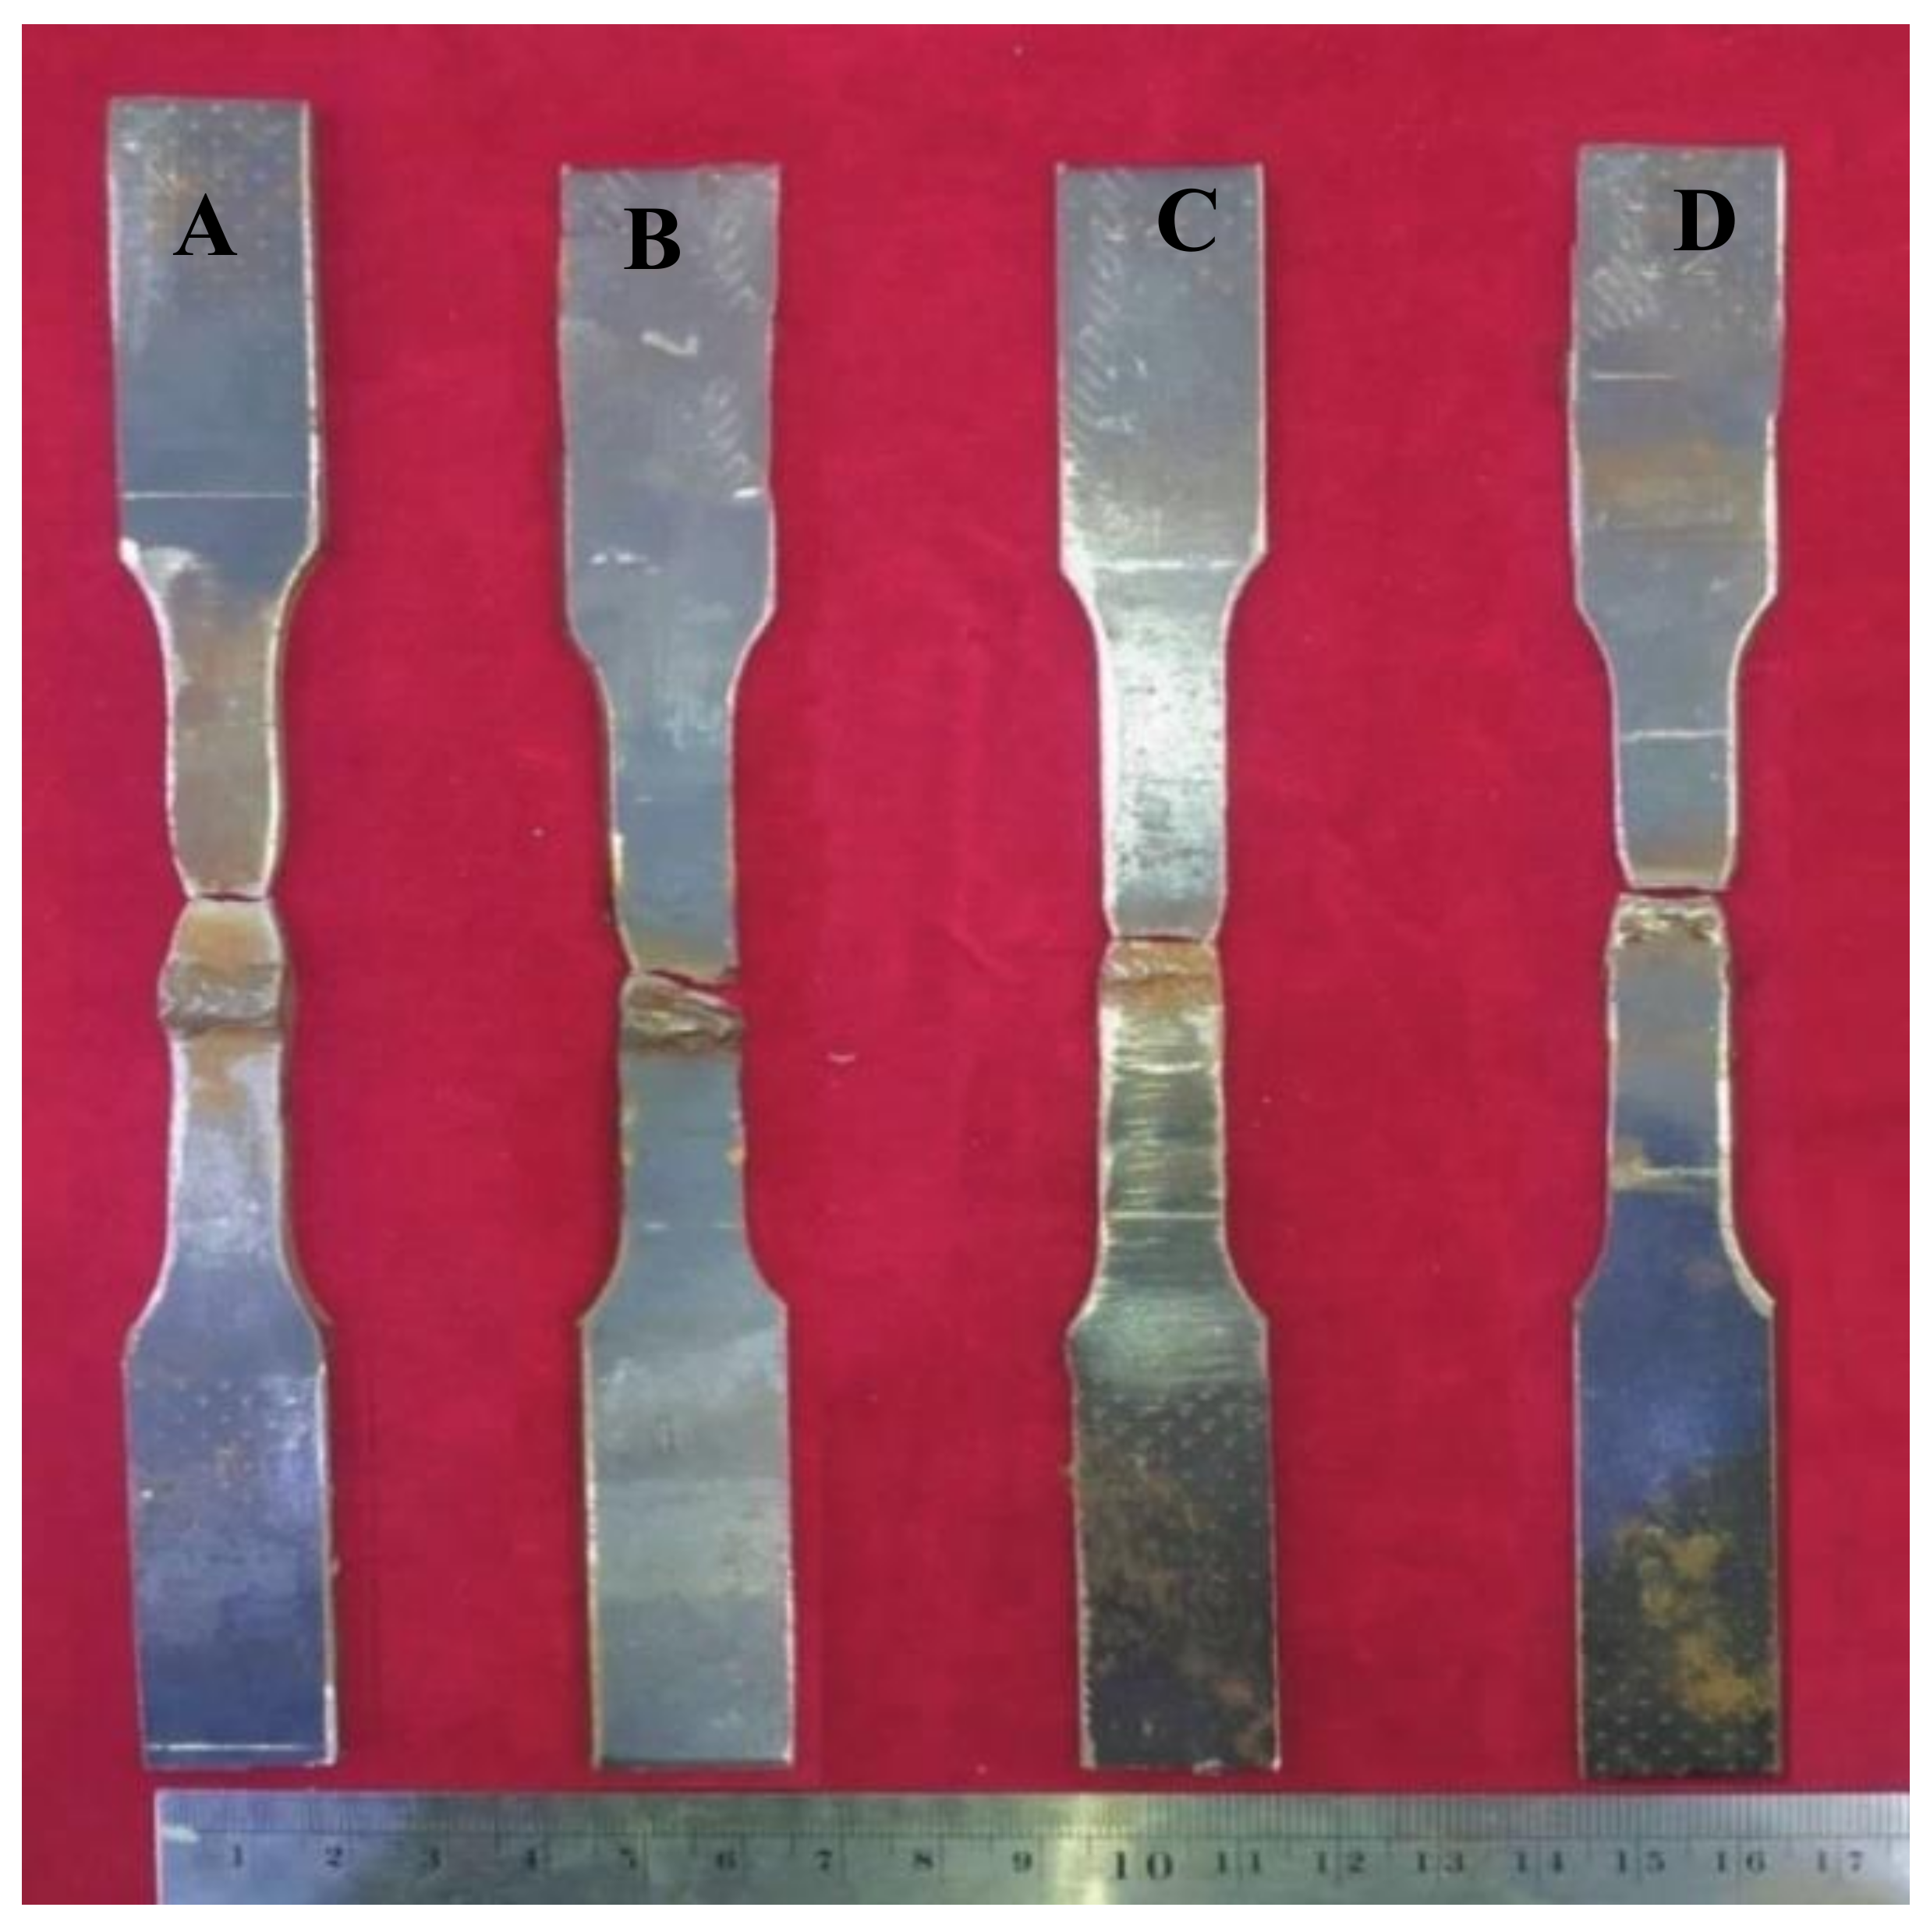
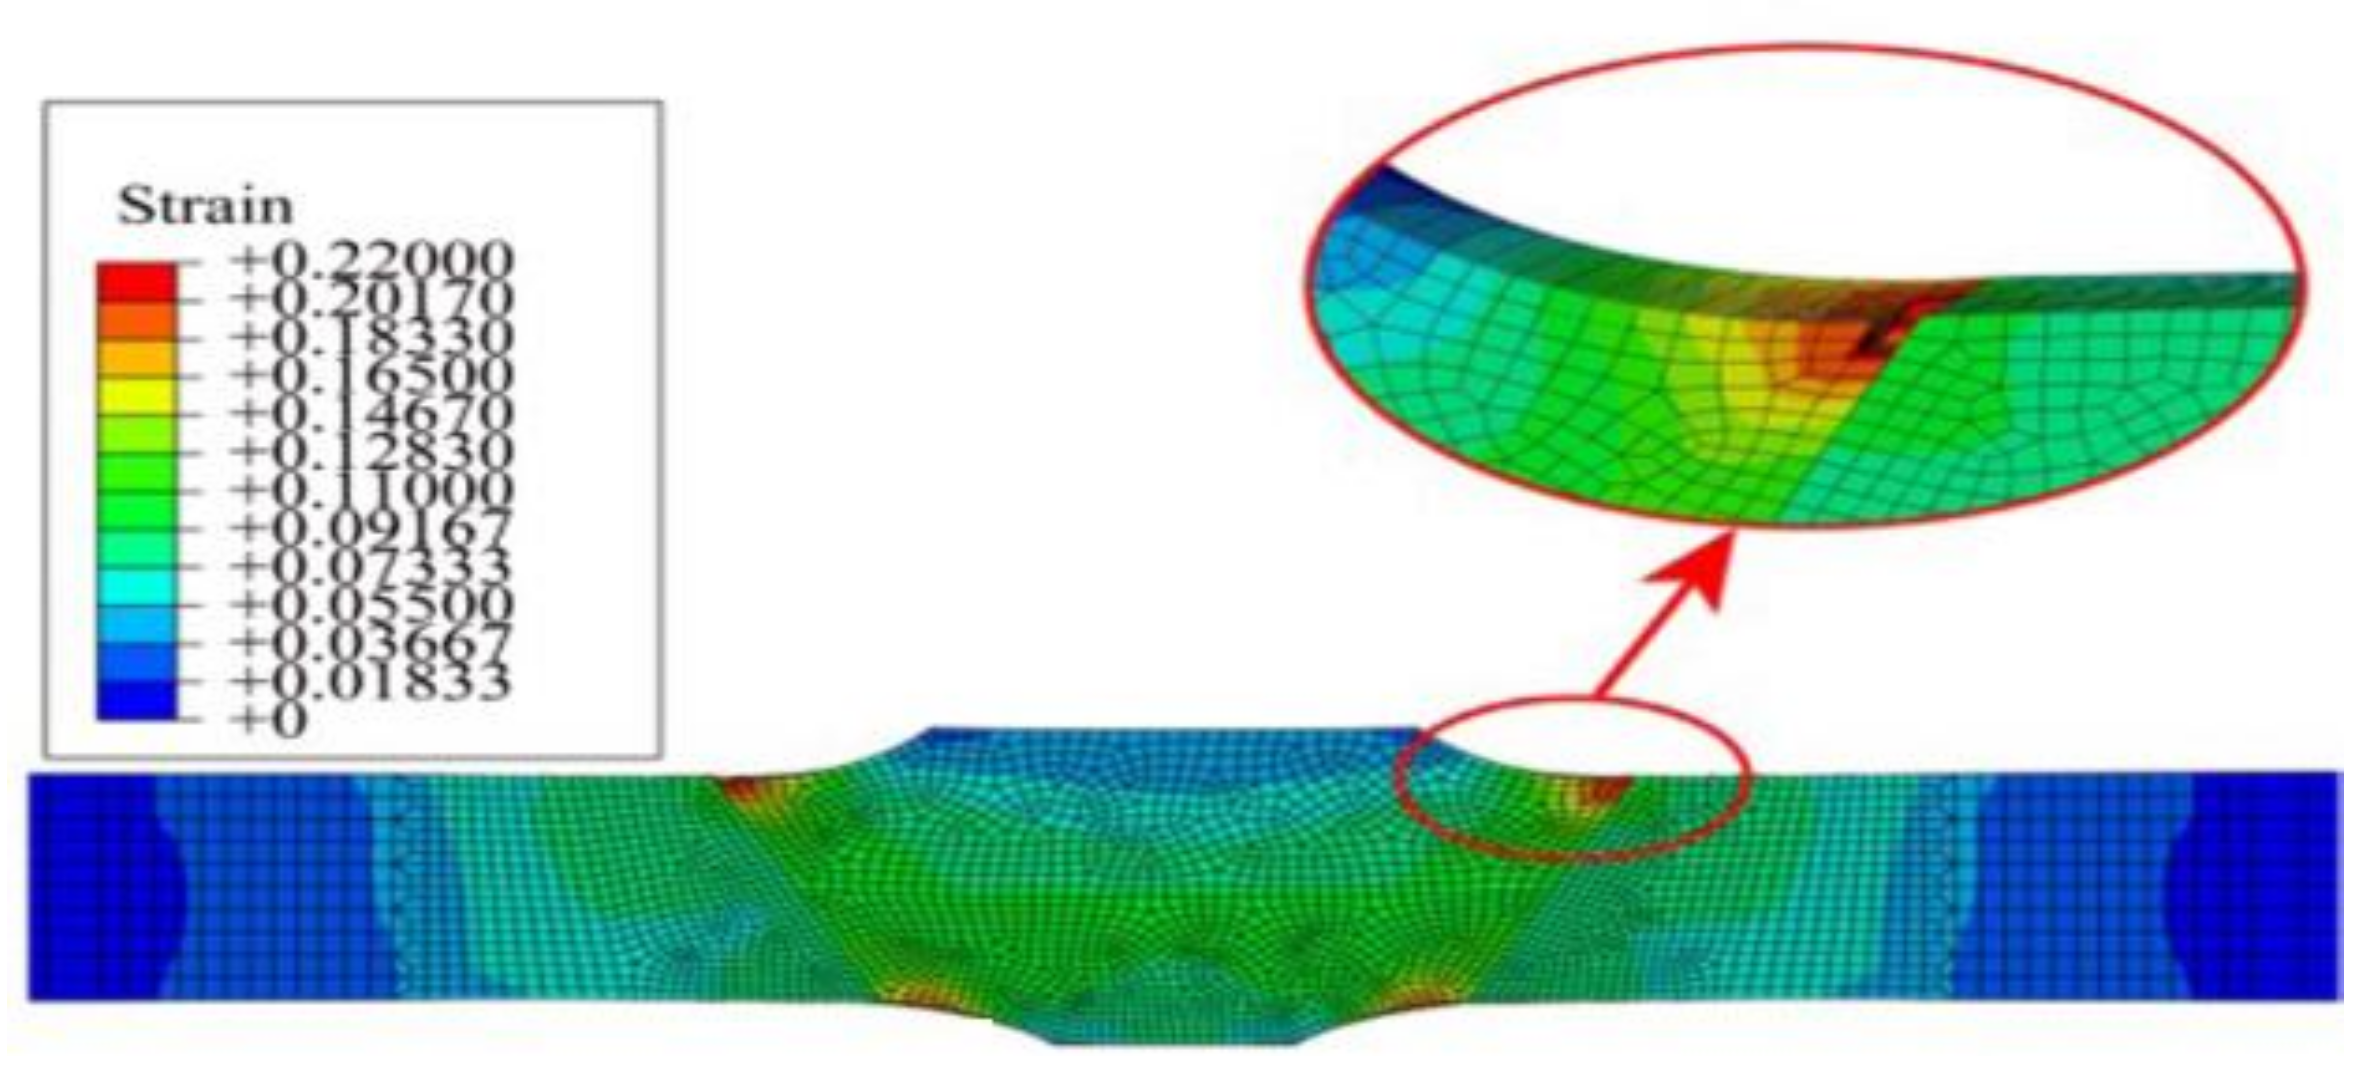
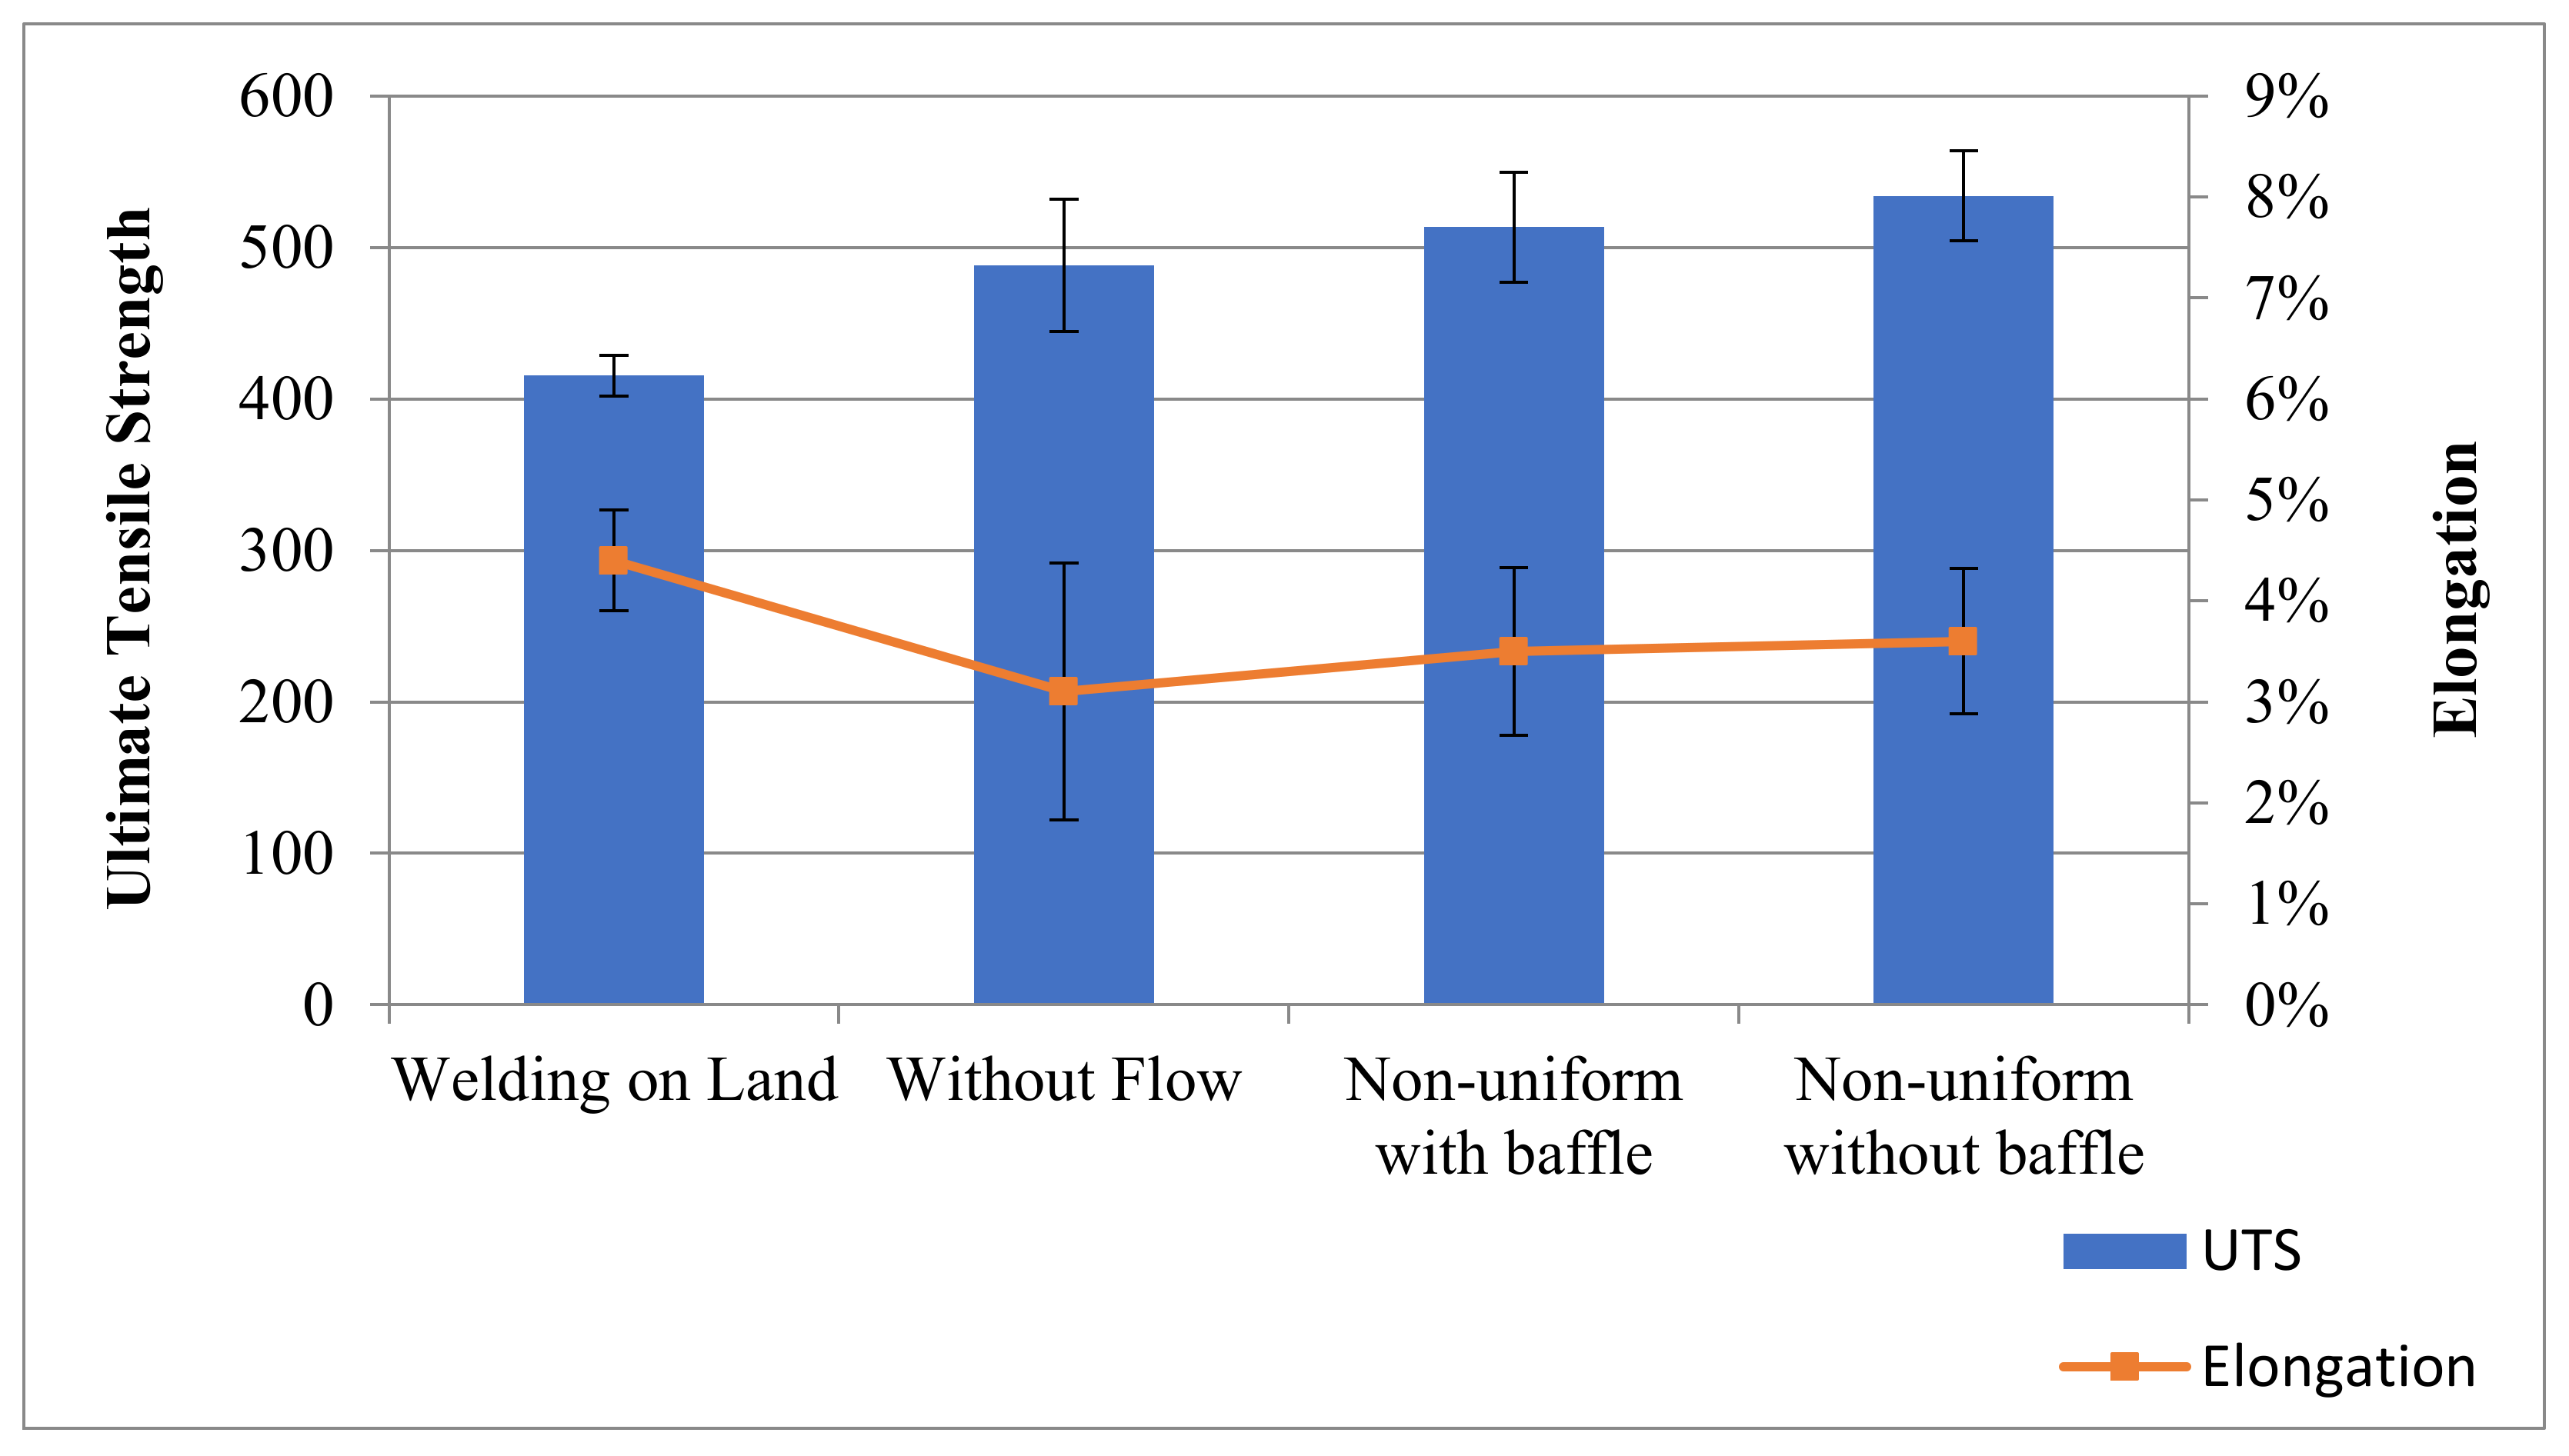
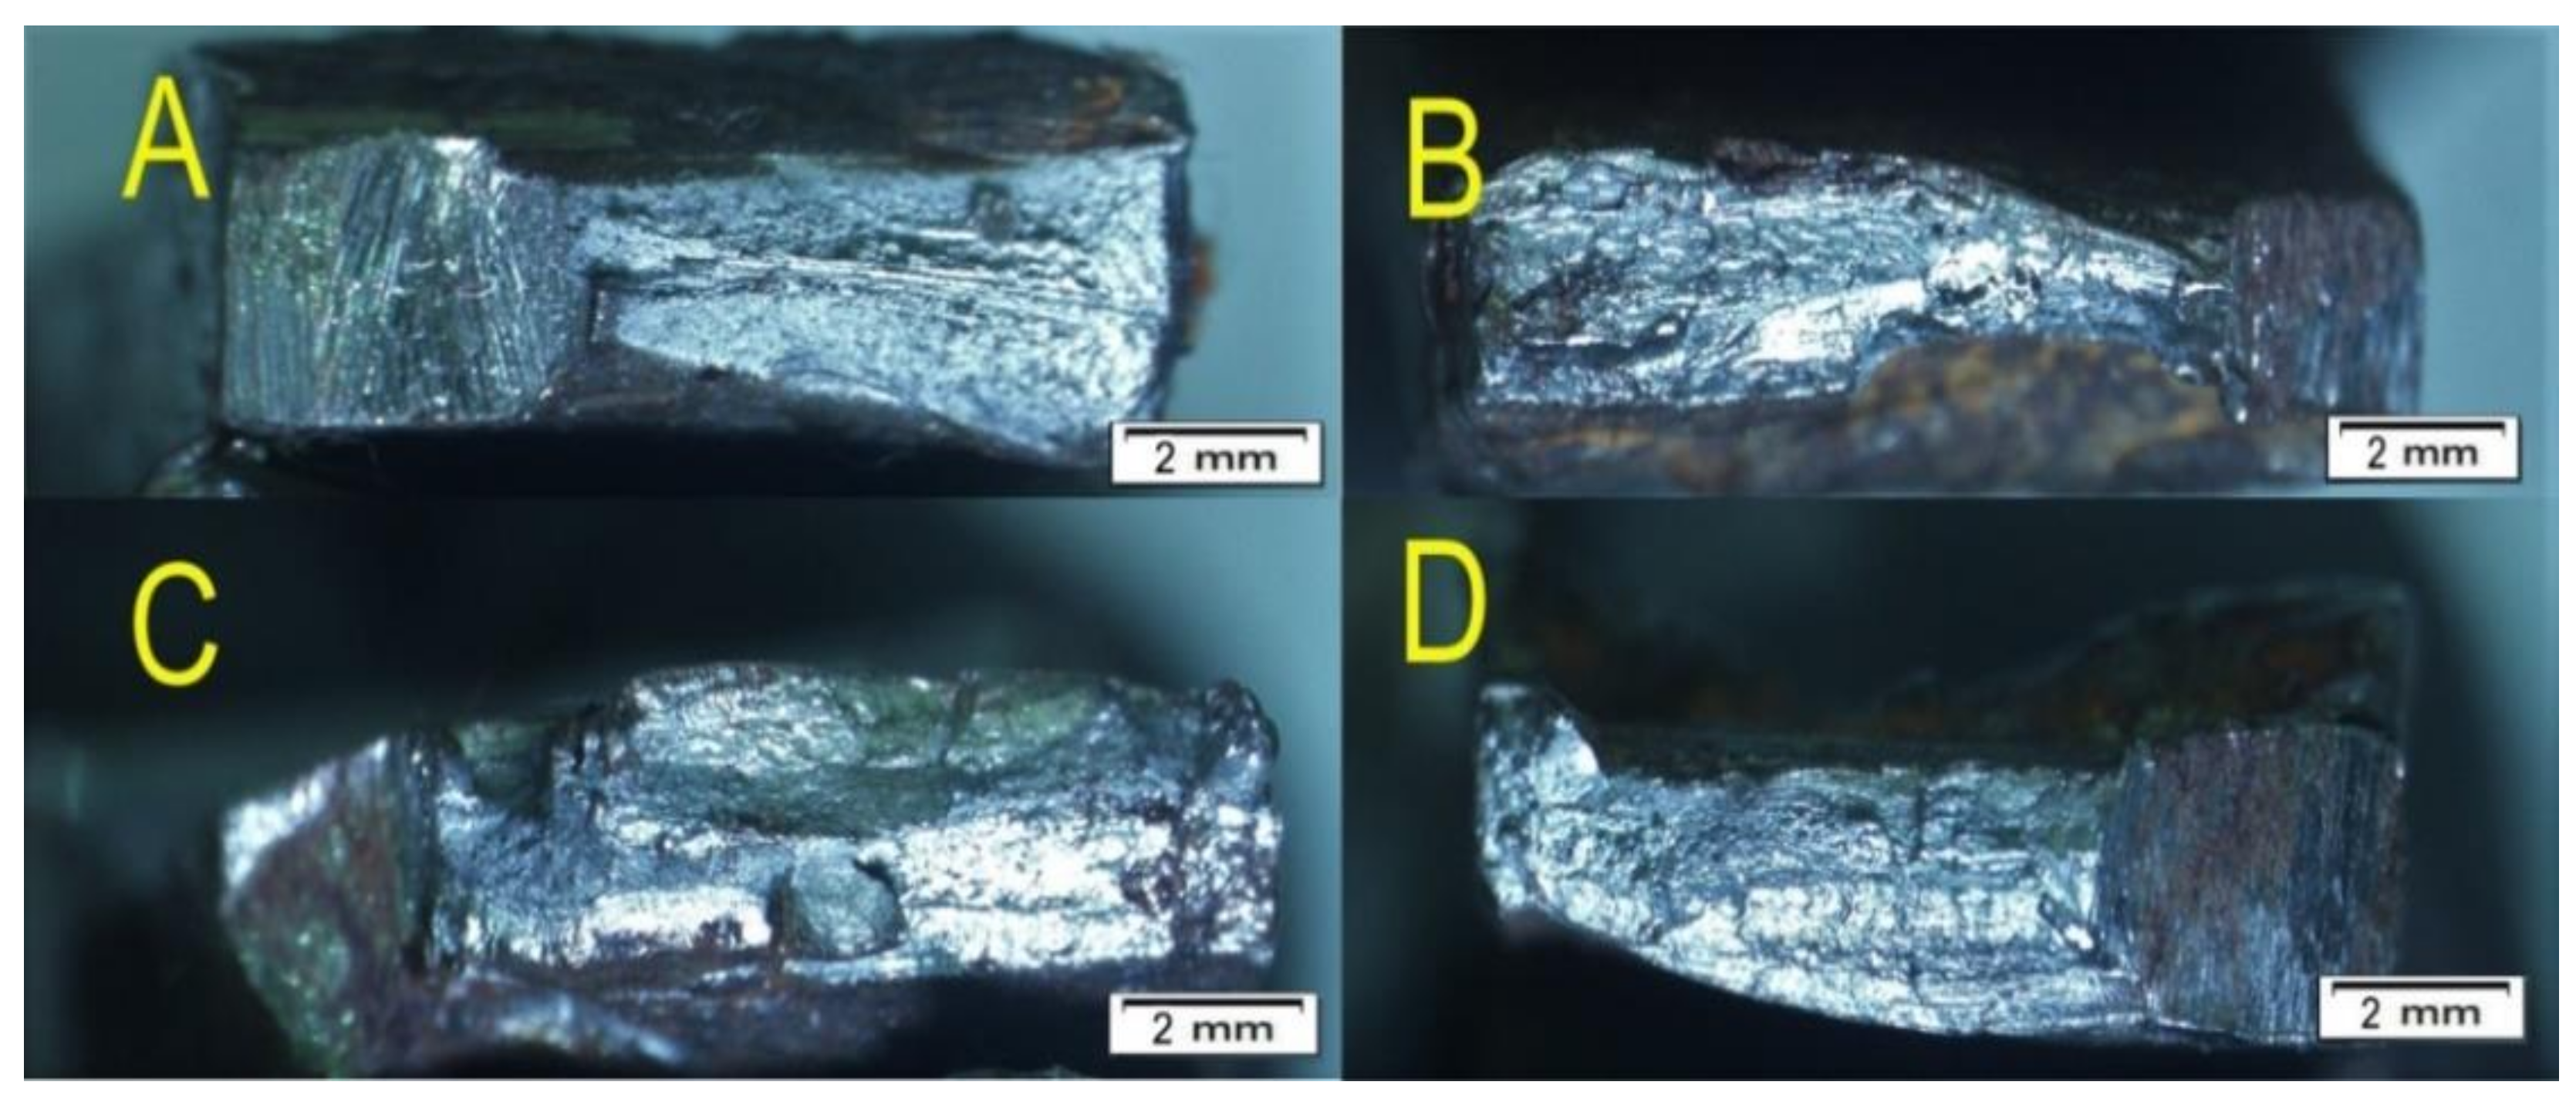
3.2.2. Tensile Strength Test

Tensile testing refers to the JIS Z 2201 standard, with each variation carried out three times with weld reinforcement which was not removed. Figure 9 shows the results of the specimen tensile test, where all the specimens have a fracture around the HAZ and base metal area. The fracture that occurs in the HAZ area is caused by the weld reinforcement which was not removed during the tensile test. Weld reinforcement makes the area of the weld metal stronger against the tensile load applied during the test, so that fractures tend to occur in the HAZ area.
Figure 10 shows the tensile test simulation performed on a specimen with weld reinforcement on both sides. It can be seen that the load distribution appears first on the weld toe, which will be the cause of the initial fracture [27].
The tensile strength of the welding specimens is presented in Figure 11, which shows that the maximum stress value of the welding on land is the smallest, namely, 416.1 MPa, but with highest elongation of 4.4%, while in underwater welding the average tensile strength and elongation are 508 MPa and 3.3%, respectively. The tensile strength of underwater welding without flow is increased in comparison with welding on land. The results of the tensile test show that a specimen that is welded underwater without flow has an average tensile strength of 488.2 MPa and an elongation of 3.4%, while in non-uniform flow with baffle there is tensile strength and elongation, namely, to 513.4 MPa and 3.53%, respectively. The greatest tensile strength is found in non-uniform flow without baffle, namely, 534.1 MPa and 3.6% of elongation, respectively.
Welding on land has the highest percentage of elongation because the fracture location is around the HAZ and base metal area, so it has a shrinkage in the area of the fracture (necking) as shown in Figure 9. The location of the fracture at the end of the HAZ is caused by the large thickness of the weld reinforcement, and the absence of a shrinkage of the weld pool width as experienced by underwater welding with upstream welding [4,27]. The smallest percentage of elongation in underwater welding without flow is caused by undercut defects on the weld toe, so that there is no necking before the specimen breaks [20].
In contrast to the without-flow underwater welding specimens that do not have a necking, the underwater welding specimens have a slight necking before fracture, so that the tensile strength and elongation values are greater than those of the without-flow underwater welding specimen. The graph of tensile test results in Figure 11 shows the tendency of increasing the percentage of elongation and ultimate tensile strength (UTS) along with the increasing rate of cooling in the welding process. The rapid cooling rate increase in underwater welding gives the HAZ micro-structure grains an increased pearlite concentration and decreased size of grain, smoother and denser, as shown in Table 4. The smaller grains will make the dislocation distribution random, thus increasing the tensile strength and hardness of the material [23,28].

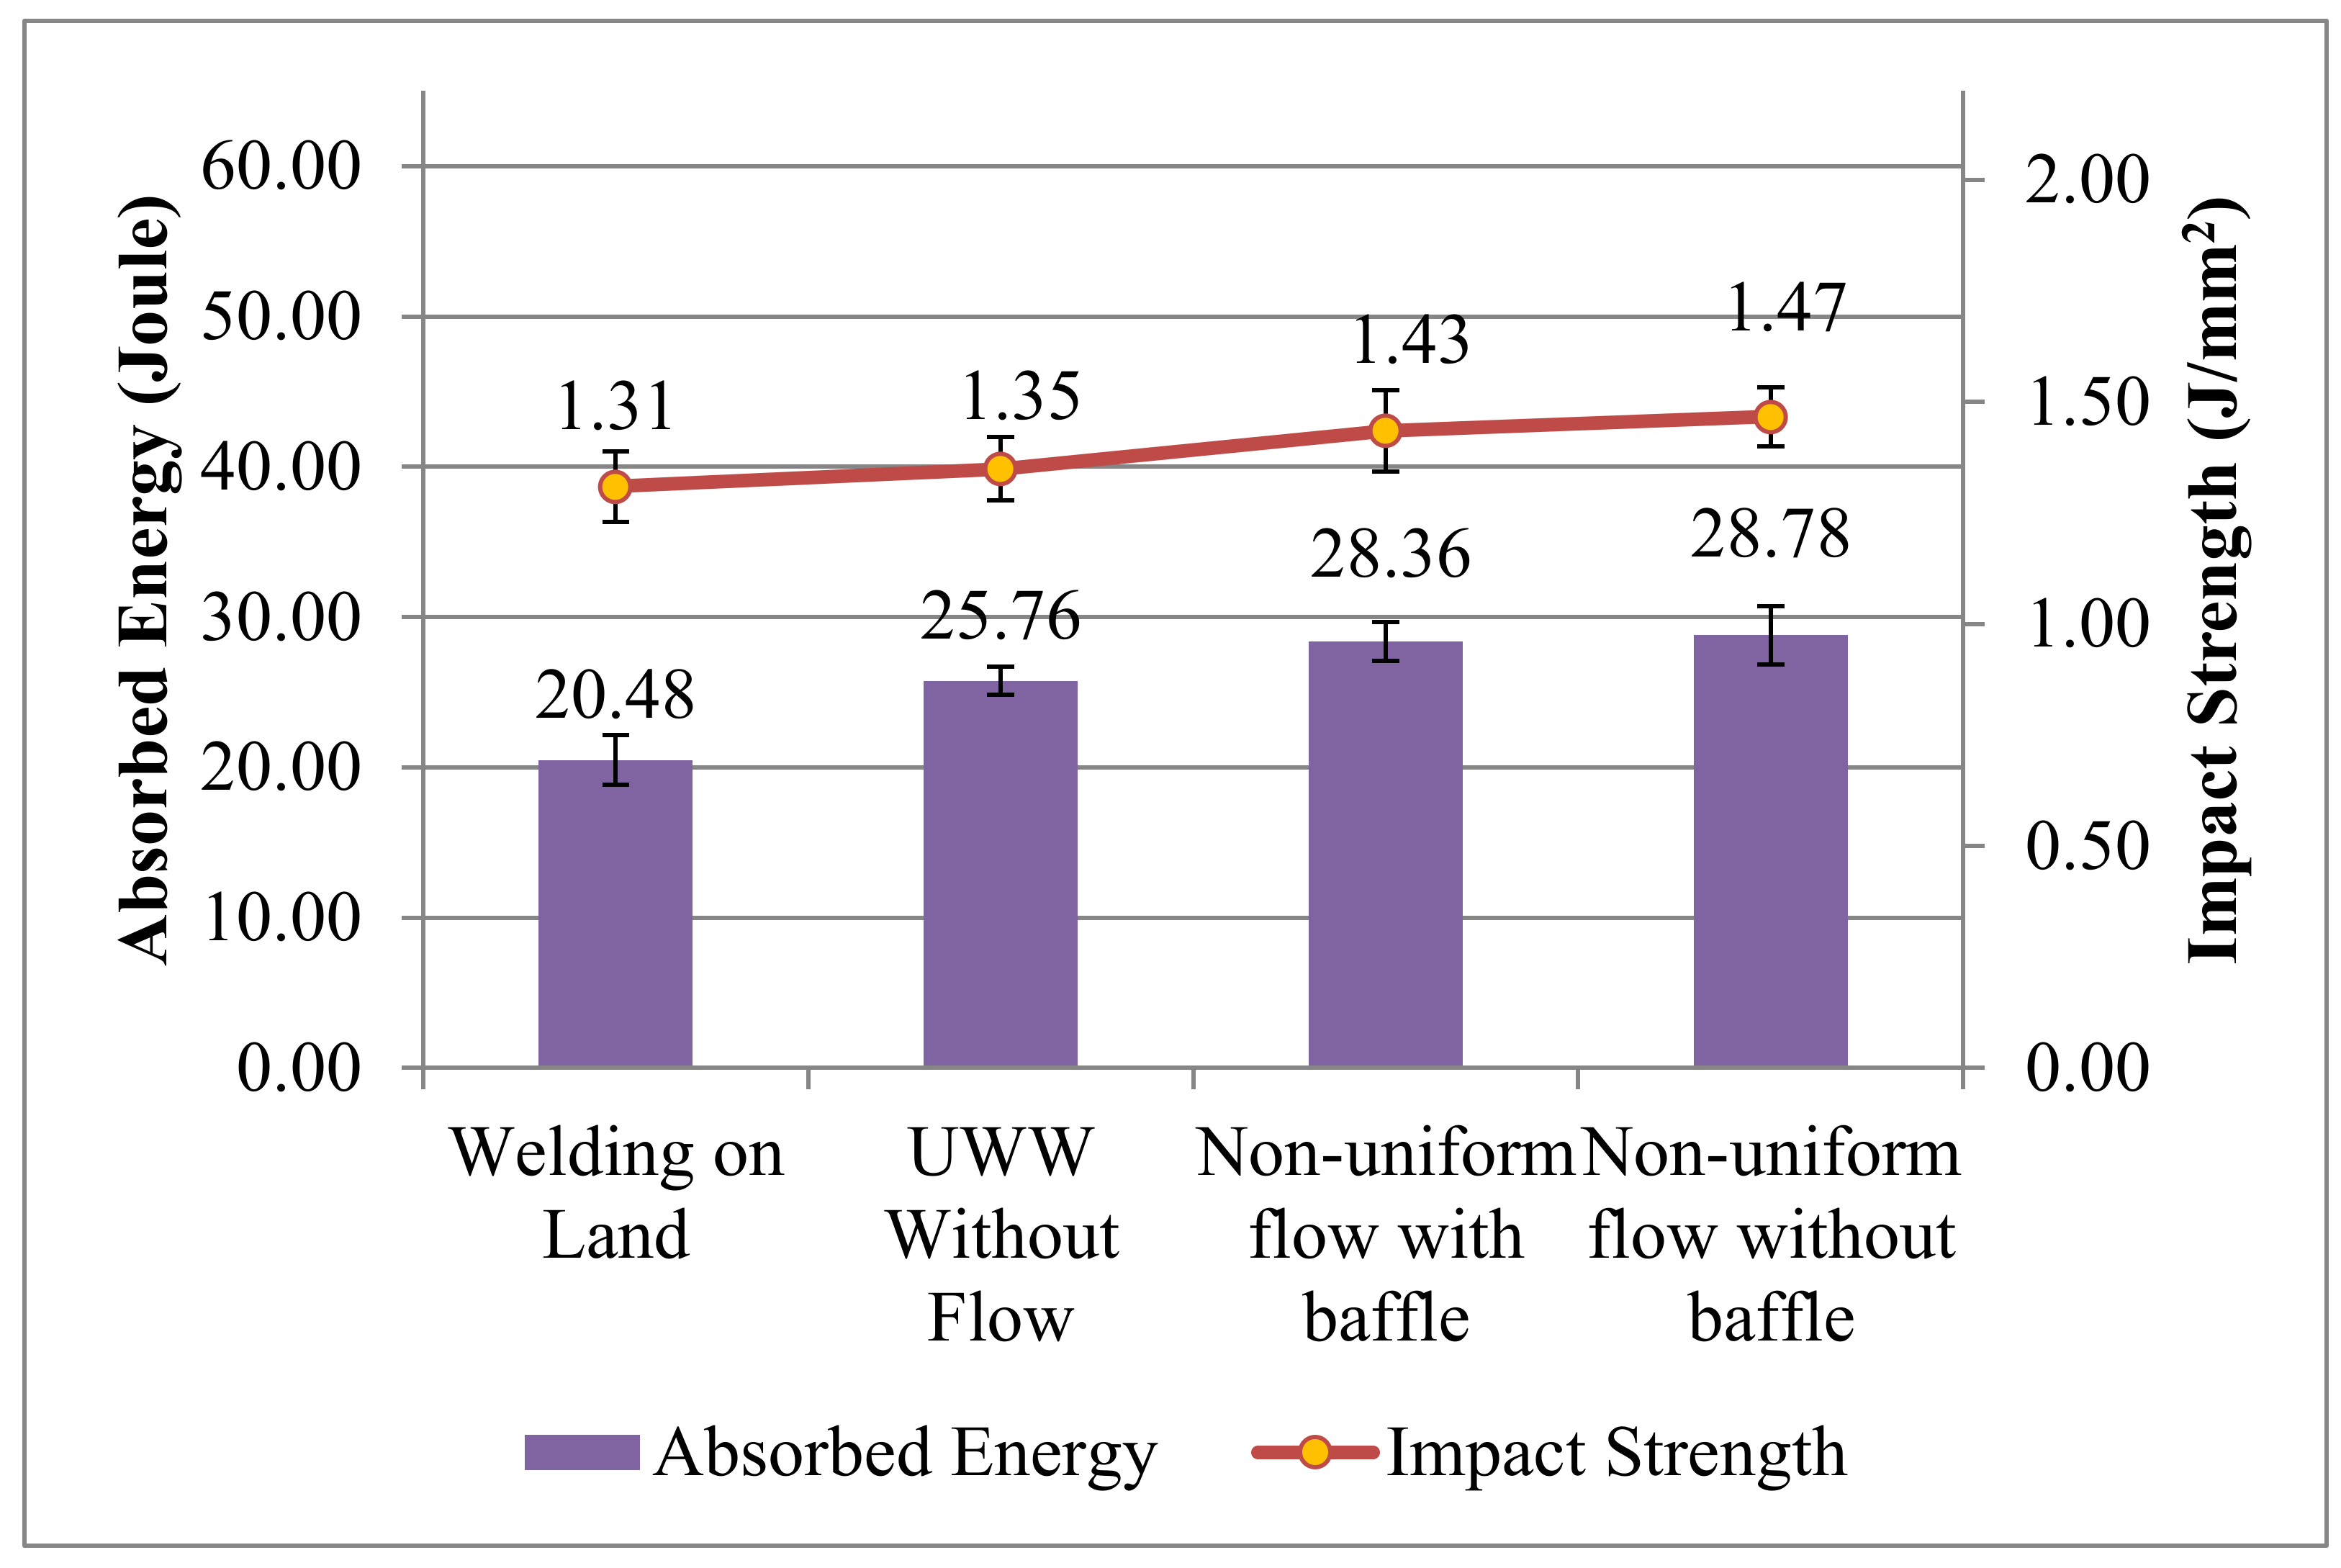
3.2.3. Impact Toughness Test
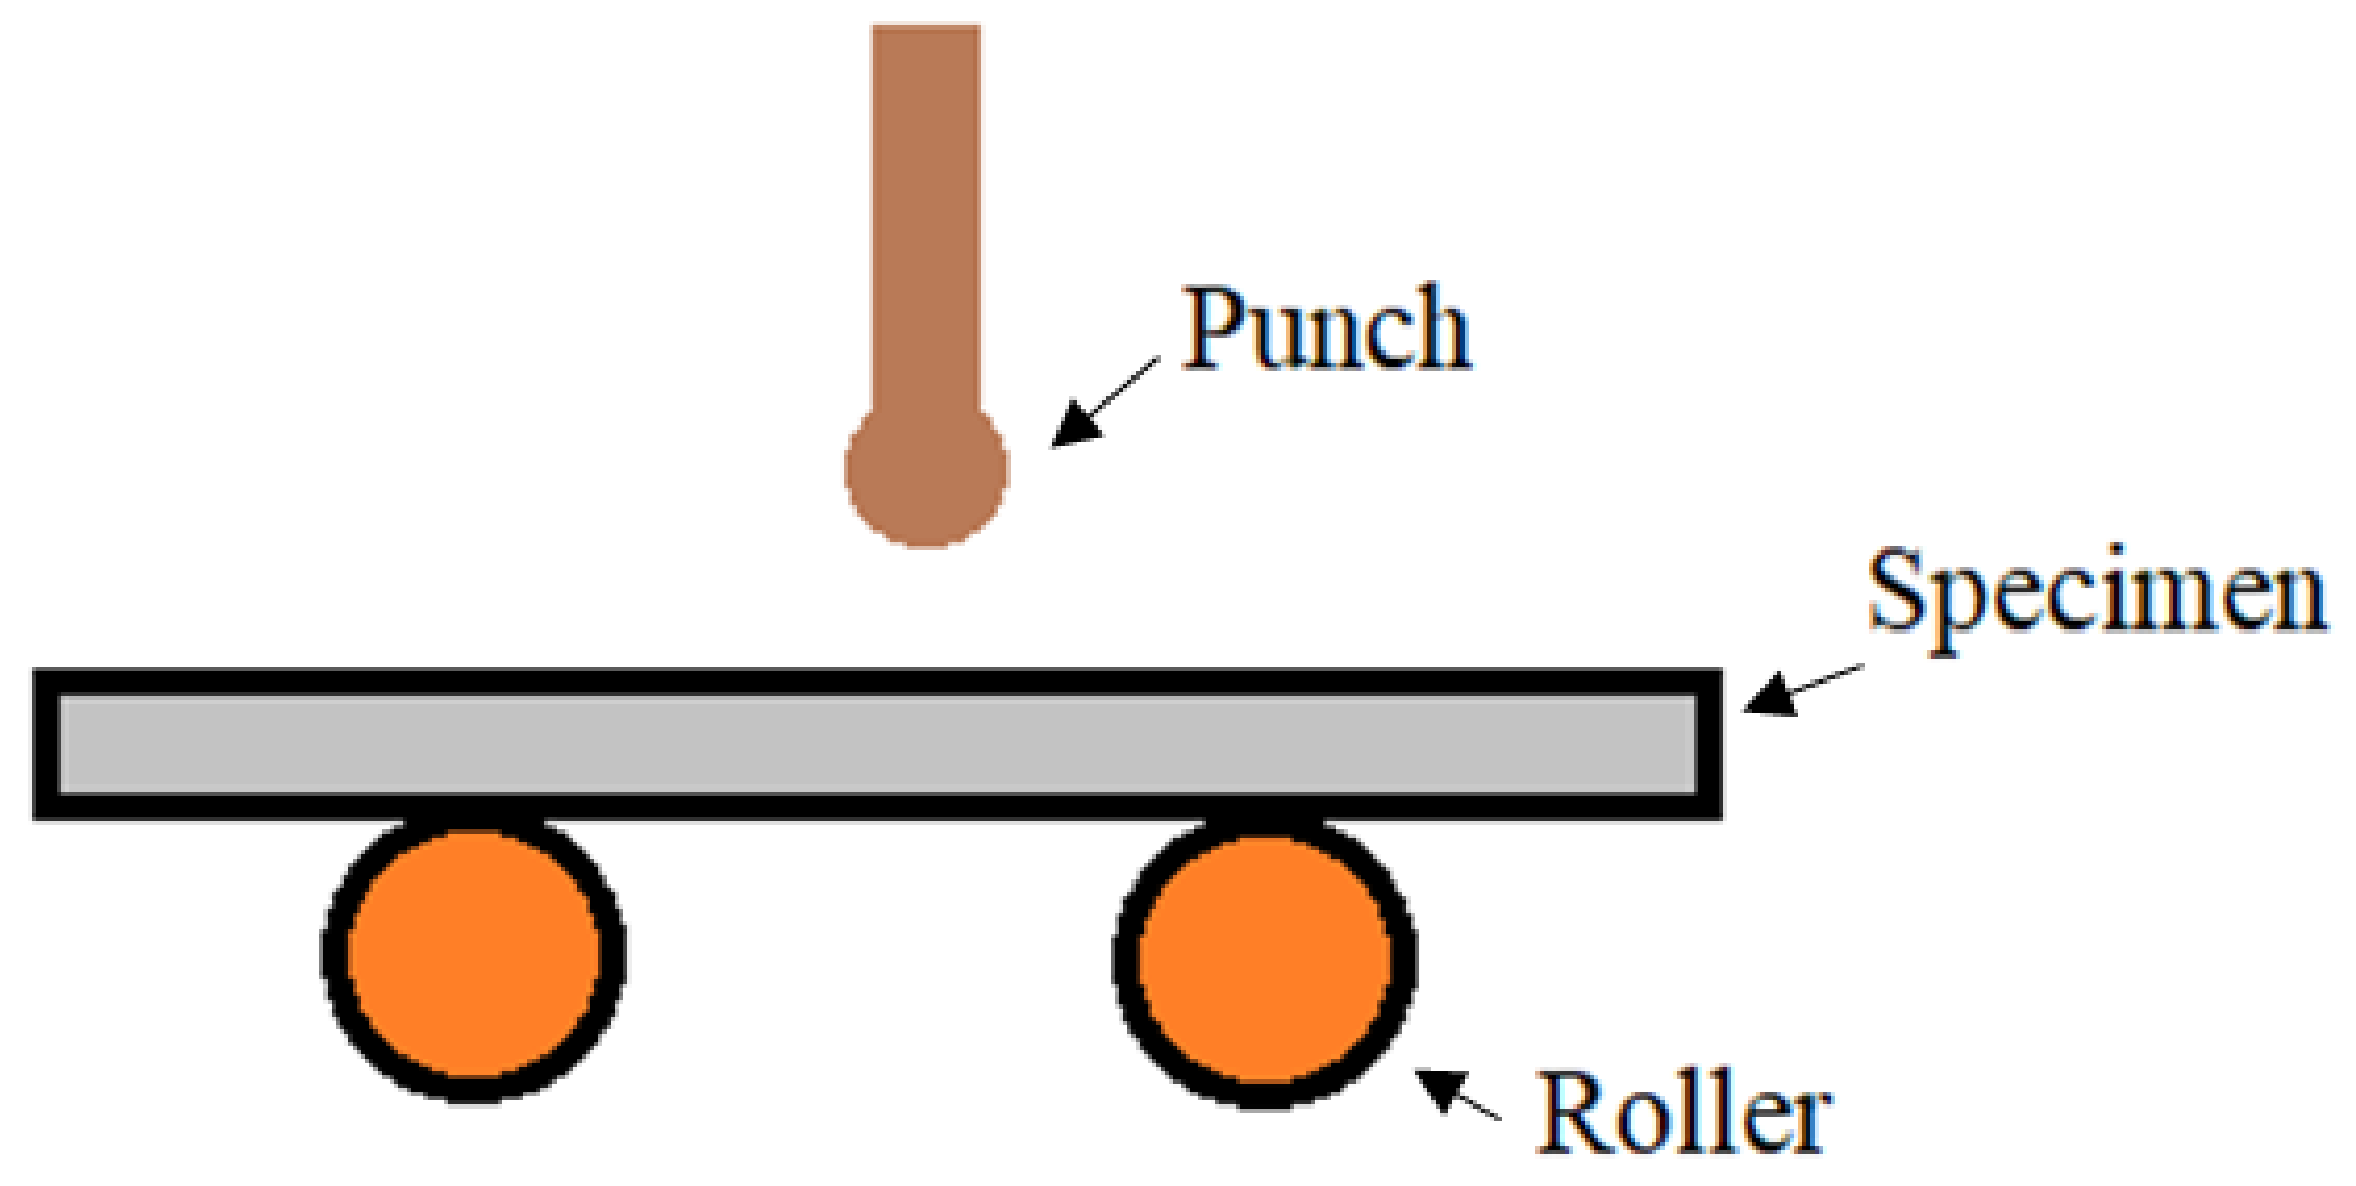
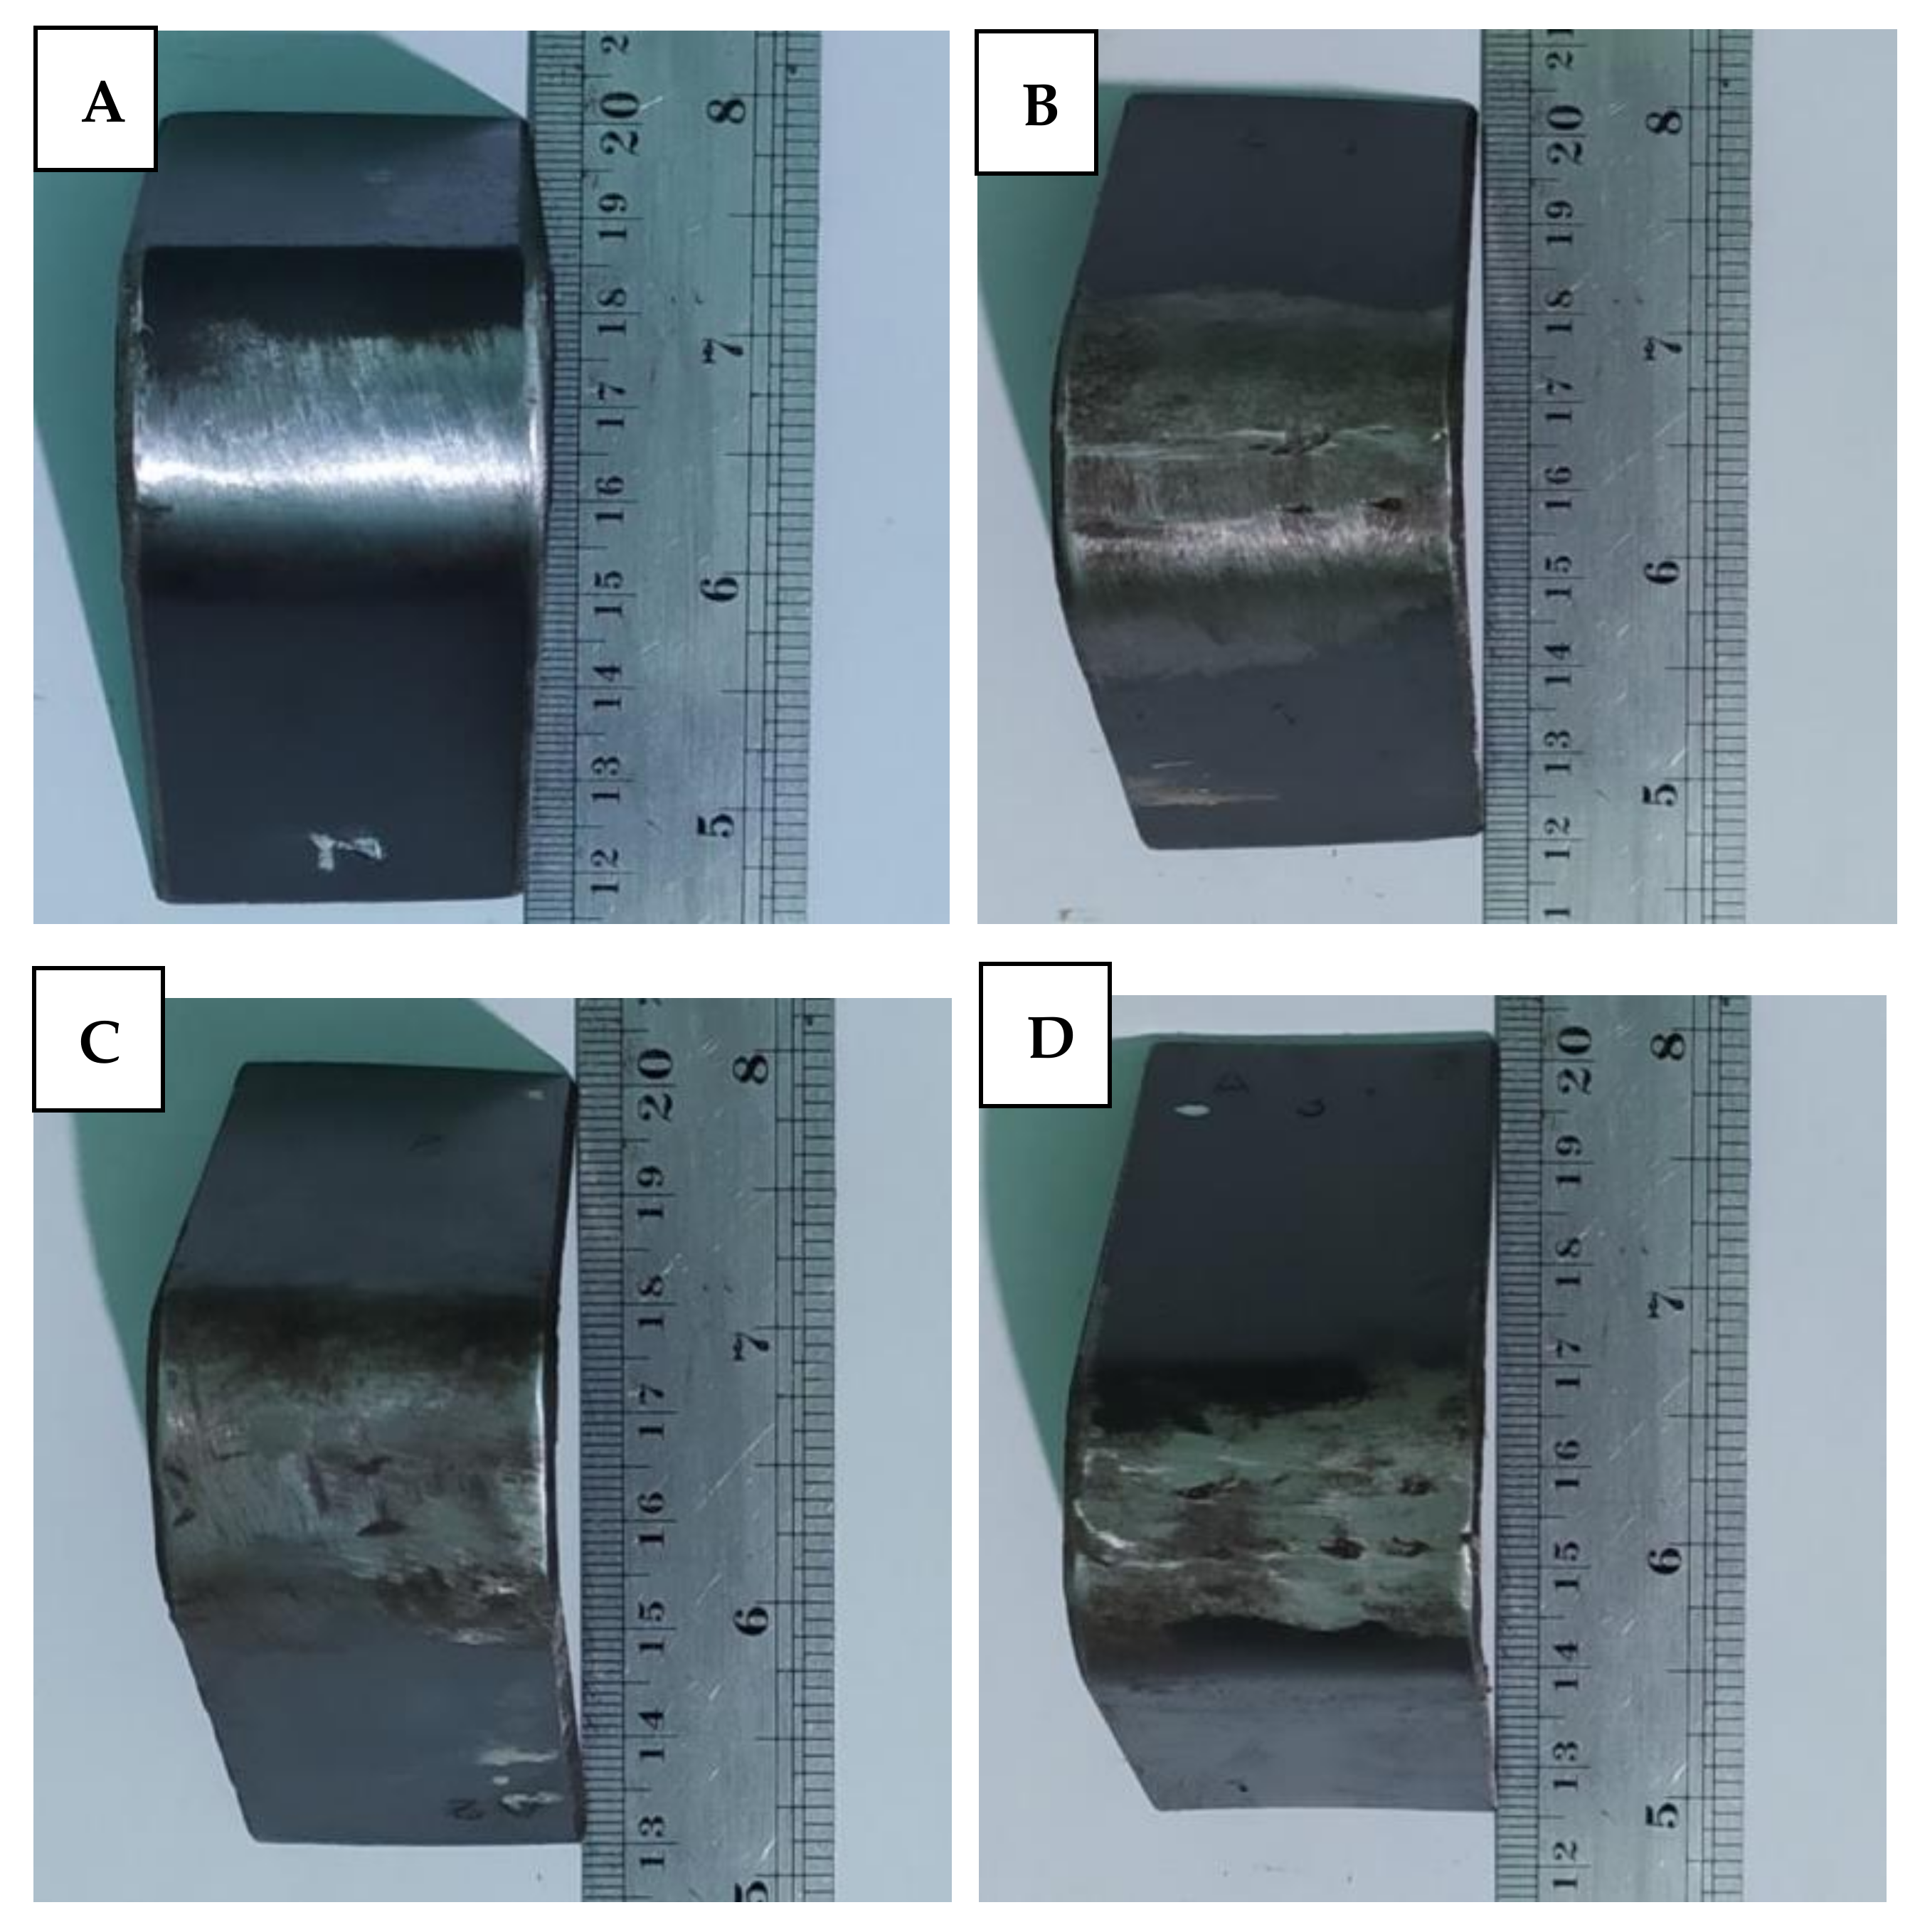
Impact testing was carried out by making a notch on the HAZ and using a reinforced specimen that made the fracture spread to the HAZ and base metal area because the weld metal was stronger in receiving impact loads and stresses [21,27,28]. The specimens of the impact test results are presented in Figure 12, which shows a mixed fracture between brittle and ductile in land welding and underwater welding.
The graph data of impact testing in Figure 13 show a trend of the amount of energy that can be absorbed; the impact strength, which increases with the cooling rate; and a flow rate that increases at each welding condition. This trend is contrary to the results of other studies, which concluded that a higher cooling rate will make the grain structure of ferrite and pearlite smaller and make the hardness and tensile strength increase but reduce the toughness [17,23,28].
The highest impact toughness was obtained in the specimens that were welded underwater with a non-uniform flow without baffle, with an impact strength of 1.47 J/mm2 and energy absorption of 28.78 J. The lowest toughness value was obtained in welding on land at 1.31 J/mm2, with 20.48 J of absorbed energy. The specimen that welded underwater without flow could absorb energy of 25.76 J and had an impact value of 1.33 J/mm2, while specimens in underwater non-uniform flow with baffle welding can absorb energy of 28.36 J, with an impact value of 1.43 J/mm2.
The data in Figure 13 show a trend of the amount of energy that can be absorbed; the impact strength, which increases with the cooling rate; and a flow rate that increases at each welding condition. According to Colak et al., results that differ from the theory may occur because the underwater welding specimen fracture occurs in the base metal area, such as the fracture scheme shown in Figure 14. The fracture in the base metal area was caused by the reinforcement of the impact test specimen and the different HAZ area depending on the variation of the heat input. Underwater welding specimens have fractures that spread to the base metal area due to the narrow area of the HAZ. This is because the heat input is smaller because the arc heat undergoes forced convection by water. Welding on land specimens have fractures in the HAZ caused by large weld heat input because the heat of the welding arc does not undergo convection, so the HAZ area becomes wider [21,27,28].
The fracture in the base metal will make the toughness value of the underwater weld specimen bigger because the area of the base metal is not exposed to heat, so it does not undergo a grain structure transformation, which can reduce the toughness of the material [28]. This result is also supported by Di et al., who conducted research using electrode variations with different heat input in land and underwater welding; the highest impact test results were obtained from specimens that were welded with electrodes that had the smallest heat input [22].

3.2.4. Bending Test

The bending test is carried out on the test specimen from the welding result by referring to the AWS D1.1 standard with the type of face bend test. The face bend test is used to determine the quality information of the welding results, especially on the upper surface of the weld seam, which can be seen from the toughness properties of the material after welding. The test was carried out with three-point bending, which used a 20 mm diameter of punch with a depth penetration of 55 mm and a 30 mm diameter roller. The bend test scheme is showed in Figure 15. The bending test on the weld specimen using the face bend position resulted in an acceptable dry weld specimen because it had no cracks. This is because welding on land has no defects and has large grains, providing it with good toughness [28]. The specimens of the bending test results are shown in Figure 16.
In contrast to welding on land, which is declared accepted, underwater welding specimens have a fracture extension caused by undercut defects. There was a crack extension exceeding 3 mm in the underwater welding specimen, which previously had a fracture of less than 2 mm in length. Undercut defects are caused by the process of forming a weld pool that is not optimal due to the shrinkage of the welding arc by forced convection [4,20]. The flow rate in underwater welding causes an increase in the density of the weld current, which also causes undercut defects [4,21]. The elongated cracks are caused by the load distribution that appears first in the undercut defect area when tested.
The microstructure of the HAZ of underwater welding contains increased pearlite concentrations due to the high cooling rate. The pearlite content is strong but brittle and more sensitive to fracture; thus, fracture propagation occurs more easily [28]. Following the AWS D1.1 standard, if defects that arise in specimens b, c, and d are initially less than 2 mm and, due to bending tests, expand to cracks greater than 3 mm, the specimens are declared rejected. This methodology may be extended to investigate thin-walled structures which use A36 and other marine steels as parts of their constructions, e.g., ship and offshore platform [29,30,31,32,33,34,35,36,37,38].

4. Conclusions

The conclusions that can be obtained from the results of this research on the effect of water flow on the physical and mechanical properties of underwater welding of bead on plate on A36 steel are as follows:
  • The presence of flow and an increase in flow rate in underwater welding causes greater porosity defects. In underwater welding with non-uniform flow without baffle, there are porosity defects and undercuts that occur the most. The deepest penetration is in underwater welding with non-uniform flow without baffle, with an average of 2.28 mm.
  • The effects of water flow on physical and mechanics properties of underwater wet welded low-carbon A36 steel have been investigated. Based on the observation of microstructures, the volume fraction of ferrite in weld metal structures increases with the cooling rate due to the increasing water flow rate.
  • The highest microhardness was measured on the HAZ, followed by the weld metal and the base metal, for all the test samples. The mechanical properties of the specimen increase with the rate and variability of water flow. The best mechanical properties are possessed by welding with the highest flow rate, with a tensile strength of 534.1 MPa and 3.6% elongation, whereas Vickers microhardness in the HAZ area is 424 HV and the impact strength is 1.47 J/mm2.

Author Contributions

Conceptualization, E.S.; methodology, N.M.; software, E.P.B. and A.R.P.; validation, E.S. and N.M.; formal analysis, A.H.G. and E.S.; investigation, N.M. and T.T.; resources, A.R.P. and T.T.; data curation, A.H.G.; writing—original draft preparation, A.H.G.; writing—review and editing, A.R.P.; visualization, E.P.B.; supervision, T.T. and A.R.P.; project administration, T.T.; funding acquisition, T.T. All authors have read and agreed to the published version of the manuscript.

Funding

This work was supported by the RKAT PTNBH Universitas Sebelas Maret, Surakarta under Scheme of Mandatory Research 2021, with Grant/Contract No. 260/UN27.22/HK.07.00/2021. The support is gratefully acknowledged by the authors.

Institutional Review Board Statement

Not applicable.

Informed Consent Statement

Not applicable.

Data Availability Statement

Not applicable.

Conflicts of Interest

The authors declare no conflict of interest.

References

  1. Lasabuda, R. Regional Development in Coastal and Ocean in Archipelago Perspective of The Republic of Indonesia. J. Ilmiah Platax 2013, 1, 92–101. [Google Scholar] [CrossRef]
  2. Roza, E. Maritim Indonesia, Kemewahan Yang Luar Biasa. 2017. Available online: http://kkp.go.id/artikel/2233-maritim-indonesia-kemewahan-yang-luar-biasa (accessed on 7 March 2019).
  3. Surojo, E.; Wicaksana, N.I.; Saputro, Y.C.N.; Budiana, E.P.; Muhayat, N.; Triyono; Prabowo, A.R. Effect of Welding Parameter on the Corrosion Rate of Underwater Wet Welded SS400 Low Carbon Steel. Appl. Sci. 2020, 10, 5843. [Google Scholar] [CrossRef]
  4. Chen, H.; Guo, N.; Shi, X.; Du, Y.; Feng, J.; Wang, G. Effect of water flow on the arc stability and metal transfer in underwater flux-cored wet welding. J. Manuf. Process. 2018, 31, 103–115. [Google Scholar] [CrossRef]
  5. Zhai, Y.; Yang, L.; He, T.; Liu, Y. Weld morphology and microstructure during simulated local dry underwater FCTIG. J. Mater. Process. Technol. 2017, 250, 73–80. [Google Scholar] [CrossRef]
  6. Guo, N.; Du, Y.; Feng, J.; Guo, W.; Deng, Z. Study of underwater wet welding stability using an X-ray transmission method. J. Mater. Process. Technol. 2015, 225, 133–138. [Google Scholar] [CrossRef]
  7. Łabanowski, J.; Fydrych, D.; Rogalski, G. Underwater Welding–A Review. Adv. Mater. Sci. Eng. 2008, 8. [Google Scholar] [CrossRef]
  8. Tomków, J.; Fydrych, D.; Wilk, K. Effect of Electrode Waterproof Coating on Quality of Underwater Wet Welded Joints. Materials 2020, 13, 2947. [Google Scholar] [CrossRef]
  9. Simanjuntak, R.; Muhayat, N.; Prabowo, A.R.; Saputro, Y.C.N.; Triyono. Effect of environment on the defects of welded aluminum AA 1100. AIP Conf. Proc. 2020, 2217, 030135. [Google Scholar] [CrossRef]
  10. Lamet; Bruno, L.A.; Richard, L.A.; William, R.J.R. Hand Book of Welding, Brazing, Soldering. ASM Int. 1993, 6, 254. [Google Scholar]
  11. Zhang, Y.; Jia, C.; Zhao, B.; Hu, J.; Wu, C. Heat input and metal transfer influences on the weld geometry and microstructure during underwater wet FCAW. J. Mater. Process. Technol. 2016, 238, 373–382. [Google Scholar] [CrossRef]
  12. Wang, J.; Sun, Q.; Pan, Z.; Yang, J.; Feng, J. Effects of welding speed on bubble dynamics and process stability in mechanical constraint-assisted underwater wet welding of steel sheets. J. Mater. Process. Technol. 2019, 264, 389–401. [Google Scholar] [CrossRef]
  13. Feng, J.; Wang, J.; Sun, Q.; Zhao, H.; Wu, L.; Xu, P. Investigation on dynamic behaviors of bubble evolution in underwater wet flux-cored arc welding. J. Manuf. Process. 2017, 28, 156–167. [Google Scholar] [CrossRef]
  14. Syahputri, E.; Surojo, E.; Budiana, E.P.; Triyono. Current Research and Recommended Development on Fatigue Behavior of Underwater Welded Steel. Procedia Struct. Integr. 2020, 27, 54–56. [Google Scholar] [CrossRef]
  15. American Welding Society. Welder’s Visual Inspection Handbook, 3rd ed.; American Welding Society: Miami, FL, USA, 2013. [Google Scholar]
  16. Chen, H.; Guo, N.; Huang, L.; Zhang, X.; Feng, J.; Wang, G. Effects of arc bubble behaviors and characteristics on droplet transfer in underwater wet welding using in-situ imaging method. Mater. Des. 2019, 170, 107696. [Google Scholar] [CrossRef]
  17. Muhayat, N.; Matien, Y.A.; Sukanto, H.; Saputro, Y.C.N.; Triyono. Fatigue life of underwater wet welded low carbon steel SS400. Heliyon 2020, 6, e03366. [Google Scholar] [CrossRef]
  18. Surojo, E.; Anindito, J.; Paundra, F.; Prabowo, A.R.; Budiana, E.P.; Muhayat, N.; Badaruddin, M.; Triyono. Effect of water flow and depth on fatigue crack growth rate of underwater wet welded low carbon steel SS400. Open Eng. 2021, 11, 329–338. [Google Scholar] [CrossRef]
  19. Chen, H.; Guo, N.; Shi, X.; Du, Y.; Feng, J.; Wang, G. Effect of hydrostatic pressure on protective bubble characteristic and weld quality in underwater flux-cored wire wet welding. J. Mater. Process. Technol. 2018, 259, 159–168. [Google Scholar] [CrossRef]
  20. Van Nguyen, A.; Tashiro, S.; Ngo, M.H.; Van Bui, H.; Tanaka, M. Effect of the eddies formed inside a weld pool on welding defects during plasma keyhole arc welding. J. Manuf. Process. 2020, 59, 649–657. [Google Scholar] [CrossRef]
  21. Cerit, M.; Kokumer, O.; Genel, K. Stress concentration effects of undercut defect and reinforcement metal in butt welded joint. Eng. Fail. Anal. 2010, 17, 571–578. [Google Scholar] [CrossRef]
  22. Wang, J.; Sun, Q.; Ma, J.; Teng, J.; Jin, P.; Feng, J. Investigation of acoustic radiator affecting bubble-acoustic interaction in ultrasonic wave-assisted UWW at shallow water. J. Manuf. Process 2019, 37, 563–577. [Google Scholar] [CrossRef]
  23. Di, X.; Ji, S.; Cheng, F.; Wang, D.; Cao, J. Effect of cooling rate on microstructure, inclusions and mechanical properties of weld metal in simulated local dry underwater welding. Mater. Des. 2015, 88, 505–513. [Google Scholar] [CrossRef]
  24. Gao, W.; Wang, D.; Cheng, F.; Di, X.; Deng, C.; Xu, W. Microstructural and mechanical performance of underwater wet welded S355 steel. J. Mater. Process. Technol. 2016, 238, 333–340. [Google Scholar] [CrossRef]
  25. Wang, J.; Sun, Q.; Zhang, S.; Wang, C.; Wu, L.; Feng, J. Characterization of the underwater welding arc bubble through a visual sensing method. J. Mater. Process. Technol. 2018, 251, 95–108. [Google Scholar] [CrossRef]
  26. Lincoln Electric. E7018 Composition Catalogue; Publication C2.10.10, Issue Date: May 2014; Lincoln Electric: Cleveland, OH, USA, 2014. [Google Scholar]
  27. Wang, G.-Q.; Li, Q.; Li, Y.-J.; Wu, A.-P.; Ma, N.-X.; Yan, D.-Y.; Wu, H.-Q. Effects of weld reinforcement on tensile behavior and mechanical properties of 2219-T87 aluminum alloy TIG welded joints. T. Nonferr. Metal. Soc. 2017, 27, 10–16. [Google Scholar] [CrossRef]
  28. Çolak, Z.; Ayan, Y.; Kahraman, N. Weld morphology and mechanical performance of marine structural steel welded underwater in a real marine environment. Int. J. Adv. Manuf. Technol. 2020, 109, 491–501. [Google Scholar] [CrossRef]
  29. Prabowo, A.; Do, Q.T.; Cao, B.; Bae, D.M. Land and Marine-based Structures subjected to Explosion Loading: A review on Critical Transportation and Infrastructure. Proc. Struct. Integ. 2020, 27, 77–84. [Google Scholar] [CrossRef]
  30. Muttaqie, T.; Thang, D.Q.; Prabowo, A.R.; Cho, S.R.; Sohn, J.M. Numerical studies of the failure modes of ring-stiffened cylinders under hydrostatic pressure. Struct. Eng. Mech. 2019, 70, 431–443. [Google Scholar] [CrossRef]
  31. Nubli, H.; Prabowo, A.R.; Sohn, J.M. Fire phenomenon of natural gas leak accidents on the lng-fueled ship using computational fluid dynamic. Int. Conf. Offshore Mech. Arct. Eng. 2020, 84324, V02AT02A066. [Google Scholar] [CrossRef]
  32. Prabowo, A.R.; Cahyono, S.I.; Sohn, J.M. Crashworthiness assessment of thin-walled double bottom tanker: A variety of ship grounding incidents. Theo. Appl. Mech. Lett. 2019, 9, 320–327. [Google Scholar] [CrossRef]
  33. Yusvika, M.; Prabowo, A.R.; Tjahjana, D.D.D.P.; Sohn, J.M. Cavitation prediction of ship propeller based on temperature and fluid properties of water. J. Mar. Sci. Eng. 2020, 8, 465. [Google Scholar] [CrossRef]
  34. Ridwan, R.; Prabowo, A.R.; Muhayat, N.; Putranto, T.; Sohn, J.M. Tensile analysis and assessment of carbon and alloy steels using FE approach as an idealization of material fractures under collision and grounding. Curved. Layered. Struct. 2020, 7, 188–198. [Google Scholar] [CrossRef]
  35. Prabowo, A.R.; Bae, D.M. Environmental risk of maritime territory subjected to accidental phenomena: Correlation of oil spill and ship grounding in the Exxon Valdez’s case. Res. Eng. 2019, 4, 100035. [Google Scholar] [CrossRef]
  36. Liu, B.; Villavicencio, R.; Pedersen, P.T.; Soares, C.G. Analysis of structural crashworthiness of double-hull ships in collision and grounding. Mar. Struct. 2021, 76, 102898. [Google Scholar] [CrossRef]
  37. Liu, J.; Huang, Z. Fire and Explosion Risk Analysis and Evaluation for LNG Ships. Proc. Eng. 2012, 45, 70–76. [Google Scholar] [CrossRef]
  38. Prabowo, A.R.; Bae, D.M.; Sohn, J.M.; Cao, B. Energy behavior on side structure in event of ship collision subjected to external parameters. Heliyon 2016, 2, e00192. [Google Scholar] [CrossRef] [PubMed] [Green Version]
Figure 1. Scheme of wet underwater SMAW process.
Metals 11 00682 g001
Figure 2. Schematic of water flow simulation on test stand.
Metals 11 00682 g002
Figure 3. Tensile test specimen (mm).
Metals 11 00682 g003
Figure 4. View of underwater wet welded joints. (A) Welding on land, (B) underwater welding without flow, (C) non-uniform flow underwater welding with baffle, (D) non-uniform flow underwater welding without baffle.
Metals 11 00682 g004
Figure 5. Morphology of welding results. (A) Welding on land, (B) underwater welding without flow, (C) non-uniform flow underwater welding with baffle, (D) non-uniform flow underwater welding without baffle.
Metals 11 00682 g005
Figure 6. Graph comparing data of welding penetration.
Metals 11 00682 g006
Figure 7. Schematic illustration of HSLA weld metal phase transformation in continuing cooling conditions. Further explanation of the phase can be accessed in [23].
Metals 11 00682 g007
Figure 8. Vickers microhardness of welding specimen.
Metals 11 00682 g008
Figure 9. Tensile specimens: (A) Welding on land, (B) underwater without flow, (C) underwater non-uniform flow with baffle, (D) underwater non-uniform flow without baffle.
Metals 11 00682 g009
Figure 10. Simulation of load distribution in tensile testing with reinforced specimens [27].
Metals 11 00682 g010
Figure 11. Graph data of the tensile test specimen.
Metals 11 00682 g011
Figure 12. Impact test results. (A) Welding on land, (B) underwater without flow, (C) underwater non-uniform flow with baffle, (D) underwater non-uniform flow without baffle.
Metals 11 00682 g012
Figure 13. Summarized data of the impact test results.
Metals 11 00682 g013
Figure 14. Schematic of impact fracture. (A) Fracture in welding on land, (B) fracture in underwater welding.
Metals 11 00682 g014
Figure 15. Three-point bending test scheme.
Metals 11 00682 g015
Figure 16. Bending test results. (A) Welding on land, (B) underwater welding without flow, (C) non-uniform flow underwater welding with baffle, (D) non-uniform flow underwater welding without baffle.
Metals 11 00682 g016
Table 1. Chemical composition of A36 steel.
A36CSiMnPSCrNiCuNb
(wt%)0.190.1280.4720.0440.0530.0250.0140.0150.0082
Table 2. Chemical composition of E7018 electrode.
E7018CSiMnPSCrNi
(wt%)0.080.681.550.020.010.070.06
Table 3. Observation results of welding defects.
SpecimenDefectTotalMax. Size
AUnderfilled (F)11.0 mm
Spatter (S)841.2 mm
BPorosity (P)71.5 mm
Spatter (S)84.1 mm
Undercut (U)86.1 mm
CPorosity (P)91.0 mm
Spatter (S)43.2 mm
Undercut (U)128.8 mm
DPorosity (P)121.2 mm
Spatter (S)33.1 mm
Undercut (U)148.4 mm
Table 4. Microstructure of the specimens.
VariationBase MetalHeat-Affected ZoneWeld Metal
Welding on Land Metals 11 00682 i001
Metals 11 00682 i002 Metals 11 00682 i003 Metals 11 00682 i004
Without Flow Metals 11 00682 i015
Metals 11 00682 i005 Metals 11 00682 i006 Metals 11 00682 i007
Non-uniform
with Baffle
Metals 11 00682 i008
Metals 11 00682 i009 Metals 11 00682 i010 Metals 11 00682 i011
Non-uniform
without Baffle
Metals 11 00682 i016
Metals 11 00682 i012 Metals 11 00682 i013 Metals 11 00682 i014
Publisher’s Note: MDPI stays neutral with regard to jurisdictional claims in published maps and institutional affiliations.

