Article

Hot Deformation Constitutive Equation and Plastic Instability of 30Cr4MoNiV Ultra-High-Strength Steel

1
College of Materials Science and Engineering, Hunan University, Changsha 410082, China
2
Sawing Engineering Research Center of Hunan Province, Changsha 410200, China
3
Bichamp Cutting Technology (Hunan) Co., Ltd., Changsha 410200, China
4
Hunan Valin Lianyuan Iron and Steel Co., Ltd., Loudi 417000, China
*
Author to whom correspondence should be addressed.
Metals 2021, 11(5), 769; https://doi.org/10.3390/met11050769
Submission received: 7 April 2021 / Revised: 1 May 2021 / Accepted: 2 May 2021 / Published: 7 May 2021
(This article belongs to the Special Issue Analysis and Design of Metal Forming Processes II)

Abstract

:
In this work, the hot deformation behavior of 30Cr4MoNiV ultra-high-strength steel is investigated by isothermal compression tests using the Gleeble-3500 thermal simulation machine (Dynamic Systems Inc., New York, NY, USA) at a temperature range of 1173–1373 K under the strain rate of 0.01–10 s−1. A constitutive equation with strain-dependent constants and processing maps suitable for 30Cr4MoNiV ultra-high-strength steel are established. The results show that the combination of the hyperbolic sine function and the Zener-Hollomon parameter can accurately represent the influences of deformation temperature, strain rate, and strain on the flow stress of the 30Cr4MoNiV ultra-high-strength steel. The applicability of plastic instability criteria such as m, m ˙ , S, S ˙ and the instability parameter ξ are analyzed, the stability and instability regions are clarified accurately, and the optimized processing regions are given in the stability regions. The optimized regions are verified by the uniform equiaxed grains, and the plastic instability is validated by dynamic strain aging and the microstructure of the voids.

1. Introduction

Ultra-high-strength (UHS) steel is mainly used for load-bearing components of large ships, bridges, power station equipment, mining machinery, and other large welded components, and the forming of profiles, sheet metal or parts often undergoes a hot deformation or hot working process. The plastic deformation under the combined action of heat and force can undoubtedly have a significant impact on the structure of the material and ultimately determine its service performance. Plastic deformation is extremely sensitive to external factor like temperature and pressure [1,2,3]. To obtain high-strength structural parts with excellent performance, it is necessary to clarify the relationship between the hot deformation behavior and the deformation temperature, strain rate, and strain. The quantitative relationships between the flow stress σ of the hot deformation and deformation temperature T and strain rate ε ˙ , namely, the constitutive equation, was first proposed by Sellars [4]. Subsequently, on the basis that both the material-dependent constants (α, n, A) and activation energy Q were recognized as functions of strain, Lin et al. [5] developed a revised constitutive equation, and characterized the hot deformation behavior of 42CrMo steel at high temperatures. Furthermore, Lei et al. [6]. found that the flow stress of 3Cr-1Si-1Ni UHS steel was accurately predicted by the constitutive equation introducing strain-dependent constants under the conditions of deformation temperature of 800–1250 °C, the strain rate of 0.01–10 s−1, and the strain of 0.05–0.6. A reliable constitutive equation is particularly important for describing the hot deformation behavior of the material. Rao and Prasad [7] established the constitutive equation of low carbon steel based on Arrhenius-type hyperbolic sine function, which could satisfactorily describe strain hardening, dynamic recovery and dynamic recrystallization, and temperature dependence in a wide range of strain rates. Jha et al. [8] pointed out that the power law equation was more suitable for describing the constitutive relationship between the flow strain and stress of Ti-6Al-4V alloys in both lamellar and equiaxed morphologies. So far, the constitutive equations of many types of metal materials, such as iron-based alloys [9,10], aluminum alloys [11], titanium alloys [8], copper alloys [12], magnesium alloys [13], and composite materials [14], had been constructed and discussed, which played an important guiding role in the hot processing of materials.
In addition, compared with expensive and time-consuming trial-and-error methods, processing maps constructed using the power dissipation η and the instability parameter ξ using dynamic material model (DMM) of Prasad [15] were an effective method to control processing parameters and which had been widely used in the optimization of process parameters in the hot working stage and the formulation of parameters of new material. By analyzing the effects of deformation temperature and strain rate on η, strain rate sensitivity m and ξ at true strain −0.3 to −0.9, and verifying the unstable regions using the ξ value, Quan et al. [16] obtained the optimum processing parameters of 42CrMo high-strength steel with a height reduction of 60%, 1123–1348 K temperature, and 0.01–10 s−1 strain rates. Zhai et al. [17] in his paper reported the processing performance of 40CrNiMo alloy steel could be improved by dynamic recovery (DRV) and dynamic recrystallization (DRX) at the optimum processing parameters. Liu et al. [18] pointed out that the adiabatic shear bands, voids, wedge cracks, and other defects were generated under non-optimal process parameters, especially in severe plastic instability areas. In the study of the hot deformation behavior of AZ31 alloy, Ding et al. [19] found that there are many voids and coarse grains in the stable region obtained by ξ, and which was usually regarded as a characteristic of instability. Therefore, it is necessary to pay attention to the microstructure and process parameters optimization of the material in the hot deformation stage, especially the suitable plastic instability criteria. Compared the processing maps with different plastic instability criteria such as m, ξ using DMM of Prasad [15], κ using modified DMM of Murty et al. [20], and κ j model of Poletti et al. [21], Rajput et al. [22] found that the instability areas obtained from different instability criteria were quite different, and the instability parameter κ j was most suitable for the instability areas division of AISI1010 low carbon steel. Besides, the plastic instability region could be divided by the following criteria based on the Lyapounov function, as presented in Prasad’s paper [23].
(1) 0 < m < 1 . The material will undergo fracture when m is not in this range.
(2) m ˙ = m / log ε ˙ < 0 . When m ˙ = 0 or positive, the material may undergo catastrophic fracture.
(3) S = log σ / [ log ( 1 / T ) ] > 1 . This ensures that the material does not undergo plastic instability.
(4) S ˙ = S / [ log ε ˙ ] < 0 . If S ˙ is positive, the material may undergo local deformation due to adiabatic shear during thermal deformation.
Where m, ε ˙ , σ and T are the strain rate sensitivity, strain rate, flow stress, and deformation temperature, respectively.
All these criteria based on the Lyapounov function are necessary conditions for the identification of stable flow regimes, and it is necessary to use these criteria to avoid instabilities and to impose considerable restrictions on the useful ranges of processing parameters. However, previous studies often used the instability parameter ξ as a criterion to judge the plastic instability region of the material and ignored the discussion of the above plastic instability criteria, which might cause a certain deviation. Simultaneously, people were only interested in establishing the constitutive equations and processing maps of new materials, and the verification of the reliabilities of the constructed constitutive equations and processing maps were still insufficient. Based on these, 30Cr4MoNiV UHS steel is used as the research object in this work, the response of its flow stress to strain rate and deformation temperature is obtained by isothermal compression tests, and the constitutive equation considering strain-dependent constants is derived, then the reliability discussion is carried out, the applicability of the plastic instability criteria is evaluated, an accurate processing maps is drawn, and the optimum coupling of process parameters such as strain rate, deformation temperature, and strain is obtained. Meanwhile, the reasons for plastic instability are analyzed by the microstructure.

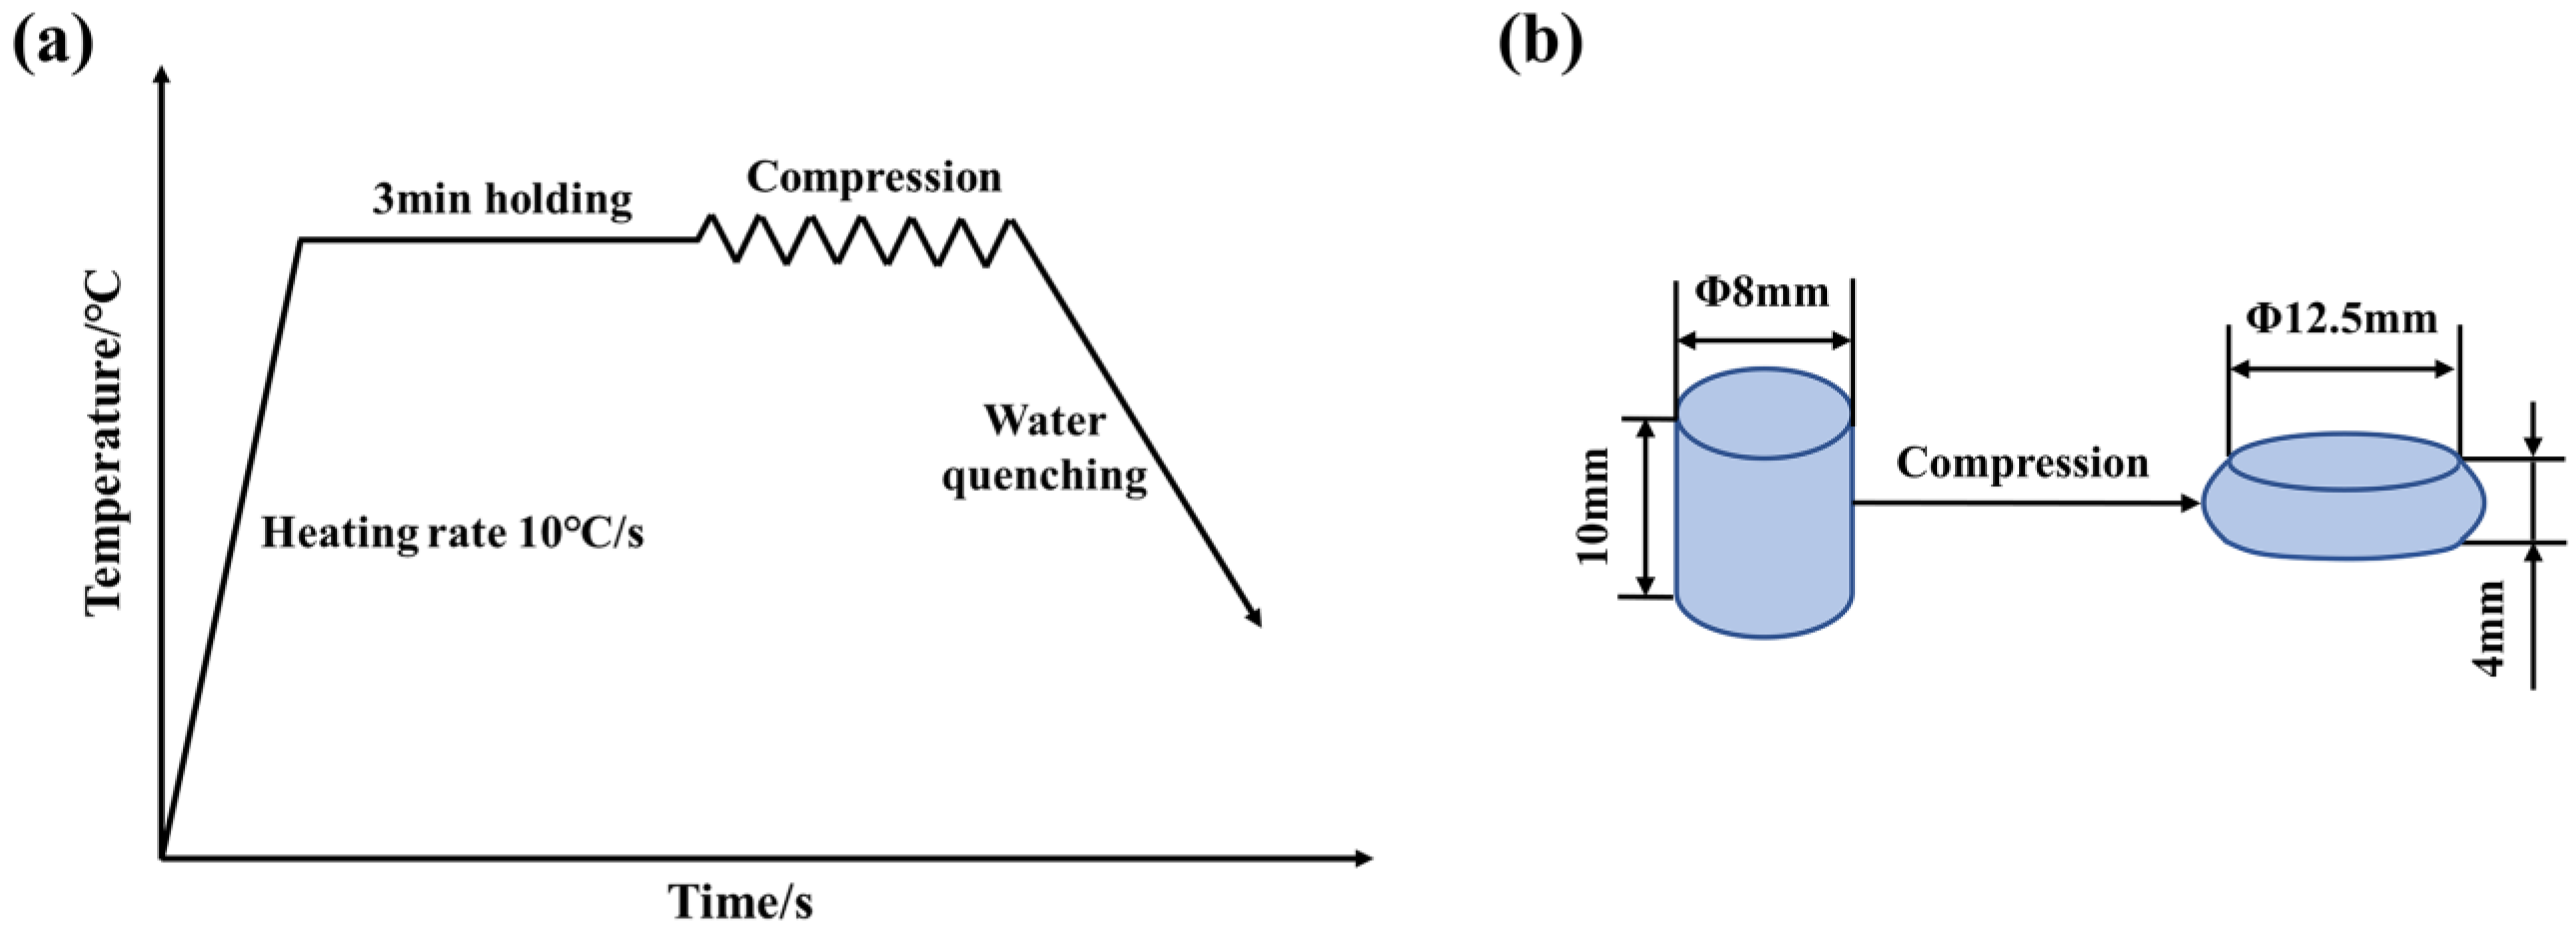
2. Materials and Methods

The 30Cr4MoNiV UHS steel in this study was provided by Hunan Valin Lianyuan Iron and Steel Co., Ltd. and chemical composition shown in Table 1. The Gleeble-3500 thermal simulation machine was used for isothermal compression tests and the specimen size was Φ 8 mm × 10 mm. The specimens were heated to 1173, 1223, 1273, 1323, and 1373 K, respectively, at a heating rate of 10 °C/s, and held isothermally for 3 min to ensure the specimens were completely austenitized, the accuracy of temperature measurements is +/−1 °C. Then, the specimens were compressed at strain rates of 0.01, 0.1, 1.0, and 10 s−1, respectively, with a deformation of 60%. After compression, the specimens were quenched in water immediately to retain the deformed microstructure. The schematic diagram of the hot compression tests is shown in Figure 1a. Figure 1b illustrates the schematic diagram of the specimens before and after compression.
The quenched specimens were sliced along the compression direction and etched with saturation picric acid to obtain the prior austenite grain boundaries. The microstructures of the specimens were observed by the FEI QUANTA200 (FEI, Hillsboro, OR, USA) scanning electron microscope (SEM).

3. Results and Discussion

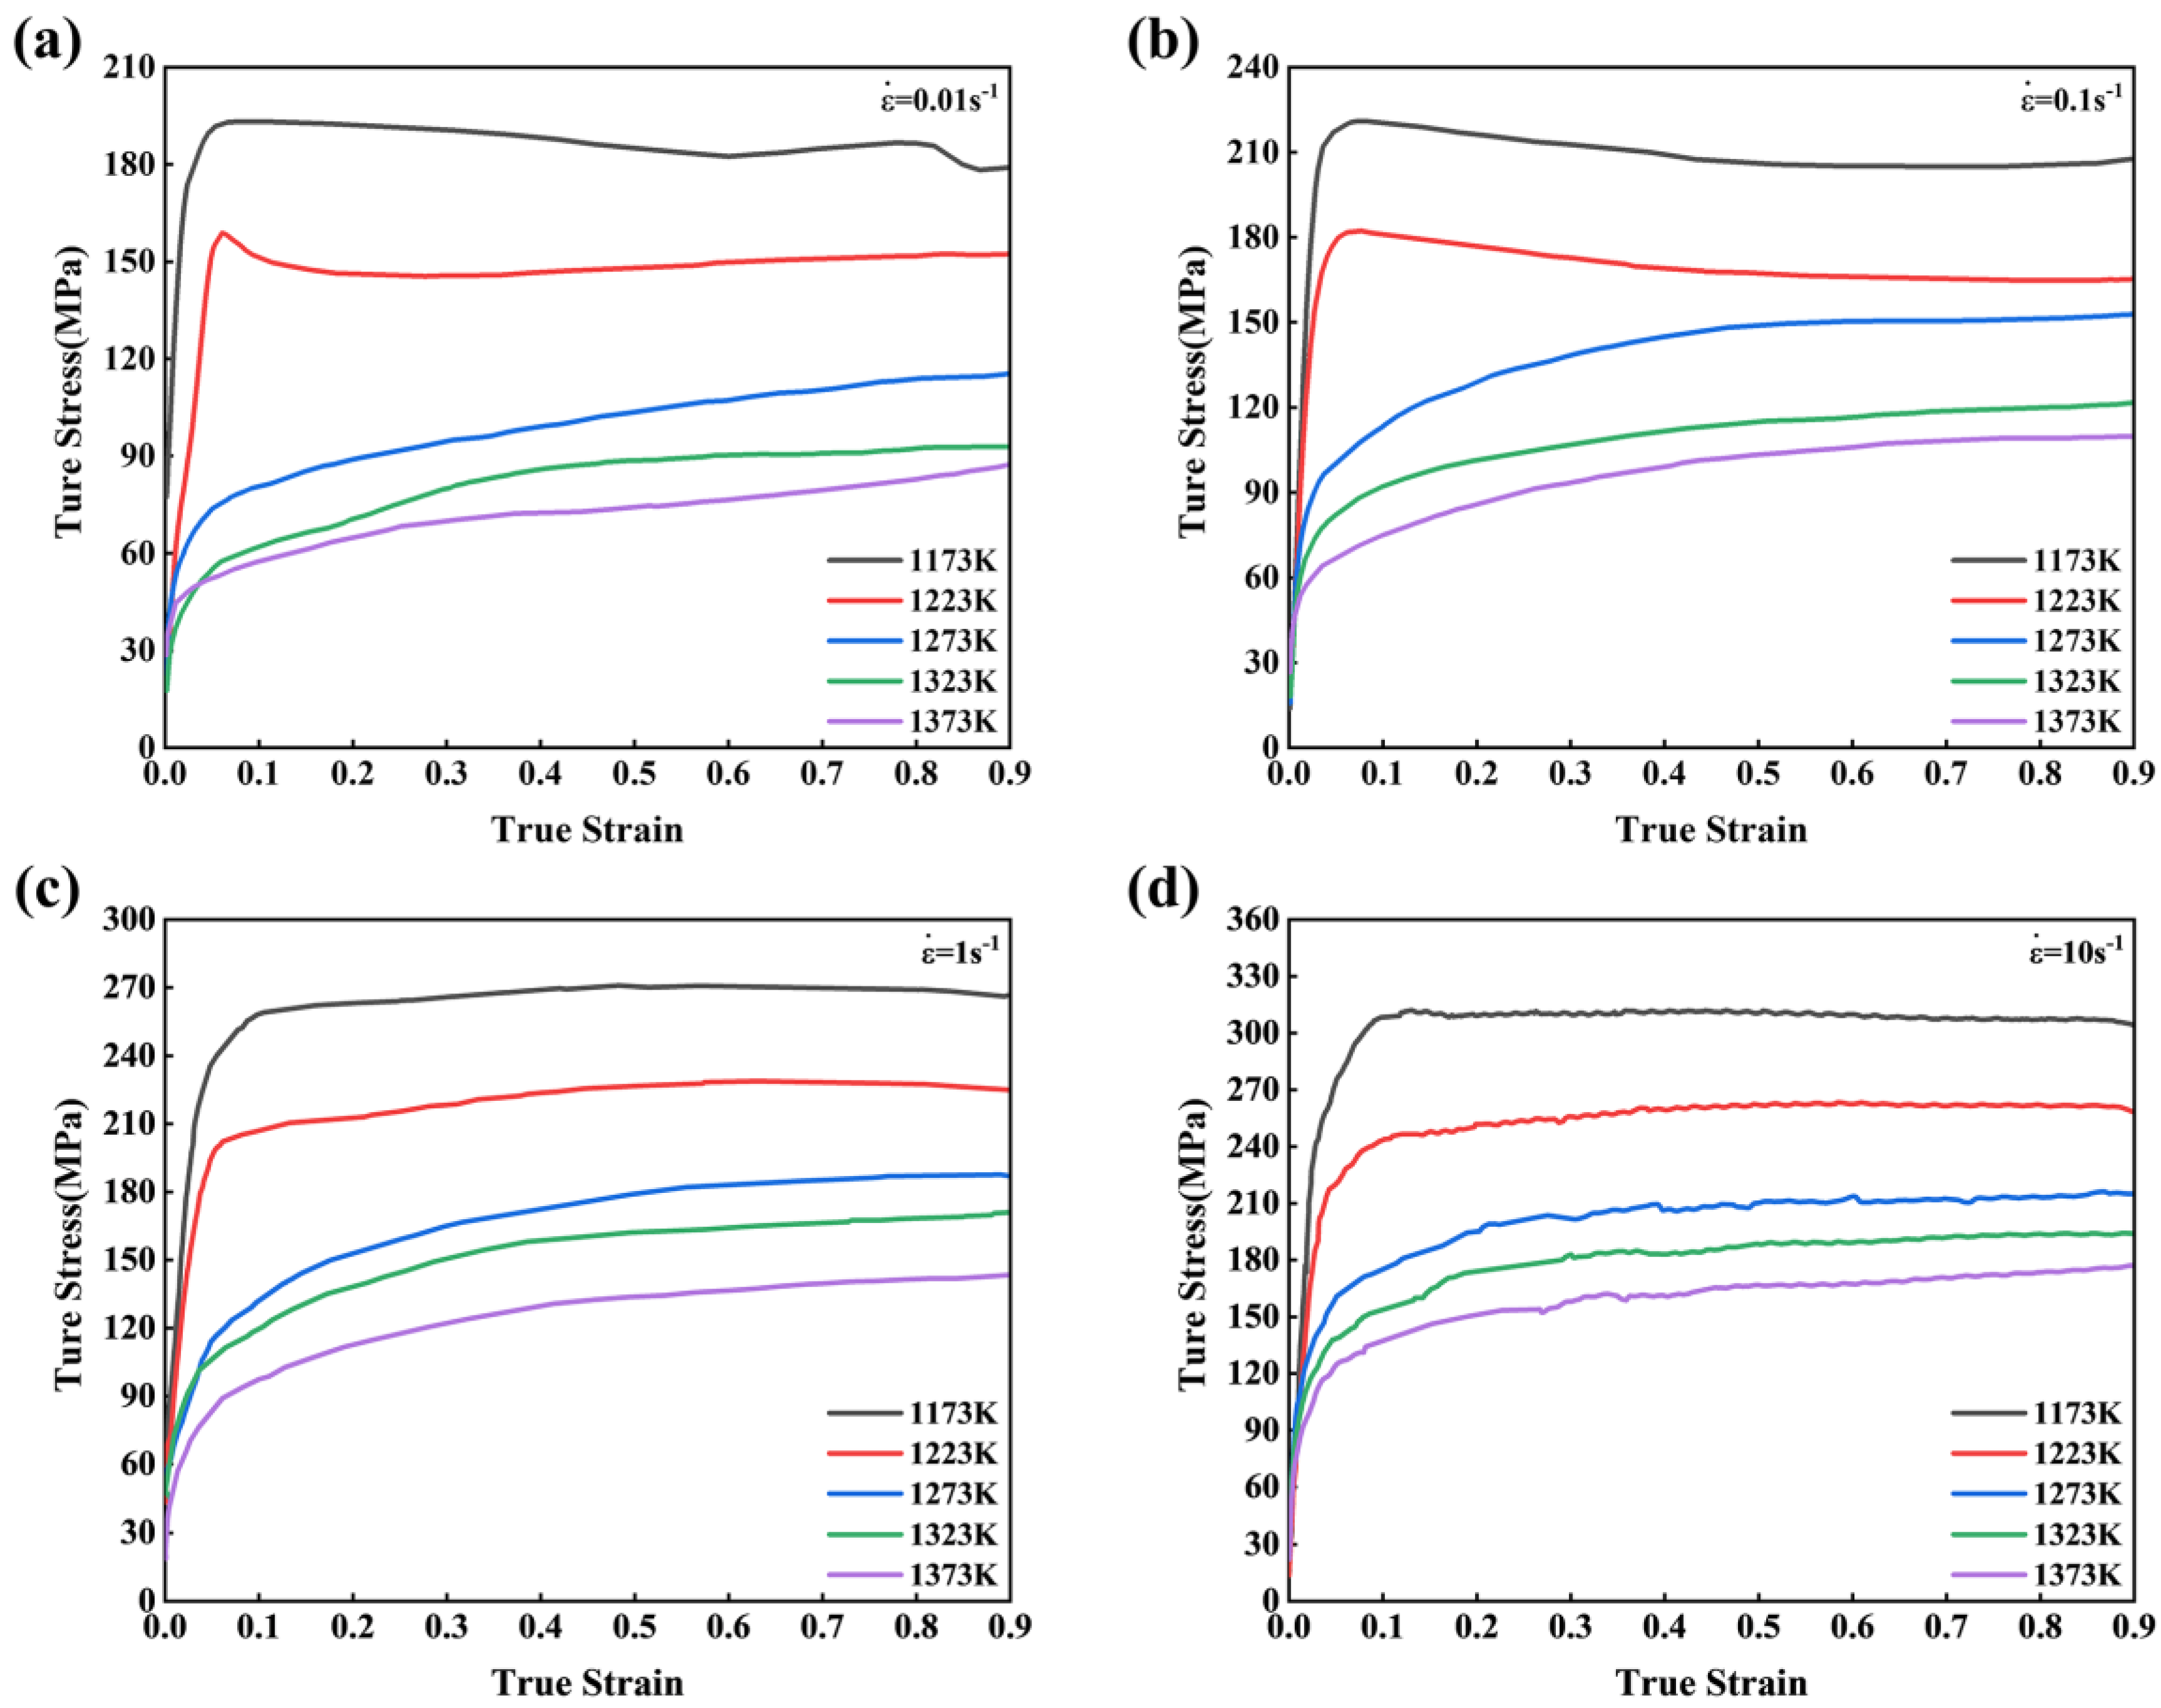
3.1. Stress-Strain Curves

Figure 2 shows the true stress-strain curves of the specimens under different conditions. The flow stress decreases with the increase of the deformation temperature, and increases with the increase of the strain rate, while a similar phenomenon was reported by Xu et al. [24] and Chen et al. [25]. It is worth noting that the curves do not show the characteristics of a typical single peak at a high temperature of 1273–1373 K, but the flow stresses rise slowly with the increase of strain, which may be due to the effect of strong carbide forming elements such as V (0.3472 wt. %) in 30Cr4MoNiV UHS steel, which retards the movement of grain boundaries and delays the effect of DRX, thereby shifting peak strain to the right. Besides, the true stress-strain curves at a strain rate of 10 s−1 have a zigzag or wavy characteristic, which is usually regarded as a sign of DSA, as reported in the paper by Ivanchenko et al. [26].

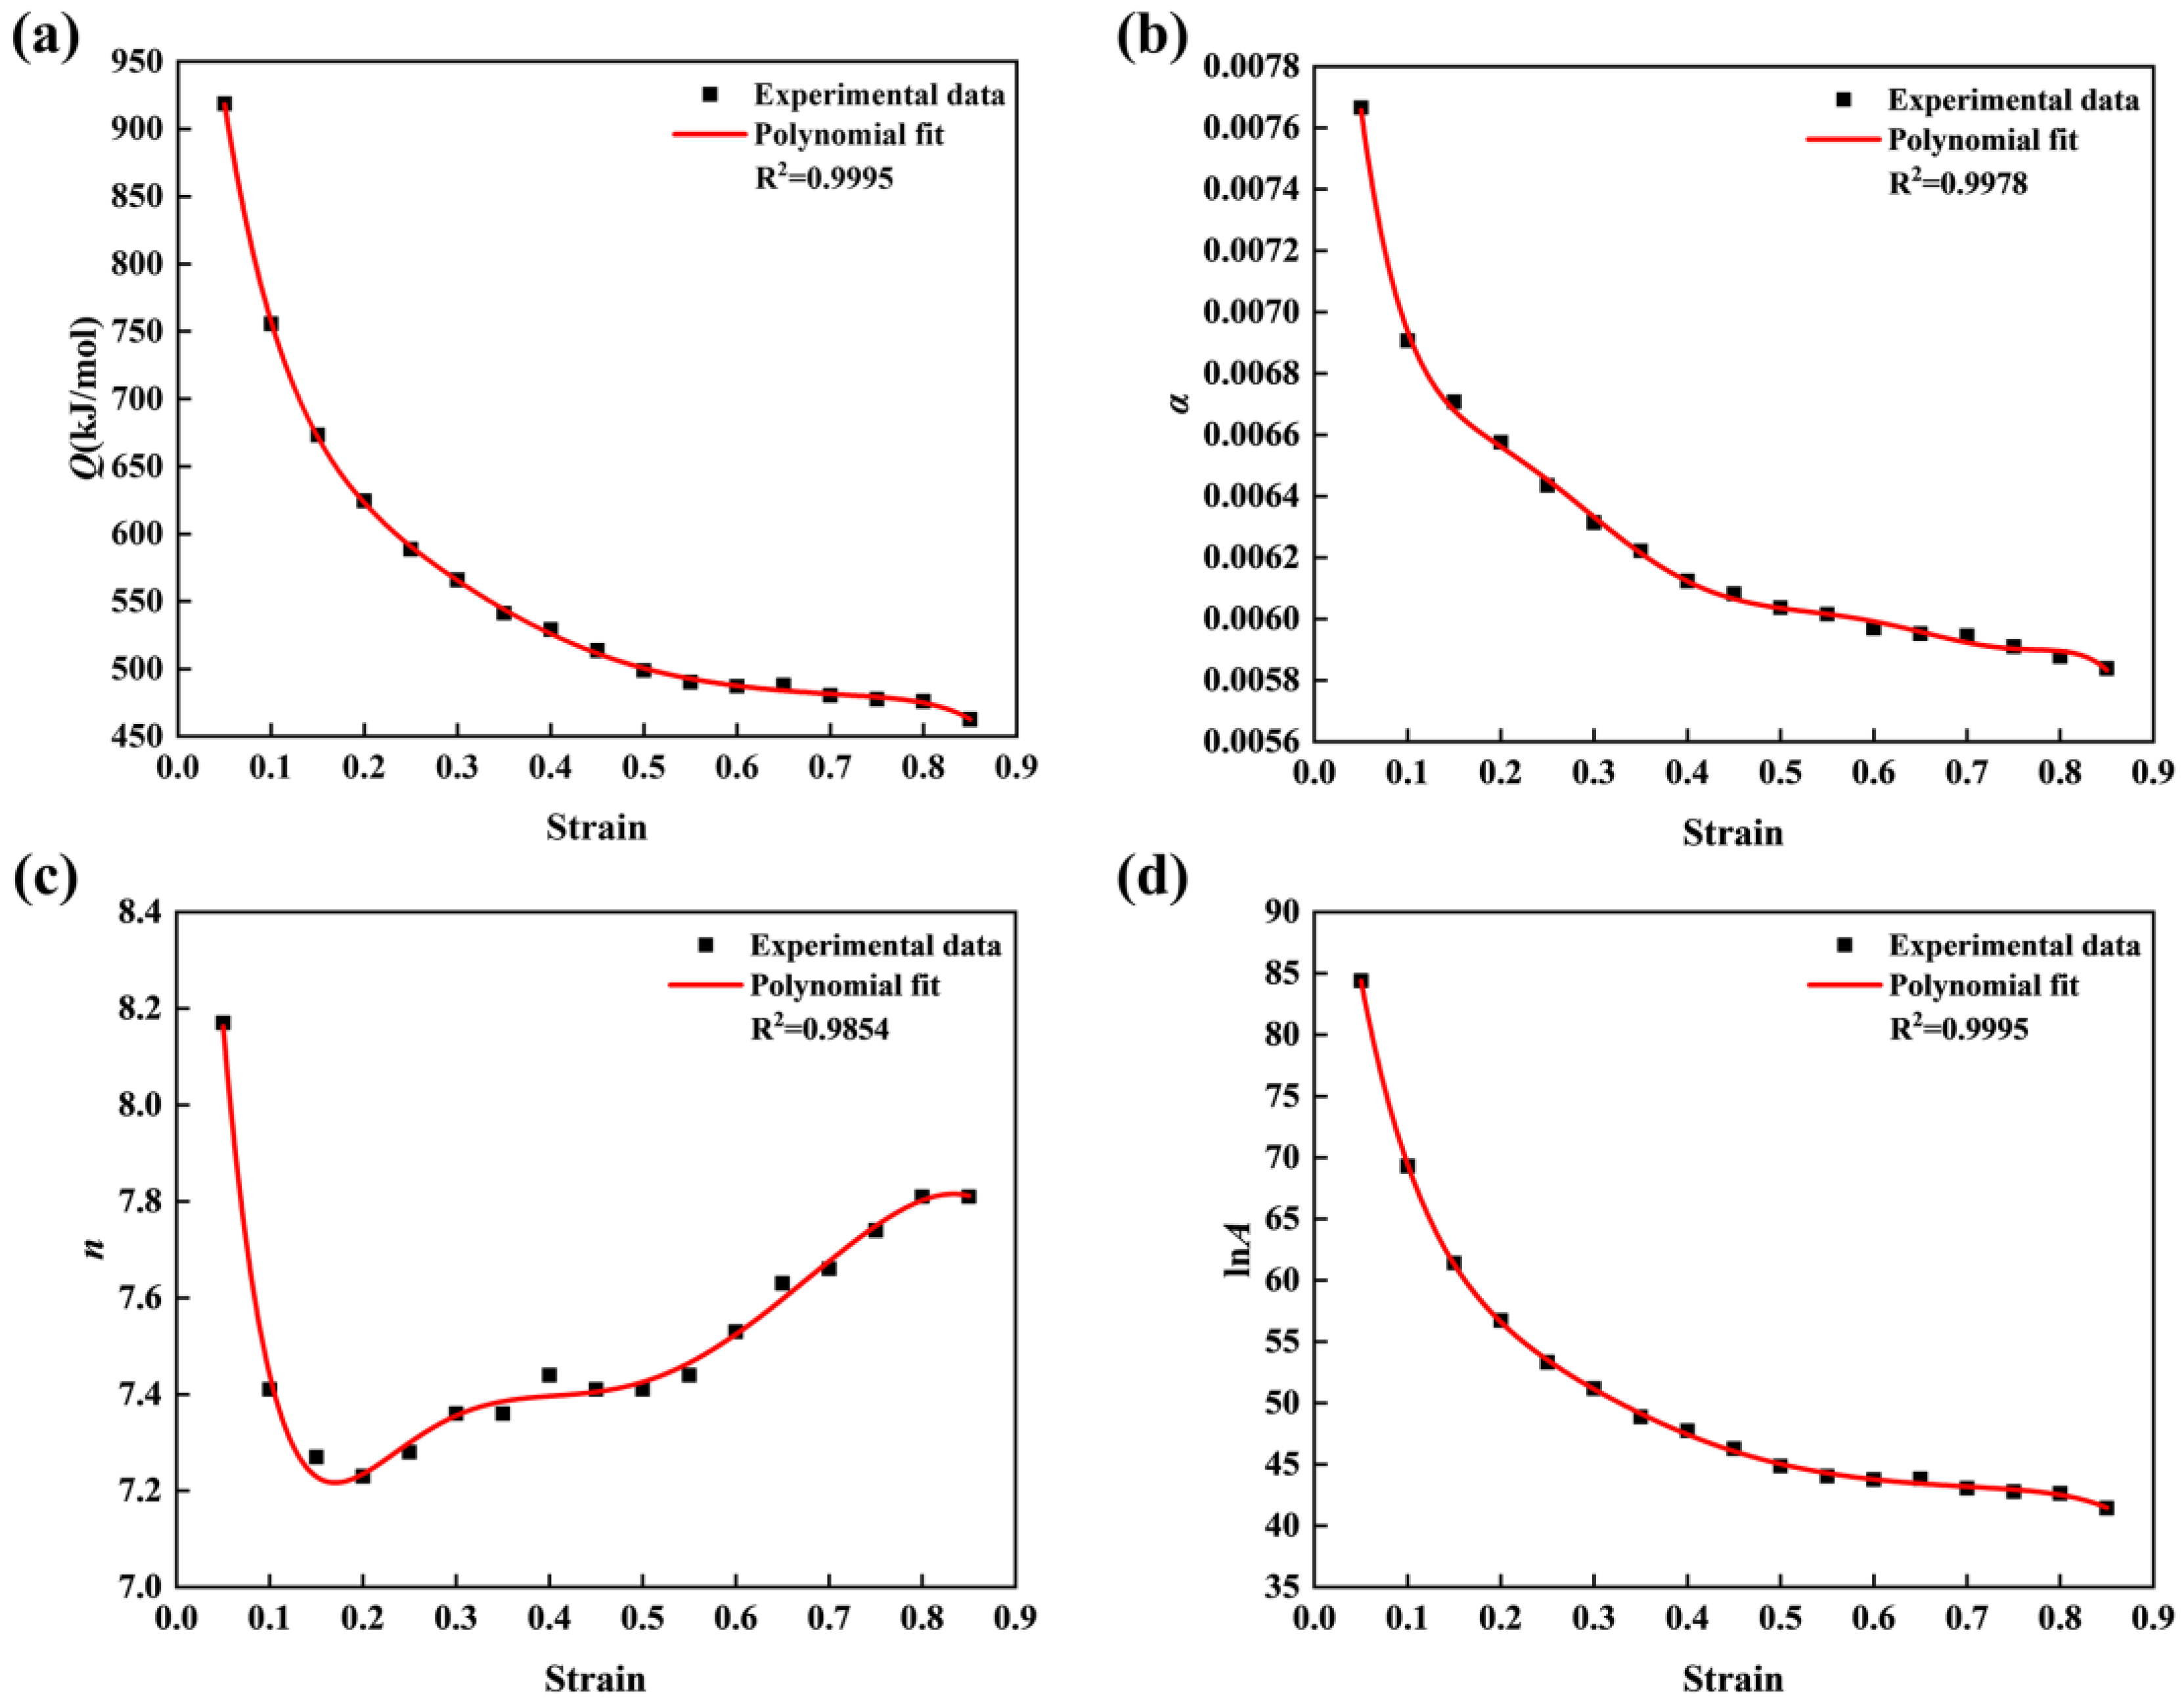
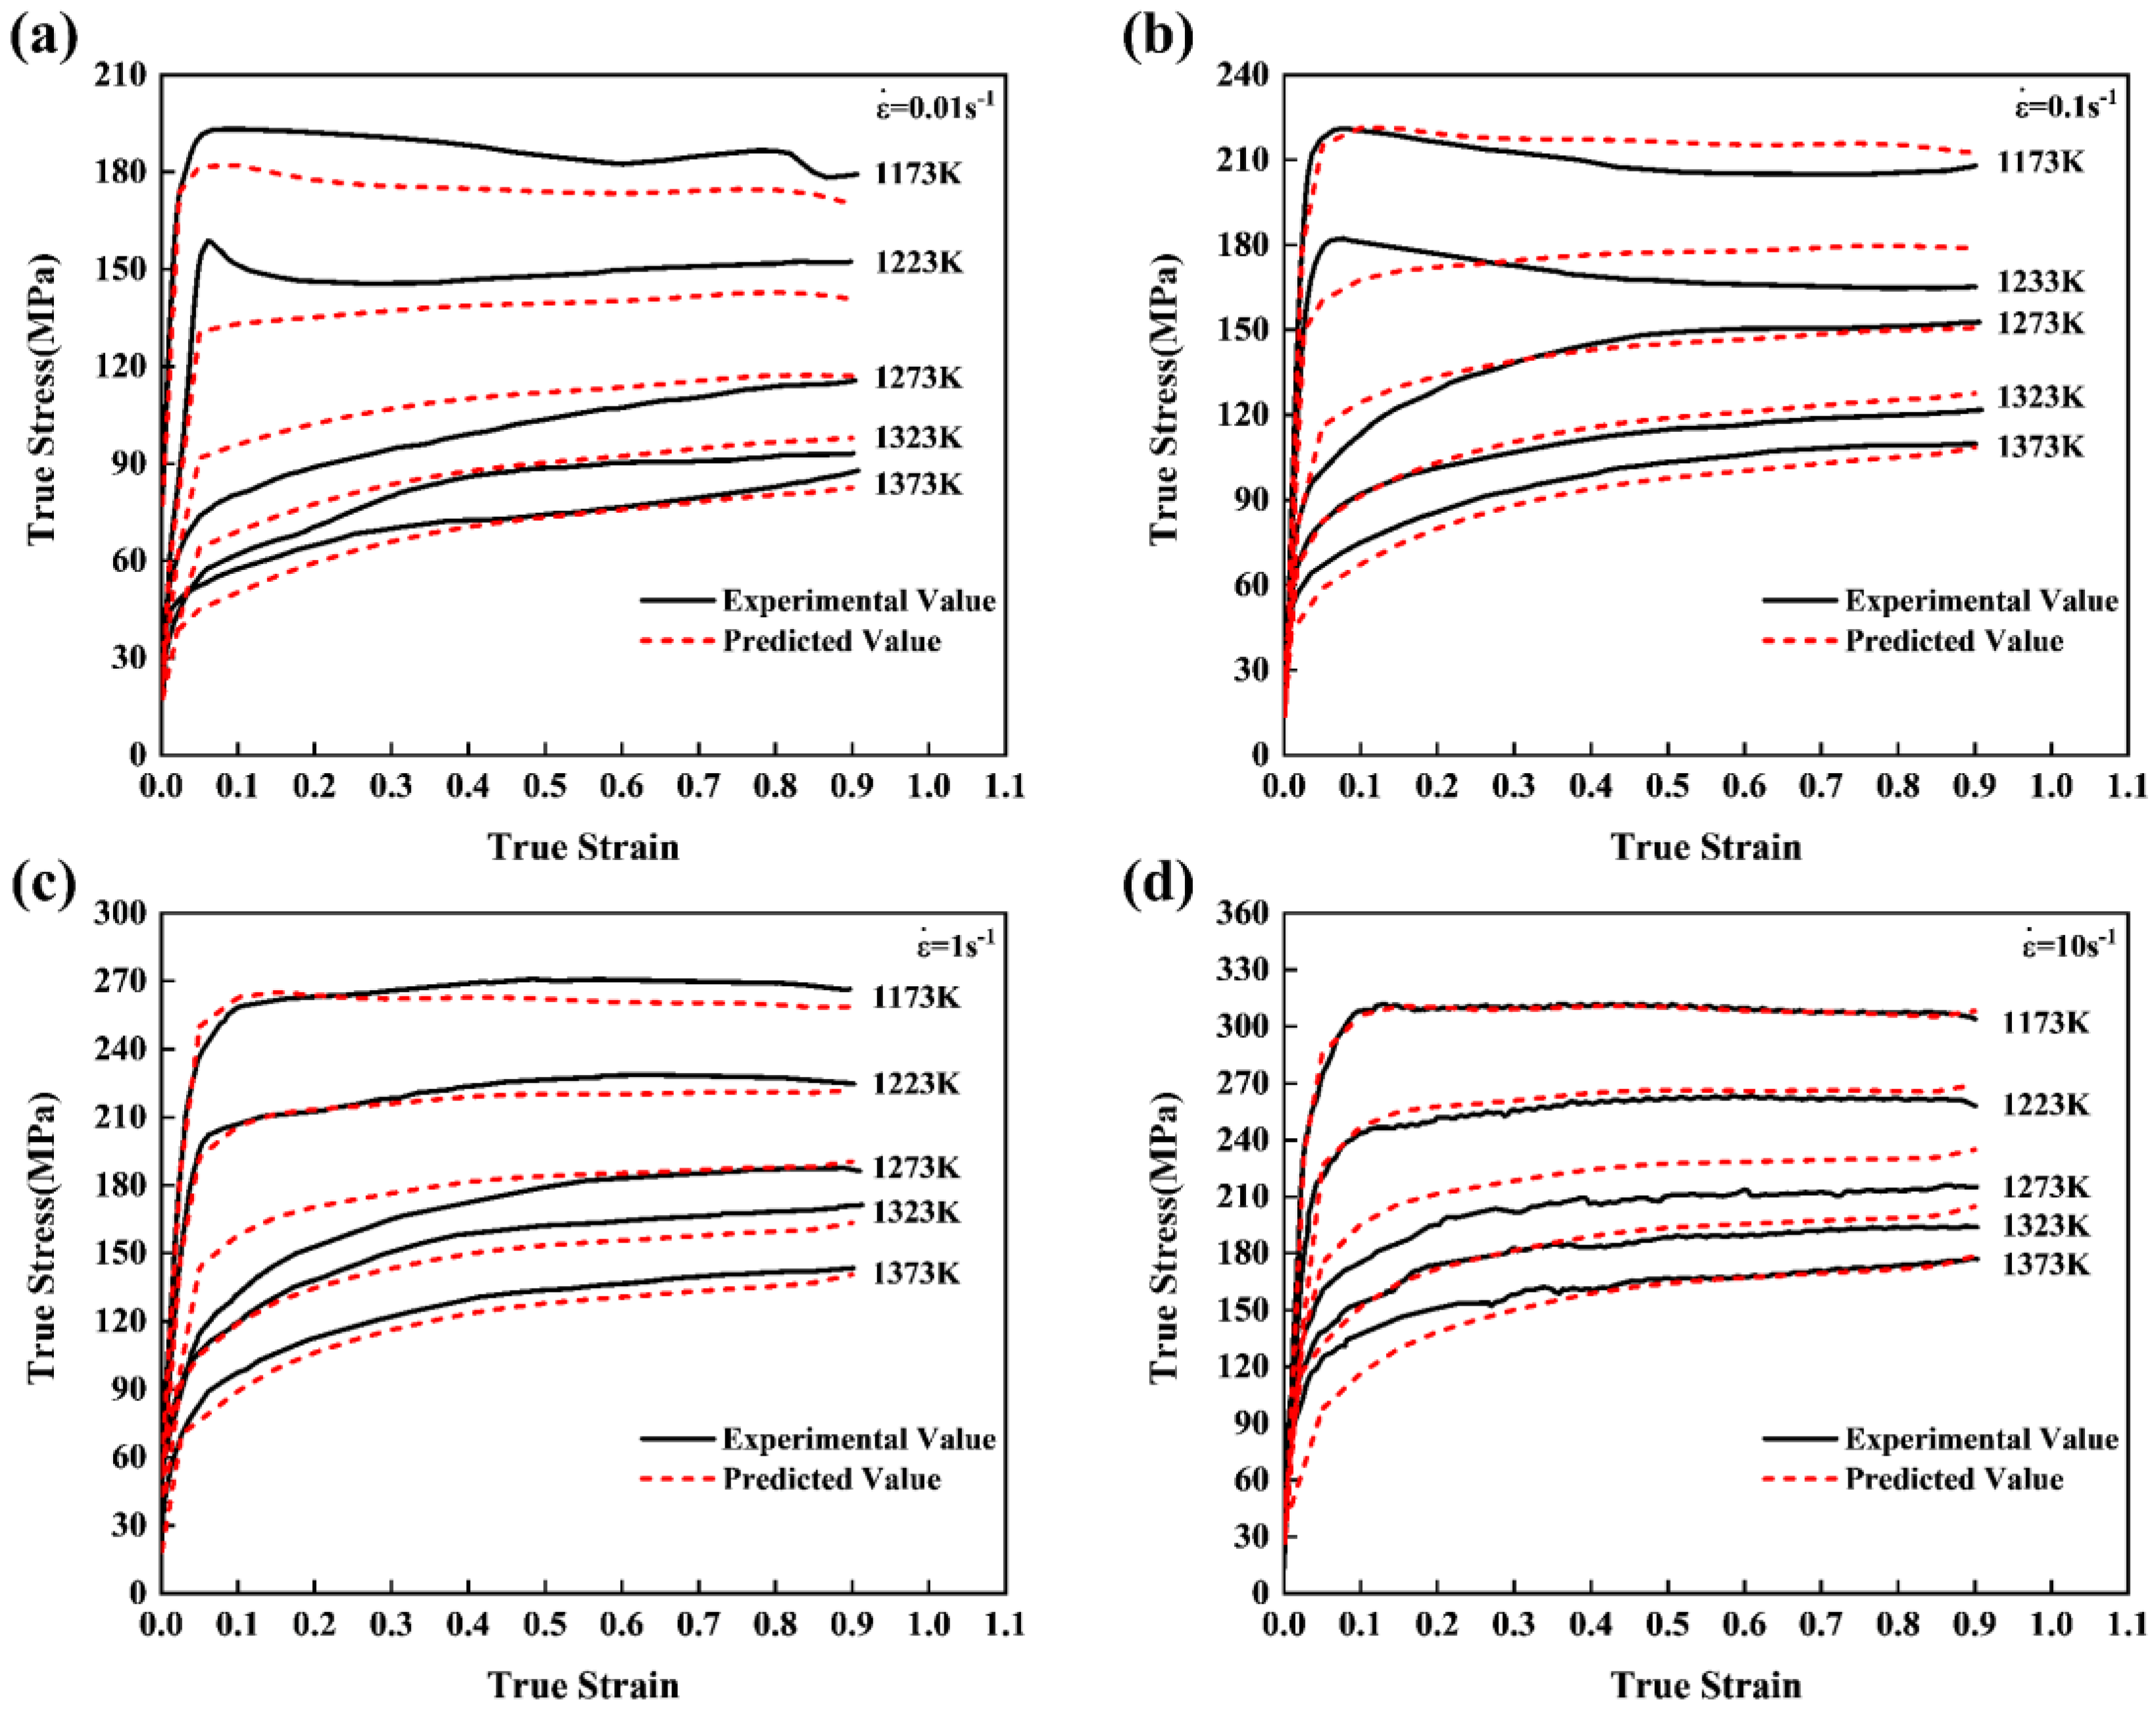
3.2. Constitutive Equation

In the hot working process of metal materials, once the chemical composition is determined, the flow stress is mainly determined by the strain rate and the deformation temperature. The Zener-Hollomon parameter (Z) [27] is usually used to quantify the relationship between flow stress, deformation temperature, and strain rate.
Z = ε ˙ exp ( Q R T ) = f ( σ )
where Z is the temperature-compensated strain rate, ε ˙ is the strain rate (s−1), Q is the activation energy ( J · mol 1 ), R is the gas constant (R = 8.314 J · mol 1 · K 1 ), T is the deformation temperature (K), σ is the flow stress (MPa) and f (σ) is the flow stress expression.
There are three expressions of f (σ), as shown in Equations (2)–(4) [28]. The power law (Equation (2)) is usually used in the case of low stress (ασ < 0.8), for the case of high stress (ασ > 1.2), the exponential law (Equation (3)) is the best choice, and the hyperbolic sine function (Equation (4)) can take both into account.
f ( σ ) = A 1 σ n 1
f ( σ ) = A 2 exp ( β σ )
f ( σ ) = A 3 [ sinh ( α σ ) ] n 2
where A1, A2, A3, n1, n2, β and α (≈β/n1) are the material-dependent constants independent of the deformation temperature. The stress multiplier α is an adjustable constant that brings ασ into the correct range to make constant T curves of ln ε ˙ versus ln [ sinh ( α σ ) ] constant, as reported in the paper of Mirzadeh et al. [29] and McQueen [30].
Table 2 lists the peak flow stress (σP) values in the temperature range of 1173–1373 K and the strain rate of 0.01–10 s−1. Since the strain for determination of flow stress is not specified, the description of the flow stress in Equation (1) is incomplete. Therefore, the steady-state stress, the peak stress, and the stress corresponding to a particular strain can be used for this purpose. However, the peak stress is usually used because the steady-state stress cannot be accurately obtained, or there has been some softening during the morphological evolution; similar findings were reported by Cai et al. [31] and Chen et al. [32].
When the deformation temperature T is a constant, the activation energy Q can be regarded as a constant. By substituting Equations (2)–(4) into Equation (1) and taking the natural logarithm for each term, the peak stress expressions can be derived.
ln ε ˙ = n 1 ln σ P + ln A 2 Q R T
ln ε ˙ = β σ P + ln A 2 Q R T
ln ε ˙ = n 2 ln [ sinh ( α σ P ) ] + ln A 3 Q R T
The strain rate is constant, the Equation (8) of peak stress can be obtained.
ln [ sinh ( α σ P ) ] = Q n 2 R · 1 T + ln ε ˙ ln A 3 n 2
Figure 3 shows the relationship plots of ln ε ˙ - ln σ P , ln ε ˙ - σ P , ln ε ˙ - ln [ sinh ( α σ P ) ] , ln [ sinh ( α σ P ) ] - 1 / T and ln Z - ln [ sinh ( α σ P ) ] . The n1 value can be evaluated using the slope of curve of ln ε ˙ - ln σ P (Figure 3a) and β is determined using the slope of the curve of ln ε ˙ - σ (Figure 3b). The values of n1 and β are evaluated by taking an average of slopes at different temperatures. For the peak stresses, the n1, β and α are calculated as 11.278, 0.0655, and 0.00581 respectively. Furthermore, the slopes of curves ln ε ˙ - ln [ sinh ( α σ P ) ] (Figure 3c) and ln [ sinh ( α σ P ) ] - 1 / T (Figure 3d) are used to calculate n2 and Q. The average values of n2 and Q were found to be 8.343 and 520.815 kJ · mol 1 . By comparing the similar steels with different compositions, such as 3Cr-1Si-1Ni UHS steel (431.2376 kJ · mol 1 ) in the paper of Lei et al. [6], 30Si2MnCrMoVE low-alloying UHS steel (362.48278 kJ · mol 1 ) in the paper of Wang et al. [33], and Nb–V–Ti micro-alloyed UHS steel (407.29 kJ · mol 1 ) in the paper of Dong et al. [34]. It has been found that the activation energy is significantly affected by the chemical composition. According to Equations (1) and (4), the A3 can be determined by the average intercept of the curve of ln Z - ln [ sinh ( α σ P ) ] (Figure 3e). The A3 is 1.951 × 10²⁰ (lnA3 = 46.72). The constitutive equation with optimized the material-dependent constants is as follows:
ε ˙ = 1.951 × 10 20 [ sinh ( 0.00581 σ ) ] 8.3 exp ( 520,815 8.314 T )
Obviously, Equation (9) is only a flow stress equation related to deformation temperature and strain rate, without considering the factor of strain. The material-dependent constants and activation energy are affected by strain and accord with the polynomial relation, which were reported by Cai et al. [35] and Lin et al. [5]. Furthermore, the constants and activation energies under different strains are evaluated in this work to obtain the intrinsic relationship between the material-dependent constants, activation energy, and strain, and the constitutive equations with the strain compensation are established.
The calculation flow chart of the material-dependent constants and activation energy is shown in Figure 4. The material-dependent constants and activation energies are calculated in the strain range of 0.05–0.85 (the interval is 0.05). Figure 5 shows the curves of the material-dependent constants concerning strain (fitted by polynomial Equation (10)). In Figure 5, the correlation coefficients (R2) are all greater than 0.985, and the highest is 0.9995, which indicates that the accuracy of the fitted curves is very high. The S in Equation (10) stands for any material-dependent constant (Q, α, n, and A) in Figure 4. The coefficients of the best fitting polynomial for any material constant are listed in Table 3.
S ( ε ) = B 0 + B 1 ε + B 2 ε 2 + B 3 ε 3 + B 4 ε 4 + B 5 ε 5 + B 6 ε 6 + B 7 ε 7
Now, the constitutive equation considering strain compensation is.
{ ε ˙ = A ( ε ) [ sinh ( α ( ε ) σ ) ] n ( ε ) exp ( Q ( ε ) 8.31 ) Q ( ε ) = 1219.8 8053.2 ε + 48,062 ε 2 168,839.7 ε 3 + 350,611.4 ε 4 424,298.8 ε 5 + 277,595.7 ε 6 76,115.6 ε 7 α ( ε ) = 0.0095 0.0543 ε + 0.438 ε 2 1.9073 ε 3 + 4.6357 ε 4 6.3124 ε 5 + 4.504 ε 6 1.3113 ε 7 n ( ε ) = 9.9 49.3 ε + 350.2 ε 2 1248.3 ε 3 + 2481 ε 4 2796.6 ε 5 + 1684.1 ε 6 424.1 ε 7 ln A ( ε ) = 111.7 722.8 ε + 4164.1 ε 2 14,174.7 ε 3 + 28,607.5 ε 4 33,725.3 ε 5 + 21,550.6 ε 6 5790.6 ε 7
Figure 6 illustrates the comparison result between predicted values and experimental values in the temperature range of 1173–1373 K with a strain rate of 0.01–10 s−1. The predicted values are obtained by Equation (11). The results show that the above-derived constitutive equation can accurately predict the flow stress of the material, especially at higher deformation temperatures, which can provide the main theoretical guidance for the actual production of UHS steel.
To further evaluate the applicability and accuracy of Equation (11), the correlation coefficient R is introduced, as presented in the paper by Li et al. [36]. R represents the correlation between the predicted values and the experimental values. The closer the value of R is to 1, the more accurate Equation (11) is. The formula of R is as follows:
R = i = 1 N = ( E i E ¯ ) ( P i P ¯ ) i = 1 N ( E i E ¯ ) 2 i = 1 N ( P i P ¯ ) 2
In the Equation (12), Ei and Pi are the experimental and predicted values at different strains, E ¯ and P ¯ are the corresponding average values, and N is the amount of data.
Figure 7 describes the correlation between the predicted values and the experimental values in the temperature range of 1173–1373 K with strain rates of 0.01–10 s−1. The R is 0.9906, very close to 1. The results show that the flow stress of 30Cr4MoNiV UHS steel can be accurately predicted by Equation (11) in the temperature range of 1173–1373 K and a strain rate of 0.01–10 s−1.

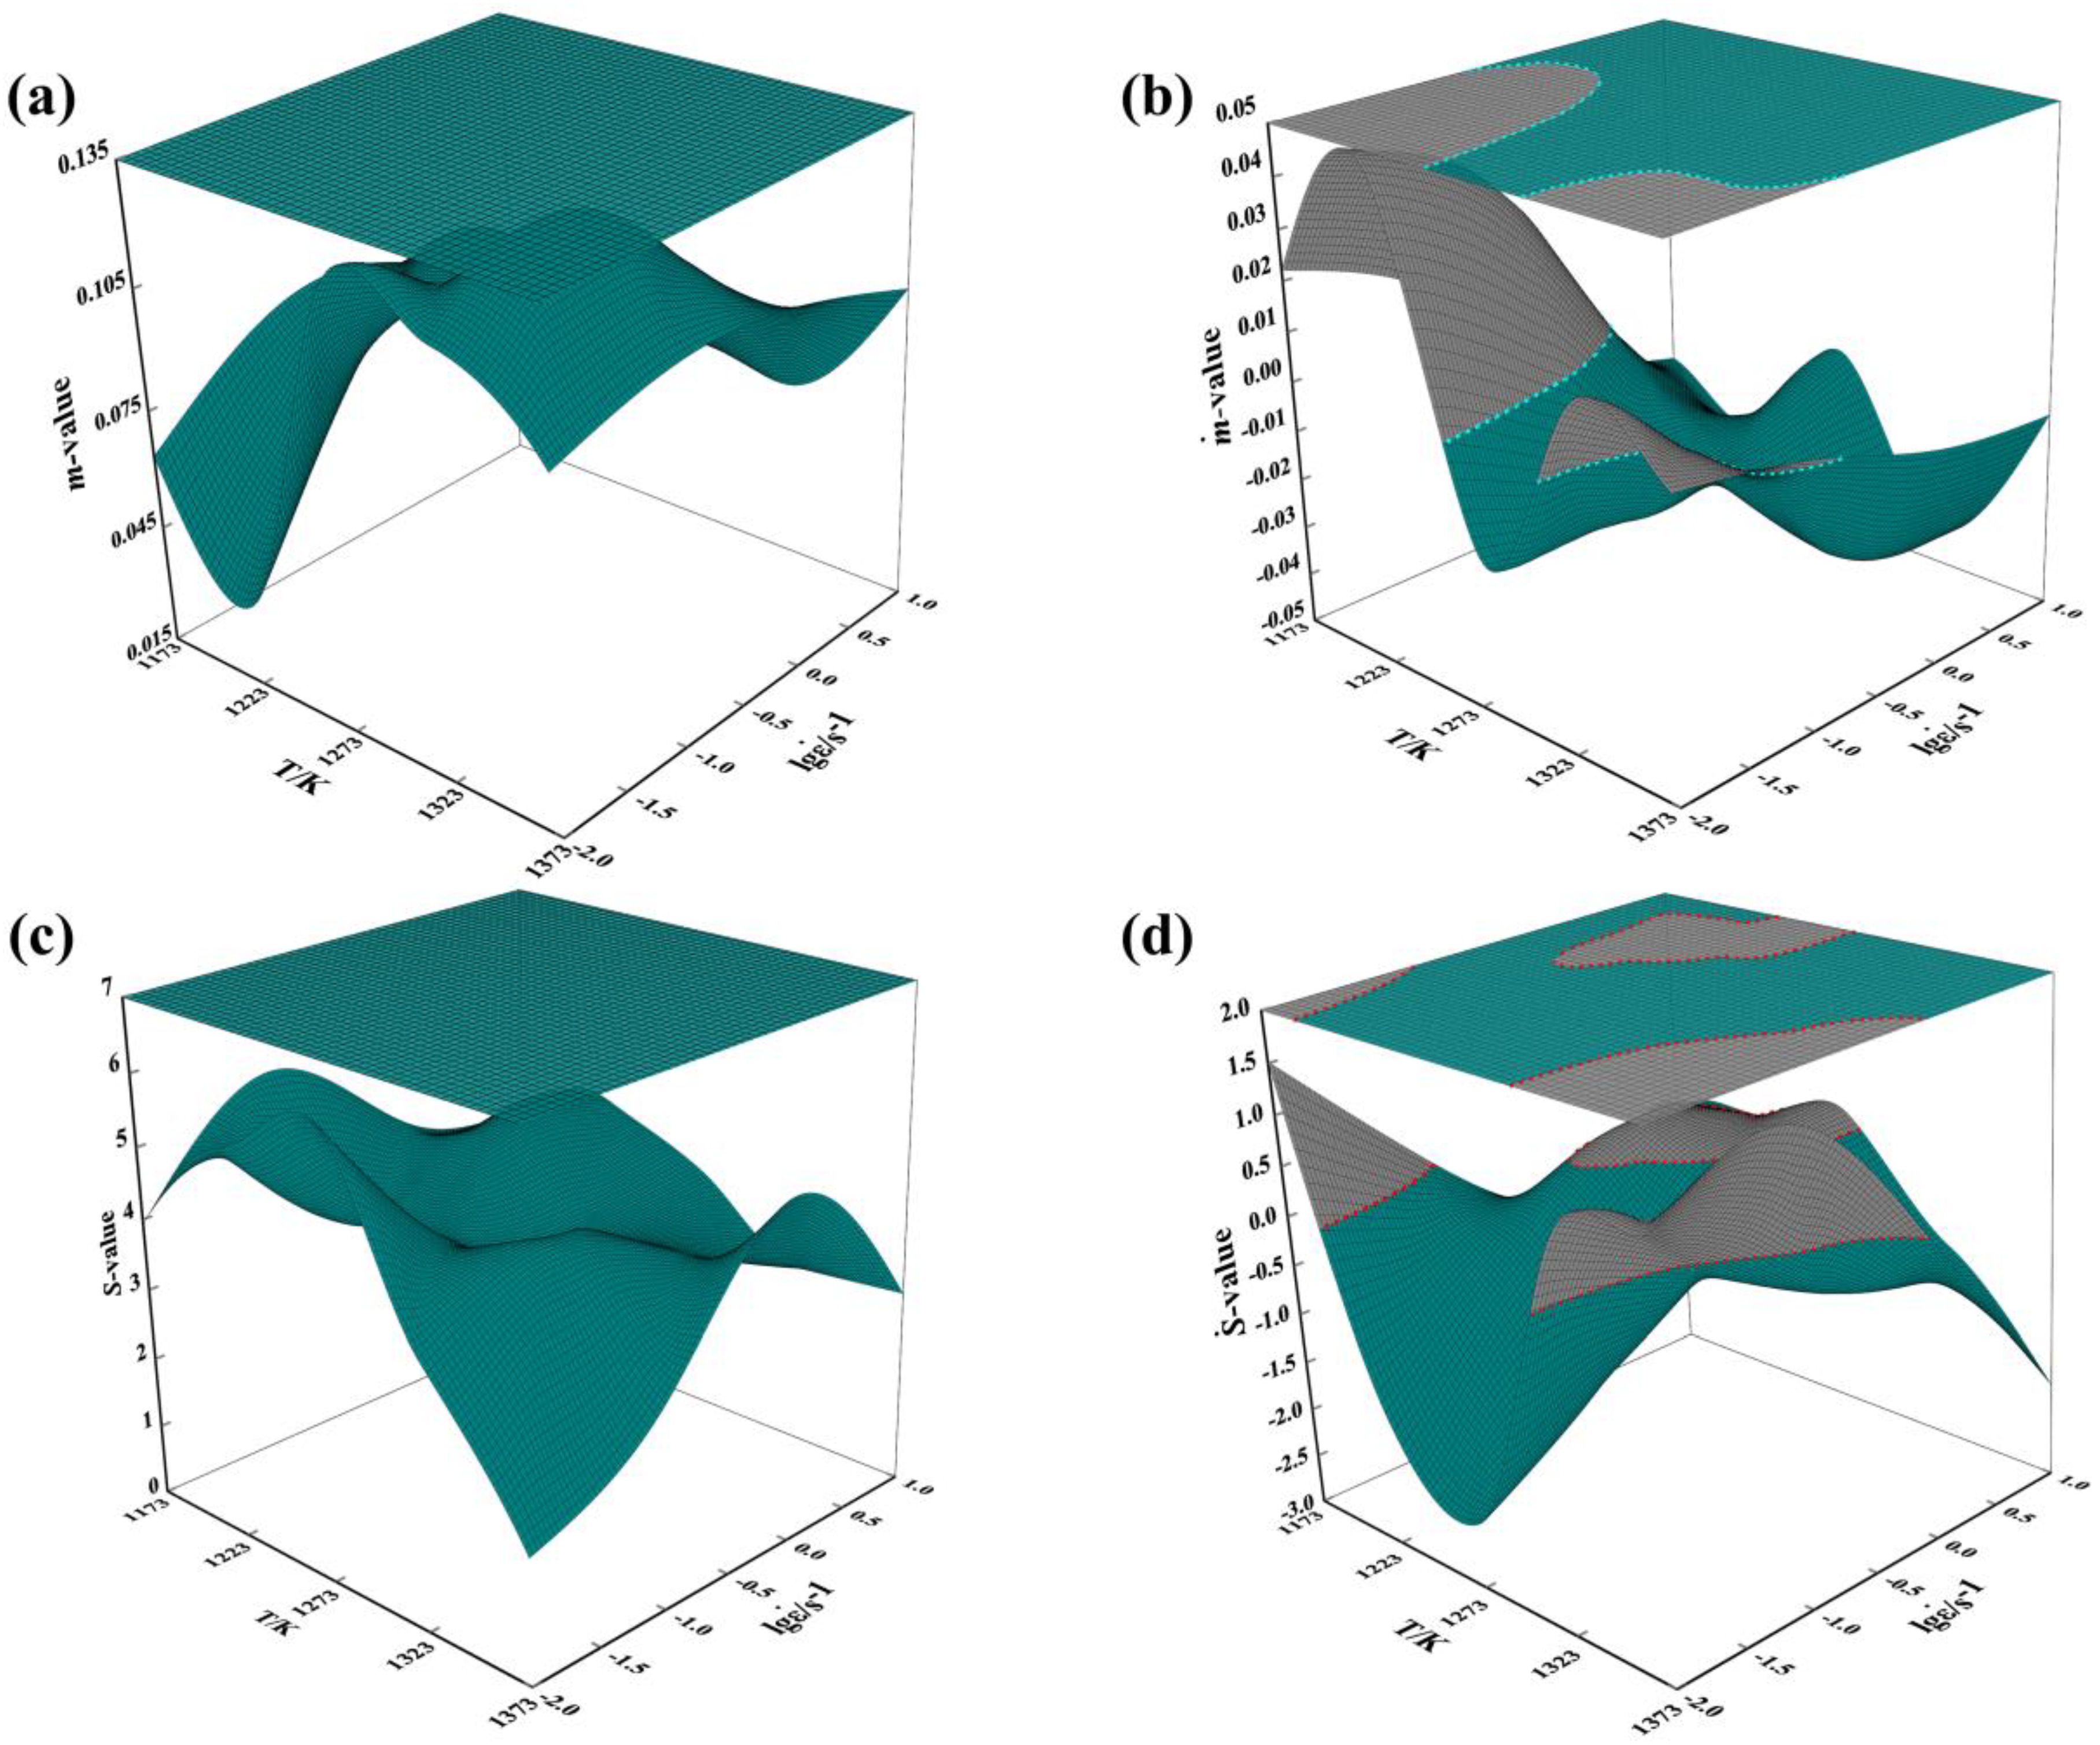
3.3. Processing Maps and Plastic Instability
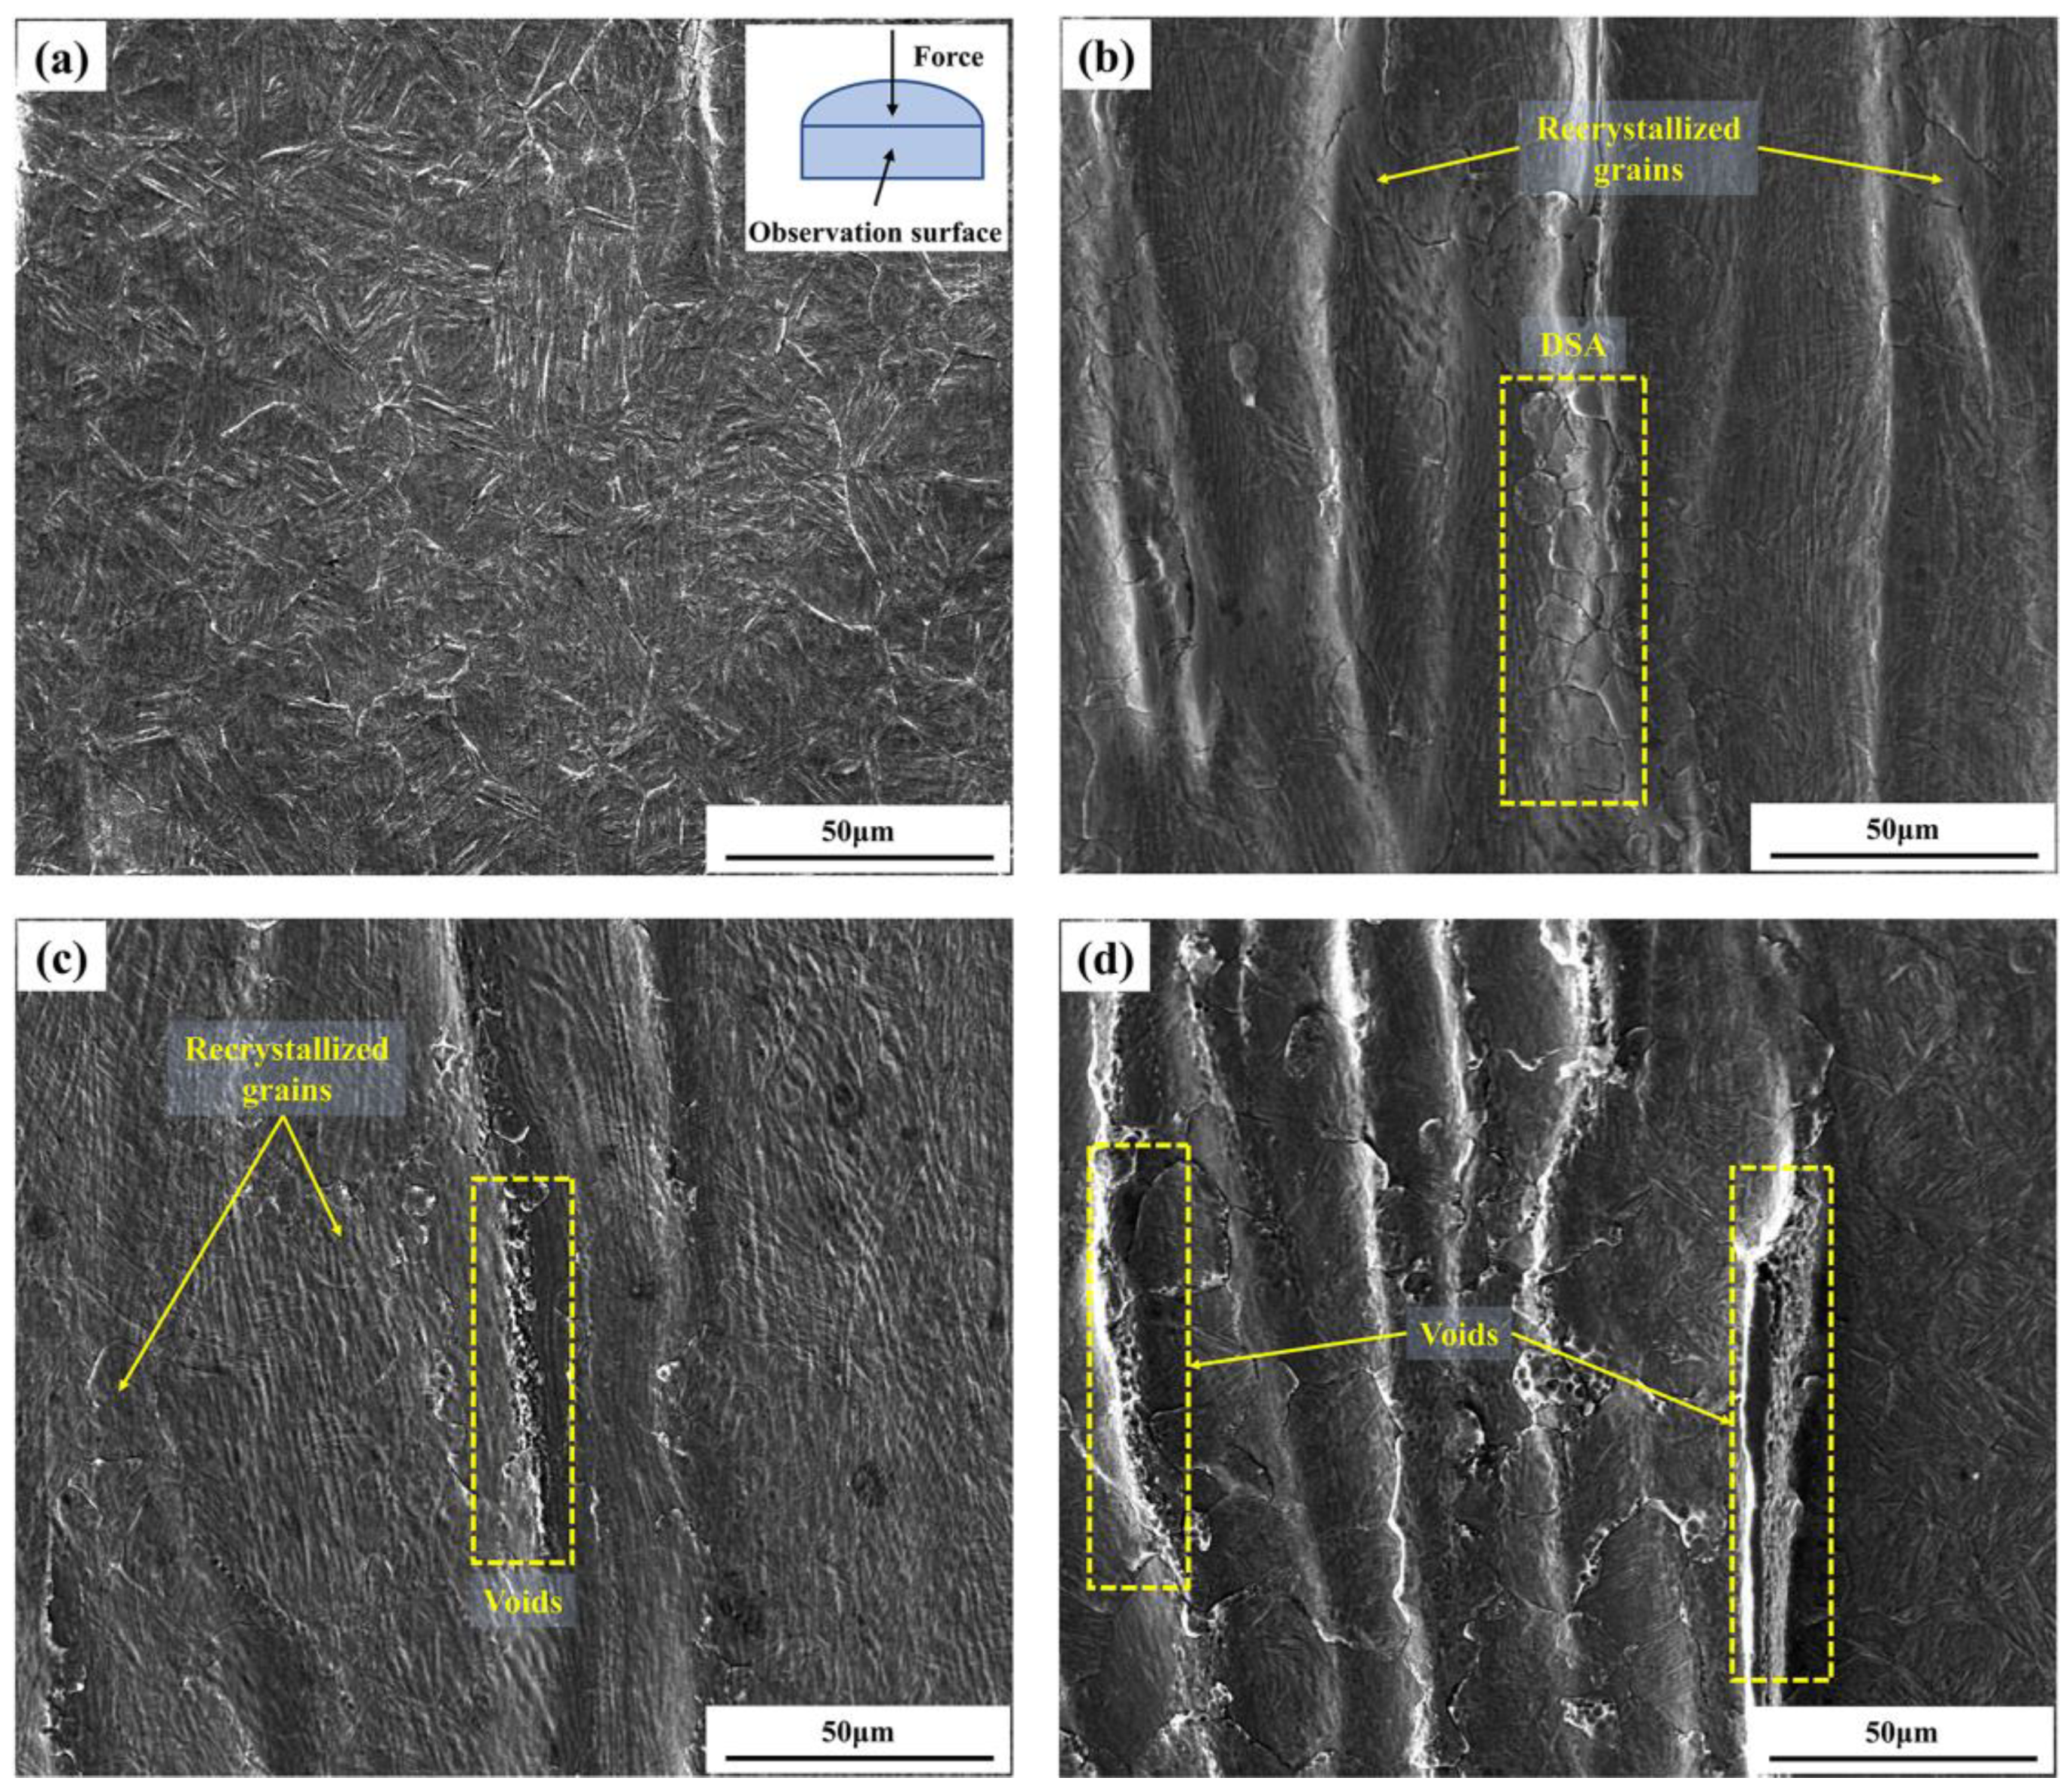
The constitutive equation can predict the flow stress of various materials during hot working, and provide certain theoretical guidance for the processing of materials, but this is not enough to optimize the machinability of the material. To obtain good hot workability, it is necessary to choose processing conditions that avoid microstructure damage and instability during processing, which often require the help of the processing maps proposed by Prasad [23]. The processing maps based on DMM can be used to optimize the processing technology of the material, which has a good guiding effect on the control of the microstructure of the material, and is widely used in various metal materials [10,37].
According to the DMM, the workpiece is regarded as a power dissipator, and the total dissipated power (P) absorbed from the outside can be divided into two parts of G and J, where G is the power dissipation due to plastic deformation and J represents the power dissipation caused by microstructure transformation. It was given by Prasad [23].
P = G + J = 0 ε ˙ σ d ε ˙ + 0 σ ε ˙ d σ
Under certain temperature and strain conditions, the constitutive equation can be used to simply describe the relationship between flow stress σ and strain rate ε ˙ .
σ = K ε ˙ m
where σ is the flow stress (MPa), ε ˙ is the strain rate (s−1), K is a constant, and m is the strain rate sensitivity, which is defined as follows:
m = [ J G ] ε , T = [ ( lg σ ) ( lg ε ˙ ) ] ε , T
Combining Equations (13)–(15), the J can be obtained.
J = m m + 1 σ ε ˙
For the ideal linear dissipation case, m = 1, where J reaches the maximum, J max = P / 2 . The power dissipation (η) is defined as the ratio of J to J max and can be expressed by Equation (17).
η = J J max = 2 m m + 1
At a certain strain, the power dissipation map is obtained by plotting the variation of η value with deformation temperature and strain rate. Generally, the higher the value of η is, the better the processing performance is. However, excessive η is likely to cause plastic instability. Prasad [23] deduced the following criterion for the continued instability of plastic deformation.
ξ ( ε ˙ ) = ln [ m / ( m + 1 ) ] ln ε ˙ + m < 0
The instability parameter ξ depends on the deformation temperature and strain rate. When it is negative, plastic instability will occur, and the area composed of all negative values is the processing instability area. The physical meaning of the instability parameter is that if the system is not able to generate entropy at a rate that at least matches with the imposed rate, the system will localise the flow and cause flow instability. Based on the change of ξ value with deformation temperature and strain rate, the instability map is established. The processing maps can be obtained by superimposing the power dissipation maps and the instability maps.
Figure 8 shows the processing maps with strains of 0.3, 0.6, and 0.9, respectively. The shaded areas are plastic instability, and the η values are distinguished by different colored areas in Figure 8. The η characterizes the rate of microstructure evolution during the hot working process. Therefore, Quan et al. [16]. believed that the power dissipation maps can be used to gain insight into the evolution of the microstructure. It can be seen from Figure 8 that the η value depends not only on the deformation temperature and strain rate, but also on the strain. The region with η < 0.1 is mainly concentrated at low temperature (1173–1223 K) and low strain rate (0.01–0.1 s−1), and the region gradually moves towards high temperature with the increase of strain. When the strain increases from 0.3 to 0.9, the region of η > 0.2 is reduced from the deformation temperature of 1248–1373 K and the strain rate of 0.01–1 s−1 to 1263–1373 K and 0.01–1 s−1, whereas the corresponding peak value of power dissipation changed from 29% to 24%. Meantime, the ξ value also changes greatly with the increase of strain. When the strain is 0.3, there are three plastic instability zones, but the total area is small, as shown in Figure 8a. In Figure 8b,c, with the increase of the strain, the area of plastic instability increases significantly and converges into one area, accounting for about one-third of the total area. The plastic instability zone is mainly concentrated under the conditions of a high strain rate (1–10 s−1), but does not include high-temperature conditions (1373 K). This is mainly because the higher strain rate is unfavorable to the occurrence of DRX, but the high-temperature environment is conducive, and the DRX can suppress the appearance of instability.
Figure 9 shows the 3D response surfaces of the four plastic instability criteria m, m ˙ , S and S ˙ to the strain rate and deformation temperature under the true strain of 0.9. Generally, at the true strain of 0.9, the deformation temperatures of 1173, 1223, 1273, 1323, and 1373 K, and the strain rates of 0.01, 0.1, 1, and 10 s−1, the values of m, m ˙ , S and S ˙ vary irregularly with strain rate and deformation temperature. The dark cyan part in Figure 9a–d represent the area of 0 < m < 1 , m ˙ < 0 , S > 1 , and S ˙ < 0 , respectively. The dark cyan parts in Figure 9 are the stable areas of plastic deformation, and the shaded (gray) parts are the unstable areas. The hot deformation of the material accords with the m and S criteria within the range of deformation temperature 1173–1373 K and strain rate 0.01–10 s−1 (Figure 9a,c). In Figure 9b, according to the instability criterion m ˙ , the instability phenomenon mainly occurs at low strain rates (0.01–0.1 s−1), except the temperature in the range of 1258–1308 K. In Figure 9d, based on the instability criterion S ˙ , in addition to deformation temperature 1173–1193 K, strain rate 0.01–0.1 s−1, and 1313–1373 K, 0.01–1 s−1, plastic instability also occurs in the range of 1198–1273 K and 1–10 s−1.
Figure 9 shows the plastic instability regions obtained by different plastic instability criteria are quite different, and there are also large discrepancies from the instability map in Figure 8c. This is mainly caused by the different theories on which these criteria are based. To confirm which one is more reasonable, it is analyzed in conjunction with the microstructure. Therefore, the final processing map is obtained by superimposing Figure 8c and Figure 9b,d, and displayed in Figure 10. The shaded areas are the instability regions, the purple dotted area is the instability region obtained by the instability parameter ξ, the cyan dotted areas are the instability regions obtained by the m ˙ criterion and the red dashed areas are the instability regions obtained by the S ˙ criterion. Furthermore, the four areas are divided and represented by the yellow dashed area.
Area I: Stability area, which meets the four plastic instability criteria and ξ > 0 . Deformation temperature 1263–1308 K and strain rate 0.01–0.1 s−1, the value of η is higher in the range of 0.180–0.240.
Area II: Instability area, which meets the four plastic instability criteria, but ξ < 0 . Deformation temperature 1278–1353 K and strain rate 1–10 s−1, the range of the η values in this area is 0.105–0.195.
Area III: Instability area, which meets the other three plastic instability criteria except m ˙ < 0 and ξ > 0 . Deformation temperature 1193–1243 K and strain rate 0.01–0.1 s−1, the range of η in this area is 0.060–0.180.
Area IV: Instability area, which meets the other three plastic instability criteria except S ˙ < 0 and ξ > 0 . Deformation temperature 1353–1373 K and strain rate 0.1–1 s−1, the range of η in this area is 0.180–0.225.

3.4. Microstructure

Figure 11 illustrates the microstructure of the I–IV regions to verify the applicability of the instability criteria.
In Figure 11a, many equiaxed grains were formed under the deformation temperature 1273 K and strain rate 0.01 s−1, and initial casting structures have disappeared. It is shown that complete DRX takes place under this condition. The softening produced by DRX can make the material flow stable and has good processability. Therefore, area I can be regarded as a reasonable hot working region.
Figure 11b shows the microstructure of area II under 1323 K and 10 s−1. It can be found that the refined grains formed by DRX are clustered in a narrow region with all the boundaries almost in a straight line, which is characteristic of DSA, and it is the result of the unpinning and repeated pinning of interstitial atoms and dislocations. Another characteristic of DSA is the zigzag stress-strain curve or the Portevin-Le Chatelier effect, as reported in the paper of Ivanchenko et al. [26], which can be seen in Figure 2d. The area with DSA is usually the plastic instability area, because it will bring many adverse effects to the mechanical properties of the material, such as ductility loss, localized strain, the triple junction (wedge) crack, serrated flow, etc. Therefore, area II illustrates the unreasonable hot working region.
As shown in Figure 11c, it is obvious that dynamic recovery and incomplete dynamic recrystallization has occurred at 1223 K and 0.01 s−1, the new fine grains are also formed, but coarse casting grains still exist compared with Figure 11a,b. Simultaneously, the voids were found under this condition, which have a negative effect on the mechanical properties of the materials. Therefore, hot working of 30Cr4MoNiV UHS steel should be avoided in this deformation condition.
Figure 11d shows the microstructure of the IV area under 1373 K and 0.1 s−1. Initial casting structures have partly been replaced by recrystallized grains; however, the voids were also found in this area. Obviously, area IV is not the ideal region for hot working.
The microstructure evolution caused by DRX can release energy storage and significantly reduce strain accumulation, but may lead to the formation of the voids and DSA to a certain extent, and there is usually an unstable flow in the area containing the voids and DSA. Therefore, it is necessary to comprehensively consider different plastic instability criteria for the judgment of the plastic instability regions, as studied in this paper. Simultaneously combining the instability criteria m ˙ , S ˙ and ξ, the optimized hot working process for 30Cr4MoNiV UHS steel can be accurately obtained as the deformation temperature is 1263–1308 K and the strain rate is in the range of 0.01–0.1 s−1.

4. Conclusions

The hot deformation behavior of 30Cr4MoNiV UHS steel was studied by isothermal compression tests in the temperature range of 1173–1373 K and the strain rate range of 0.01–10 s−1. The conclusions can be obtained.
(1) The flow stress of 30Cr4MoNiV UHS steel is very sensitive to the strain rate and deformation temperature, and increases with the increase of the strain rate and the decrease of the deformation temperature.
(2) Based on the peak stress, the activation energy of 30Cr4MoNiV UHS steel is 520.815 kJ · mol 1 , the values of α, n, and A are 0.00581, 8.3 and 1.951 × 10²⁰, respectively, in addition, the constitutive equation with strain-dependent constants is established, which can accurately predict the flow stress of 30Cr4MoNiV UHS steel in the hot working process, and the correlation coefficient is 0.9906.
(3) The processing maps obtained by combining instability parameter ξ, power dissipation η, and the instability criteria m ˙ , S ˙ are more suitable for the process optimization of 30Cr4MoNiV UHS steel, and the optimum conditions of the hot working process are deformation temperature 1263–1308 K and the strain rate 0.01–0.1 s−1. The voids and dynamic strain aging are found to be the cause of plastic instability by the analysis of microstructure.

Author Contributions

Conceptualization, G.C.; Funding acquisition, G.C. and B.S.; Methodology, G.C.; Project administration, G.C. and B.S.; Validation, G.C.; Writing—review & editing, G.C. and Y.J.; Data curation, Y.Y.; Investigation, Y.Y.; Software, Y.Y.; Writing—original draft, Y.Y.; Formal analysis, Y.J. and G.L.; Supervision, Y.J. and G.L.; Resources, Y.J. and B.Z.; Visualization, B.Z. All authors have read and agreed to the published version of the manuscript.

Funding

The authors would like to acknowledge the support from Hunan Valin Lianyuan Iron and Steel Co., Ltd. for “Research on Optimization of alloy composition and Application of X32/D6A Steel for Bimetal Saw Blade Back Material” (NO.618306kj0023), which is an active explore to the optimization of alloy composition and process of steel for bimetal band saw blades. One of the authors (Gang Chen) is grateful to the National Natural Science Foundation of China (grant no.51971091) for the financial support to this study.

Institutional Review Board Statement

The study do not require ethical approval.

Informed Consent Statement

Informed consent was obtained from all subjects involved in the study.

Data Availability Statement

Data available in a publicly accessible repository.

Conflicts of Interest

The authors declare no conflict of interest.

References

  1. Schiesaro, I.; Anzellini, S.; Loria, R.; Torchio, R.; Spina, T.; Flükiger, R.; Irifune, T.; Silva, E.; Meneghini, C. Anomalous Behavior in the Atomic Structure of Nb 3 Sn under High Pressure. Crystals 2021, 11, 331. [Google Scholar] [CrossRef]
  2. Errandonea, D.; Meng, Y.; Somayazulu, M.; Häusermann, D. Pressure-induced α→ω transition in titanium metal: A systematic study of the effects of uniaxial stress. Phys. B Phys. Condens. Matter 2005, 355, 116–125. [Google Scholar] [CrossRef] [Green Version]
  3. MacLeod, S.G.; Errandonea, D.; Cox, G.A.; Cynn, H.; Daisenberger, D.; Finnegan, S.E.; McMahon, M.I.; Munro, K.A.; Popescu, C.; Storm, C.V. The phase diagram of Ti-6Al-4V at high-pressures and high-temperatures. J. Phys. Condens. Matter 2021, 33, 154001. [Google Scholar] [CrossRef] [PubMed]
  4. Sellars, C.M.; Mctegart, W.J. On the mechanism of hot deformation. Acta Metall. 1966, 14, 1136–1138. [Google Scholar] [CrossRef]
  5. Lin, Y.C.; Chen, M.-S.; Zhong, J. Constitutive modeling for elevated temperature flow behavior of 42CrMo steel. Comput. Mater. Sci. 2008, 42, 470–477. [Google Scholar] [CrossRef]
  6. Lei, B.; Chen, G.; Liu, K.; Wang, X.; Jiang, X.; Pan, J.; Shi, Q. Constitutive Analysis on High-Temperature Flow Behavior of 3Cr-1Si-1Ni Ultra-High Strength Steel for Modeling of Flow Stress. Metals 2019, 9, 42. [Google Scholar] [CrossRef] [Green Version]
  7. Rao, K.P.; Prasad, Y.K.D.V. Hot deformation studies on a low-carbon steel: Part 1—Flow curves and the constitutive relationship. J. Mater. Process. Technol. 1996, 56, 897–907. [Google Scholar] [CrossRef]
  8. Jha, J.S.; Toppo, S.P.; Singh, R.; Tewari, A.; Mishra, S.K. Flow stress constitutive relationship between lamellar and equiaxed microstructure during hot deformation of Ti-6Al-4V. J. Mater. Process. Technol. 2019, 270, 216–227. [Google Scholar] [CrossRef]
  9. Xiong, W.; Song, R.; Yu, P.; Liu, Z.; Qin, S.; Zhang, Y.; Quan, S.; Huo, W.; Zhao, Z.; Su, S.; et al. Hot Deformation Behavior of V–Ti Microalloy Steels. Steel Res. Int. 2020, 92, 2000225. [Google Scholar] [CrossRef]
  10. Chen, Z.; Nash, P. Hot Deformation Behavior and Processing Maps for a Large Marine Crankshaft S34MnV Steel. Steel Res. Int. 2018, 89, 1700321. [Google Scholar] [CrossRef]
  11. Babaniaris, S.; Ramajayam, M.; Jiang, L.; Varma, R.; Langan, T.; Dorin, T. Effect of Al3(Sc,Zr) dispersoids on the hot deformation behaviour of 6xxx-series alloys: A physically based constitutive model. Mater. Sci. Eng. A 2020, 793, 139873. [Google Scholar] [CrossRef]
  12. Xiao, Y.H.; Guo, C.; Guo, X.Y. Constitutive modeling of hot deformation behavior of H62 brass. Mater. Sci. Eng. A 2011, 528, 6510–6518. [Google Scholar] [CrossRef]
  13. Wu, Y.; Zhang, X. Microstructure and plastic instability criteria of Mg-Gd-Y-Zr alloy during hot compression. Chin. J. Nonferrous Met. 2014, 24, 2961–2968. [Google Scholar]
  14. Ahamed, H.; Senthilkumar, V. Hot deformation behavior of mechanically alloyed Al6063/0.75Al2O3/0.75Y2O3 nano-composite—A study using constitutive modeling and processing map. Mater. Sci. Eng. A 2012, 539, 349–359. [Google Scholar] [CrossRef]
  15. Prasad, Y.V.R.K. Modeling of Dynamic Material Behavior in Hot Deformation: Forging of Ti-6242. Metall. Trans. A 1984, 15A, 1883–1892. [Google Scholar] [CrossRef]
  16. Quan, G.Z.; Zhao, L.; Chen, T.; Wang, Y.; Mao, Y.P.; Lv, W.Q.; Zhou, J. Identification for the optimal working parameters of as-extruded 42CrMo high-strength steel from a large range of strain, strain rate and temperature. Mater. Sci. Eng. A 2012, 538, 364–373. [Google Scholar] [CrossRef]
  17. Zhai, R.; Wang, W.; Ma, R.; Zhang, S.; Ma, S.; Li, L.; Gong, S.; Zhang, H. Hot Deformation Behavior and Processing Map of As-Cast 40CrNiMo Alloy Steel. J. Mater. Eng. Perform. 2020, 29, 964–974. [Google Scholar] [CrossRef]
  18. Liu, Y.; Hu, R.; Li, J.; Kou, H.; Li, H.; Chang, H.; Fu, H. Characterization of hot deformation behavior of Haynes230 by using processing maps. J. Mater. Process. Technol. 2009, 209, 4020–4026. [Google Scholar] [CrossRef]
  19. Ding, X.; Zhao, F.; Shuang, Y.; Ma, L.; Chu, Z.; Zhao, C. Characterization of hot deformation behavior of as-extruded AZ31 alloy through kinetic analysis and processing maps. J. Mater. Process. Technol. 2020, 276, 116325. [Google Scholar] [CrossRef]
  20. Murty, S.V.S.N.; Rao, B.N.; Kashyap, B.P. On the hot working characteristics of 2014 Al–20 vol% Al2O3 metal matrix composite. J. Mater. Process. Technol. 2005, 166, 279–285. [Google Scholar] [CrossRef]
  21. Poletti, C.; Six, J.; Hochegger, M.; Degischer, H.P.; Ilie, S. Hot Deformation Behaviour of Low Alloy Steel. Steel Res. Int. 2011, 82, 710–718. [Google Scholar] [CrossRef]
  22. Rajput, S.K.; Chaudhari, G.P.; Nath, S.K. Characterization of hot deformation behavior of a low carbon steel using processing maps, constitutive equations and Zener-Hollomon parameter. J. Mater. Process. Technol. 2016, 237, 113–125. [Google Scholar] [CrossRef]
  23. Prasad, Y.V.R.K. Modelling of hot deformation for microstructural control. Int. Mater. Rev. 1998, 43, 243–258. [Google Scholar] [CrossRef]
  24. Xu, L.W.; Li, H.B.; Jiang, Z.H.; Cai, M.H.; Jiao, W.C.; Feng, H.; Zhang, S.C.; Lu, P.C. Hot Deformation Behavior of P550 Steels for Nonmagnetic Drilling Collars. Steel Res. Int. 2020, 91, 2000035. [Google Scholar] [CrossRef]
  25. Chen, L.; Xue, H.; Ma, X.; Jin, M.; Long, H.; Mao, T.; Wang, J. Processing Map and Hot Deformation Characteristics of 21Cr-11Ni-N-RE Lean Austenitic Heat-Resistant Steel. Steel Res. Int. 2015, 86, 1583–1593. [Google Scholar] [CrossRef]
  26. Ivanchenko, M.; Nevdacha, V.; Yagodzinskyy, Y.; Hänninen, H. Internal friction studies of carbon and its redistribution kinetics in Inconel 600 and 690 alloys under dynamic strain aging conditions. Mater. Sci. Eng. A 2006, 442, 458–461. [Google Scholar] [CrossRef]
  27. Zener, C.; Hollomon, J.H. Effect of strain rate upon plastic flow of steel. J. Appl. Phys. 1944, 15, 22–32. [Google Scholar] [CrossRef]
  28. Mirzadeh, H.; Cabrera, J.M.; Prado, J.M.; Najafizadeh, A. Hot deformation behavior of a medium carbon microalloyed steel. Mater. Sci. Eng. A 2011, 528, 3876–3882. [Google Scholar] [CrossRef]
  29. Mirzadeh, H.; Najafizadeh, A.; Moazeny, M. Flow curve analysis of 17-4 PH stainless steel under hot compression test. Metall. Mater. Trans. A 2009, 40, 2950–2958. [Google Scholar] [CrossRef]
  30. McQueen, H.J. Constitutive analysis in hot working. Mater. Sci. Eng. A 2002, 322, 43–63. [Google Scholar] [CrossRef]
  31. Cai, D.; Xiong, L.; Liu, W.; Sun, G.; Yao, M. Characterization of hot deformation behavior of a Ni-base superalloy using processing map. Mater. Des. 2009, 30, 921–925. [Google Scholar] [CrossRef]
  32. Chen, L.; Zhao, G.; Yu, J.; Zhang, W. Constitutive analysis of homogenized 7005 aluminum alloy at evaluated temperature for extrusion process. Mater. Des. 2015, 66, 129–136. [Google Scholar] [CrossRef]
  33. Wang, H.; Liu, D.; Wang, J.G.; Wang, H.P.; Hu, Y.; Rao, H.D. Characterization of hot deformation behavior of 30Si2MnCrMoVE low-alloying ultra-high-strength steel by constitutive equations and processing maps. J. Iron Steel Res. Int. 2020, 27, 807–819. [Google Scholar] [CrossRef]
  34. Dong, J.; Li, C.; Liu, C.; Huang, Y.; Yu, L.; Li, H.; Liu, Y. Hot deformation behavior and microstructural evolution of Nb–V–Ti microalloyed ultra-high strength steel. J. Mater. Res. 2017, 32, 3777–3787. [Google Scholar] [CrossRef]
  35. Cai, J.; Li, F.; Liu, T.; Chen, B.; He, M. Constitutive equations for elevated temperature flow stress of Ti–6Al–4V alloy considering the effect of strain. Mater. Des. 2011, 32, 1144–1151. [Google Scholar] [CrossRef]
  36. Li, M.; Duan, Y.; Yao, D.; Guan, Y.; Yang, L. Constitutive Model and Flow Behavior of B1500HS High-Strength Steel during the Hot Deformation Process. Metals 2019, 10, 64. [Google Scholar] [CrossRef] [Green Version]
  37. Zhao, C.; Zhang, J.; Yang, B.; Li, Y.F.; Huang, J.F.; Lian, Y. Hot Deformation Characteristics and Processing Map of 1Cr12Ni2Mo2WVNb Martensitic Stainless Steel. Steel Res. Int. 2020, 91, 2000020. [Google Scholar] [CrossRef]
Figure 1. (a) Schematic diagram of the hot compression tests, (b) Schematic diagram of the specimens before and after compression.
Metals 11 00769 g001
Figure 2. True stress–strain curves under the different deformation temperatures with strain rates. (a) 0.01 s−1; (b) 0.1 s−1; (c) 1 s−1; (d) 10 s−1.
Metals 11 00769 g002
Figure 3. Plots used for calculation of the material-dependent constants. (a) ln ε ˙ - ln σ P , (b) ln ε ˙ - σ P , (c) ln ε ˙ - ln [ sinh ( α σ P ) ] , (d) ln [ sinh ( α σ P ) ] - 1 / T , (e) ln Z - ln [ sinh ( α σ P ) ] (the units of peak stress and strain rate are MPa and s−1, respectively).
Metals 11 00769 g003
Figure 4. The calculation flow chart of the material-dependent constants related to the constitutive equation.
Metals 11 00769 g004
Figure 5. Seventh-order fitting curves of each of the material-dependent constants: (a) Q-ε; (b) α-ε; (c) n-ε; (d) lnA-ε.
Metals 11 00769 g005
Figure 6. Comparison of predicted and experimental true stress-strain curves. (a) 0.01 s−1; (b) 0.1 s−1; (c) 1 s−1; (d) 10 s−1.
Metals 11 00769 g006
Figure 7. Correlation between predicted values and experimental values over a temperature range of 1173–1373 K with strain rate of 0.01–10 s−1.
Metals 11 00769 g007
Figure 8. Processing maps at different true strains: (a) ε = 0.3; (b) ε = 0.6; (c) ε = 0.9. The shaded areas are the plastic instability areas, and the colored areas represent the different η values.
Metals 11 00769 g008
Figure 9. The response 3D surfaces of four criteria on deformation temperature and strain rate at the true strain of 0.9: (a) m; (b) m ˙ ; (c) S; (d) S ˙ . The colored parts are the stable areas, and the shaded (gray) parts are the unstable areas.
Metals 11 00769 g009
Figure 10. Processing map with the true strain of 0.9. The purple dotted area is the instability region obtained by the instability parameter ξ, the cyan dotted areas are the instability regions obtained by the m ˙ criterion, the red dashed areas are the instability regions obtained by the S ˙ criterion, and the colored areas represent the η values.
Metals 11 00769 g010
Figure 11. Microstructures of 30Cr4MoNiV ultra-high-strength steel in I–IV areas: (a) I (1273 K, 0.01 s−1); (b) II (1323 K, 10 s−1); (c) III (1223 K, 0.01 s−1); (d) IV (1373 K, 0.1 s−1).
Metals 11 00769 g011
Table 1. Chemical component of 30Cr4MoNiV ultra-high-strength steel (wt.%).
CSiMnCrNiMoVAlFe
0.300.240.943.850.671.310.350.05Bal.
Table 2. Peak stress σP under different deformation conditions (MPa).
Strain Rate [s−1]Deformation Temperature [K]
11731223127313231373
0.01193.24158.85115.6293.1787.91
0.1221.00182.26152.81121.79109.83
1270.99228.80187.61171.35143.43
10311.71263.33215.62194.19177.01
Table 3. The coefficients of each polynomial function.
Polynomial CoefficientsThe Material-Dependent Constants
Q [kJ/mol]αnln A
B01219.8310.009499.893111.708
B1−8053.152−0.0543−49.28−722.781
B248,062.0030.43802350.1854164.055
B3−168,839.713−1.90727−1248.333−14,174.679
B4350,611.4464.635672480.9528,607.488
B5−424,298.811−6.31237−2796.554−33,725.332
B6277,595.6814.504021684.09121,550.56
B7−76,115.557−1.31131−424.078−5790.606
Publisher’s Note: MDPI stays neutral with regard to jurisdictional claims in published maps and institutional affiliations.

