Abstract
Full-penetration laser beam welding is characterized by a weld seam whose depth equals the material thickness. It is associated with a stable capillary and is therefore widely used for welding of sheet metal components. The realization of lightweight concepts in car body production requires the application of high-strength aluminum alloys that contain magnesium as an alloying element, which significantly influences the evaporation temperature and pressure. This change of the evaporation processes influences the geometry of the capillary and therefore its absorptance. In order to quantify the influence of magnesium on the capillary, their geometries were captured by means of high-speed synchrotron X-ray imaging during the welding process of the aluminum alloys AA1050A (Al99.5), AA5754 (AlMg3) and AA6016 (AlSi1.2Mg0.4). The 3D-geometries of the capillaries were reconstructed from the intensity distribution in the recorded X-ray images and their absorptance of the incident laser beam was determined by the analysis of the reconstructed 3D-geometry with a raytracing algorithm. The results presented in this paper capture for the first time the influence of the magnesium content in high-strength aluminum alloys on the aspect ratio of the capillary, which explains the reduced absorptance in case of full-penetration laser beam welding of aluminum alloys with a high content of volatile elements. In order to improve the absorptance in full-penetration welding, these findings provide the information required for the deduction of new optimization approaches.
1. Introduction
Full-penetration welding is characterized by a weld seam whose depth equals the material thickness. Compared to partial-penetration laser beam welding, full-penetration welding is associated with a stable capillary and therefore is a more reliable process because the additional opening at the bottom results in the avoidance of a collapsing capillary tip [1,2,3]. In addition, it facilitates the quality assurance of the weld because it can be visually ascertained whether the required penetration depth was achieved. Full-penetration laser beam welding is therefore widely used for welding of sheet metal components.
There are two modes of full-penetration welding which can be distinguished by the length sc of the capillary in relation to the sample’s thickness ss, as diagramed in Figure 1a the capillary is closed at the bottom i.e., sc < ss and only the melt pool penetrates the whole sheet thickness and Figure 1b the capillary is open at the bottom, i.e., sc = ss.
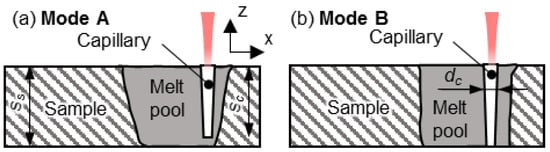
Figure 1.
The two modes of full-penetration welding with a capillary (a) which is closed at its bottom and (b) which is open at the bottom of the sheet.
The absorptance of a capillary for the incident laser radiation is a key factor for the economic viability of the full-penetration laser beam welding process. The two full-penetration welding modes provide different absorptances because the second opening at the bottom of the capillary in case of mode B leads to additional power losses. However, ensuring welding in mode A requires sophisticated measurement systems and reliable process conditions. An additional margin of laser power is therefore usually applied to compensate for fluctuating process conditions, which results in full-penetration mode B.
The absorptance is defined by the ratio of the absorbed laser power PA and the power P of the incident laser beam. It depends on both the geometry of the vapor capillary and the absorptivity of the material at the wavelength of the laser beam [4,5]. Especially the aspect ratio between the capillary depth sc and the capillary diameter dc, has a major influence on the absorptance [4,5].
The realization of lightweight concepts in car body production requires the application of high-strength aluminum alloys of the 5xxx and the 6xxx series, which contain magnesium as the alloying element in concentrations differing by orders of magnitude. Compared to welding of pure aluminum this alters the absorbed input power PA in two ways. First, alloying elements modify the absorptivity of the material [6] and second, especially magnesium influences the evaporation temperature and evaporation pressure [7,8], which in turn influences the geometry of the capillary and therefore its absorptance. On the one hand it was found that the keyhole diameter increases with increasing content of elements with lower boiling temperature than aluminum for partial penetration laser beam welding [9]. If this is considered singularly this causes a decrease of the aspect ratio and thus of the absorptance. On the other hand an increasing penetration depth is reported [9], which is favorable for a high aspect ratio and thus for an enhanced absorptance.
In case of full-penetration welding, the depth of the capillary is given by the thickness of the sheet. But despite this inherently constant penetration depth, the increased evaporation may change the geometry of the capillary by increasing its diameter. According to [4,5] such an increased diameter should lead to a decrease of the aspect ratio and therefore to a reduced absorptance.
Since alloys with high magnesium content of the 5xxx and 6xxx series are widely used for industrial applications, the determination of the influence of magnesium on the geometry of the capillary and thus on the absorptance is of particular importance. To quantify this, the different geometries of the capillaries during welding of the aluminum alloys AA1050A (Al99.5) with minimum Mg-content, AA5754 (AlMg3) and AA6016 (AlSi1.2Mg0.4) were analyzed by means of high-speed synchrotron X-ray imaging. The 3D-geometry of the capillaries were reconstructed from the intensity distribution in the recorded X-ray images. Their absorptance for the incident laser beam was then calculated by means of a raytracing algorithm.
The present paper shows for the first time that the increase of the content of magnesium in high-strength aluminum alloys coincides with a decrease of the aspect ratio of the capillary and therefore of the absorptance in full-penetration laser beam welding.
2. Materials and Methods
2.1. Experimental Setup
Figure 2 shows the experimental setup at the DESY (Deutsches Elektronen-Synchrotron, Hamburg, Germany) [10], which was realized in cooperation with the RWTH in Aachen and is described in detail in [11]. A TruDisk5000 laser from TRUMPF (Ditzingen, Germany) with a wavelength of λ = 1030 nm was used. The beam delivery through a fiber with a core diameter of 50 μm and a numerical aperture of 0.1 rad resulted in a beam quality factor of M2 = 7.6. The magnification of the focusing optics was 163:80 resulting in a spot diameter of 102 µm and a Rayleigh length of . The beam was focused on the upper surface of the sample, where the origin of the coordinate system is located. The sample was moved in negative x-direction with a feed rate of 6 m/min.
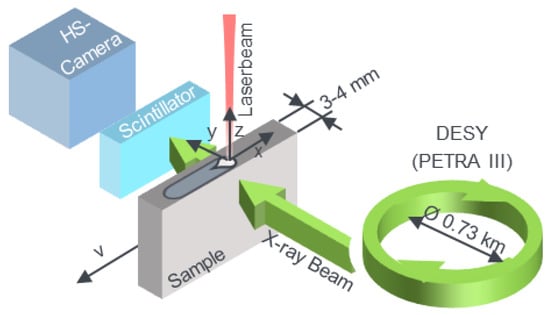
Figure 2.
Experimental setup at the DESY [10] in Hamburg which is described in Detail in [11].
The monochromatic X-ray beam (shown in green) from the electron accelerator ring with a photon energy of 37.7 keV and an average beam diameter of approx. 3 mm propagates through the sample (gray) and is locally attenuated depending on the thickness of the transirradiated material during the welding process. The attenuated X-ray beam behind the sample is converted into visible light by the scintillator (light blue). This is recorded by a high-speed (HS) camera (dark blue) with 1000 frames per second and an exposure time of 999.8 µs with a spatial resolution of 256 pixels/mm and an image size of 920 × 920 pixels. In order to avoid misinterpretation of local grayscale values which result from the intensity profile of the X-ray beam, a flat-field correction was applied. For this purpose, sequences of reference X-ray images were recorded without welding during the movement of every clamped sample prior to every single welding trial. The post-process flat-field correction normalizes the grayscale values in each image of the welding process to their temporally and locally corresponding grayscale values of the reference images. Subsequently a Kalman filter [12,13] was applied. This image processing ensures that the grayscale values result from local density variations of the material and not from local intensity deviations of the X-ray beam.
As magnesium is known to be volatile in laser beam welding [8], technical alloys with magnesium content that varies by three orders of magnitude regarding the weight percent (wt.%) were investigated. The used alloys and the range of the magnesium content according to the specification in [14] are listed in Table 1. Since AA6016 has a high amount of silicon its influence has to be considered as well. The Si-content for the different alloys is given in Table 1.

Table 1.
Aluminum alloys and the regarding Mg and Si content as specified in [14], material properties [15,16] and used sheet thickness.
As a decrease of the absorptance was expected with increasing magnesium content, thicker sheets were chosen for the alloys with higher magnesium content. This results in a higher nominal aspect ratio of ss/df, which coincides with an increase of the absorptance [4,5]. Thus, the adaption of the nominal aspect ratio to the magnesium content implies that a decrease of the absorptance with increasing magnesium content is only measured if the influence is significant.
2.2. Adjustment of the Full-Penetration Mode
In order to ensure welding in full-penetration mode B, the laser power was adjusted according to the resulting capillary geometry, which was observed in the X-ray videos. Figure 3 shows two single frames from high-speed X-ray videos of laser welding of AA1050A with df = 102 µm. The sheet was moved from right to left, while the laser beam was resting with constant position and orientation. In order to eliminate distortions at the edges of the sheet, each image was cropped at the upper and lower edge of the sheet by a maximum of five percent of the thickness of the sheet. The light areas with a high grayscale value in Figure 3 correspond to locations with a reduced absorption of the X-ray beam, which occurs where less material or material with a reduced density is transirradiated. This is why the capillaries are clearly observable by the vertically oriented light white areas in the recordings.
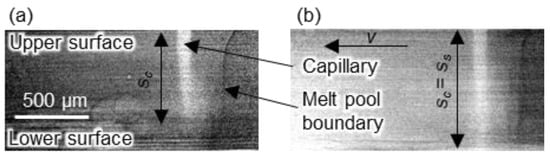
Figure 3.
Single frames from high-speed X-ray videos of laser beam welding of AA1050A with d = 102 µm. (a) Full-penetration welding with a capillary which is closed at its bottom at P = 1.0 kW. (b) Full-penetration welding with a capillary which is opened at its bottom at P = 1.2 kW. (Whole image sequence given with Video S1 in Supplementary Materials).
The transition from the solid to the liquid physical state causes interference effects of the transmitted coherent X-ray beam on the scintillator [17]. This interference effect results in a decrease of the local grayscale value at the location of the transition from the solid to the liquid physical state. From this local decrease, the local boundary of the melt pool can be identified, as shown in Figure 3. This enables to distinguish between the three physical states of the gaseous capillary, the liquid melt pool and the solid material which are present in a laser welding process.
Figure 3a shows an X-ray image of the welding process with a laser power of P = 1.0 kW. It resulted in a capillary, which is closed at its bottom with a penetration depth sc < ss. Figure 3b shows an image of the welding process with a laser power of P = 1.2 kW which resulted in a capillary that penetrates through the whole sheet thickness, sc = ss, and which is open at its bottom. The whole image sequences are given with the Video S1 in the Supplementary Material.
In both cases the formation of a weld seam ranging all the way through to the bottom of the sheet can be seen from the X-ray images. The process depicted in Figure 3a can therefore be identified as welding with full-penetration mode A and the process in Figure 3b can be identified as full-penetration mode B.
The images show that in case of welding with a closed capillary in full-penetration mode A, the formation of the weld seam results from a melt isotherm which expands to the bottom side of the sheet. The course of the melt isotherms in the lower region of the sheet differs between both modes. In mode A, a curvature of the boundary of the melt pool occurs near the bottom region whereas this boundary is a straight vertical line in mode B.
For each investigated material, the power was adapted until the depths of the capillary equaled the sheet thickness and a vertical melt pool boundary was observed, as shown in Figure 3b to determine the power required for welding mode B. This was ensured by visual inspection of the high-speed X-ray images. The resulting welding parameters for the different alloys are listed in Table 2.
Table 2.
Overview of the used parameters for welding in full-penetration mode B.
2.3. Determination of the Absorptance of the Vapor Capillaries
The 3D-geometry of the capillary was reconstructed from the recorded images as described in [18,19]. Based on Beers absorption law of the X-ray radiation that is transmitted through the samples, the geometrical extension of the capillary along propagation direction of the X-ray beam is given by:
where Ic(x,z) is the measured X-ray intensity at the corresponding position (x,z) as defined in Figure 2 within the cross-sectional area of the capillary and I0 is the intensity transmitted through the workpiece at a location outside the capillary, and µ is the attenuation coefficient.
The attenuation coefficient for the monochrome X-ray beam with 37.7 keV in solid aluminum amounts to µsol = 1.8 cm−1 [20], and linearly depends on the density of the material [21]. As described in [18] the presence of a liquid phase causes a systematic error which results from its decreased density. To take this into account and to estimate the range of possible extensions of the capillary in the direction along the X-ray beam, Equation (1) was solved for both, the attenuation coefficient µsol = 1.8 cm−1 of the solid material and for the one of the liquid material given by and with the corresponding densities and , respectively [15]. This yields the minimum and maximum possible values of the real extent wy of the capillary.
Assuming a mirror symmetric capillary centered at the plane of symmetry at y = 0, wy(x,z) defines its 3D-geometry in which the absorptance of the laser beam was calculated by raytracing. The bundle of rays for the raytracing calculation were defined according to the specifications of the laser beam used in the experiments which exhibited a top-hat shaped intensity distribution in the focal plane. It was assumed that the distance between the front of the capillary and the beam axis equals df/2. The complex refractive index for liquid aluminum at T = 2500 °C used to calculate the Fresnel absorption at each reflection of a ray on the walls of the capillary is given by and [5]. The propagation and reflection of 150,000 randomly polarized beams was calculated, considering up to 20 reflections of each beam.
It is to be assumed that the evaporating surface of the capillary is not perfectly smooth but exhibits small geometrical variations that cannot be resolved by the applied measurement and reconstruction method. In order to take into account the diffuse character of the reflection at this rough surface the radiation was assumed to be reflected according to Lambert’s cosine emission law [22,23].
Figure 4 shows the calculated distribution of the locally absorbed irradiance within the reconstructed capillary geometries, which correspond to the ones shown in Figure 3. The locally absorbed irradiance is given by the color-coded logarithmic scale.
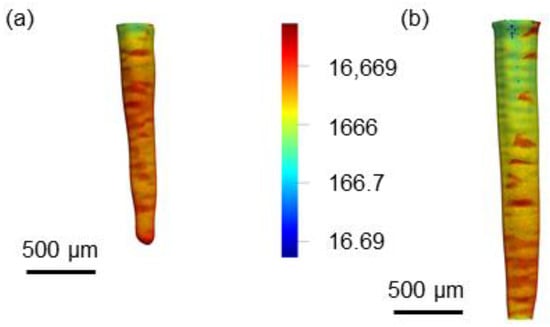
Figure 4.
Distribution of the calculated locally absorbed irradiance inside the reconstructed capillaries for laser beam welding of AA1050A with df = 102 µm. (a) Full-penetration welding with a capillary which is closed at its bottom at P = 1.0 kW. (b) Full-penetration welding with a capillary which is opened at its bottom with P = 1.2 kW. (3D-geometries of the averaged capillaries are given with Files S4–S33 in the Supplementary Materials).
The 3D-geometry of all reconstructed capillaries are provided by PLY-files S4–S33 in the supplementary online material.
Figure 5a presents the absorptance calculated as the ratio of the laser power absorbed inside of the capillaries and the total incident laser power. The height of the bars corresponds to the averaged value from at least two welded samples, each of them reconstructed using the two different attenuation coefficients of liquid and of solid aluminum. The error bars indicate the range between the minimum and maximum determined values.
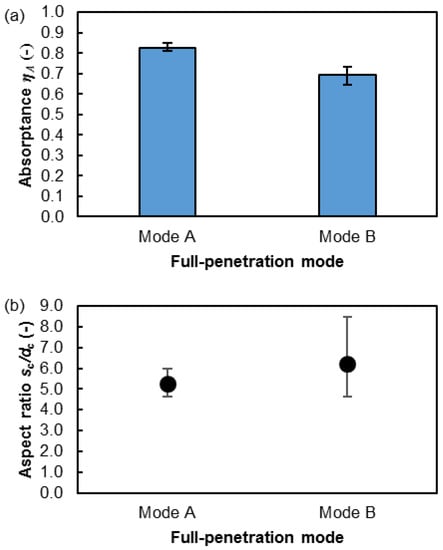
Figure 5.
(a) Overall absorptance in the reconstructed capillaries as determined by means of raytracing. (b) Aspect ratio of the reconstructed capillaries. Mode A: capillary which is closed at its bottom (left), P = 1.0 kW, Mode B: capillary which is opened at its bottom (right), P = 1.2 kW. Full-penetration laser beam welding of AA1050A with df = 102 µm.
Figure 5b shows the aspect ratios sc/dc of the corresponding capillaries, as determined from the reconstructed geometries. Since the real 3D-geometries are not of an idealized cylindrical shape the mean diameter dc of the opening was determined by , where Ac is the area of the opening of the reconstructed capillary at the upper surface of the sheet. The values in Figure 5b represent the average value from at least two repetitions, each of them reconstructed with the two different attenuation coefficients µsol and µliq. The error bars indicate the range between the minimum and maximum determined values.
As a validation of the raytracing algorithm for full-penetration mode A the calculated absorptance can be compared to the value given by the model from Gouffé for a cylindrically shaped cavity [4,5]. Assuming an absorptivity for liquid aluminum of A = 0.12 [6] this yields = 0.78 for a capillary with the same aspect ratio as measured in our experiment which agrees well with the results of the raytracing calculation.
Despite the increase of the aspect ratio by about 20% in case of full penetration with the opened capillary in mode B the absorptance decreases by an absolute amount of 0.12. This proves that the losses of power through the opening at the bottom of the capillary are quite significant and shows that such processes are less efficient and not comparable with a welding process in mode A.
3. Results
Figure 6 shows a sequence of single frames from the high-speed recording of full-penetration laser beam welding of a 2 mm thick sheet of AA5754, with the parameters given in Table 2. The whole image sequence is given with the Video S2 in the Supplementary Material. The time stamp indicates the elapsed time since the start of the process with a time step of between each single image. The sample moved from right to left, while the laser beam was stationary.
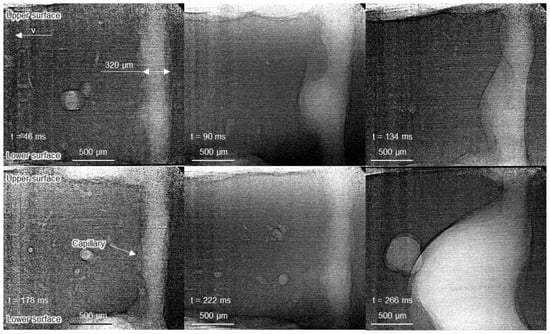
Figure 6.
Single frames at different times from a high-speed X-ray video of laser beam welding of AA5754 with P = 2.1 kW, df = 102 µm, ss = 2 mm. (Whole image sequence given with Video S2 in Supplementary Materials).
The images show that the geometry of the capillary strongly fluctuates and therefore significantly differs from a cylindrical shape during most of the process time. This agrees well with the observations in [9] for AA5083 with a Mg content of 4.4 wt.%. As indicated in the upper left image, at t = 46 ms, when a cylindrical shape is present for a short time, the minimum diameter of dc ≈ 300 µm is about three times larger than the beam diameter df ≈ 102 µm of the laser beam on the surface of the sample. At most positions and during most of the process time the local diameter dc(z) is significantly wider. This behavior can be related to the excessive evaporation of the alloyed magnesium which causes an expansion of the capillary [9].
Figure 7 shows the calculated distribution of the absorbed irradiance in the reconstructed geometry of average capillaries for welding in full-penetration mode B of the three considered alloys.
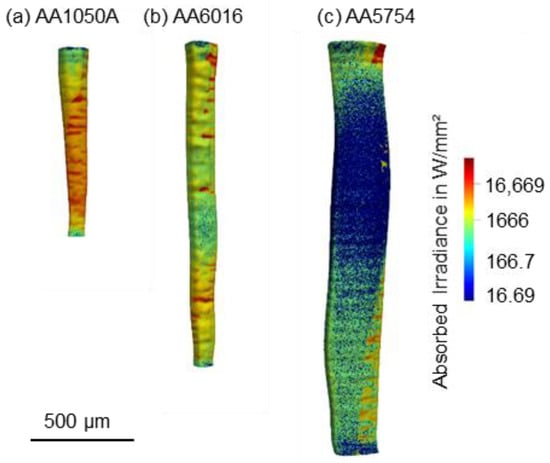
Figure 7.
Calculated distribution of the absorbed irradiance in the reconstructed capillaries for welding in full-penetration welding mode B of different aluminum alloys with df = 102 µm. (a) P = 1.2 kW, ss = 1.0 mm, AA1050A (b) P = 2.0 kW, ss = 1.7 mm, AA6016 (c) P = 2.1 kW, ss = 2.0 mm, AA5754. (3D-geometries of the averaged capillaries are given with Files S4–S33 in the Supplementary Materials).
The comparison of Figure 7a–c shows that the average locally absorbed irradiance inside the capillary is lower when welding AA5754. It can therefore be concluded that the expansion of the capillary must be related to the evaporation of alloying elements and not to the absorbed irradiance in the capillary. Hence, the evaporation of alloying elements causes significant changes of the geometry of the capillaries which in turn result in a change of the distribution of the laser radiation and thus a change of the locally absorbed irradiance. All in all, this causes strong fluctuations of the capillary’s geometry and the absorptance.
The aspect ratios sc/dc shown in Figure 8 represent the averaged values from at least two measurements, each of them reconstructed with the two different attenuation coefficients. The error bars indicate the range between the minimum and maximum calculated values. For comparison, the purple data points represent the ratio resulting of the sheet thickness ss and the beam diameter df. The orange data points show the difference between this ratio and the measured aspect ratio of the capillaries. The error bars indicate the range between the minimum and maximum determined values.
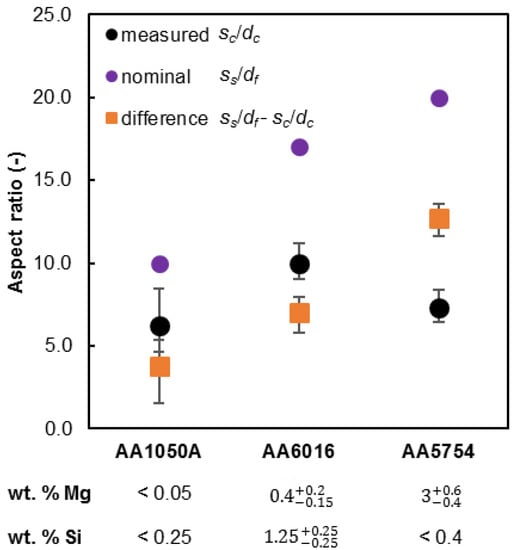
Figure 8.
Influence of different aluminum alloys on the measured aspect ratio sc/dc of the capillary and the ratio ss/df for welding in full-penetration mode B with AA1050A: P = 1.2 kW, ss = 1.0 mm. AA6016: P = 2.0 kW, ss = 1.7 mm. AA5754: P = 2.1 kW, ss = 2.0 mm (from left to right). All with df = 102 µm. Mg and Si content according to the specifications in [14].
The comparison of the black and purple data points shows, that for all considered alloys the measured aspect ratio sc/dc is smaller than the ratio ss/df and the difference between these quantities (orange squares) increases with increasing magnesium content of the alloy. This can be related to the increase of the opening diameter dc of the capillary, which is connected with the increase of the magnesium content. This again confirms, that the excessive evaporation of magnesium as described in [7,9] causes an additional expansion of the capillary.
No correlation with the silicon content was found, which can be explained by the different vapor pressures. Within the temperature range of 900 K to 2700 K the vapor pressure for Mg is approximately two orders of magnitude higher compared to the one of pure aluminum, whereas for Si it is two orders of magnitude lower (calculated with ThermoCalc [24]). This proves that Mg is the dominant cause for an excessive evaporation.
Figure 9 compares the resulting absorptance ηA of the capillaries for welding of the three investigated alloys. The height of the bars in Figure 9 represents the overall absorptances, averaged over at least two examinations, each of them reconstructed with the two different attenuation coefficients. The error bars indicate the range between the minimum and maximum calculated values.
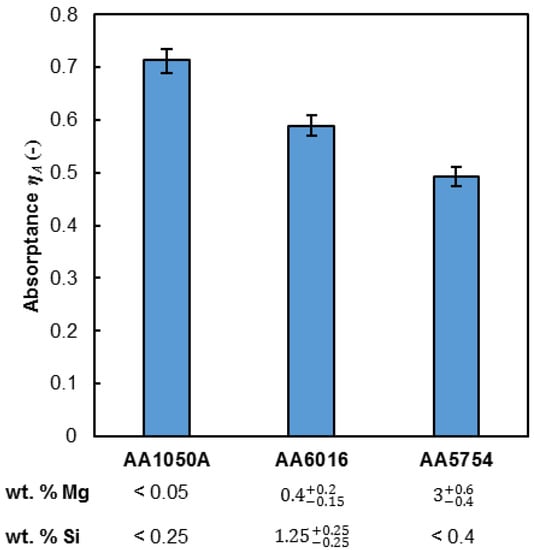
Figure 9.
Absorptances as determined by means of raytracing in the reconstructed capillaries for welding in full-penetration mode B of AA1050A: P = 1.2 kW, ss = 1.0 mm; AA6016: P = 2.0 kW, ss = 1.7 mm; AA5754: P = 2.1 kW, ss = 2.0 mm (from left to right). All with df = 102 µm. Mg and Si content according to the specifications in [14].
The results show that despite the increase of depths of the capillaries the absorptance decreases with increasing magnesium content. This evidences that magnesium has a significant influence on the geometry of the capillary by expanding its diameter.
4. Implications on the Process Design
From Section 2.3. and Section 3 one can conclude that a high absorptance and therefore an efficient process requires a capillary, which is closed at the bottom and exhibits a high depth sc and a small diameter dc. This can be achieved by welding in full-penetration mode A with a small beam diameter and by the selection of alloys without volatile additives, under consideration of the structural requirements which are given from the application of the welded part.
Latest developments in the field of laser beam sources led to the availability of green radiation at high powers. This enables the decrease of the beam diameter at the same focal distance. In order to achieve such an optimized process, a TruDisk1021 laser from TRUMPF with a wavelength of λ = 515 nm was used. The beam delivery fiber with a core diameter of 50 µm and a numerical aperture of 0.1 rad resulted in a beam quality factor of M2 = 15.25. The magnification of the focusing optics was 75:80 resulting in a spot diameter of 47 µm and a Rayleigh length of . For an optimum process, the AA1050A sheet with a thickness of ss = 1 mm was welded with the feed rate of 6 m/min.
Figure 10 shows the X-ray image and the calculated distribution of the absorbed irradiance in the reconstructed geometry of the capillary for welding with this setup. The whole image sequence is given with the Video S3 in the Supplementary Material.
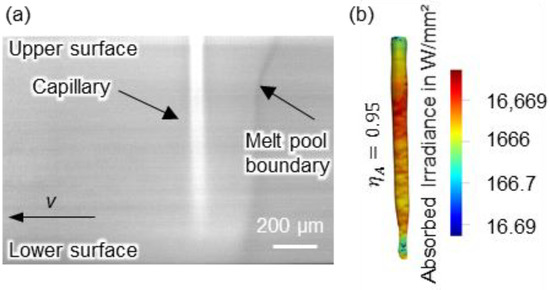
Figure 10.
(a) Averaged high-speed X-ray image for laser beam welding of AA1050A at green wavelengths λ = 515 nm. P = 800 W, v = 6 m/min, ss = 1 mm, df = 47 µm. (b) Corresponding calculated distribution of the absorbed irradiance in the reconstructed capillary. (Whole image sequence and 3D-geometry of the averaged capillary are given with Video S3 and Files S4–S33 in Supplementary Materials).
The X-ray image in Figure 10a shows that full-penetration laser beam welding in mode A with a capillary which is closed at its bottom is present. This is indicated by the geometry of the capillary and the curvature of the boundary of the melt pool.
For the application of the raytracing algorithm the definition of the rays was adapted to the changed optics and beam specifications. The complex refractive index was adapted for the different wavelength as and [5].
The raytracing analysis results in an absorptance of 0.91 which proves that the application of green wavelengths provides a maximum optimization potential for highly efficient welding processes.
5. Conclusions
For the first time the influence of magnesium on the geometry of the capillary and its absorptance was determined for full-penetration welding of high-strength aluminum alloys by means of monochrome X-ray imaging. The results show that an increasing magnesium content leads to an additional expansion of the diameter of the capillary, which coincides with the reduction of the aspect ratio and of the absorptance. No evidence was found that silicon influences the geometry of the capillary. According to [7,24] zinc affects the vapor pressure in a similar way as magnesium, which leads to the prediction of a similar reduction of the absorptance in case of full-penetration laser beam welding of aluminum alloys with high zinc content.
Additionally, the results show that full-penetration welding with a capillary which is closed at the bottom is more efficient than welding with a capillary which is opened at its bottom and that green laser sources with high focusability provide the possibility to enhance the absorptance with narrow capillaries.
From the presented study one can conclude, that the absorptance of capillaries in laser beam welding can be optimized by the choice of the material, the choice of the focusability of the laser beam, and the adjustment of the mode of full-penetration. These three proposed methods for the enhancement of the absorptance enable users to select the most suitable for the requirements of each process and joint.
Supplementary Materials
The following are available online at https://www.mdpi.com/article/10.3390/met11050797/s1, Video S1: X-ray_mode_A_and_mode_B_AA1050A_IR, Video S2: X-ray_mode_B_AA5754_IR, Video S3: X-ray_mode_A_AA1050A_green. Geometry files of reconstructed capillaries: Files S4–S33.
Author Contributions
Conceptualization, J.W. and C.H.; investigation, J.W., C.H. and M.H.; writing—original draft preparation, J.W.; writing—review and editing, C.H., R.W., A.O. and T.G. All authors have read and agreed to the published version of the manuscript.
Funding
This work was funded by the Deutsche Forschungsgemeinschaft (DFG, German Research Foundation)—266218804.
Institutional Review Board Statement
Not applicable.
Data Availability Statement
Data is contained within the article or Supplementary Material.
Acknowledgments
This research was supported by TRUMPF GmbH & Co. KG. The presented investigations were carried out in cooperation with DESY in Hamburg and with RWTH Aachen University within the framework of the Collaborative Research Centre SFB1120-236616214 “Bauteilpräzision durch Beherrschung von Schmelze und Erstarrung in Produktionsprozessen” and funded by the Deutsche Forschungsgemeinschaft e.V. (DFG, German Research Foundation). We acknowledge DESY (Hamburg, Germany), a member of the Helmholtz Association HGF, for the provision of experimental facilities. Parts of this research were carried out at PETRA III and we would like to thank F. Beckmann and J. Moosmann for assistance in using P07 EH4. Beamtime was allocated for proposal I-20191140. The sponsorship and support is gratefully acknowledged.
Conflicts of Interest
The authors declare no conflict of interest. The funders had no role in the design of the study; in the collection, analyses, or interpretation of data; in the writing of the manuscript, or in the decision to publish the results.
References
- Hagenlocher, C.; Lind, J.; Weber, R.; Graf, T. High-Speed X-ray Investigation of Pore Formation during Full Penetration Laser Beam Welding of AA6016 Aluminum Sheets Contaminated with Lubricants. Appl. Sci. 2020, 10, 2077. [Google Scholar] [CrossRef]
- Chang, B.; Allen, C.; Blackburn, J.; Hilton, P.; Du, D. Fluid Flow Characteristics and Porosity Behavior in Full Penetration Laser Welding of a Titanium Alloy. Metall. Mater. Trans. B 2015, 46, 906–918. [Google Scholar] [CrossRef]
- Fabbro, R.; Slimani, S.; Coste, F.; Briand, F. Study of keyhole behaviour for full penetration Nd–Yag CW laser welding. J. Phys. D Appl. Phys. 2005, 38, 1881–1887. [Google Scholar] [CrossRef]
- Gouffé, A. Corrections d’ouverture des corps-noirs artificiels compte tenu des diffusions multiples internes. Rev. Opt. 1945, 24, 1–7. [Google Scholar]
- Hügel, H.; Graf, T. Laser in der Fertigung: Grundlagen der Strahlquellen, Systeme, Fertigungsverfahren, 3rd ed.; Springer: Wiesbaden, Germany, 2014; ISBN 9783834818171. [Google Scholar]
- Dausinger, F. Strahlwerkzeug Laser: Energiekopplung und Prozesseffektivität; Stuttgart Teubner: Stuttgart, Germany, 1995; ISBN 3-519-06217-8. [Google Scholar]
- Galicia-Gutiérrez, O.M.; de Lange, D.F.; Aalderink, B.J.; Romero-Méndez, R. Analysis of laser welding of different aluminum alloys. In Proceedings of ICALEO, 32nd International Congress on Applications of Lasers & Electro-Optics, Miami, Florida, USA, 6–10 October, 2013; Kaierle, S., Ed.; Laser Institute of America: Orlando, FL, USA, 2013; pp. 405–414. ISBN 978-0-912035-98-7. [Google Scholar]
- Hugger, F.; Punzel, E.; Schmidt, M. Experimental results and modelling of element loss in continuous laser beam welding of aluminum alloys. In Proceedings of the LiM Lasers in Manufacturing Conference 2019, Munich, Germany, 24–27 June 2019; WLT Wissenschaftliche Gesellschaft Lasertechnik e.V.: Munich, Germany, 2019. [Google Scholar]
- Miyagi, M.; Wang, H.; Yoshida, R.; Kawahito, Y.; Kawakami, H.; Shoubu, T. Effect of alloy element on weld pool dynamics in laser welding of aluminum alloys. Sci. Rep. 2018, 8, 12944. [Google Scholar] [CrossRef] [PubMed]
- Schell, N.; King, A.; Beckmann, F.; Fischer, T.; Müller, M.; Schreyer, A. The High Energy Materials Science Beamline (HEMS) at PETRA III. MSF 2013, 772, 57–61. [Google Scholar] [CrossRef]
- Lind, J.; Hagenlocher, C.; Blazquez-Sanchez, D.; Hummel, M.; Olowinsky, A.; Weber, R.; Graf, T. Influence of the laser cutting front geometry on the striation formation analysed with high-speed synchrotron X-ray imaging. IOP Conf. Ser. Mater. Sci. Eng. 2021. submitted. [Google Scholar]
- Kalman, R.E. A New Approach to Linear Filtering and Prediction Problems. J. Basic Eng. 1960, 82, 35–45. [Google Scholar] [CrossRef]
- Diebold, F.X. Forecasting, Structural Time Series Models and the Kalman Filter, Harvey, A.C., Ed.; Cambridge University Press, 1939—Fore Casting, Structural Time Series Models and The Kalman Filter, Harvey, A.C., Ed.; Cambridge University Press, 1989. Econom. Theory 1992, 8, 293–299. [Google Scholar] [CrossRef]
- DIN EN 573-3:2019-10, Aluminium und Aluminiumlegierungen—Chemische Zusammensetzung und Form von Halbzeug—Teil_3: Chemische Zusammensetzung und Erzeugnisformen; Deutsche Fassung EN 573-3:2019; 77.120.10; 77.150.10 (DIN EN 573-3); Beuth Verlag GmbH: Berlin, Germany, 2019. [CrossRef]
- Kammer, C. Aluminium-Taschenbuch, 15th ed.; Aluminium-Verlag: Düsseldorf, Germany, 1998; ISBN 3-87017-241-X. [Google Scholar]
- Rapp, H.-J. Laserschweißeignung Von Aluminiumwerkstoffen Für Anwendungen Im Leichtbau; Vieweg+Teubner Verlag: Wiesbaden, Germany, 1996; ISBN 9783663122098. [Google Scholar]
- Van der Veen, F.; Pfeiffer, F. Coherent X-ray scattering. J. Phys. Condens. Matter 2004, 16, 5003–5030. [Google Scholar] [CrossRef]
- Lind, J.; Fetzer, F.; Hagenlocher, C.; Blazquez-Sanchez, D.; Weber, R.; Graf, T. Transition from Stable Laser Fusion Cutting Conditions to Incomplete Cutting Analysed with High-speed X-ray Imaging. J. Manuf. Process. 2020, 60, 470–480. [Google Scholar] [CrossRef]
- Fetzer, F.; Hagenlocher, C.; Weber, R.; Graf, T. Geometry and stability of the capillary during deep-penetration laser welding of AlMgSi at high feed rates. Opt. Laser Technol. 2021, 133, 106562. [Google Scholar] [CrossRef]
- Chantler, C.T.; Olsen, K.; Dragoset, R.A.; Chang, J.; Kishore, A.R.; Kotochigova, S.; Zucker, D.S. X-ray Form Factor, Attenuation and Scattering Tables (Version 2.1); National Institute of Standards and Technology: Gaithersburg, MD, USA, 1995; Originally published as Chantler, C.T. J. Phys. Chem. Ref. Data 2000, 29, 597–1048; and Chantler, C.T. J. Phys. Chem. Ref. Data 1995, 24, 71–643. Available online: http://physics.nist.gov/ffast (accessed on 3 March 2012).
- Demtroder, W. Experimentalphysik: Atome, Moleküle und Festkorper, 5th ed.; Springer: Berlin/Heidelberg, Germany, 2016; ISBN 9783662490945. [Google Scholar]
- Lambert, J.H. Photometria Sive de Mensura et Gradibus Luminis, Colorum et Umbrae; Sumptibus Vidvae Eberhardi Klett: Augsburg, Germany, 1760. [Google Scholar]
- Pedrotti, F.; Pedrotti, L.; Bausch, W.; Schmidt, H. Optik für Ingenieure: Grundlagen, 3rd ed.; Springer: Berlin/Heidelberg, Germany, 2005; ISBN 9783540273790. [Google Scholar]
- Andersson, J.-O.; Helander, T.; Höglund, L.; Shi, P.; Sundman, B. Thermo-Calc & DICTRA, computational tools for materials science. Calphad 2002, 26, 273–312. [Google Scholar] [CrossRef]


Publisher’s Note: MDPI stays neutral with regard to jurisdictional claims in published maps and institutional affiliations. |
© 2021 by the authors. Licensee MDPI, Basel, Switzerland. This article is an open access article distributed under the terms and conditions of the Creative Commons Attribution (CC BY) license (https://creativecommons.org/licenses/by/4.0/).