Article

Influence of Welding Parameters and Filler Material on the Mechanical Properties of HSLA Steel S960MC Welded Joints

1
Faculty of Mechanical Engineering, University of Žilina, Univerzitná 8215/1, 010 26 Žilina, Slovakia
2
Research Centre of the University of Žilina, University of Žilina, Univerzitná 8215/1, 010 26 Žilina, Slovakia
*
Author to whom correspondence should be addressed.
Metals 2021, 11(2), 305; https://doi.org/10.3390/met11020305
Submission received: 21 January 2021 / Revised: 6 February 2021 / Accepted: 7 February 2021 / Published: 9 February 2021
(This article belongs to the Special Issue Fusion Welding)

Abstract

:
This article provides an overview of the influence of welding parameters and filler material on changes in the heat-affected zone (HAZ) of thermo-mechanically controlled processed (TMCP) steel welded joints. The research focused on evaluating the effect of heat input and cooling rate on the width of the soft zone, which significantly affects the mechanical properties of welded joints. The negative effect of the soft zone is more pronounced as the thickness of the material decreases. Therefore, the object of this research was a 3-mm-thick sheet of S960MC steel welded by gas metal arc welding (GMAW) and metal-cored arc welding (MCAW) technology. Variable welding parameters were reflected in different heat input and cooling rate values, which led to a change in the properties of the HAZ and thus the mechanical properties of the welded joints. The changes in the HAZ were analyzed by microscopic analysis and mechanical testing. The measured results showed a significant effect of heat input on the cooling rate, which considerably affected the width of the soft zone in the HAZ and thus the overall mechanical properties of the welded joints.

Graphical Abstract

1. Introduction

Since their introduction in the 1980s, thermo-mechanically controlled processed (TMCP) steels have undergone continuous development, resulting in them now being a highly applicable material in several areas of industry [1,2]. They are mainly used in the manufacturing of heavy vehicles for the mining industry, ships, cranes, pipelines, etc. The main advantage of TMCP steels is their combination of properties, such as high strength, good toughness, formability, and weldability. All these properties are fully met by the assessed steel S960MC, which was developed specifically for the load-bearing parts of cranes and other heavy equipment [3]. These properties are achieved by several strengthening mechanisms, such as fine-grained strengthening, solid solution strengthening, and precipitation strengthening. Particularly important is the mechanism of fine-grained strengthening, which is the only strengthening mechanism that does not have a negative impact on the toughness with increasing strength. The mentioned strengthening mechanisms can be achieved through a thermo-mechanically controlled process. In this process, the steel is rolled with strictly controlled deformation and temperature, which, in combination with the precipitation of dispersive precipitates, results in a fine-grained microstructure at the end of process. However, the mechanical properties themselves may differ depending on the chemical composition and the thermo-mechanical processing. Therefore, a strength range from 350 up to 1100 MPa can be achieved in TMCP steels [3,4].
The high strength and good formability of the assessed steel, S960MC, is also ensured by the fine-grained microstructure achieved by the thermo-mechanical controlled process. The presence of Nb, Ti, and V elements is particularly important in this process, as they form dispersive precipitates of the (Ti, Nb) (C, N) type, which provide precipitation hardening and sufficient grain refinement [1,5]. These elements’ function mechanisms vary, and have different utilization ranges. In the case of Nb, refined microstructure can be commonly obtained through phase transformation of deformed austenite obtained by rolling the non-recrystallization region. Precipitate strengthening provided by Nb carbonitrides particles also promotes the strength of steel. Vanadium generally optimizes the grain size through recrystallization region rolling, precipitate strengthening, and fine- grain strengthening produced by V carbonitrides precipitates [6,7]. It follows that the obtained microstructure cannot be replaced by any of the heat treatment methods. Therefore, during the exceeded thermal loading of steel, non-irreversible microstructural changes occur in the heat-affected zone (HAZ). The welding process thus causes changes in the base material that may adversely affect the mechanical properties of the welded joints. In particular, hydrogen-induced cracking (HIC) and softening may occur [8,9,10,11]. Modern TMCP steels are more resistant to HIC, and therefore the limitations in the welding process focus on suppressing the formation of the soft zone in the HAZ [12]. Despite the resistance to cracking, cracks in the weld metal could occur in cases where the cooling rate is too high. When welding TMCP steel, a similar phenomenon can be encountered during such a conditions, e.g., wet welding [13].
Depending on the temperature reached, softening is divided into transformation softening (if the temperature has exceeded Ac1) and tempering softening (below Ac1) [8,14]. The phenomenon of softening has been the subject of several studies, which include excess heat input and a low cooling rate as the key issues of the decrease in strength [9,14,15,16,17,18,19,20,21,22,23]. With an increasing maximum temperature and a decreasing cooling rate, changes in the HAZ properties are more pronounced. This is mainly reflected in an increase in the width of the soft zone and thus a decrease in strength. Due to the constraint effect, the reduction in strength is not necessary and it only occurs if the width of the soft zone is excessive. The principles of the constraint effect on welded joints have been described by Maurer et al. [19] and Rodrigues et al. [24]. This is confirmed by several studies that have shown that the strength of the welds reaches the values of the base material, despite the occurrence of the soft zone. However, with an excessive width of the soft zone, the strength decreases significantly.
When determining the impact of the soft zone width on the strength, the thickness of the welded material must be considered. Therefore, the relative thickness of the soft zone (XSZ) is calculated, which is determined as the ratio of the width of the soft zone to the thickness of the material. As the XSZ value decreases, the strength of the welded joints increases. Theoretically, with a sufficiently small XSZ, the weld can reach the strength of the base material. However, the limit of this value varies depending on the base material, the methodology for determining the soft zone, and the filler material used (overmatching, matching, or undermatching weld metal) [8,14,19,25,26,27].
Welded joints of larger thicknesses usually have no problem achieving the required strength, despite the wider width of the soft zone. This is because the XSZ is small enough, taking into account the thickness of the base material. Particularly problematic is the welding of thin sheets, where the XSZ is too large and the strength of the welded joints is insufficient. The reason is the slower heat transfer from the weld and the associated reduced cooling rate. The reduced cooling rate affects the increase in the width of the soft zone, which, in the case of materials with a smaller thickness, results in a more significant decrease in the strength of the welded joint. Therefore, it is important not to exceed the maximum allowed heat input when welding thin sheets. For individual purposes, this decrease in strength is often accepted, but it should be noted that there is an inefficient use of the base material properties. The use of gas metal arc welding (GMAW) for welding high-strength TMCP steel with a variable heat input can be observed in the work of Jambor et al. [16]. By decreasing the heat input, a slight improvement in strength was achieved, which, however, still did not reach the values of the base material. This principle does not apply to welded joints with larger thicknesses. As the thickness of the material increases, the heat transfer from the weld is sufficient (higher cooling rate) and the resulting width of the soft zone does not result in a decrease in strength. This was demonstrated by Lahtinen et al. [28] and Silva et al. [29].
The current work was therefore focused on optimizing the welding process of thin sheets in the field of arc welding technology. The aim was to set up the welding parameters for different filler materials and welding technologies in order to reduce the heat input and the associated cooling rate as key parameters affecting the properties of the HAZ. It was assumed that by reducing the heat input and time t8/5 (a cooling time between 800 °C and 500 °C), the soft zone would narrow and the strength would increase.
In particular, the use of a metal-cored wire (i.e., in metal-cored arc welding (MCAW)) presupposes a significant reduction in heat input. The main advantage of a metal-cored wire compared to a solid wire is the higher current density. Current density is the key factor determining the melting rate, deposition rate (kg/h), and penetration. It is expressed by the ratio of current flow and cross-section area of the outer metallic tube. The welding current flows through the tube because of its lower electrical resistance. Compared to GMAW with a solid wire, the same current flows through a smaller cross-section, which is why cored wires always delivers higher current densities at a similar wire feed speed. Because of this, lower welding currents can be applied to achieve the same productivity (compared to GMAW with solid wires) [30,31]. Therefore, a metal-cored wire was chosen as an alternative solution to reduce the heat input and time t8/5 when using gas metal arc welding technology.

2. Materials and Methods

2.1. Experimental Materials

For the purposes of this work, Strenx 960MC structural steel sheets (SSAB, Stockholm, Sweden) with a thickness of 3 mm were used. As mentioned above, the steel was produced by a thermo-mechanically controlled process and its high strength was achieved by the fine-grained microstructure composed of martensite, tempered martensite, and residual austenite with dispersive precipitates of elements such as Nb, V, and Ti. Microalloying with Nb, V, and Ti elements in a maximum sum of 0.22 wt.% was required to achieve a fine-grained microstructure in the thermo-mechanically controlled process. The mechanical properties of the steel given by the inspection certificate are shown in Table 1 and the chemical composition according to the EN 10204 3.1 material certificate provided by the steel manufacturer (SSAB) is in Table 2.
Two types of filler materials were used—a solid wire (Union X96) with a diameter of 1 mm, classified as G89 5 M21 Mn4Ni2.5CrMo according to STN EN ISO 16834-A, and a metal-cored wire (Böhler X96 L-MC) with a diameter of 1 mm, classified as T89 4 TMn2NiCrMo M M21 1 H5 according to STN EN ISO 18276-A (both Voestalpine, Linz, Austria). Table 3 shows the typical chemical compositions of the filler materials according to the manufacturer (Voestalpine).
The metal-cored wire, manufactured with seamless laser technology, was developed for shielded arc welding of thermo-mechanically quenched and tempered produced fine-grained structural steels. It consisted of an outer metal shell and a metal filler, containing most of the alloying elements that guaranteed the high mechanical properties of the weld metal. In addition to iron powder, these alloying elements were mainly Ni, Mn, Cr, and Mo, which, after solidification, ensured the formation of a martensitic structure in the weld metal. According to mechanical properties, both filler materials were classified as undermatching (with yield strength Rp0.2 ≥ 890 MPa).

2.2. Welding Procedure

Using GMAW and MCAW technologies, five modes of welding were used, which generated different heat inputs (Qp). In addition to the standard short arc (marked as GMAW-S and MCAW-S), the pulsed (marked as GMAW-P) and cold metal transfer (CMT) (marked as GMAW-CMT) welding modes were also used. For MCAW-S, additional cooling marked as MCAW-S cooled was also used. The Fronius TPS 2700 welding source was used for the short arc and pulsed welding modes. The CMT mode required a special welding source for its specifics, and therefore, the Fronius TPS 4000 CMT (both Fronius, Wels, Austria) was used. The welding torch was attached to the arm of a KUKA VKR 250/2 (KUKA, Augsburg, Germany) industrial robot. Thus, a constant welding speed, contact tip to work distance, and weld path were guaranteed. All process parameters were monitored by Fronius Xplorer software (Fronius, Wels, Austria). The actual welding parameters obtained by means of monitoring are shown in Table 4. The joint was designed as a butt weld with a square groove, and single-pass welds were made. The dimensions of the welded parts were 3 mm × 150 mm × 300 mm. Before welding, the plates were fixed by the welding jigs (Figure 1a) and the weld edges were cleaned and degreased. The weld gap varied, depending on the used welding method, from 1.5 to 2.3 mm.
The thermal cycles were determined using NiCr–NiAl-type K thermocouples with the NI-9212 temperature measurement module and LabView 2014 software (National Instruments, Austin, TX, USA), which were placed on the root side of the weld at various distances from the weld axis (Figure 1b). The distance was determined based on the shape of the weld and the weld bead. The temperature was recorded at a frequency of 50 Hz for each thermocouple. For the welded joint using additional cooling, the thermocouple could not be placed on the root side because of the additional cooling device, and was instead placed on the face side of the welded joint. However, due to the different shape of the weld bead, the individual cycles were not located at the same distance from the weld axis, with the distance from the weld axis instead ranging from 1.90 mm (MCAW-S) to 2.79 mm (GMAW-S). Therefore, the Tmax temperatures differed depending on the distance from the weld axis.
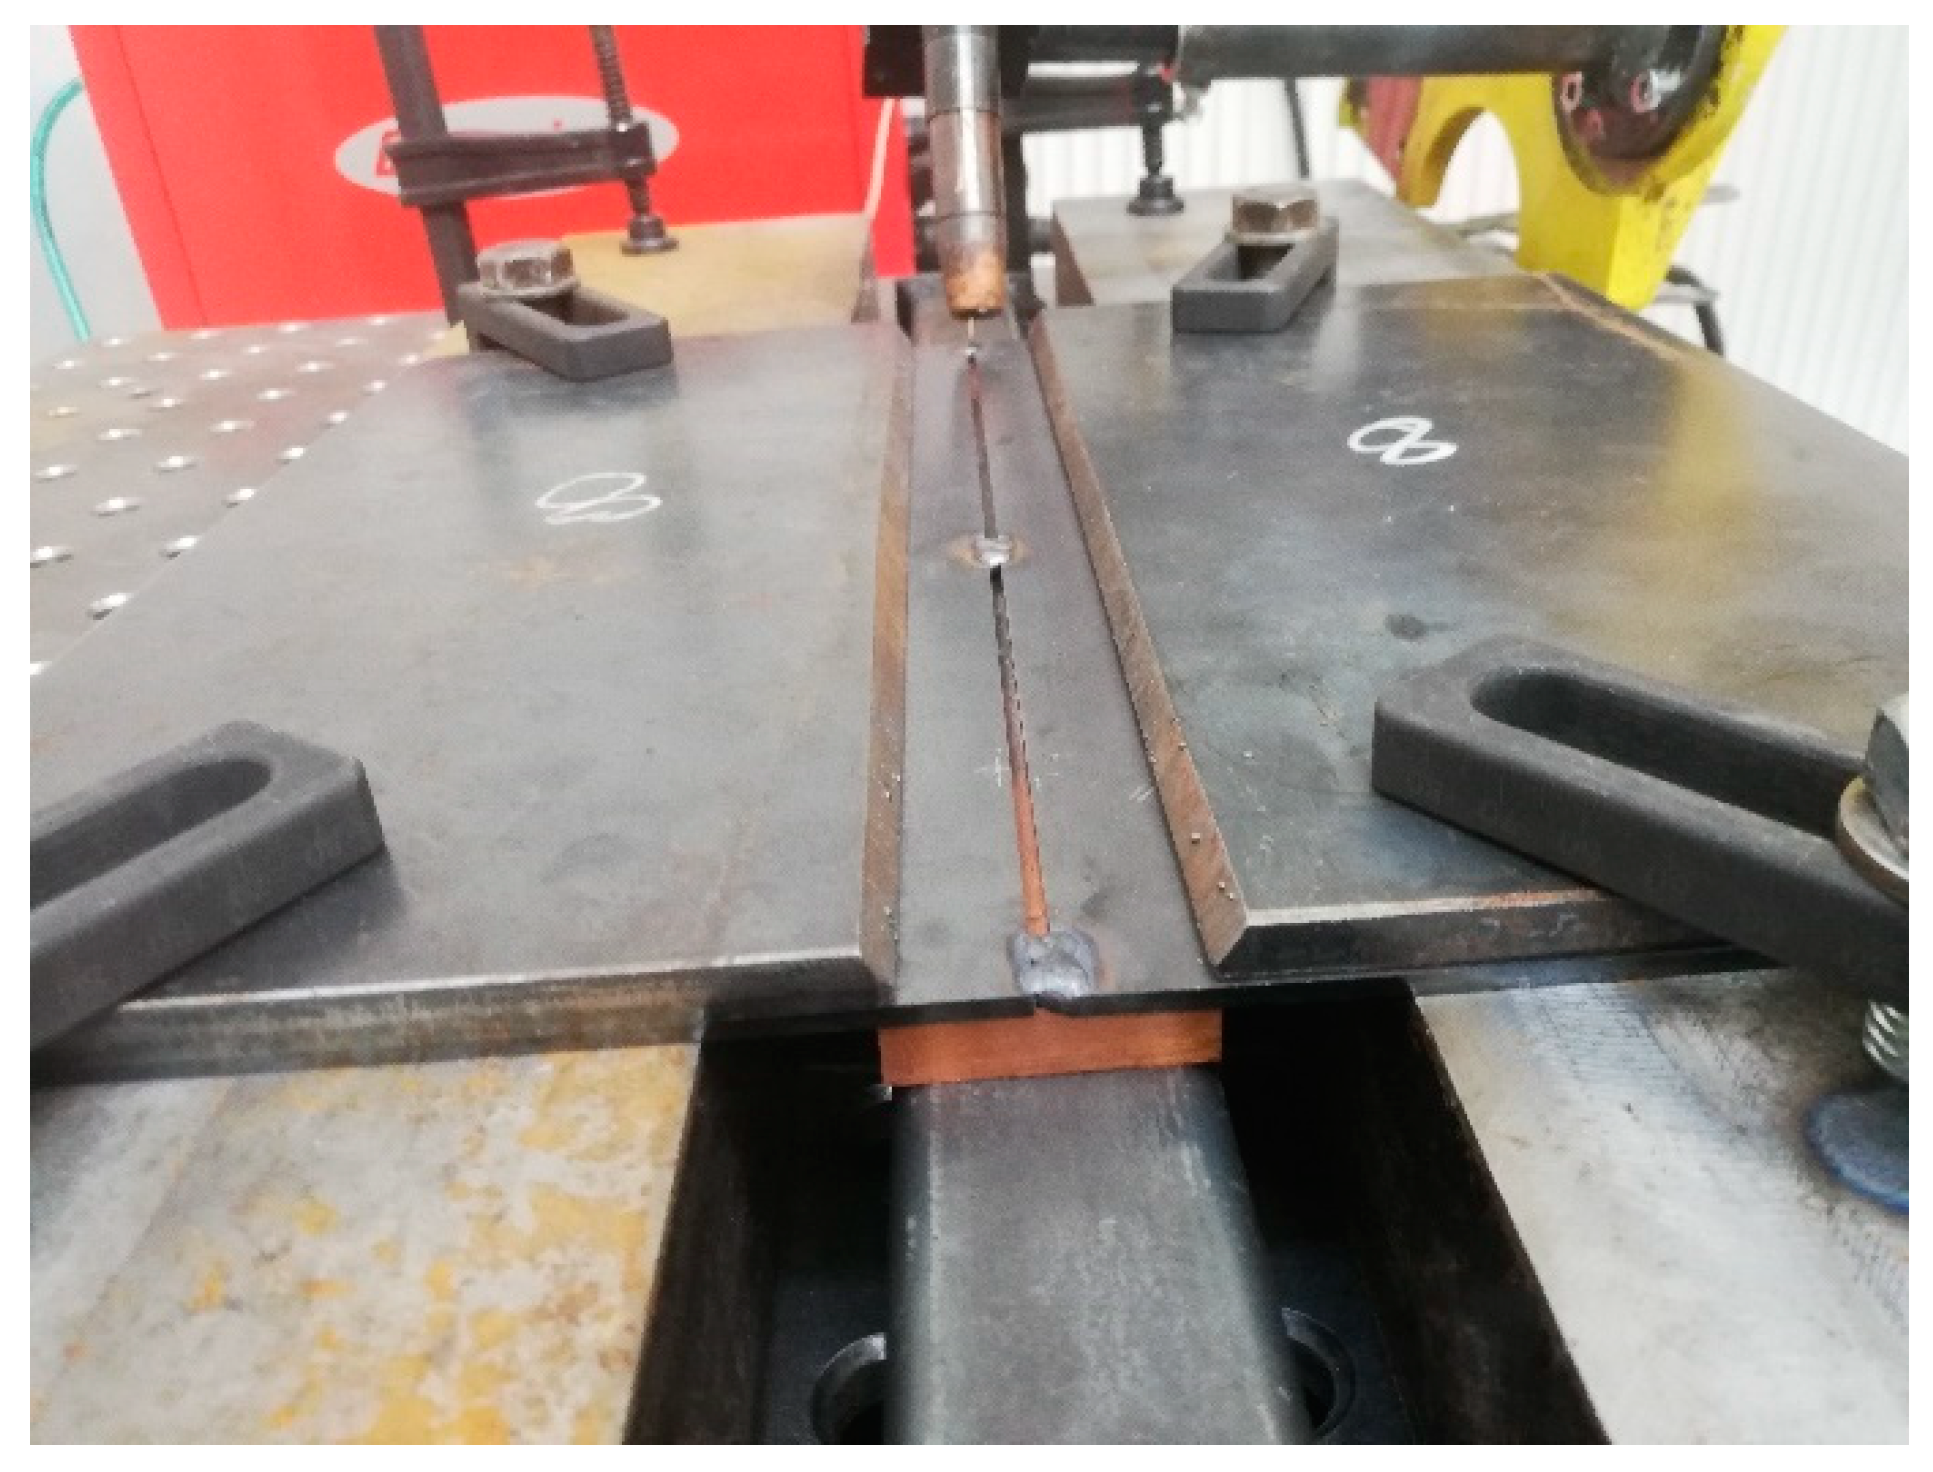
For accelerated heat transfer from the weld area, the weld was formed with a copper backing bar, which was glued to the heat exchanger with a thermally conductive paste (Figure 2). Welding with additive cooling was only used for MCAW technology with the standard short arc mode (marked as MCAW-S cooled). The cooling medium in the heat exchanger was tap water in an open circuit at a temperature of 7 °C. Water from the heat exchanger drained into the drain. The temperature was measured by a thermocouple placed on the surface of the exchanger. Using the MCAW-S cooled method, it was possible to significantly accelerate heat transfer from the weld and thus reduce the time t8/5.

2.3. Mechanical Testing and Microstructural Analysis

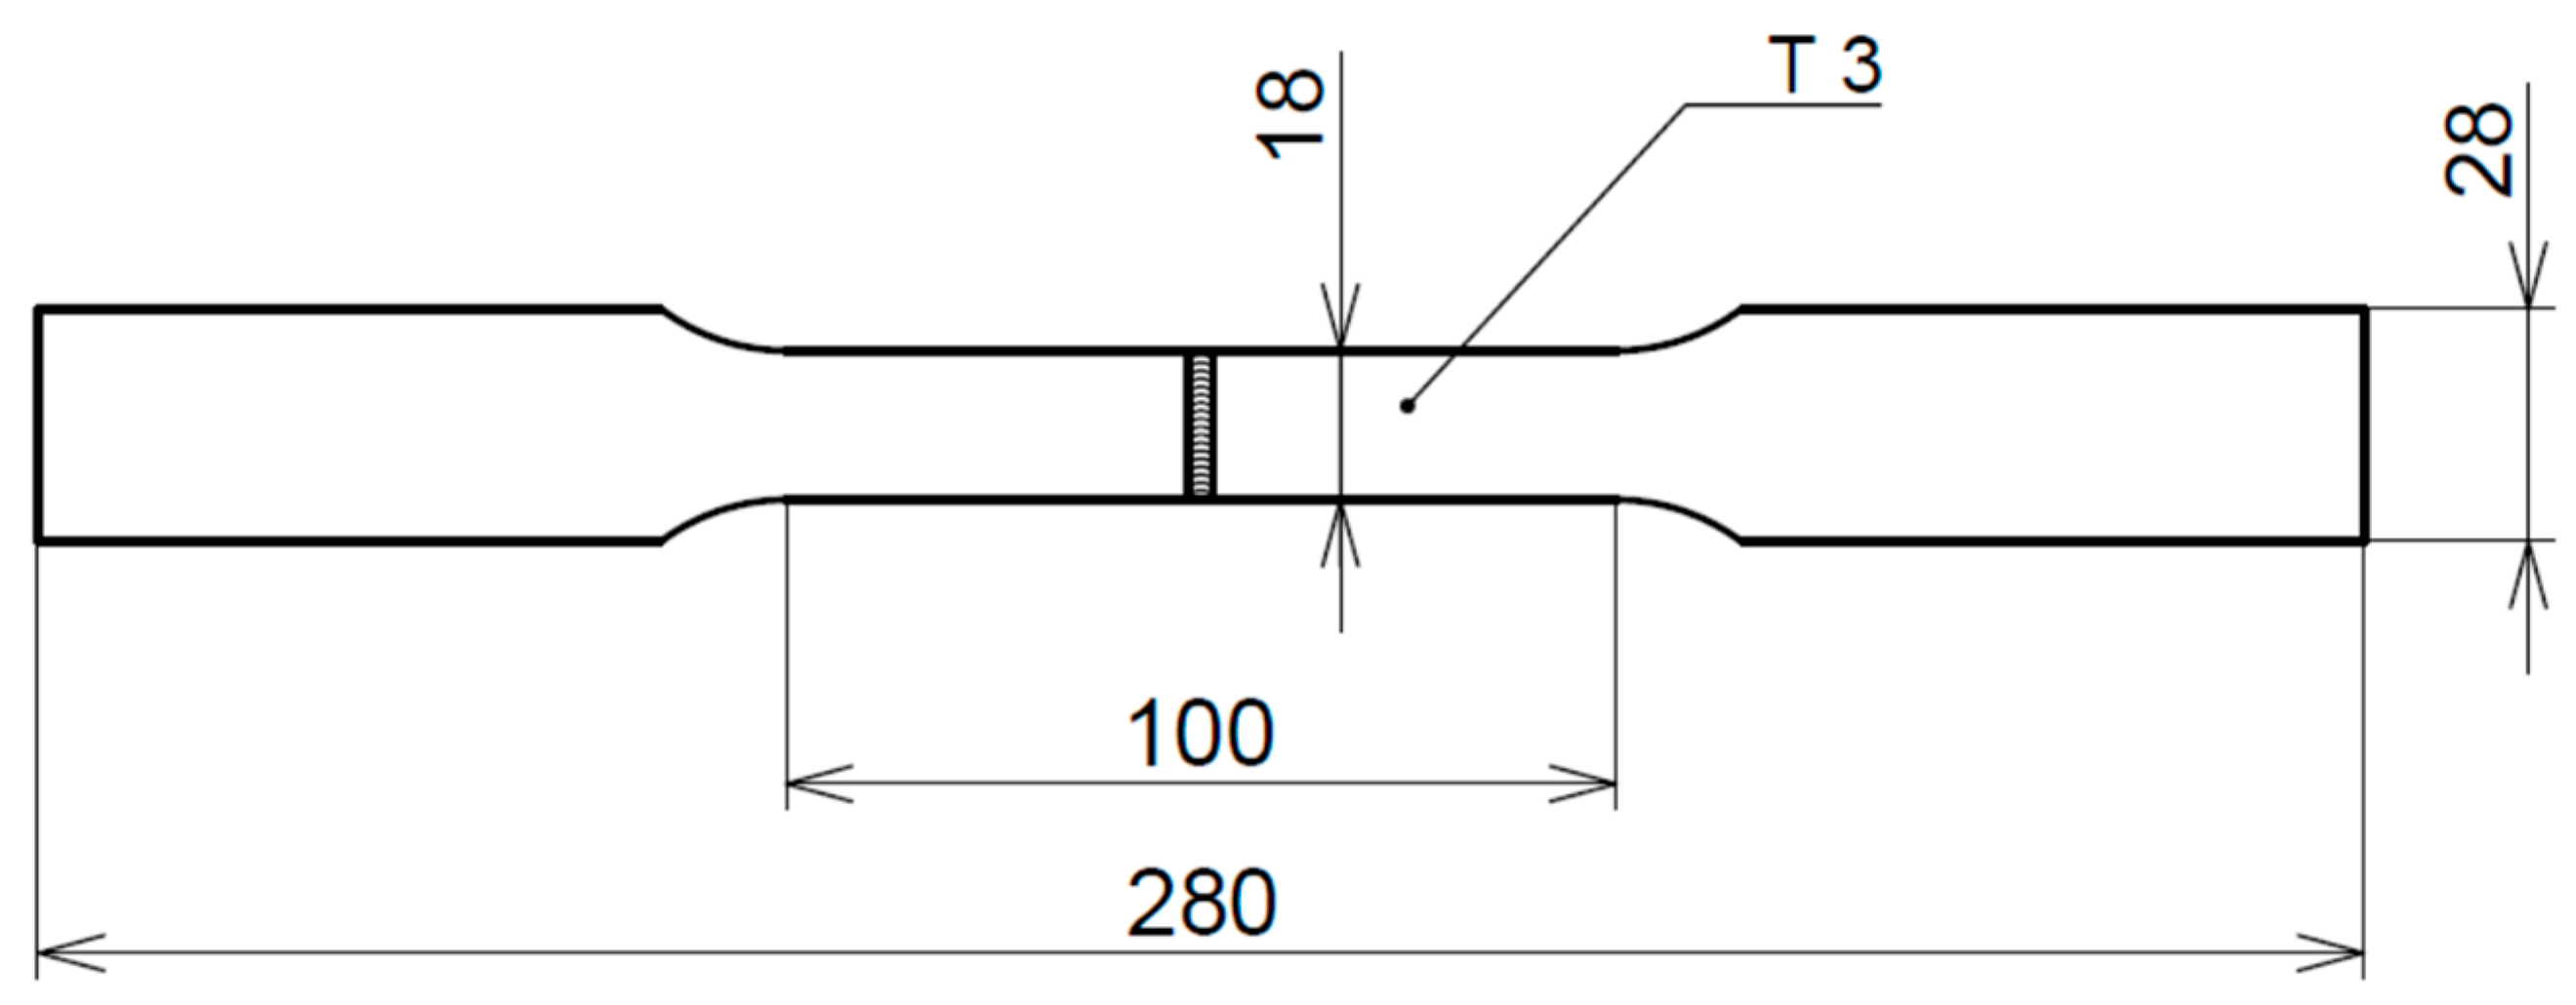
After the welding process, test specimens were taken from all welds for a tensile test, a hardness test, a bend test, and metallographic analysis. For the purpose of the tensile test, two samples were taken from each weld, from which the average values of yield strength, tensile strength, and elongation were determined. The elongation value was determined from the tensile test working diagram based on an extensometer and subsequently recalculated against the evaluated length. The performance of the tensile test and location of the test specimen were made according to the relevant standard STN EN ISO 4136. The test specimens were chosen to be non-proportional. Dimensions and designations were determined following the recommendations set out in the standard EN ISO 6892-1. The dimensions of the test specimen are shown in Figure 3. Measurements were performed on an INSTRON 5985 testing device (INSTRON, Norwood, MA, USA).
The bend test, which was performed according to STN EN ISO 5173 in order to obtain an overview of the ductility of the weld, was performed on four samples from each welded joint, where two samples were loaded from the root side (TRBB) and two samples from the face side (TFBB) of the weld. The essence of the test was the three-point bending deformation of the test specimen by load former up to the prescribed bending angle or until the detection of cracking. The diameter of the load former was determined to be 35 mm according to the required ductility of the base material.
The hardness mapping of the weld was determined by the Vickers method at a load of 1 kg (HV1). Measurements were performed on a Zwick/Roell ZHµ testing device (ZwickRoell, München, Germany) for all welded joints in half-profile to capture the hardness distribution in all areas of the weld. Therefore, for the welds with a wider HAZ, it was necessary to evaluate a wider area than for the welds with a narrower HAZ. The measurements were performed in five rows 0.3 mm apart, with the distance between the indentations being 0.25 mm. Independent of the hardness mapping, linear hardness measurements were performed by the Vickers method (HV1) on an Innovatest Nexus 4300 testing device (Innovatest, Maastricht, The Netherlands), which considered both HAZs. Based on these measurements, the width of the soft zones was evaluated.
The microstructures of the individual HAZ subzones were analyzed by light optical microscopy (LOM) using ZEISS LSM 700 device (Carl Zeiss AG, Oberkochen, Germany) at 500× magnification. To carry out a microstructural and macrostructural analysis, all samples were etched with 2% Nital. Macrostructural images were taken with an Olympus SZX16 device (Olympus, Shinjuku, Japan).

3. Results and Discussion

3.1. Thermal Cycle Analysis

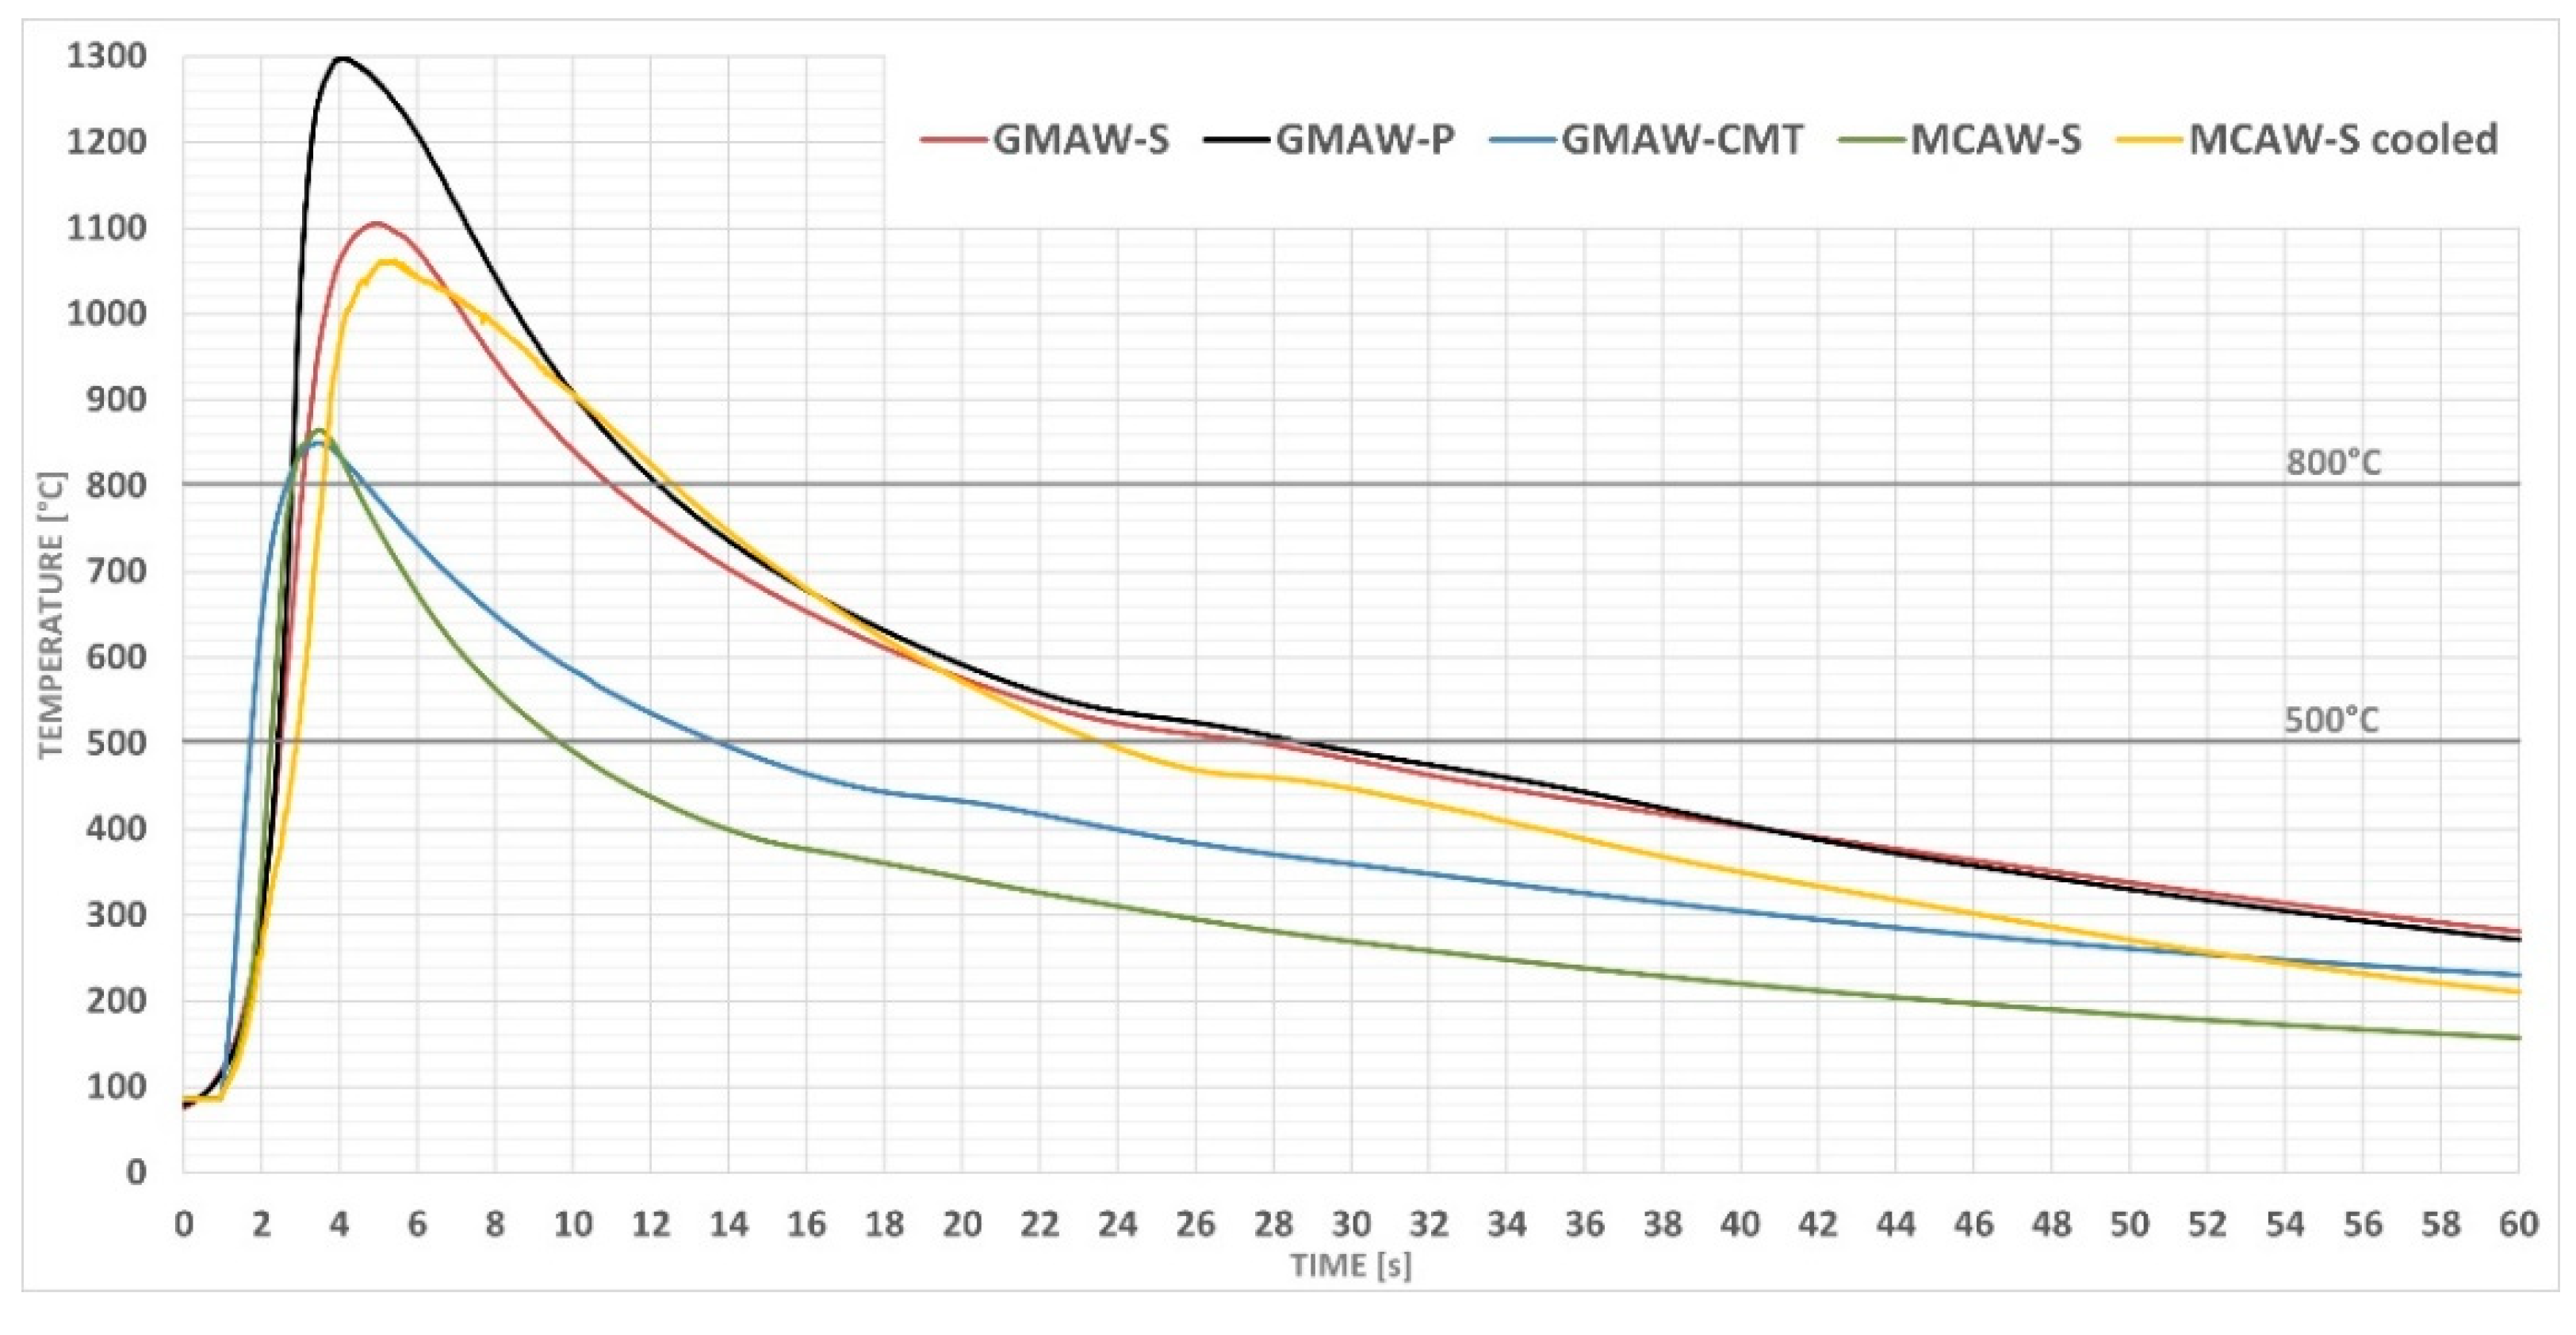
The amount of heat input had a significant effect on the distribution of the temperature field in the welding process. Figure 4 shows the thermal cycles of all assessed welds. The difference in temperature Tmax was caused by the different distances from the weld metal and by the welding mode. Higher heat input values significantly expanded the thermal impact and decreased the cooling rate.
A cooling time between 800 and 500 °C (t8/5) was determined from the measured thermal cycles. For all welded joints, the time t8/5 decreased together with the decreasing heat input. This characteristic applied regardless of the filler material used. Compared to the solid wire, the use of a metal-cored wire allowed a significant reduction in the heat input (when compared to the standard mode). This reduction also led to a decrease in time t8/5. By changing the welding parameters, the welding technology, and the filler material, it was possible to reduce the time t8/5 from 17.5 to 5.0 s. The analyzed parameters of the temperature cycles are given in Table 5. By adjusting the welding mode and changing the filler material, it was possible to significantly increase the cooling rate without excessive changes in the welding technology. The t8/5 value for the weld joint of MCAW-S cooled was affected due to different thermocouple placements (various maximal temperature cycle values).

3.2. Tensile Test

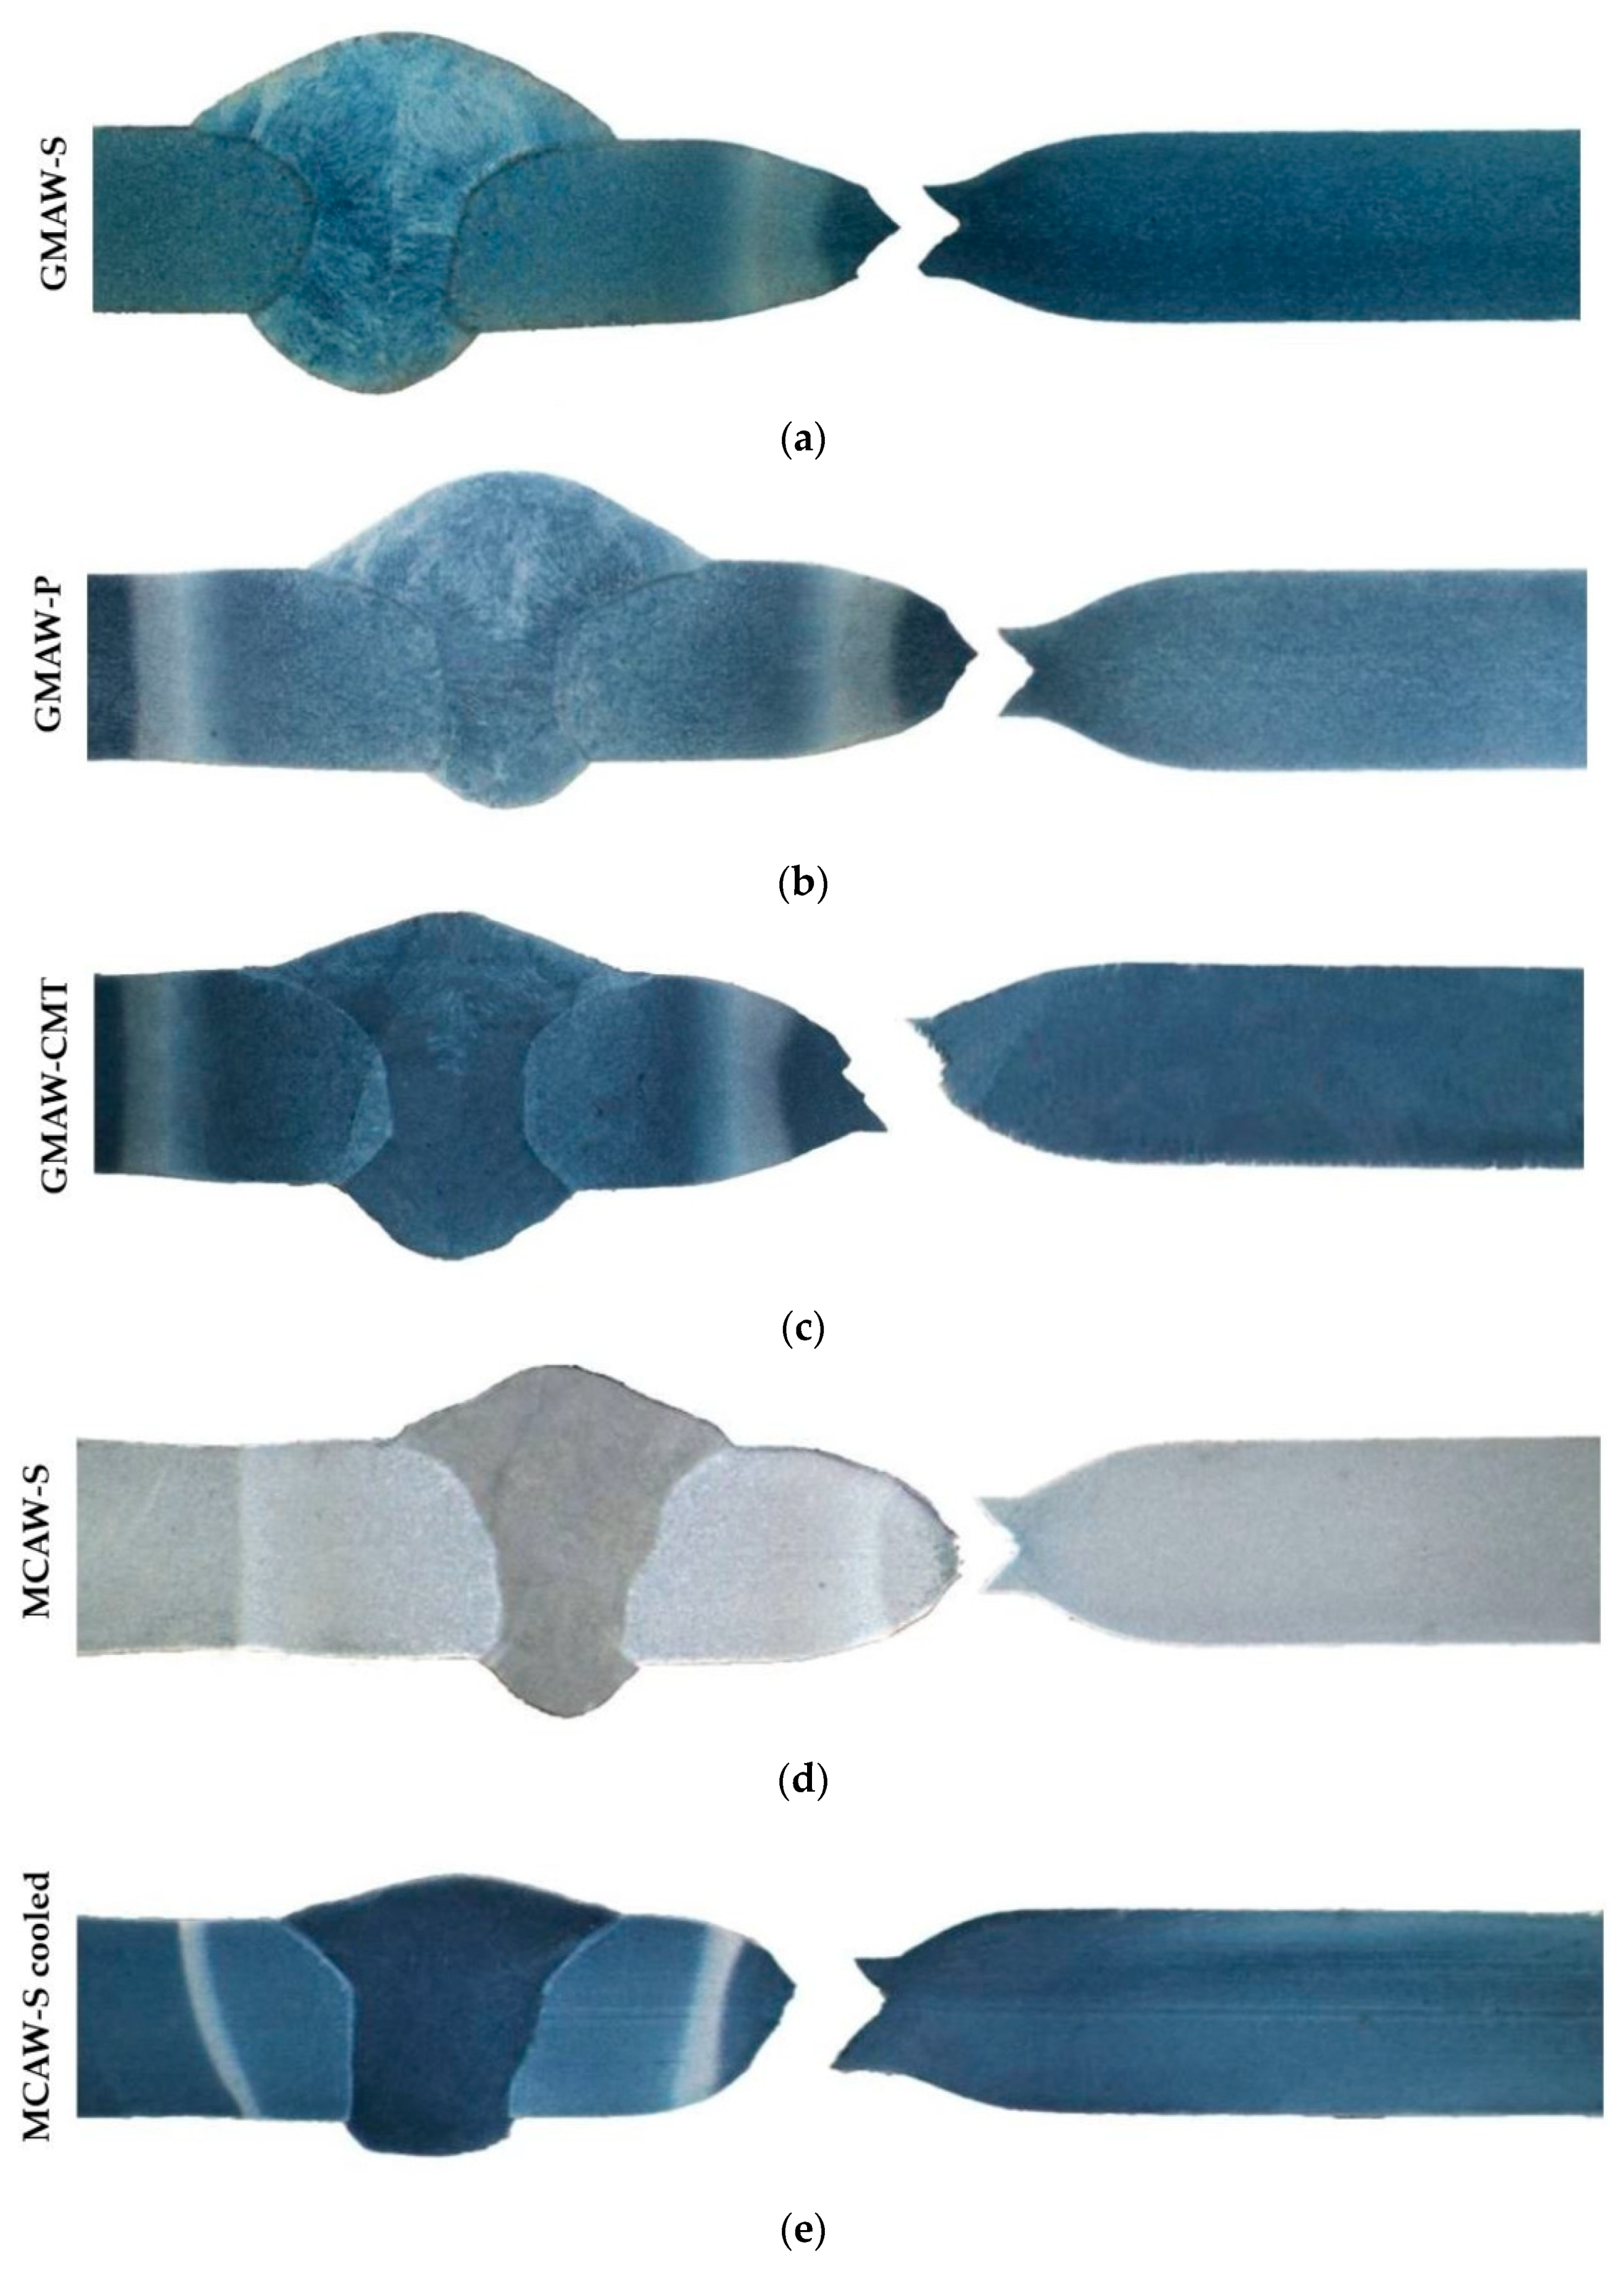
The average values of the yield strength (YS), tensile strength (TS), and elongation for each weld were measured by a static tensile test. These values are shown in Table 6. Since the given material does not show a significant yield point, the value of the yield strength Re had to be replaced by the offset yield point (or proof stress) Rp0.2, which is taken as the stress at which 0.2% plastic deformation occurs. The yield point was for all welds determined graphically from the working diagram of the tensile test. Figure 5 shows the fracture profiles that localize the yield point to the sub-critical HAZ (SCHAZ).
It can be seen from the above values that neither the yield strength nor the tensile strength reached the minimum values of the base material. These were set by the standard STN EN ISO 10149-2 at 960 MPa for the yield strength and 980 MPa for the tensile strength. It is possible to observe a significant decrease in elongation compared to the base material. The observed difference can be explained mainly by the different characteristics of the test specimens and the method of measurement using an extensometer, which can only determine the total elongation of the sample. Unlike the base material, the welded joint consisted of several areas, which had different mechanical properties, and the associated character of deformation. In the case of a given welded joint, the predominantly narrow HAZ area was deformed during the tensile test, while the weld metal and base material were deformed to a lesser extent. The measured value of elongation was thus influenced by these mechanisms of deformation. The deformation characteristics of the tensile test samples are shown in Figure 5.
Compared to other studies dealing with GMAW of S960MC steel, it is possible to observe a significant impact of material thickness on weldability, as presented in the Introduction. In the work of Schneider et. al., where 8 mm thick S960MC steel was welded with a comparable filler material, sufficient yield strength and tensile strength were achieved. Using standard GMAW, the cooling time was t8/5 = 6.5 s (root pass) and t8/5 = 9.5 (filler pass) [15]. Compared to the GMAW-S sample, where t8/5 = 17.5 s, there is a significant increase in the cooling rate caused by the influence of the material thickness.
According to the fracture profiles made after the tensile test (Figure 5), it can be observed that the fracture of the sample always occurred in the SCHAZ area.

3.3. Bend Test

Despite the low value of elongation, it was possible to achieve sufficient plastic properties of all welded joints. This was overcome by a bending test, to which four samples from each weld were subjected—2 × TRBB and 2 × TFBB were bent to the prescribed bending angle without the existence of external cracks and thus met the criteria set by the standard STN EN ISO 7438. Based on a literature review in the introduction, at high values of the cooling rate, cracks can occur in the weld metal [13]. After performing the bend test and visual inspection, despite the significant increase in the cooling rate, no cracks occurred. The steel can be considered resistant to cracking even at relatively high cooling rates (t8/5 = 5.0 s at MCAW-S welding). However, this statement cannot be applied in general, as the thickness of the welded material increases, the susceptibility to cracking also increases. In such cases, the manufacturer’s recommendations must be followed, and crack protection restrictions applied (e.g., preheating).

3.4. Hardness Mapping

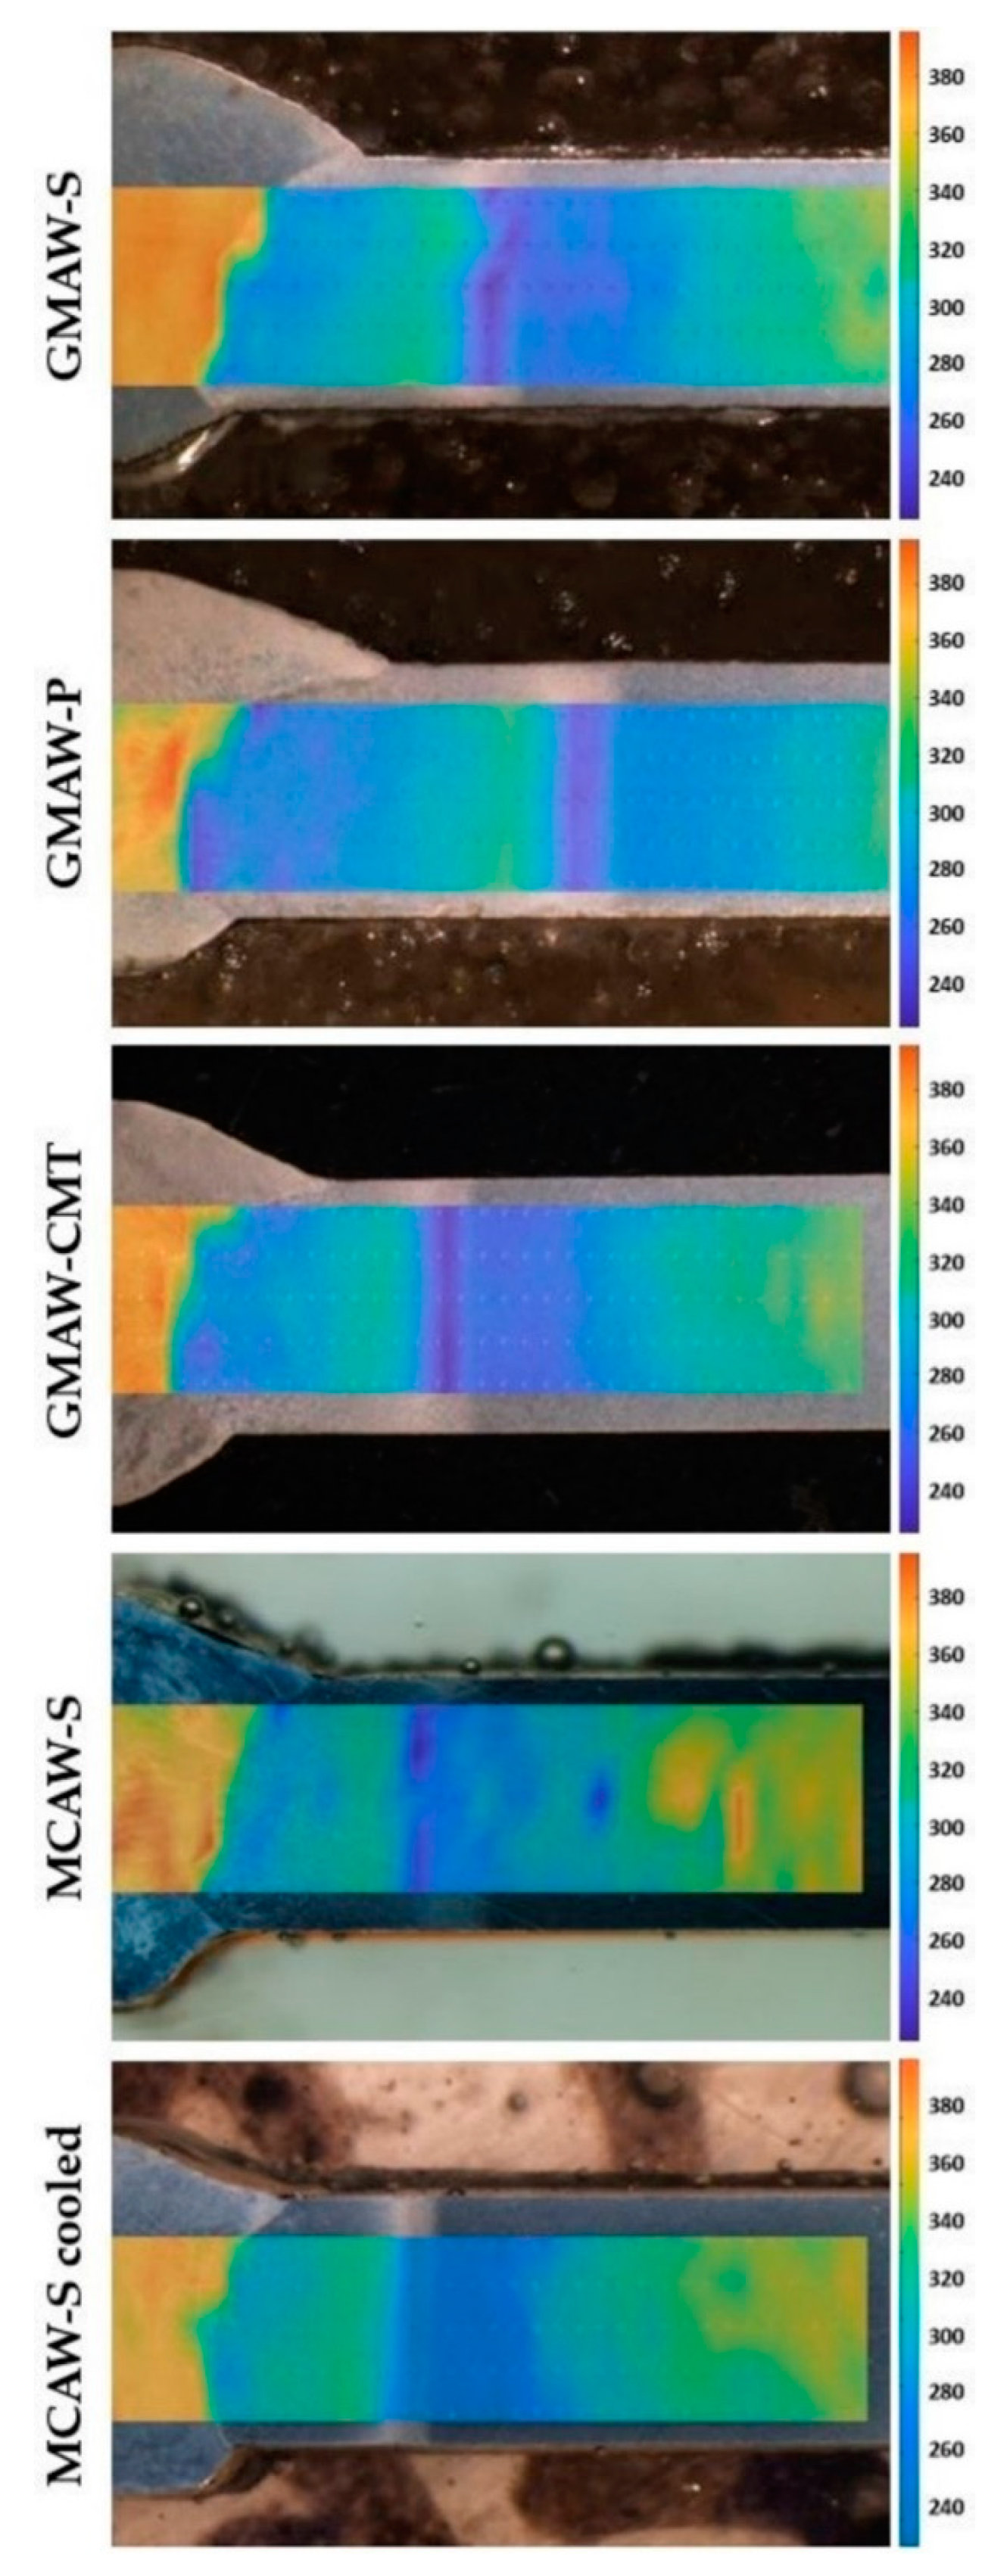
Hardness maps were made to better show the hardness distribution in the entire cross-section of the welded joint (Figure 6). The character of the hardness maps was similar for all assessed welded joints. It can be observed that the hardness of the weld metal in all cases exceeded the value of the hardness of the base material. The hardness reached the highest values in the weld metal and ranged from 370 to 430 HV1 depending on the welding method used. Unlike the base material, the high strength of the weld metal could not be achieved by grain refinement, nor did this increase depend on the welding parameters. In order to achieve a high strength, the weld filler was alloyed with elements such as Cr, Mo, and Ni (see Table 3). This guaranteed a high hardenability of the weld metal and thus its high strength and hardness.
The HAZ near the weld metal showed a sharp drop in hardness in the coarse-grain HAZ (CGHAZ) area for all welds. The most significant drop occurred in the GMAW-S and GMAW-P welded joints by the methods with the highest applied heat input. In the case of the fine-grain HAZ (FGHAZ), a different distance of this zone from the weld metal can be observed. This is because of the heat input, which significantly expanded the CGHAZ area and thus moved the FGHAZ area further away from the weld axis. The increased heat input also affected the inter-critical HAZ (ICHAZ). Due to the slower cooling rate, decay structures composed mainly of ferrite and residual austenite were formed here. The cooling rate also affected the amount and size of the niobium, vanadium, and titanium precipitates. With increasing time t8/5, the concentration of these micro-additions in the solution decreased, which significantly affected the phase transformations during cooling and thus the resulting microstructure [32,33]. Therefore, in the ICHAZ, the largest decrease in hardness can be observed. The minimum measured hardness values in the ICHAZ varied from 260 to 290 HV1 depending on the technology used. However, the measurements did not show a verifiable effect of the overall decrease in hardness in the ICHAZ on the strength of the welded joints.

3.5. Microstructural and Macrostructural Analysis

Weld metal and all the HAZ subzones were observed by microstructural analysis. Each of the subzones was exposed to different conditions in the welding process, which also resulted in different microstructures. Changes in the microstructures in the individual areas of the HAZ depended mainly on the chemical composition, maximum temperature reached, soaking time, and cooling rate. Therefore, the grain size, hardness, and width of the individual zones differed depending on the welding parameters and the technology used.
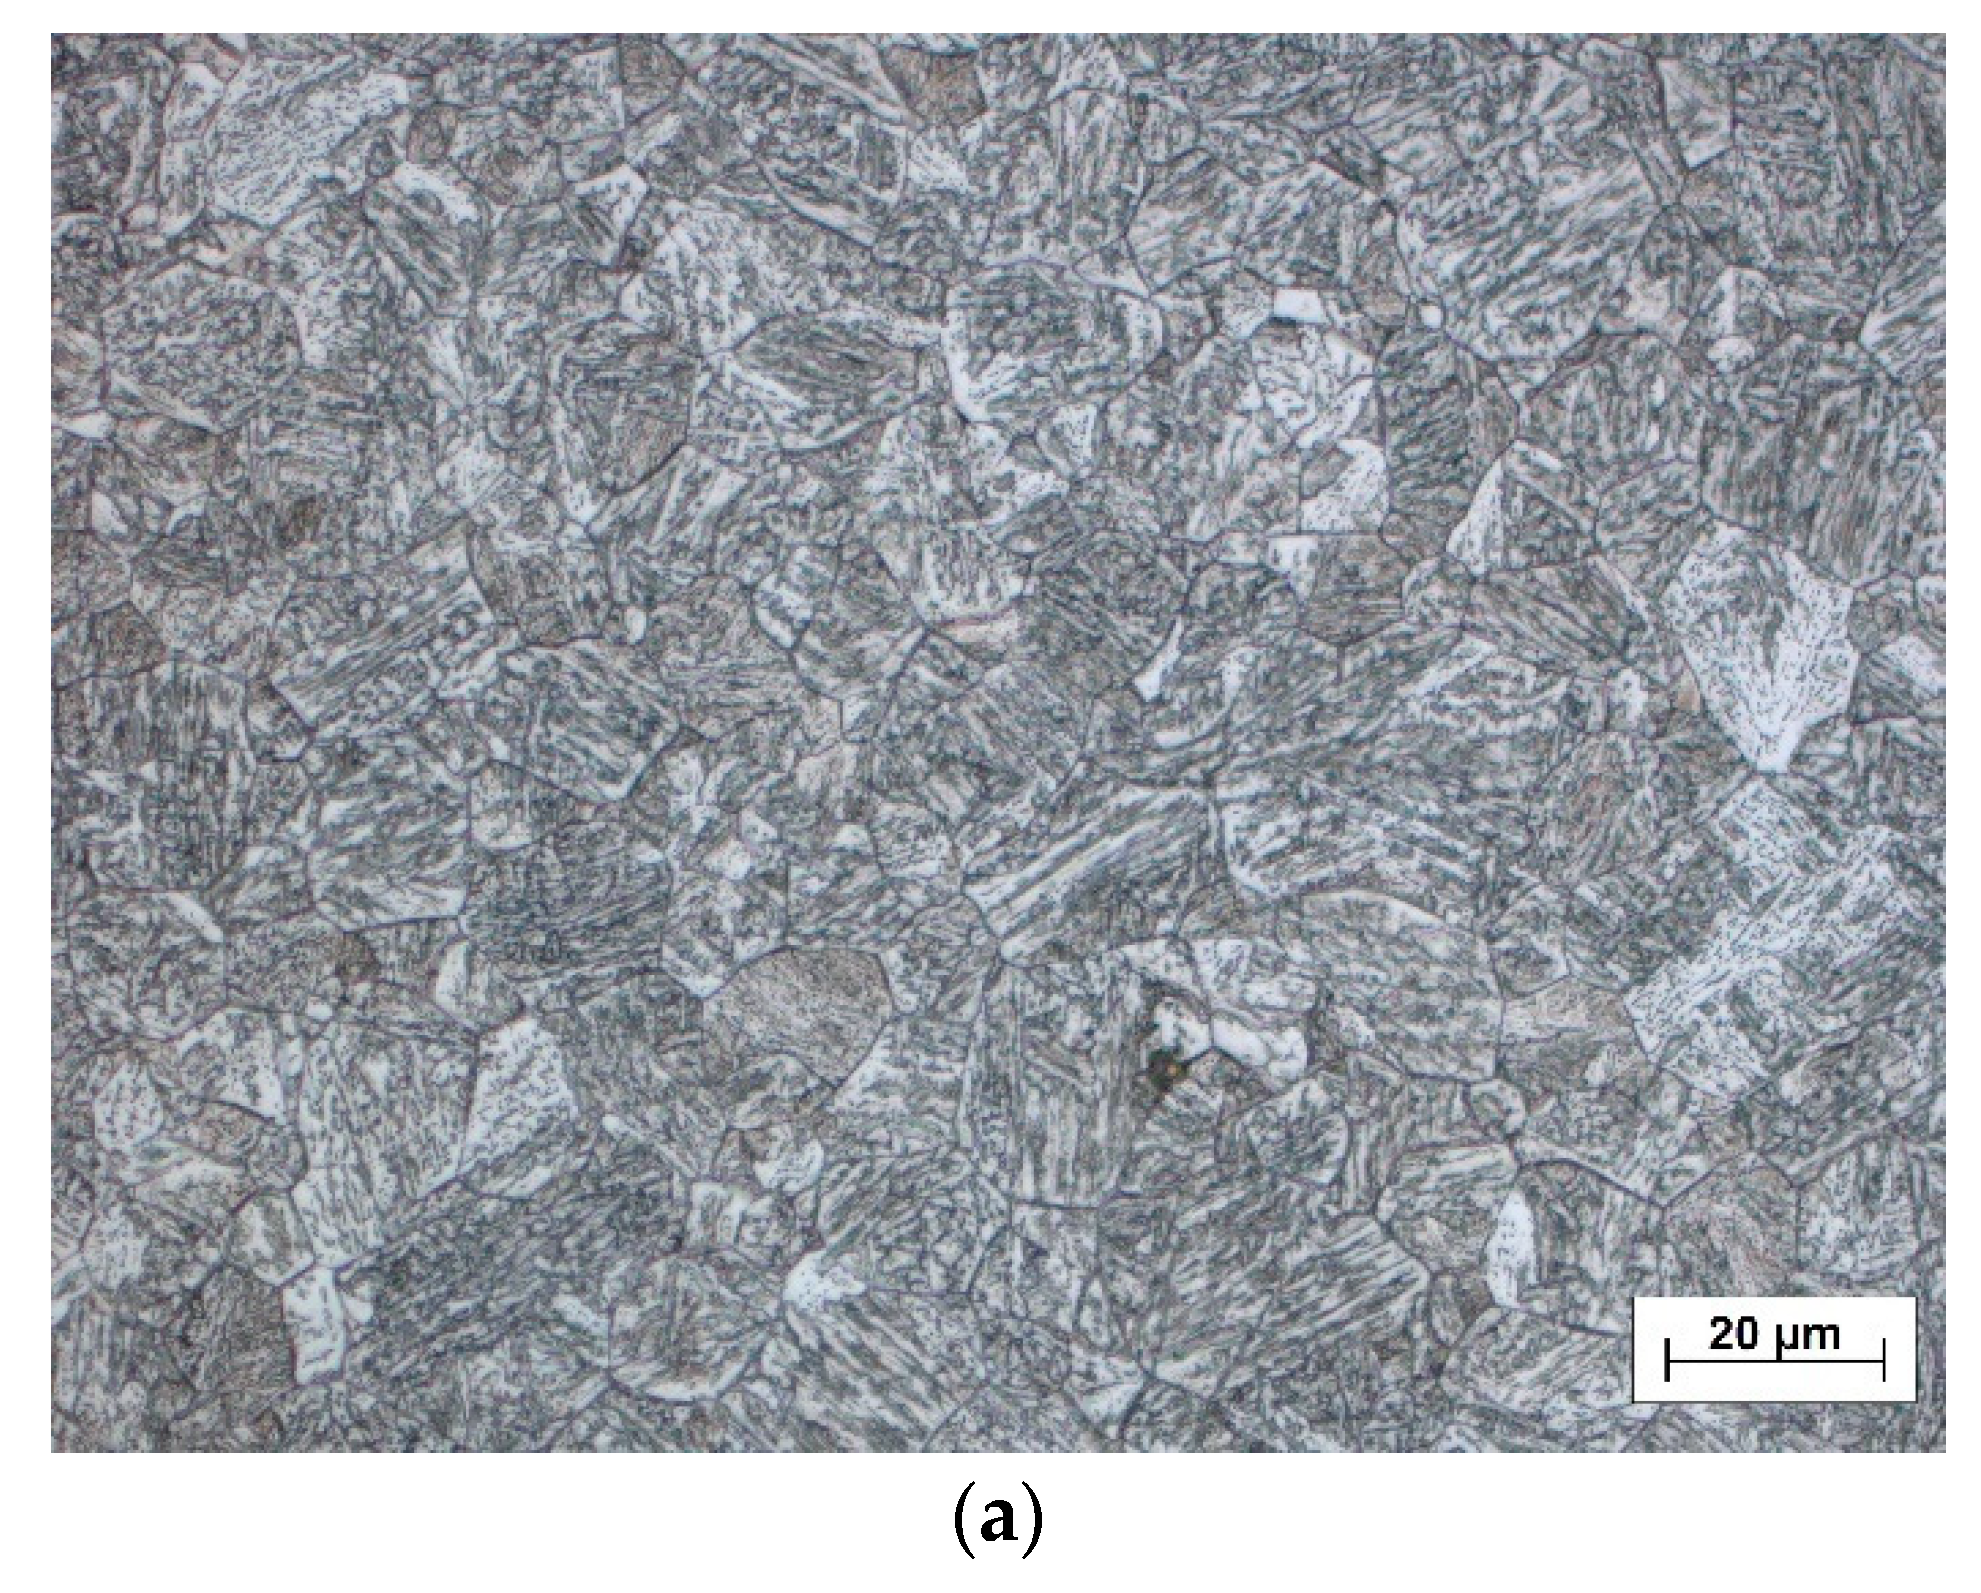
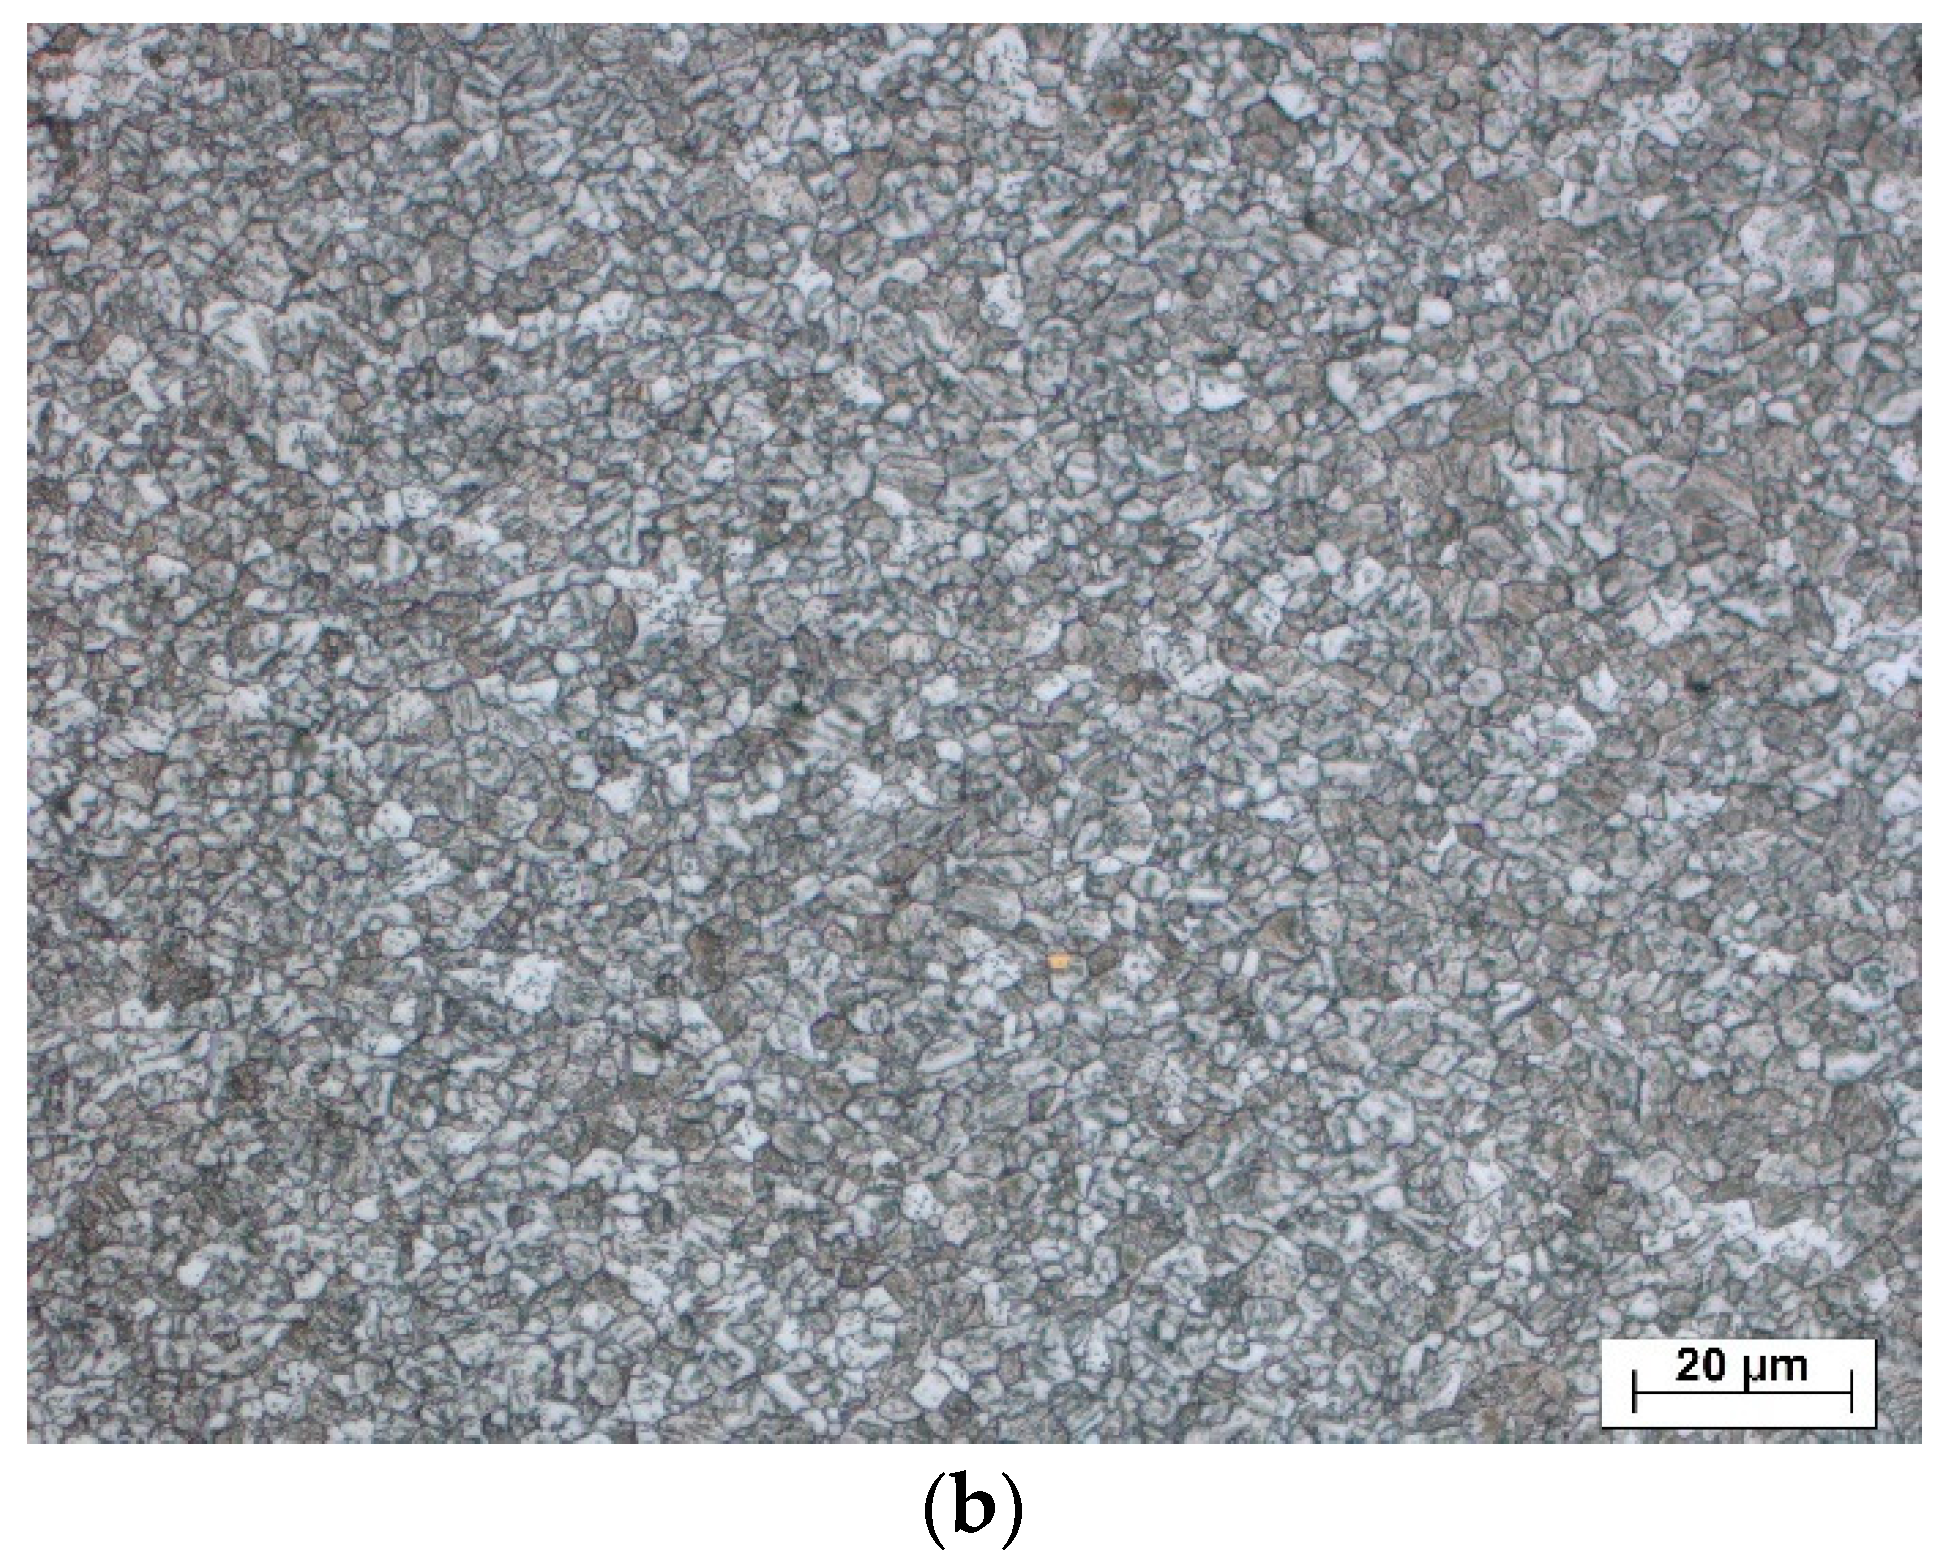
According to the maximum temperature reached, the HAZ could be divided into areas where complete recrystallization occurred (above Ac3) and areas where recrystallization was only partial or non-existent (Ac1–Ac3; under Ac1). The fully recrystallized zones were closest to the weld metal and were exposed to the highest temperature and soaking time during the welding process. These zones were the coarse-grain heat-affected zone (CGHAZ) and the fine-grain heat-affected zone (FGHAZ). With increasing distance from the weld metal, the maximum temperature of the thermal cycle decreased, which significantly affected the size of the austenitic grain and thus the secondary grain. In the CGHAZ, therefore, a coarse grain with relatively low hardness can be observed. As the distance increased, this grain size decreased, which was caused by a lower Tmax and soaking time. This effect persisted until the FGHAZ, where the grain size reached the smallest values, and the grain boundary strengthening was the most effective. This refinement of the grain size is also reflected in an increase in grain boundaries, which act as barriers to the movement of dislocations [34]. Therefore, it can be observed an increase in hardness and strength, as described by the Hall–Petch equation [35]. Figure 7a shows the CGHAZ microstructure of the GMAW-P welded joint corresponding to an area with a Tmax of 1292 °C, in which the thermocouple was placed. The FGHAZ microstructure (Figure 7b) of the GMAW-S welded joint belonged to a temperature of 1104 °C, which also corresponds to the relevant thermocouple according to Figure 4.
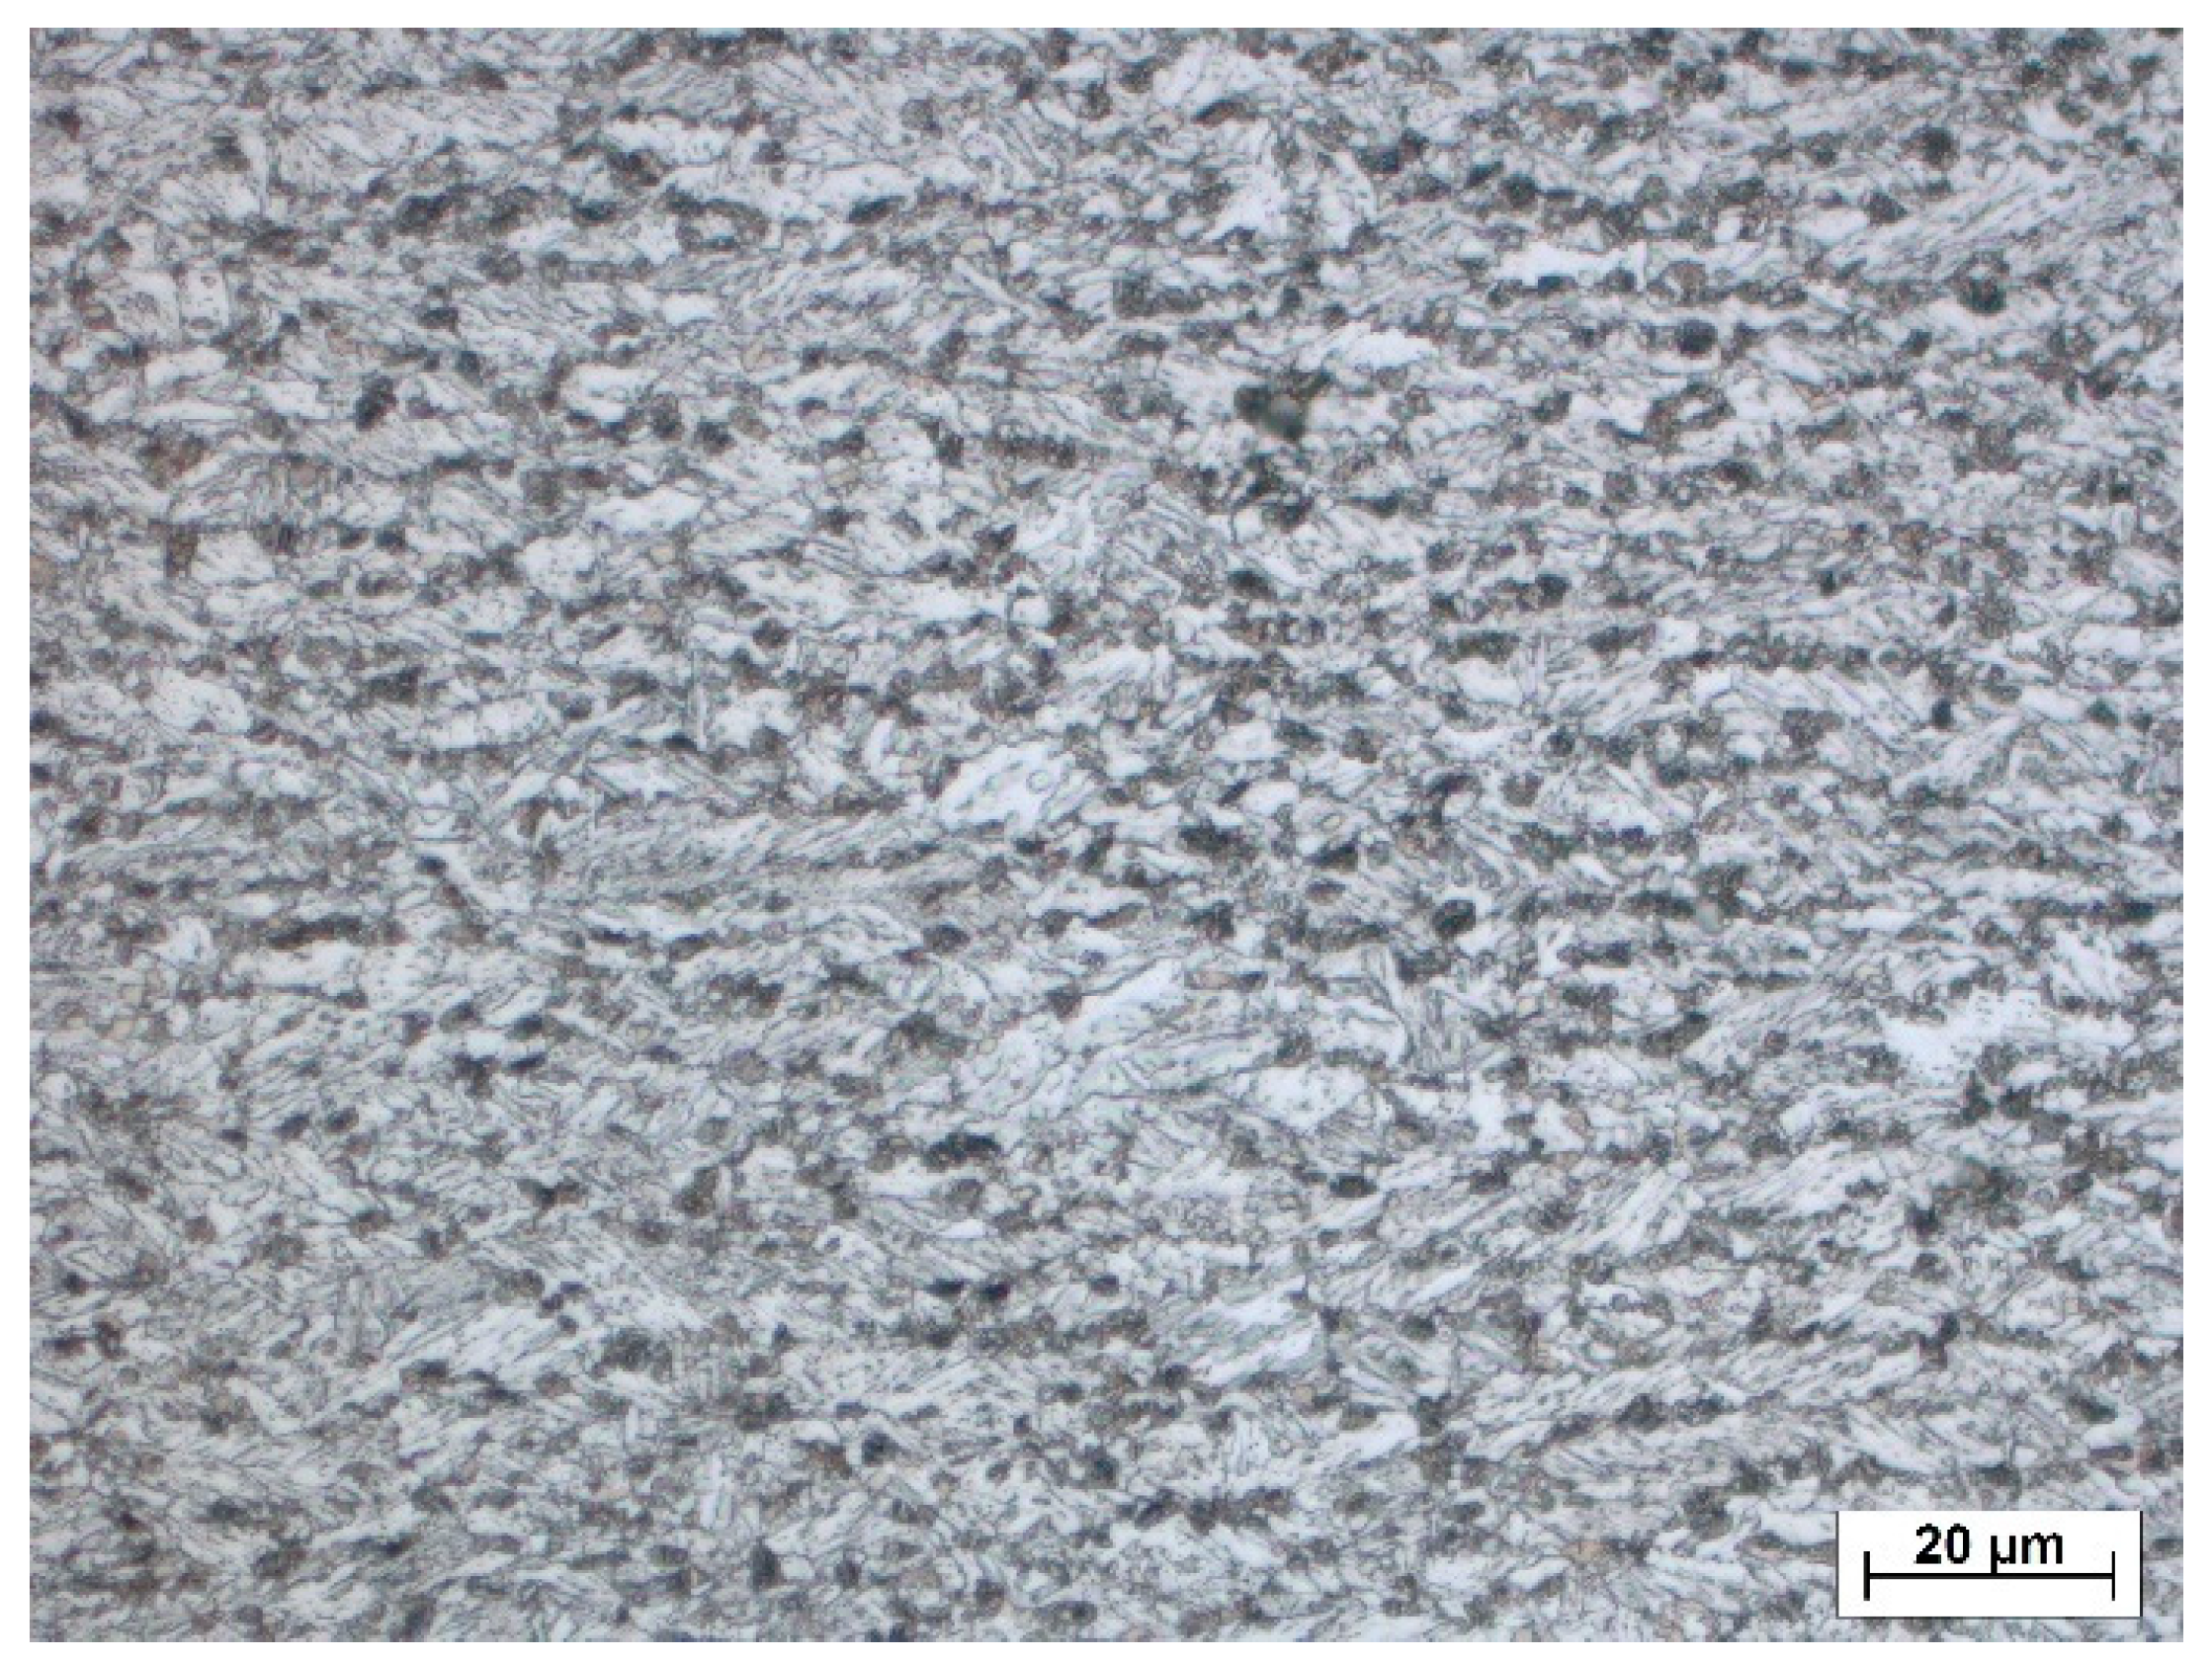
Once the temperature did not exceed the Ac3 temperature, we were able to observe the inter-critical heat-affected zone (ICHAZ). In the given zone, the material was exposed to temperatures between Ac1 and Ac3, and only partial austenitization of the material took place. This means that the austenite in the austenitization process was not fully saturated with carbon, and part of the carbon remained bound to the unconverted martensite. Therefore, a ferrite in the resulting microstructure can be observed, along with martensite, tempered martensite, and residual austenite. The loss in mechanical properties was also caused by partial dissolution of the fine dispersion precipitates and their uncontrolled reprecipitation. Excessive growth of the mentioned precipitates and loss of their ability to inhibit grain growth was also an important factor [36,37]. The temperature of Ac1 was determined to be 759 °C, and the temperature of Ac3 was 858 °C, by dilatometric tests of investigative steel. Figure 8 shows the ICHAZ microstructure of the MCAW-S welded joint in the area where the Tmax of the thermal cycle reached 853 °C.
The outermost zone was the sub-critical heat-affected zone (SCHAZ), which did not change much structurally from the base material. The smaller measured hardness values indicate the presence of tempered martensite and coarse precipitates.
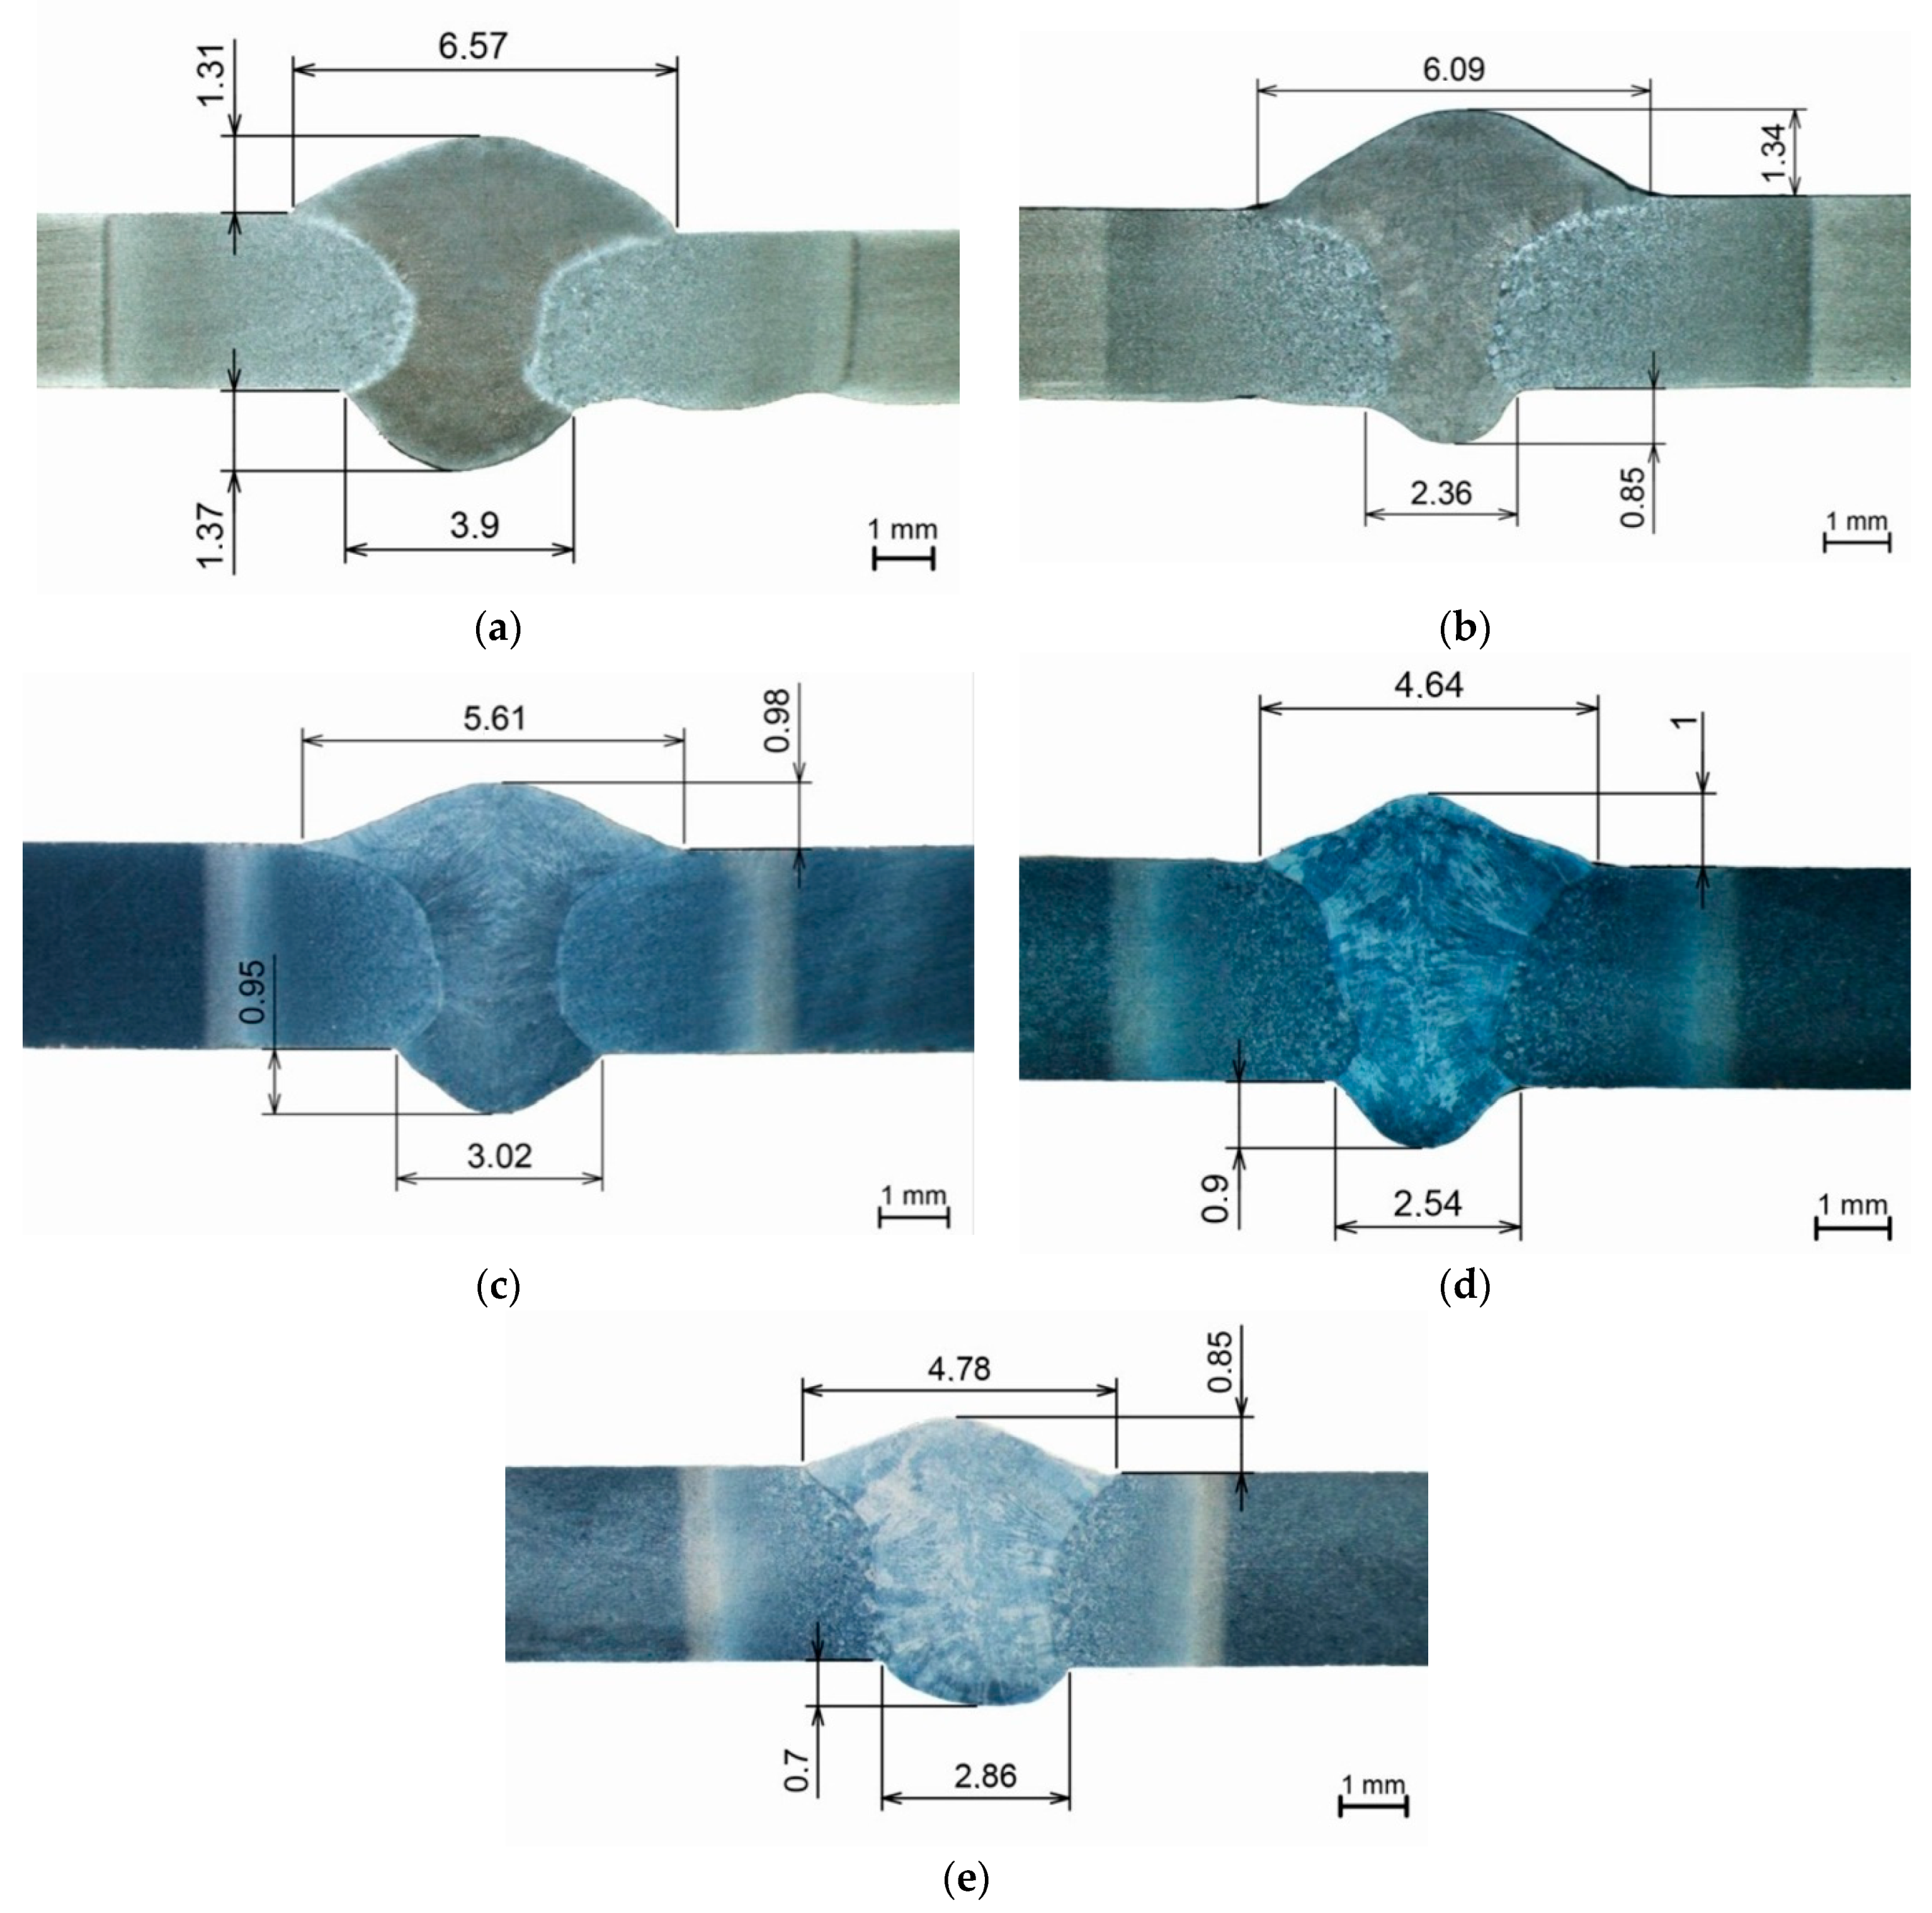
Figure 9 shows macrostructural images of all assessed welded joints. The width (mm) and height (mm) of the weld bead are anchored in the images. It is possible to observe a different shape of the weld metal depending on the method used. This is due to the different welding gap as well as the different welding speed and the melting characteristics of a filler material. The possible influence of the weld metal shape on the properties of the HAZ is discussed in the chapters below.

3.6. Soft Zone Properties

The soft zone characteristics were determined by microhardness and microstructural analyses. The linear microhardness measurements were used to determine the width of the soft zone. The methodology for determining the width of the soft zone varies depending on the author of the study. Some works consider the whole HAZ as a soft zone [4,10,16]. After evaluation of the tensile tests, the fracture always appeared in the ICHAZ or SCHAZ areas. We can therefore assume a partial constraint effect from the FCHAZ, which thus cannot be considered a soft zone. According to the LOM, the soft zone was located in the low-temperature heat-affected zone (SCHAZ) in all assessed welds (see Figure 5).
Determination based on the width of the mentioned subzones was not possible due to the microstructural characteristics of the SCHAZ, in which the width could not be determined. Therefore, a method based on the decrease in hardness relative to the base material was chosen to determine the width of the soft zone. The soft zone was determined as the area in which the hardness fell below 90% of the hardness value of the base material. This limit assumes a correlation between the hardness and the strength. In previous experiments on a Gleeble device [18], S960MC steel samples were exposed to different temperatures and thermal cycles, and the mechanical properties were evaluated. According to the hardness and strength values, the limit value of hardness (90% of base material) was determined, at which the steel reached the required yield strength. Such a limit value for the soft zone was also given by Wald and Jandera [38].
The hardness measurements in the line were evaluated for both HAZs of welded joints. Figure 10 show only graphs of the soft zones from the side of the weld where the fracture occurred. The red dot-dashed lines represent the value of 324HV1 (90% hardness of the base material). The fracture occurred in all cases at the site where the soft zone was wider. The values of the individual soft zone widths and the relevant relative soft zone widths are shown in Table 7.

3.7. Effect of the Soft Zone on the Mechanical Properties

As mentioned above, the thickness of the material must be taken into account when assessing the effect of the soft zone on the strength of the welds. Therefore, the measured values of the soft zone width were converted into the relative thicknesses of the soft zone (XSZ). The XSZ value was calculated according to Equation (1) as the ratio of the width of the soft zone and the thickness of the welded material,
X S Z = w S Z t
where wSZ is width of the soft zone and t is thickness of the material.
The XSZ value varied depending on the applied welding parameters, heat input, and cooling rate. In Figure 11, it is possible to observe the influence of the XSZ on the yield strength and the tensile strength of the assessed welded joints.
Based on the measured values, it can be observed that with decreasing XSZ, the yield strength and the tensile strength of the joints increased. The hardness values also proved that the amount the hardness dropped did not have a verifiable effect on the strength of the welds. Based on the comparison of the heat input and cooling rate with the strength of the welded joints, it was not possible to prove a direct influence between these quantities. Therefore, it was not appropriate to use only the values of the heat input and cooling rate for the prediction of strength, but it was also necessary to include the influence of the shape of the weld bead and the weld penetration. The shape of the weld metal can significantly affect the heat transfer and thus expand the soft zone, despite a lower applied heat input. Such an exception can be observed when comparing the welds welded by GMAW-CMT with the welds welded by MCAW. Despite the lower heat input and lower time t8/5, the welds welded by GMAW-CMT had reduced strength compared to the MCAW welds, whose heat input and time t8/5 were higher. This was probably caused by the different heat distributions in the HAZ due to the shape of the weld beam. Compared to MCAW-S (Figure 9d), the shape of the GMAW-CMT (Figure 9c) weld was wider, which expanded the temperature field. This resulted in an expansion of the soft zone and the entire HAZ.

4. Conclusions

The assessed welded joints showed that by changing the arc mode and changing the filler material, it was possible to significantly reduce the heat input, the maximum value of which must be observed when welding TMCP steels. In the case of gas metal arc welding of thin materials, this is the only way to achieve an increase in the strength of welded joints. GMAW with a solid wire as a filler material gave the best results in CMT mode (GMAW-CMT). Compared to GMAW-S, the heat input was reduced by 55%, which allowed the tensile strength to increase from 921 to 945 MPa. Overall, the best results were obtained using a metal-cored wire as a filler material. In this case, the increase in tensile strength was most pronounced, from 921 MPa (GMAW-S) to 972 MPa (MCAW-S cooled), even though the decrease in heat input was not as significant as in the case of GMAW-CMT. There can be several explanations as to why MCAW welds have achieved greater strength despite the higher applied heat input and the time t8/5. In addition to the already-mentioned shape of the weld metal and the weld bead, the temperature of a weld pool can also have great influence. However, this theory must be proven by further experiments and measurements. When comparing all assessed methods, it is possible to recommend MCAW to achieve the best possible results when welding thin sheets of TMCP steel. The authors agree that the achieved increase in strength and melting rate are benefits that outweigh the higher cost of mentioned filler material compared to a solid wire.
Herein, due to the decrease in the heat input, the cooling rate increased, which significantly affected the soft zone properties in the HAZ, and thus the strength of the welds. The change in the welding method allowed a decrease in time t8/5 from 17.5 s (GMAW-S) to 5.0 s (GMAW-CMT), i.e., a decrease of 70%. The effect of the soft zone on the strength was expressed by the XSZ, which decreased with decreasing heat input and cooling time. It follows that with a sufficiently small value of XSZ, it is possible to achieve yield strength and tensile strength at the level required by the standard. The main conclusions of the above research are as follows:
  • Compared to the standard mode, the use of the pulsed and CMT arc modes was able to achieve a greater strength of the welded joints, as they allowed a significant decrease in heat input.
  • The use of a metal-cored wire enabled a significant reduction in heat input compared to using a solid wire, which was also accompanied by an increase in the deposition rate.
  • With a decreased heat input, the cooling rate increased, which resulted in a decrease in the width of the soft zone in the HAZ and the relative thickness of the soft zone (XSZ).
  • The decrease in XSZ was reflected in the increase in the strength of the welded joints, which still did not reach the strength of the base material. Nevertheless, there was a significant increase in the YS/TS compared to using the GMAW technology in standard mode.
  • The results showed the effect of the shape of the weld bead on the overall heat distribution in the weld. This resulted in greater overheating of the material, even in the case of a lower heat input, and an associated increase in the width of the soft zone.

Author Contributions

Conceptualization, writing—original draft, and project administration, M.M. and M.F.; funding acquisition, M.M. and D.K.; data curation and formal analysis, M.F.; investigation, M.M., M.F., and D.K.; methodology, M.M. and M.F., validation, D.K.; writing—review and editing, M.M. All authors have read and agreed to the published version of the manuscript.

Funding

This research was funded by APVV, grant number APVV-16-0276; KEGA, grant number KEGA 009ŽU-4/2019; VEGA, grant number VEGA 1/0951/17. The research was funded by the Operational Program Integrated Infrastructure 2014–2020 by the project: Innovative Solutions for Propulsion, Power and Safety Components of Transport Vehicles, code ITMS 313011V334, co-financed by the European Regional Development Fund.

Conflicts of Interest

The authors declare no conflict of interest.

References

  1. Endo, S.; Nakata, N. Development of Thermo-Mechanical Control Process (TMCP) and High Performance Steel in JFE Steel. JFE Tech. Rep. 2015, 20, 1–7. [Google Scholar]
  2. Suzuki, H. Weldability of Modern Structural Steels in Japan. Trans. ISIJ 1983, 23, 189–204. [Google Scholar] [CrossRef] [Green Version]
  3. Strenx. Welding of Strenx; SSAB AB: Stockholm, Sweden, 2017. [Google Scholar]
  4. Moravec, J.; Sobotka, J.; Solfronk, P.; Thakral, R. Heat Input Influence on the Fatigue Life of Welds from Steel S460MC. Metals 2020, 10, 1288. [Google Scholar] [CrossRef]
  5. Webel, J.; Herges, A.; Britz, D.; Detemple, E.; Flaxa, V.; Mohrbacher, H.; Mücklich, F. Tracing Microalloy Precipitation in Nb-Ti HSLA Steel during Austenite Conditioning. Metals 2020, 10, 243. [Google Scholar] [CrossRef] [Green Version]
  6. Wang, B.; Lian, J. Effect of microstructure on low-temperature toughness of a low carbon Nb-V-Ti microalloyed pipeline steel. Mater. Sci. Eng. A 2014, 592, 50–56. [Google Scholar] [CrossRef]
  7. Hu, J.; Du, L.-X.; Xie, H.; Gao, X.-H.; Misra, R.D.K. Microstructure and mechanical properties of TMCP heavy plate microalloyed steel. Mater. Sci. Eng. A 2014, 607, 122–131. [Google Scholar] [CrossRef]
  8. De Meester, B. The weldability of Modern Structural TMCP Steels. ISIJ Int. 1997, 37, 537–551. [Google Scholar] [CrossRef]
  9. Pisarski, H.G.; Dolby, R.E. The Significance of Softened HAZs in High Strength Structural Steels. Weld. World 2012, 47, 32–34. [Google Scholar] [CrossRef]
  10. Węglowski, M.S.; Zeman, M. Prevention of cold cracking in ultra-high strength steel Weldox 1300. Arch. Civ. Mech. Eng. 2014, 14, 417–424. [Google Scholar] [CrossRef]
  11. Senuma, T. Physical Metallurgy of Modern High Strength Steel Sheets. ISIJ Int. 2001, 41, 520–532. [Google Scholar] [CrossRef] [Green Version]
  12. Kim, J.H.; Seo, J.S.; Kim, H.J.; Ryoo, H.S.; Kim, K.H.; Huh, M.Y. Effect of Weld Metal Microstructures on Cold Crack Susceptibility of FCAW Weld Metal. Met. Mater. Int. 2008, 14, 239–245. [Google Scholar] [CrossRef]
  13. Fydrych, D.; Łabanowski, J.; Rogalski, G.; Haras, J.; Tomków, J.; Świerczyńska, A.; Jakóbczak, P.; Kostro, Ł. Weldability of S500MC Steel in Underwater Conditions. Adv. Mater. Sci. 2014, 14, 37–45. [Google Scholar] [CrossRef] [Green Version]
  14. Hochhauser, F.; Ernst, W.; Rauch, R.; Vallant, R.; Enzinger, N. Influence of the Soft Zone on the Strength of Welded modern HSLA Steels. Weld. World 2012, 56, 77–85. [Google Scholar] [CrossRef]
  15. Schneider, C.; Ernst, W.; Schnitzer, R.; Staufer, H.; Vallant, R.; Enzinger, N. Welding of S960MC with undermatching filler material. Weld. World 2018, 62, 801–809. [Google Scholar] [CrossRef] [Green Version]
  16. Jambor, M.; Nový, F.; Mičian, M.; Trško, L.; Bokůvka, O.; Pastorek, F.; Harmaniak, D. Gas metal arc welding of thermo-mechanically controlled processed S960MC steel thin sheets with different welding parameters. Communications 2018, 20, 29–35. [Google Scholar] [CrossRef]
  17. Guo, W.; Crowther, D.; Francis, J.A.; Thompson, A.; Liu, Z.; Li, L. Microstructure and mechanical properties of laser welded S960 high strength steel. Mater. Des. 2015, 85, 534–548. [Google Scholar] [CrossRef]
  18. Mičian, M.; Harmaniak, D.; Nový, F.; Winczek, J.; Moravec, J.; Trško, L. Effect of the t8/5 Cooling Time on the Properties of S960MC Steel in the HAZ of Welded Joints Evaluated by Thermal Physical Simulation. Metals 2020, 10, 229. [Google Scholar] [CrossRef] [Green Version]
  19. Maurer, W.; Ernst, W.; Rauch, R.; Vallant, R.; Enzinger, N. Evaluation of the factors influencing the strength of HSLA steel weld joint with softened HAZ. Weld. World 2015, 59, 809–822. [Google Scholar] [CrossRef]
  20. Bang, K.S.; Kim, W.Y. Estimation and Prediction of HAZ Softening in Thermomechanically Controlled-Rolled and Accelerated-Cooled Steel. Weld. J. 2002, 81, 174–179. [Google Scholar]
  21. Gáspár, M. Effect of Welding Heat Input on Simulated HAZ Areas in S960QL High Strength Steel. Metals 2019, 9, 1226. [Google Scholar] [CrossRef] [Green Version]
  22. Njock Bayock, F.; Kah, P.; Mvola, B.; Layus, P. Effect of heat input and undermatched filler wire on the microstructure and mechanical properties of dissimilar S700MC/S960QC high-strength steels. Metals 2019, 9, 883. [Google Scholar] [CrossRef] [Green Version]
  23. Komizo, Y. Performance of welded joints in TMCP steel plates. Weld. Int. 1991, 5, 598–601. [Google Scholar] [CrossRef]
  24. Rodrigues, D.M.; Menezes, L.F.; Loureiro, A.; Fernandes, J.V. Numerical study of the plastic behavior in tension of welds in high strength steels. Int. J. Plast. 2004, 20, 1–18. [Google Scholar] [CrossRef] [Green Version]
  25. An, G.B.; Nam, S.K.; Jang, T.W. Effect of weld HAZ softening on tensile strength of welded joint with weld HAZ softening. Mater. Sci. Forum 2008, 580–582, 589–592. [Google Scholar] [CrossRef]
  26. Mai, R.; Jiang, Z.; Ma, J.; Zhang, Y. Analytical Study on Microstructure and Mechanical Property in HAZ-Softened Weld Joint with High Heat Input of Low Carbon TMCP Steel. Appl. Mech. Mater. 2017, 872, 99–106. [Google Scholar] [CrossRef]
  27. Mochizuki, M.; Shintomi, T.; Hashimoto, Y.; Toyoda, M. Analytical Study on Deformation and Strength in HAZ-Softened Welded Joints of Fine-Grained Steel. Weld. World 2004, 48, 2–12. [Google Scholar] [CrossRef]
  28. Lahtinen, T.; Vilaça, P.; Peura, P.; Mehtonen, S. MAG Welding Tests of Modern High Strength Steels with Minimum Yield Strength of 700 MPa. Appl. Sci. 2019, 9, 1031. [Google Scholar] [CrossRef] [Green Version]
  29. Silva, A.; Szczucka-Lasota, B.; Węgrzyn, T.; Jurek, A. MAG welding of S700MC steel used in transport means with the operation of low arc welding method. Weld. Technol. Rev. 2019, 91, 23–28. [Google Scholar] [CrossRef] [Green Version]
  30. Golyakevich, A.A.; Orlov, L.N.; Maksimov, S.Y. Mechanized Welding with Metal Cored Wire. Adv. Mater. Res. 2020, 1157, 113–122. [Google Scholar] [CrossRef]
  31. Prajapati, P.; Badheka, V.J. Investigation on Various Welding Consumables on Properties of Carbon Steel Material in Gas Metal Arc Welding under Constant Voltage Mode. Sadhana 2017, 42, 1751–1761. [Google Scholar] [CrossRef]
  32. Górka, J. Assessment of the Effect of Laser Welding on the Properties and Structure of TMCP Steel Butt Joints. Metals 2020, 13, 1312. [Google Scholar] [CrossRef] [PubMed] [Green Version]
  33. Górka, J. Assessment of the Weldability of T-Welded Joints in 10 mm Thick TMCP Steel Using Laser Beam. Materials 2018, 11, 1192. [Google Scholar] [CrossRef] [Green Version]
  34. Zubar, T.; Fedosyuk, V.; Tishkevich, D.; Konafyev, O.; Astapovich, K.; Kozlovskiy, A.; Zdorovets, M.; Vinnik, D.; Gudkova, S.; Kaniukov, E.; et al. The Effect of Heat Treatment on the Microstructure and Mechanical Properties of 2D Nanostructured Au/NiFe System. Nanomaterials 2020, 10, 1077. [Google Scholar] [CrossRef]
  35. Li, Y.; Bushby, A.J.; Dunstan, D.J. The Hall–Petch effect as a manifestation of the general size effect. Proc. R. Soc. A 2016, 472, 20150890. [Google Scholar] [CrossRef]
  36. Kik, T.; Moravec, J.; Švec, M. Experiments and Numerical Simulations of the Annealing Temperature Influence on the Residual Stresses Level in S700MC Steel Welded Elements. Materials 2020, 13, 5289. [Google Scholar] [CrossRef] [PubMed]
  37. Nowotnik, A.; Siwecki, T. The effect of TMCP parameters on the microstructure and mechanical properties of Ti-Nb microalloyed steel. J. Microsc. 2010, 237, 258–262. [Google Scholar] [CrossRef] [PubMed]
  38. Wald, F.; Jandera, M. Stability and Ductility of Steel Structures 2019, 1st ed.; CRC Press/Balkema: Leiden, The Netherlands, 2019; p. 127. [Google Scholar]
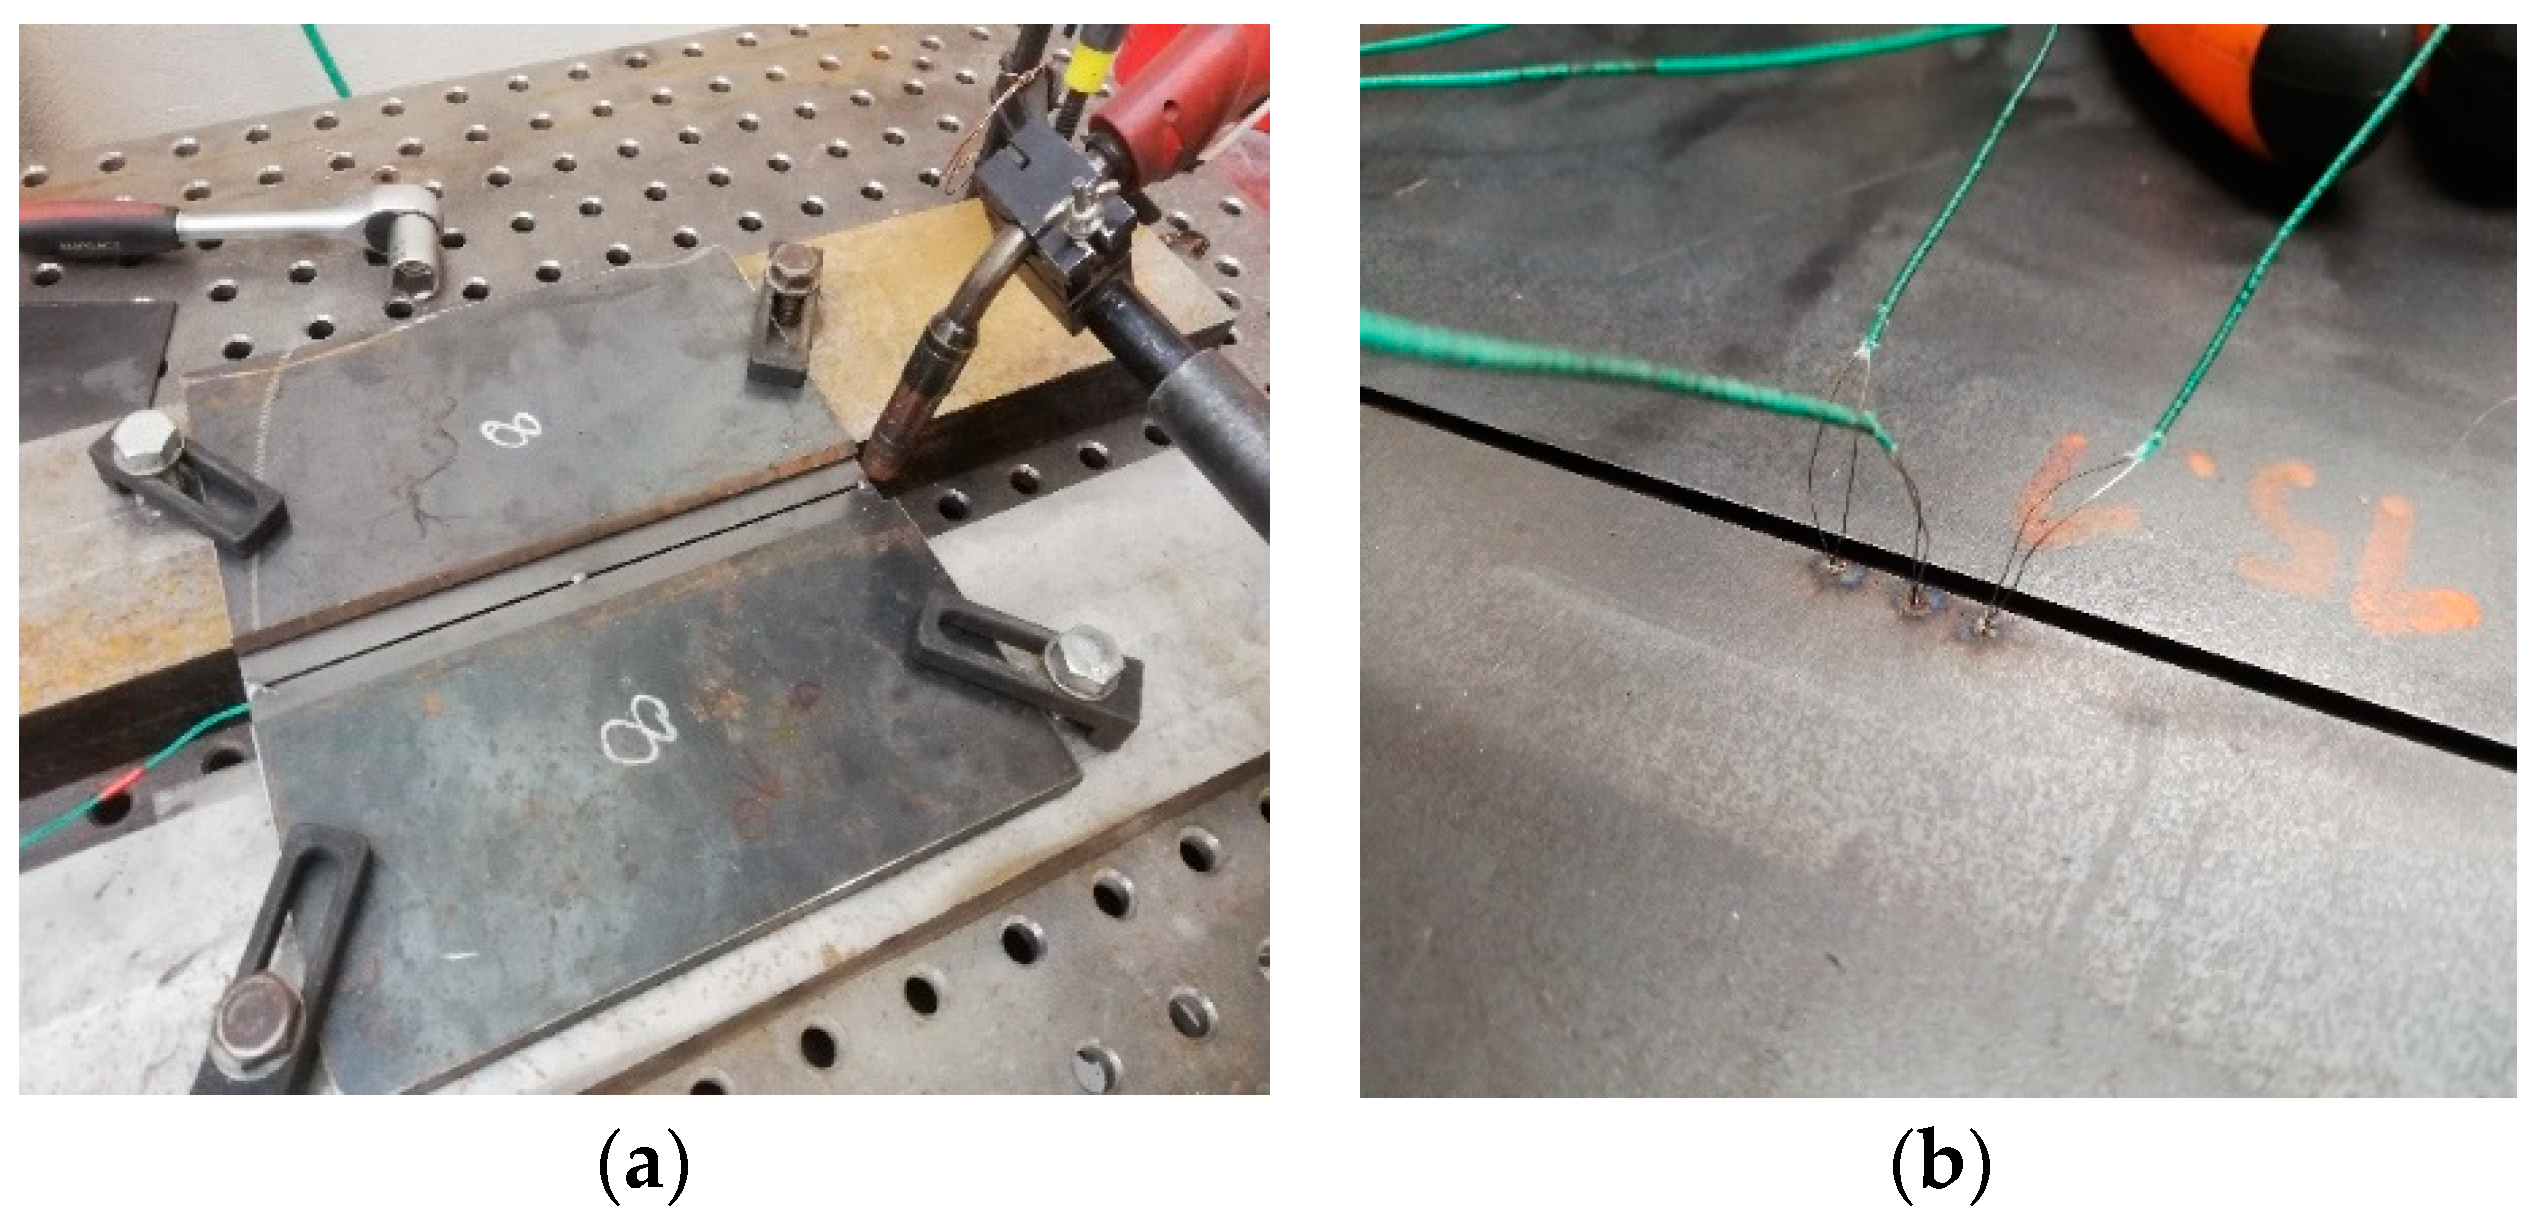
Figure 1. (a) Tackled plates fixed before welding and (b) thermocouples at the root side of the weld.
Metals 11 00305 g001
Figure 2. Welding with accelerated cooling.
Metals 11 00305 g002
Figure 3. Dimensions of the tensile test specimen in mm.
Metals 11 00305 g003
Figure 4. Thermal cycles of the assessed welded joints.
Metals 11 00305 g004
Figure 5. Fracture profiles made after the tensile test: (a) gas metal arc welding-short arc (GMAW-S), (b) gas metal arc welding -pulsed (GMAW-P), (c) gas metal arc welding-cold metal transfer (GMAW-CMT), (d) metal-cored arc welding-short arc (MCAW-S), and; (e) MCAW-S cooled.
Metals 11 00305 g005
Figure 6. Hardness distribution in the heat-affected zone (HAZ) of the assessed welded joints.
Metals 11 00305 g006
Figure 7. Microstructure of the individual subzones of the heat-affected zone (HAZ): (a) coarse-grain HAZ (CGHAZ) and (b) fine-grain HAZ (FGHAZ).
Metals 11 00305 g007aMetals 11 00305 g007b
Figure 8. Microstructure of the inter-critical heat-affected zone (ICHAZ).
Metals 11 00305 g008
Figure 9. Macrostructure of the assessed welded joints: (a) GMAW-S, (b) GMAW-P, (c) GMAW-CMT, (d) MCAW-S, and (e) MCAW-S cooled.
Metals 11 00305 g009
Figure 10. Determination of the soft zone width based on the microhardness measurements: (a) GMAW-S, (b) GMAW-P, (c) GMAW-CMT, (d) MCAW-S, and (e) MCAW-S cooled. HV1, hardness measurement performed by the Vickers method.
Metals 11 00305 g010
Figure 11. Influence of the relative thickness of the soft zone (XSZ) on the yield strength (YS) and tensile strength (TS) of the assessed welded joints.
Metals 11 00305 g011
Table 1. Mechanical properties of Strenx 960MC according to the inspection certificate.
Rp0.2
(MPa)
Rm
(MPa)
A50mm
(%)
CET (CEV)KV −20 °C
(J)
10181108100.26 (0.50)32
Table 2. Chemical composition of Strenx 960MC according to the inspection certificate (wt.%).
CSiMnPSAlNbV
0.0850.181.060.010.0030.0360.0020.007
TiCuCrNiMoNBFe
0.0260.011.080.070.1090.0050.0015bal.
- CET(CEV) = 0.26 (0.50).
Table 3. Chemical composition of the filler materials: Union X96 and Böhler X96 L-MC (wt.%).
Filler MaterialTypeFeCSiMnCrNiMo
Union X96Solid wirebal.0.120.801.900.452.350.55
Böhler X96 L-MCMetal-cored wirebal.0.060.701.900.602.200.50
Table 4. Welding parameters of the assessed welded joints.
MethodFiller MaterialEffective Arc Voltage Uef (V)Effective Current Ief(A)Welding Speed vs. (cm·min–1)Wire Feed Speed vd
(m·min–1)
Heat Input Qp (kJ·cm–1)Weld Gap b (mm)
GMAW-SUnion X9616.610222.23.83.691.5
GMAW-PUnion X9619.76122.23.22.622.0
GMAW-CMTUnion X9613.113149.85.31.652.3
MCAW-SBöhler X96 L-MC14.78624.03.02.532.3
MCAW-S cooledBöhler X96 L-MC14.78624.03.02.532.3
Table 5. Values of the thermal cycles analysis.
MethodQp (kJ·mm–1)Tmax (°C)t8/5 (s)
GMAW-S0.369110417.5
GMAW-P0.262129211.6
GMAW-CMT0.1658385.0
MCAW-S0.2538535.3
MCAW-S cooled0.25310546.0
Table 6. Mechanical properties of the evaluated welded joints of S960MC steel.
Sample No.YS (MPa)Average Value of YS (MPa)TS (MPa)Average Value of TS (MPa)A50mm
(%)
Average Value of A50mm (%)
GMAW-S-018908839169213.203.30
GMAW-S-028769263.30
GMAW-P-019139159419402.202.20
GMAW-P-029179382.10
GMAW-CMT-019309279419452.232.20
GMAW-CMT-029249492.20
MCAW-S-019499519689692.172.20
MCAW-S-029539702.17
MCAW-S cooled-019479559659721.651.70
MCAW-S cooled-029599751.78
Table 7. Values of the width of the soft zones and the relative thicknesses of the soft zones (XSZ).
MethodSoft Zone (mm)XSZ (-)
Left Side of the HAZRight Side of the HAZ
GMAW-S3.053.25 *1.08
GMAW-P3.10 *2.501.03
GMAW-CMT3.00 *2.401.00
MCAW-S2.75 *2.600.92
MCAW-S cooled2.20 *1.500.73
* The side of the weld on which the fracture occurred and from which the XSZ value was calculated.
Publisher’s Note: MDPI stays neutral with regard to jurisdictional claims in published maps and institutional affiliations.