Article

Corrosion Behavior of Extruded AM60-AlN Metal Matrix Nanocomposite and AM60 Alloy Exposed to Simulated Acid Rain Environment

1
Applied Physics Department, Center for Advanced Study (CINVESTAV), Mérida 97310, Mexico
2
Surface Engineering, Corrosion and Durability Department, Nacional Center for Metallurgical Research (CENIM-CSIC), 28040 Madrid, Spain
3
Helmholtz-Zentrum Hereon, Institute of Materials and Process Design, 21502 Geesthacht, Germany
*
Author to whom correspondence should be addressed.
Metals 2021, 11(6), 990; https://doi.org/10.3390/met11060990
Submission received: 31 May 2021 / Revised: 12 June 2021 / Accepted: 15 June 2021 / Published: 21 June 2021
(This article belongs to the Special Issue Corrosion and Protection in Aeronautical Alloys)

Abstract

:
The present work compared the initial stages of corrosion process development on the AM60-AlN metal matrix nanocomposite surface and on AM60, during their exposure for 30 days to simulated acid rain solution (SAR). The AlN nanoparticles were observed as “attached” to those of Mn-rich AlMn intermetallic particles, forming clusters. The introduction of 1.0 wt.% AlN (≈ 80 nm) in the AM60 alloy carried a slight grain refinement and favored the formation of a denser and more protective corrosion layer, suggested by the electrochemical impedance spectroscopy (EIS) values of higher charge transfer resistance (R2) and capacitance, characteristic of the double layer in the presence of corrosion products, and also suggested by Rn (EN) values, compared to those of the AM60 alloy. Thus, the concentration of the released Mg-ions from the composite surface was lower. Due to the increase in time of the SAR solution pH, Al de-alloying may occur, as well as Al(OH)3 formation, as confirmed by XPS analysis. Due to the presence of Cl-ions in SAR solution, localized corrosion was observed, suggested as fractional Gaussian noise of a stationary and persistent process in time, according to the PSD of the corrosion current fluctuations (EN).

1. Introduction

Magnesium is the lightest structural metal (1.74 g cm−3) [1] and its rapidly cooled alloys can reach a strength/weight ratio of 490 kN m kg−1 [2]. When the weight reduction is an important factor, the excellent physical and mechanical properties of the Mg-alloys make them ideal materials for automotive and aerospace applications [3,4]. In recent years, air pollution has become a serious problem, causing an increase in atmosphere aggressivity, and metal structures suffer from accelerated environmental damage [5]. The use of fuels in the transport sector has contributed to pollutants, such as SO2 and CO2, causing a decrease in the atmospheric pH and, as a consequence, acid rain known worldwide. Therefore, a necessary trend has been to reduce the fuel consumption, which would lower the environmental impact [6]. One way to help resolve this problem is linked to the development of new lightweight materials for automobile structures [7]. Promising materials are the Mg-alloys and its nanocomposites.
Mg-Al alloys are divided into AZ-series with the addition of Zn, and AM-series with the addition of Mn. Aluminum is considered one of the most important alloying elements, because of its tendency to form a stable passive oxide layer on its surface in neutral environments. It has been reported that up to 4% Al may provide a decrease in the Mg-Al corrosion rate [8,9]. On the other hand, the addition of Mn also favors better corrosion resistance by the elimination of Fe and other heavy metals, to prevent the formation of harmful corrosion active intermetallic compounds [10]. In the AM and AZ magnesium series, the most common secondary phase is β-Mg17Al12 and that of the intermetallic particles of Al-Mn.
The overall reaction of Mg and its alloys involves the anodic dissolution of the Mg-matrix and the H2 gas evolution, which is the main cathodic reaction in acid media [11,12]:
Mg + 2 H 2 O Mg ( OH ) 2 + H 2
One study [13] reported that solutions containing F or PO43− phosphate ions are less corrosive to Mg-alloys in the absence of Cl, Br, SO42−, and ClO42 aggressive ions. In acid rain environments, the anodic process is influenced by the high concentration of H+ ions (lower pH) that favors a greater dissolution of the Mg-matrix of the AM60B alloy [14]. Previous investigations have revealed that in chloride-polluted atmospheric environments, the corrosion rate of AM50 increases up to 250 µg cm−2 as a function of NaCl concentration [15]. It has been reported that the corrosion layer of AM50 presents two parts: MgO/Mg(OH)2 (outer layer) and Al2O3 (thin inner layer) [16]. However, the corrosion layers do not have the same composition when the corroded areas possess lower Al-contents (2–3% wt.). In the presence of CO2, the acid pH favors the cathodic reaction of H2 evolution (Equation (1)); however, two formed magnesium carbonates, hydromagnesite (Mg5(CO3)4(OH)2∙4H2O) and nesquehonite (MgCO3∙3H2O), may act as sealants for the Mg(OH)2 corrosion product (Equation (1)) [17]. In industrial SO2-polluted environments (pH ≈ 5.6), the SO42− ion plays an important factor owing to the formation of sulfuric acid, contributing to the acid rain aggressivity [18]. A study of the AM50 alloy, immersed in simulated acid rain (pH ≈ 4.5) in the presence of NaCl (84.95 mg L−1), has shown that the corrosion attacks are observed in the vicinity of Al-Mn intermetallic particles, being in galvanic contact with the Mg-matrix [19]. On the other hand, the reported results suggest that the combination of NH4+ and OH ions, present in the atmospheric environment, may inhibit the formation of the Mg ( OH ) 2 corrosion product [20].
To combat the deficiencies of Mg and its alloys, reinforcement phases (SiC, Al2O3, TiC, among others) have been introduced to improve properties such as: resistance to corrosion; high Young’s modulus; superior resistance to wear and creep at elevated temperatures; low density; good mechanical and chemical compatibility; good thermal stability; high compression and tensile strength; and good process ability and economic efficiency [21,22,23]. Due to the increasing demand for lighter materials, a boom in the development of magnesium metal matrix composites and nanocomposites (Mg-MMCs and MMNCs) has been observed. In this respect, the Mg-metal matrixes of the AZ and AM series are the most used in the automotive industry [24]. Reported reinforcement particles introduced in the Mg-MMCs are carbides (SiC, B4C, and ZrC) [25,26,27], oxides (Al2O3, Y2O3, and TiO2) [28,29,30], borides (TiB2) [31], nitrides (Si3N, AlN, ZrN, and TiN) [27,32,33,34,35,36,37,38,39,40,41,42], carbon nanotubes [43], and metals (Cu, Ti, Mo, and Bi) [44,45,46,47]. For the manufacture of MMCs, different fabrication techniques have been used [48,49]. The size of the particles plays an important role as reinforcement; it is reported that microparticles may increase the probability of failures in secondary process (extrusion or rolling); however, the nanoparticles as reinforcement in the metal matrix may provide an improvement in ductility and tensile strength properties [26,28,49,50,51]. Nowadays, there is a great demand for metal matrix composites in industries such as: construction 26%, aerospace 1%, marine 12%, appliances 8%, consumer products 8%, automotive 31%, electronics components 10%, and miscellaneous 4% [52].
The aluminum nitride (AlN) presents a diversity of properties: an excellent low coefficient of thermal expansion (4.5 × 10⁻⁶ K−1) between 293 and 673 K [53], a high elastic modulus between 308 and 315 GPa [54], and a flexural strength of 426 MPa [55]. Aluminum nitride, considered as a ceramic material, belongs to the hexagonal close-packed cell structure and lattice, similar to those of Mg. Its band gap of 6.3 eV makes AlN an excellent insulator and its covalent bond provides stability to the Al-N particles [53]. Therefore, it is considered that its inclusion in the metal matrix as reinforcement may improve properties such as hardness and wear resistance in a similar way as the introduction of B4C and SiC particles [56]. It has been reported that the corrosion rate of Mg-matrix may decrease in the presence of AlN-reinforced particles, because of the high AlN electrical resistivity (1 × 10¹² Ω cm) [57]. Moreover, the AlN particles are considered an excellent choice for grain refinement of magnesium alloys [58,59]. An AM60-based matrix nanocomposite (MMNC), containing 1 wt.% of AlN particles (≈80 nm of average size), has been successfully produced using an ultrasound-assisted indirect chill casting process [60]. The results revealed that the AlN nanoparticles caused a grain refinement and improvement in various mechanical properties (yield strength, ultimate tensile strength, and ductility). Elektron21-AlN nanocomposites have also been produced by ultrasound-assisted casting with different concentrations of AlN (1% and 2%) [61]. A reduction in grain size (to 72.8 µm) was reported for Elektron21 with 2% of AlN, as well as increases in thermal and electrical conductivity.
The aim of the present work was to characterize the initial stages of the corrosion process of the AM60-AlN metal matrix composite and to compare them with those of the AM60 alloy, during their 30 days of exposure to simulated acid rain solution (SAR). A combination of immersion test and surface characterization methods were employed to evaluate the mass loss (corrosion rate), attack on the surface, and the formed product layers. The change in time of SAR pH and concentration of the released Mg-ions into the electrolyte was also monitored, in order to correlate with the corrosion rate and values of the corrosion open circuit potential (OCP). The current fluctuations, considered as electrochemical noise (EN), were analyzed in the time and frequency domain to identify the corrosion process. Electrochemical impedance spectroscopy (EIS) measurements were carried out to compare the performance of the studied alloys in the simulated acid rain solution.

2. Materials and Methods

2.1. Materials and SAR Model Solution

The nominal composition (wt.%) of the extruded AM60, according to the producer, (Magontec, Bottrop, Germany) is: 6.0 Al; 0.2–0.4 Mn; and the balance Mg. For the preparation of the nanocomposite, 15 kg of the alloy was melted and 150 g of AlN nanoparticles with an average diameter of ≈80 nm was added under stirring; this corresponds to an AlN concentration of 1 wt.%. The nanoparticles were prepared at Tomsk State University in Tomsk, Russia, and their properties and manufacturing process have been previously described [60,62,63]. The mixture of melt and nanoparticles were treated with high-shear dispersion-treatment (HSDT) for 10 min and, for this purpose, a rotor–stator device (Zyomax Ltd., London, UK) was used at 1000 rpm, exposing the melt permanently to a protective gas mixture of Ar + 1% SF6. The composite melt was poured into cylindrical molds, suspended in a three-zone resistance furnace, and then slowly lowered into a water bath, initiating the solidification from the bottom of the mold. This means that there is always residual melt on top of the solidified phase, with the result that shrinkage is fed during solidification and the microstructure of the cylinder is largely free of pores. An identical process was carried out for the comparative sample of AM60 without nanoparticles. The cylinders were machined to 49 mm and indirectly extruded at 300 °C in a 2.5 MN extrusion press (Müller Engineering, Todtenweis, Germany) to 10 mm diameter round profiles, and they were taken for the investigation. The extrusion speed was 2.2 mm/s and the extrusion ratio was 25:1.
The tested materials were cut into disc-shapes of 1 mm in thickness; some of them were used for the immersion test while others were used as electrodes for electrochemical experiments. All specimens were abraded with SiC paper to 2000 grit, using ethanol as a lubricant, and they were then sonicated in ethanol for 5 min and dried at room temperature.
The simulated acid rain solution (SAR) was prepared with the following analytical grade reagents: H2SO4 0.06 mL L−1, HNO3 0.02 mL L−1, NaNO3 2.65 mg L−1, (NH4)2SO4 3.65 mg L−1, Na2SO4 3.45 mg L−1, NaCl 8.75 mg L−1, and ultrapure deionized water (18.2 MΩ∙cm) [64]. The initial pH of the as-formed solution was 2.73.

2.2. Immersion Test and Analysis of Surface

Samples of the AM60 alloy and AM60-AlN nanocomposite were immersed in triplicate in 20 mL of SAR solution and in independent containers for 1, 7, 10, 15, and 30 days following ASTMG31–12a [65]. At the end of each period of exposure, the samples were withdrawn, rinsed with deionized water, and dried in air at room temperature. The waste solutions were stored in order to measure their pH and the concentration of the released Mg-ions by means of photometry (HI83200, Hanna Instruments, Woonsocket, RI, USA). With the purpose of evaluating the mass loss and damage on the surface samples after each exposure period, the layer of corrosion products was chemically removed in the solution of 200 g L−1 of CrO3, 10 g L−1 of AgNO3, and 20 g L−1 of Ba(NO3)2, according to ASTM G1–03 [66]. To calculate the mass loss (Δm = W), the initial (w0) and final mass (w1) of the samples were measured by an analytical balance (VE−204, Velab, CDMX, México). The annual corrosion rate (CR in mm yr−1) was calculated through Equation (2), specified by ASTM-G1–03 [66]:
C R = ( K × W ) × ( A × T × D ) 1
where K is a constant (8.76 × 10⁴), W is the mass loss (g), A is the surface area (cm2), T is the time of exposure (h), and D is the metal density (g cm−3).
The possible crystalline phases were analyzed by X-ray diffraction (Siemens, D−500, Munich, Germany). The changes in morphology and composition of the formed layers on the surface after exposure to SAR were characterized by scanning electron microscopy (SEM-EDS, XL−30 ESEM-JEOL JSM−7600F, JEOL Ltd., Tokyo, Japan) and XPS spectroscopy (K-Alpha Surface Analyzer, Thermo Scientific, Waltham, MA, USA). The binding energies of all XPS spectra were normalized to the C1s peak at 284.8 eV.

2.3. Electrochemical Characterization

The study of the electrochemical corrosion behavior was carried out through several electrochemical methods, such as registration of the corrosion potential and current fluctuations (at open circuit potential, OCP) and electrochemical impedance spectroscopy (EIS). An interface−1000E potentiostat/galvanostat/ZRA (Gamry Instruments, Philadelphia, PA, USA) was used with a typical three-electrode cell configuration, inside a Faraday cage: the working electrodes (0.78 cm2) of AM60-AlN and AM60, the Pt mesh (Alfa Aesar, Ward Hill, MA, USA) as an auxiliary electrode, and a saturated calomel electrode (SCE) as a reference electrode (Gamry Instruments, Philadelphia, PA, USA). All experiments were carried out at room temperature of 21 °C. The EIS spectra were acquired for 1 h and 1, 7, 10, and 15 days of immersion in SAR solution, employing a perturbation amplitude of ±10 mV vs. OCP (stabilized after 1 h), and a frequency interval from 100 kHz to 10 mHz. The obtained EIS data were analyzed with Gamry Echem Analyst software (Gamry Instruments, Philadelphia, PA, USA).
The fluctuations in the current (at OCP, recorded over 3 h) were measured employing two identical working electrodes and the SCE reference electrode, connected to the potentiostat in zero resistance ammeter mode (ZRA), according to ASTM G199–09 [67]. The sampling interval was of 0.1 s and at different times: initial, 1, 7, 10, 15, and 30 days. The spontaneous current fluctuations associated with corrosion phenomena were considered as electrochemical noise (EN) and examined with Electrochemical Signal Analyzer ® (Gamry Instruments, V.7.0.1, Philadelphia, PA, USA), transforming the data to the frequency domain by fast Fourier transform (FFT), in order to analyze their power spectral density (PSD) [68,69]. The values of the β-slope, as an exponent of PSD plots, were used to characterize the dynamics of the corrosion process.

3. Results and Discussion

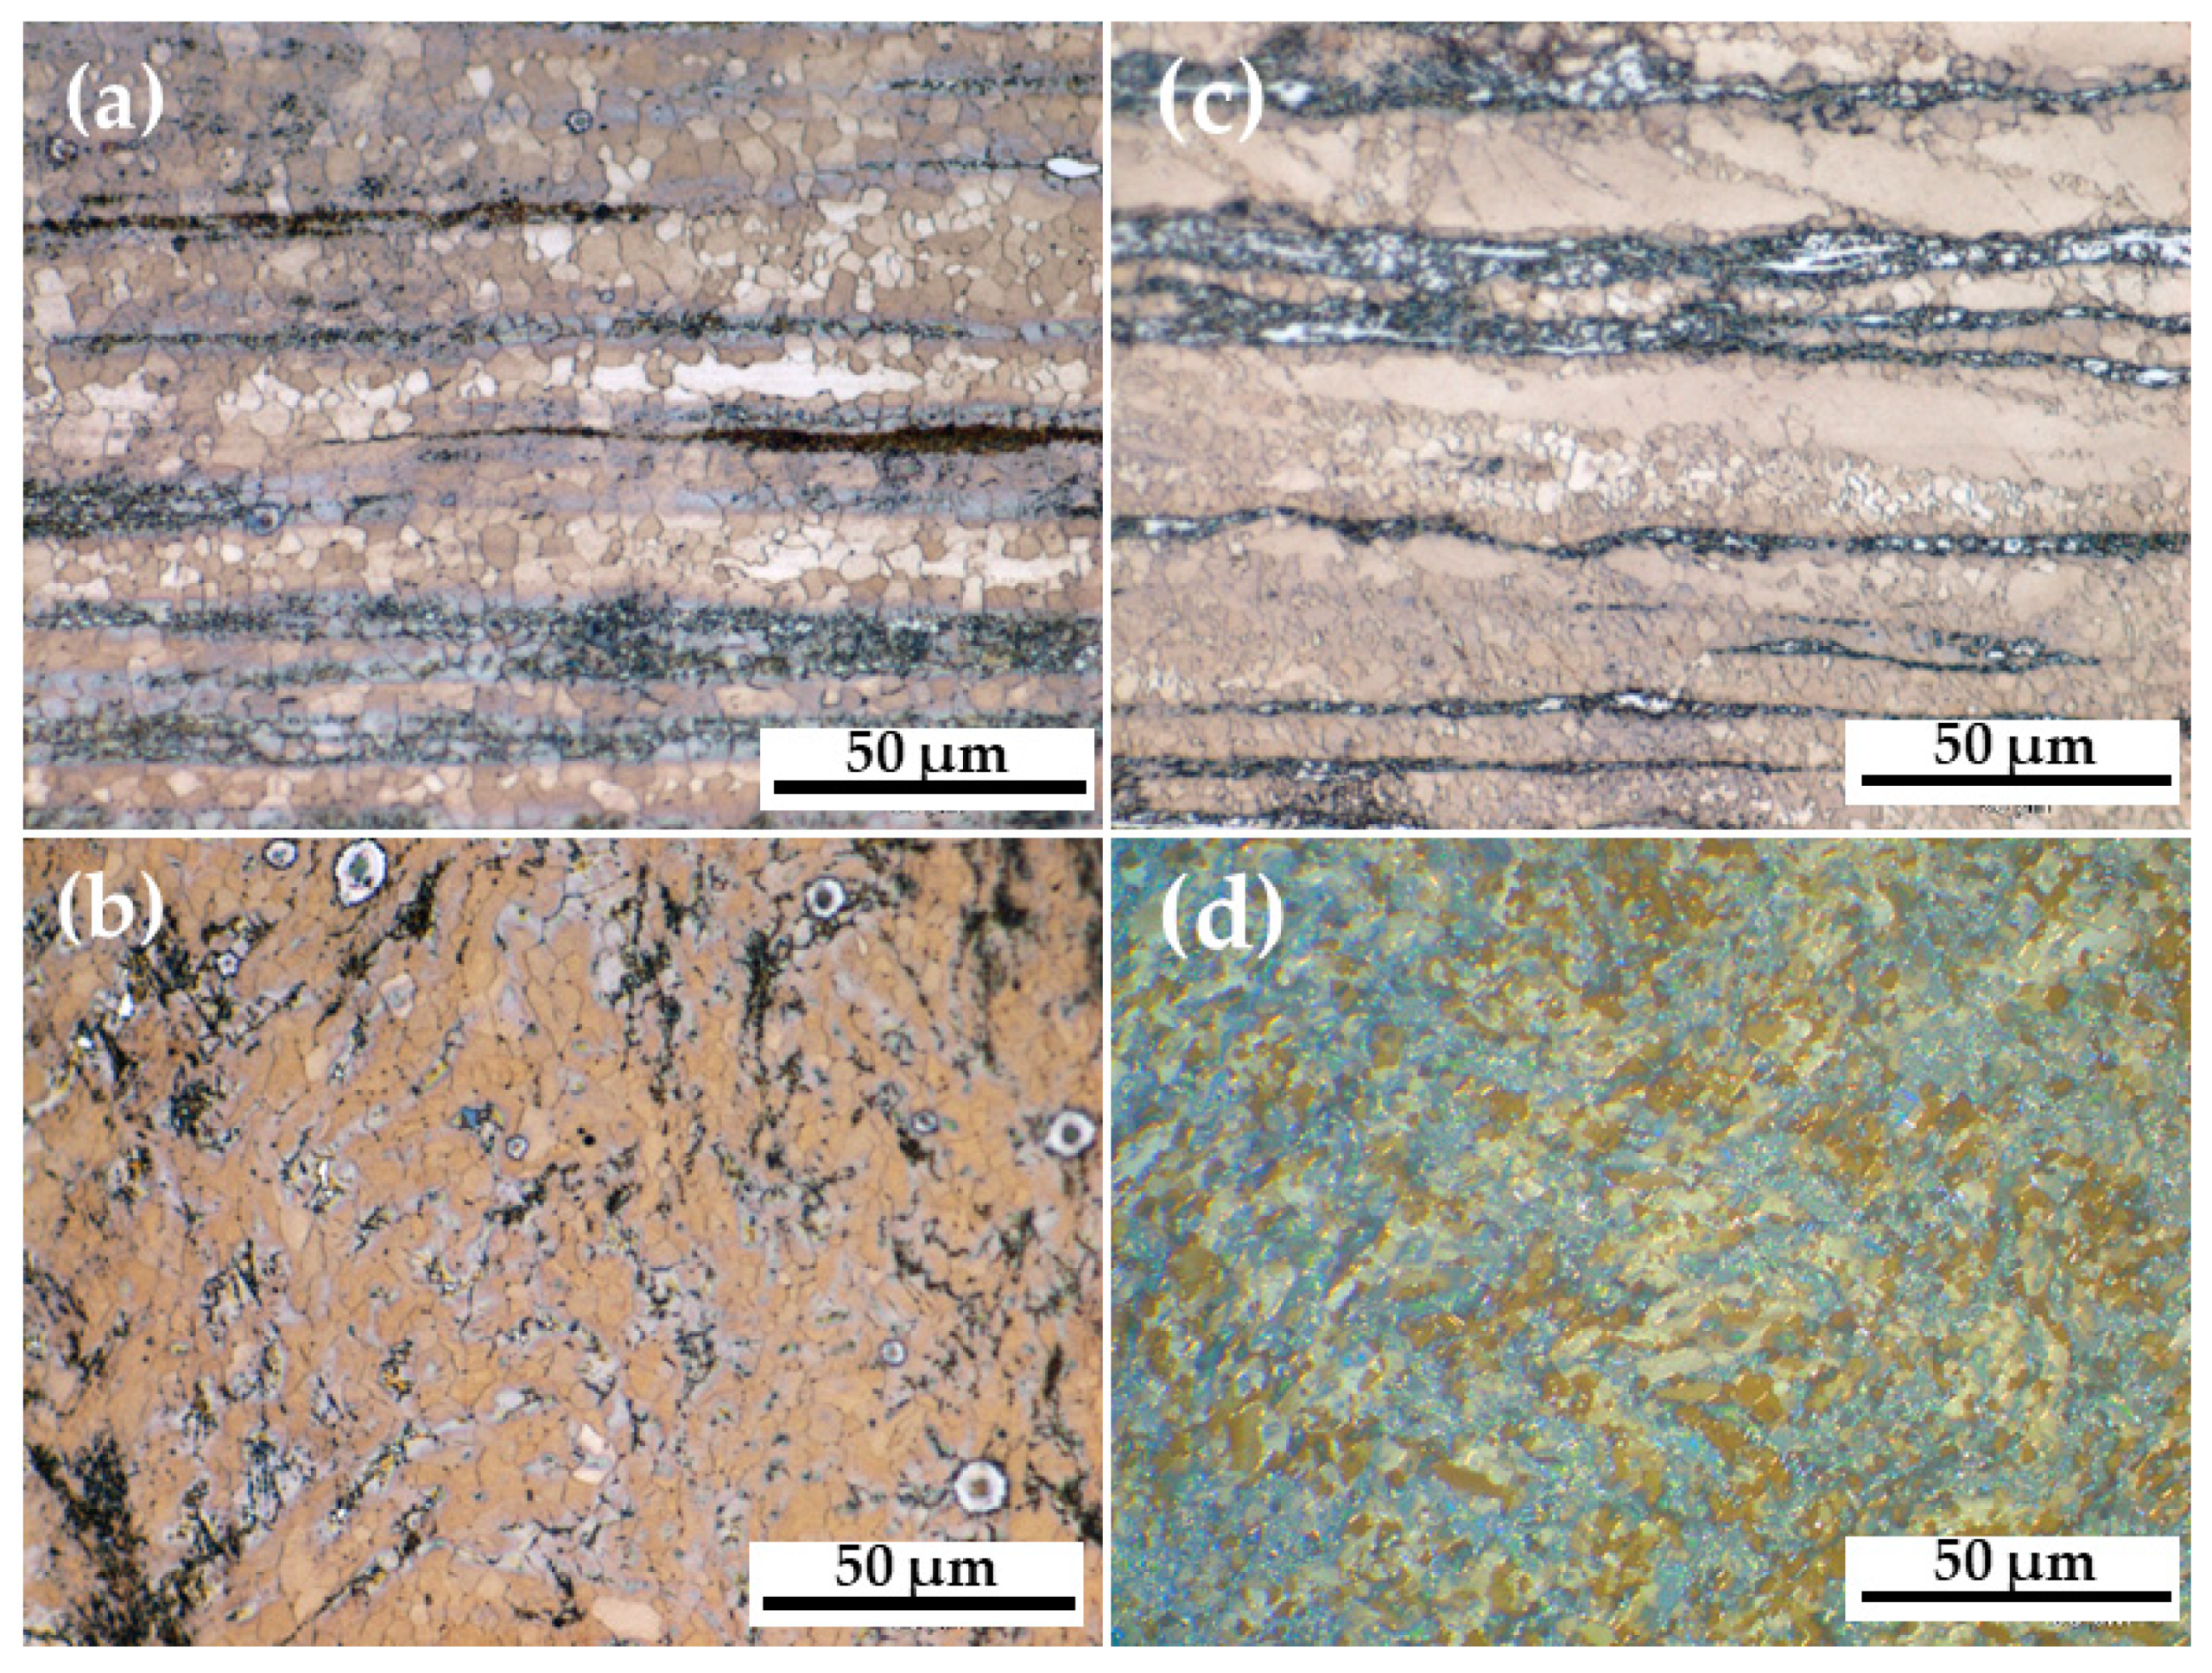
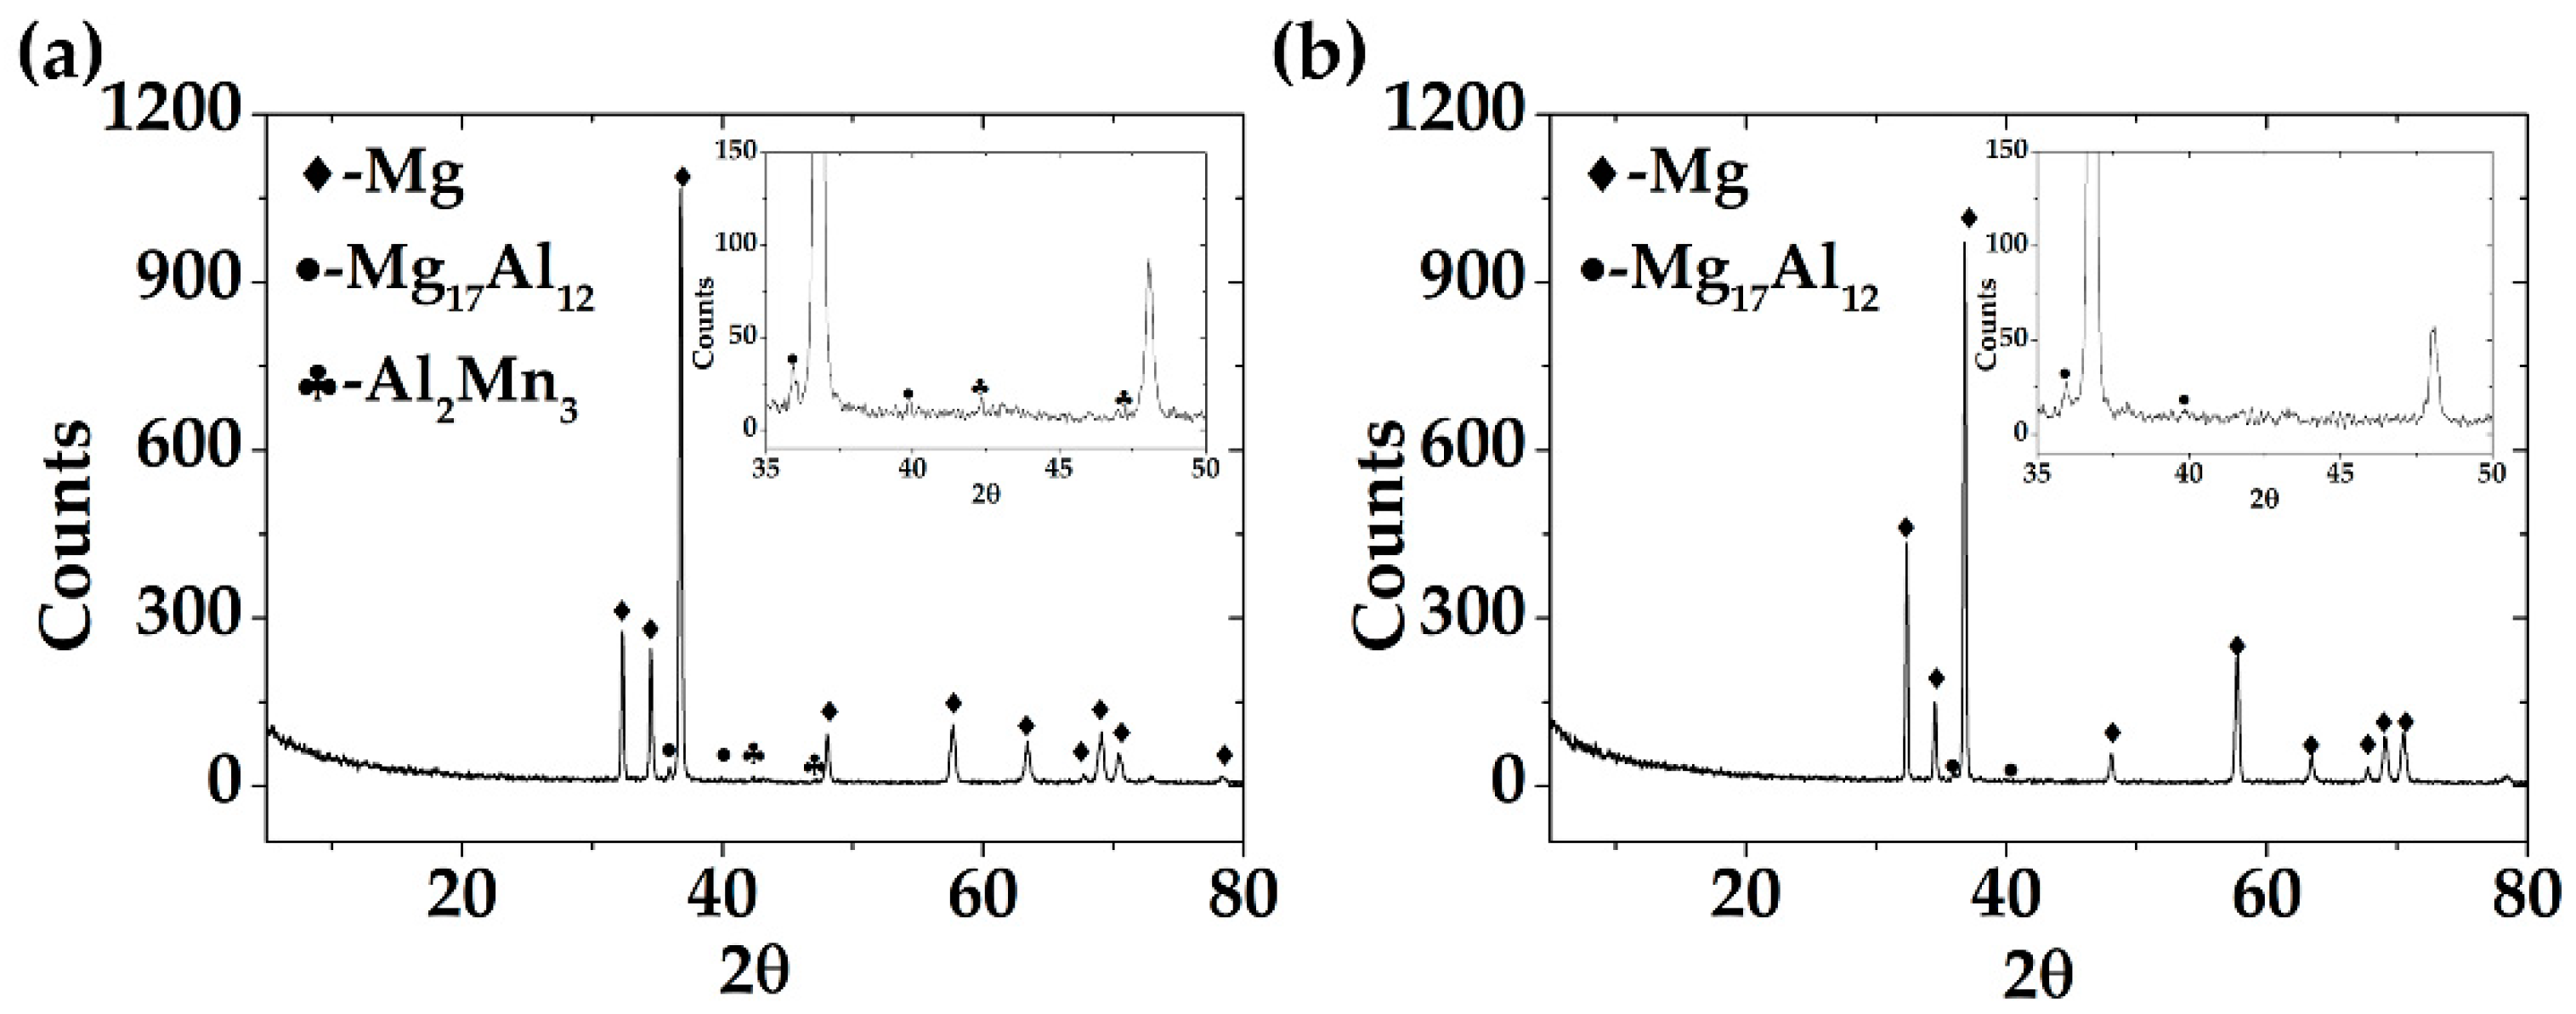
3.1. Microstructure of AM60-AlN and AM60

The optical images (Figure 1) compare the grain size of the AM60-AlN nanocomposite (Figure 1a,b) and AM60 alloy (Figure 1c,d), presented in the longitudinal and cross-sections. The introduction of 1.0 wt.% AlN nanoparticles in the AM60 alloy carried a slight grain refinement (Table 1) with a size reduction from 3.3 ± 1.1 to 2.9 ± 0.1 µm (longitudinal section) and from 3.3 ± 0.2 to 2.9 ± 0.4 µm (cross-section). This reduction in grain size may have a beneficial effect on ductility [70,71,72]. On the other hand, the Vickers hardness (Table 1) of AM60-AlN resulted in a slight improvement (7%), probably due to the grain refinement, as well the reduction in dislocation movements in the presence of AlN nanoparticles [61].
Figure 2 presents the XRD patterns of the AM60-AlN nanocomposite (Figure 2a) and AM60 alloy (Figure 2b). The characteristic peaks of Mg, as well as those in the low intensity of Al-Mn intermetallic particles (42.55° and 47.14°) and secondary phase of β-Mg17Al12 (35.95° and 40.07°), are revealed. However, no aluminum nitride peaks were detected, because of the low concentration (1%) of AlN nanoparticles in the AM60 matrix.
Figure 3 compares SEM images (×2000) of the AM60-AlN nanocomposite (Figure 3a) and AM60 alloy (Figure 3b) surface microstructures. On the recently polished surface of the α-Mg matrix (labeled as 1), clusters of particles (labeled as 2) appeared, which EDS elemental analysis (Table 2) suggests may be considered as the intermetallic Mn-rich particles of AlMn, in the presence of C and O elements, the contents of which were attributed to the reported effective nucleating particles of Al-C-O (Al2CO) [73]. The AlN nanoparticles (labeled as 3, Figure 3a) were observed as “attached” to those of AlMn, forming clusters. Although the content of Mg (64.4 wt.%, Table 2) was slightly higher than that of 42–58 wt.% given in the binary phase diagram for Al-Mg [74], the areas labeled as 4 were assigned to the β-Mg17Al12 secondary phase, present in both alloys.

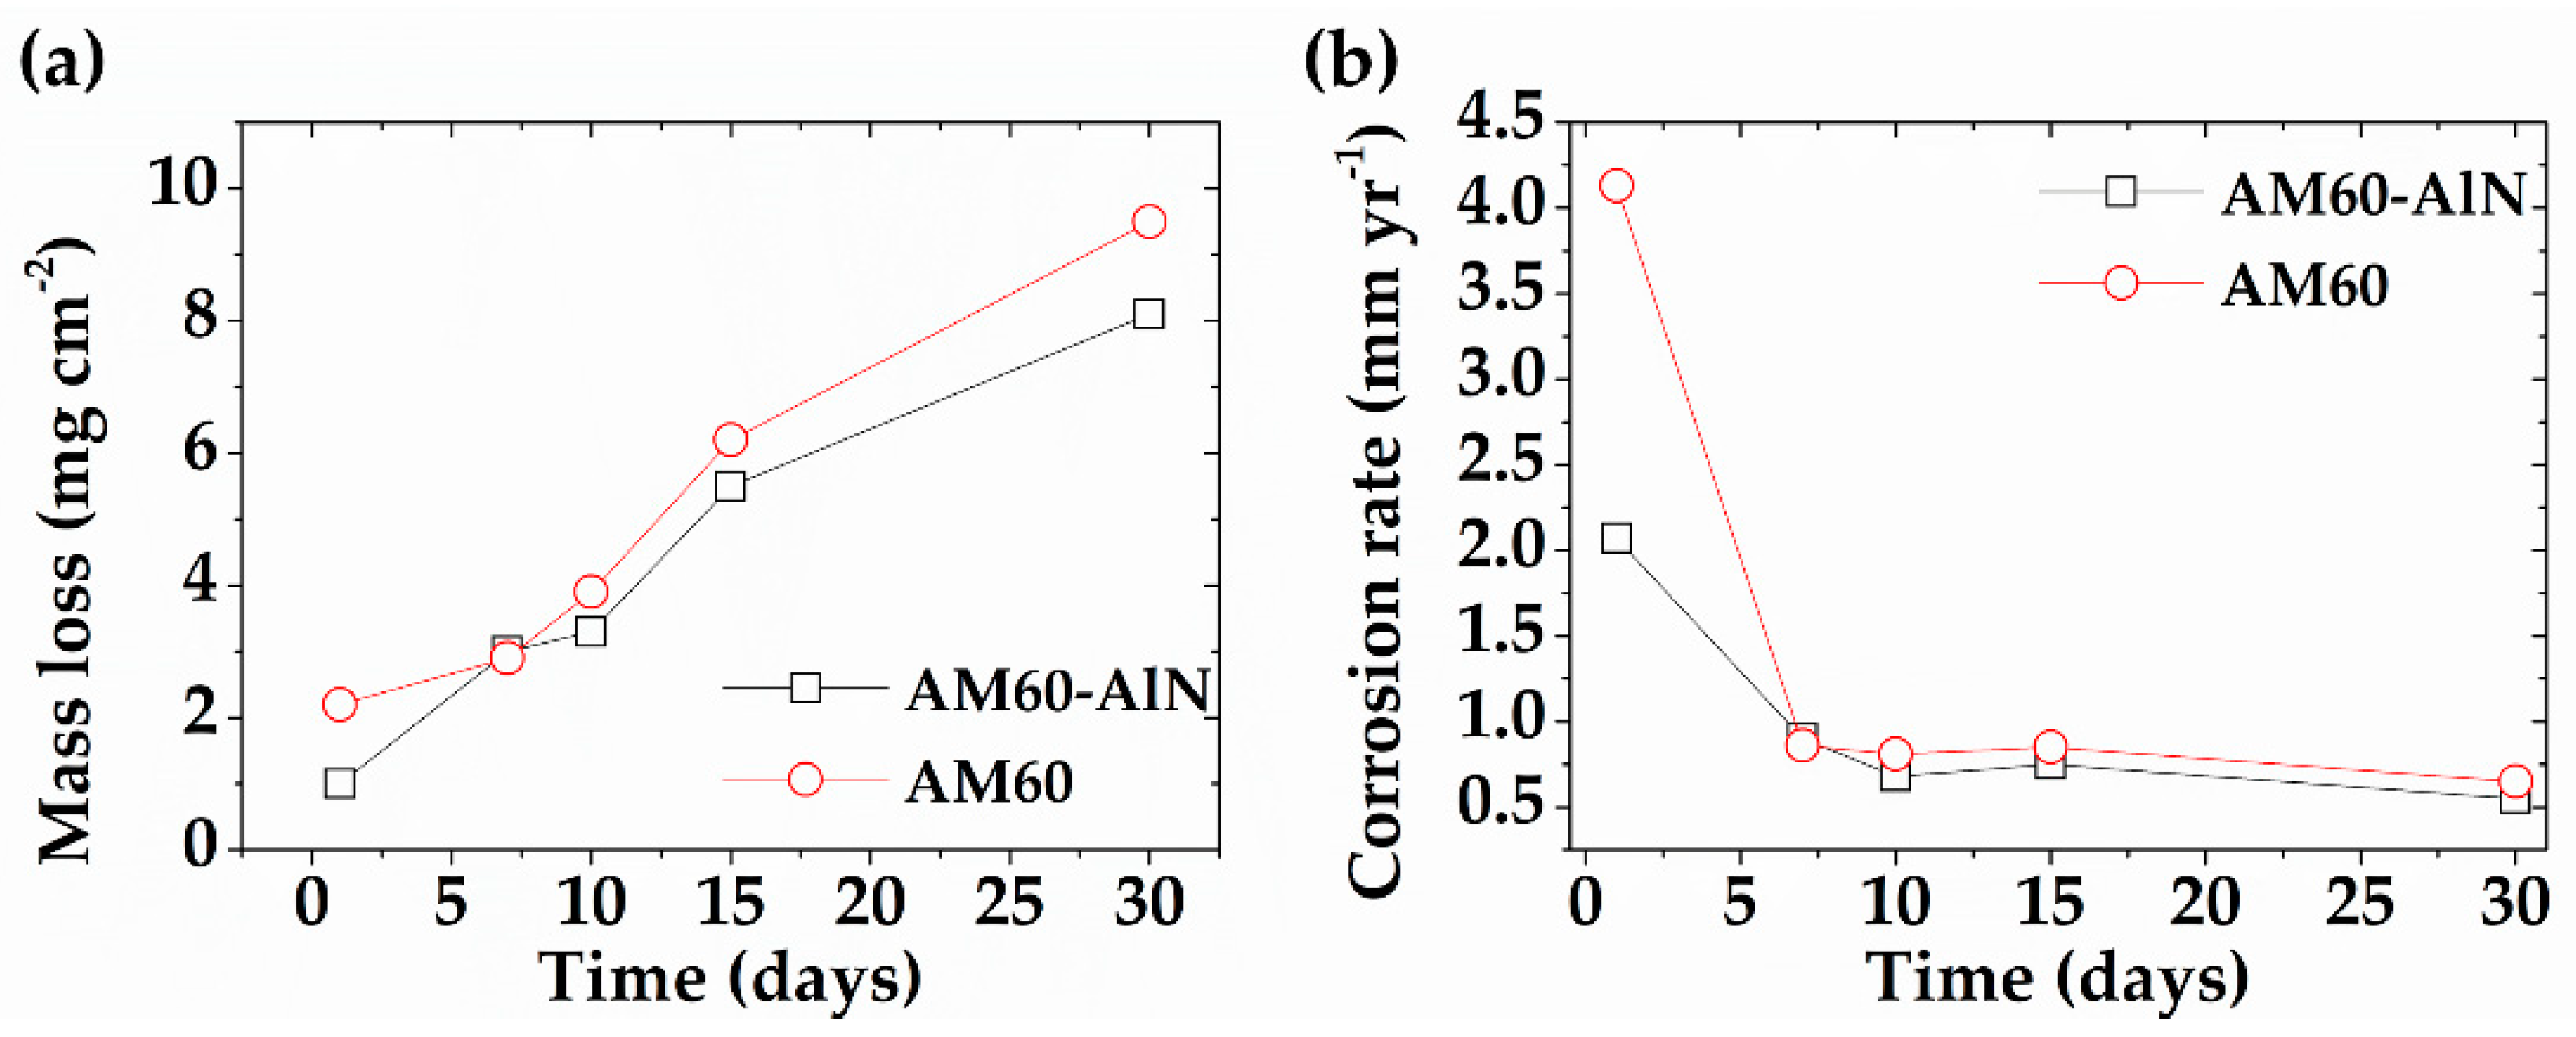
3.2. Test Solution Monitoring and Mass Loss Measurement

It has been suggested that the corrosion behavior of aluminum nitride (AlN) in a relatively neutral solution (pH = 7 of deionized water) may be described by the following reactions [75]:
AlN + 2 H 2 O   AlOOH + NH 3
NH 3 + H 2 O NH 4 + + OH
AlOOH + H 2 O Al ( OH ) 3
Figure 4 presents the change in time of SAR pH (Figure 4a) and concentration of Mg2+ ions release (Figure 4b) into the SAR model solution, during the immersion of AM60-AlN nanocomposite and AM60 alloy samples. It can be seen (Figure 4a) that, since the first day, there was an abrupt change in pH initial value of 2.73, reaching pH ≈ 10.0 for AM60 and less alkaline values for AM60-AlN (pH ≈ 9.40). These facts indicated the beginning of the corrosion process, related to the H2 evolution in the acid SAR solution and the excess of OH- ions (Equation (1)). As the pH solution reached alkaline values (Figure 4a), the higher content of OH- ions may favor the formation of Al(OH)3 (Equation (5)).
The change in time of the released Mg2+ ions into the SAR solution (Figure 4b) indicated an increase, because of the penetrated Cl ions in Mg(OH)2 pores and a local transformation of this corrosion product (Equation (6)) into highly soluble MgCl2 (56.0 g mL−1) [76]. The concentration of the released Mg-ions (Equation (7)) reached at 30 days was 5.4 ± 0.34 g cm−2 for AM60, 24% higher than the 4.1 ± 0.25 g cm−2 for AM60-AlN (Figure 4b).
Mg ( OH ) 2 + 2 Cl MgCl 2 + 2 OH
MgCl 2 Mg 2 + + 2 Cl
The change in mass (∆m) and annual corrosion rates (Equation (2)) are presented in Figure 5. After the first day, the mass loss of AM60 was of 2.20 ± 0.19 mg cm−2, twice greater than that of the AM60-AlN composite. At 7 days, the ∆m of both samples showed an increasing trend of up to 30 days, presenting 9.5 ± 0.21 mg cm−2 for AM60 and a lower value of 8.1 ± 0.19 mg cm−2 for AM60-AlN (Figure 5a). The calculated annual corrosion rates, based on ∆m values corresponding to 30 days, were 0.65 ± 0.01 and 0.55 ± 0.01 mm yr−1, for AM60 and AM60-AlN, respectively (Figure 5b). These values were influenced by the pH change over time and Mg2+ ions release (Figure 4).

3.3. Surface Characterization after Exposure to SAR Solution

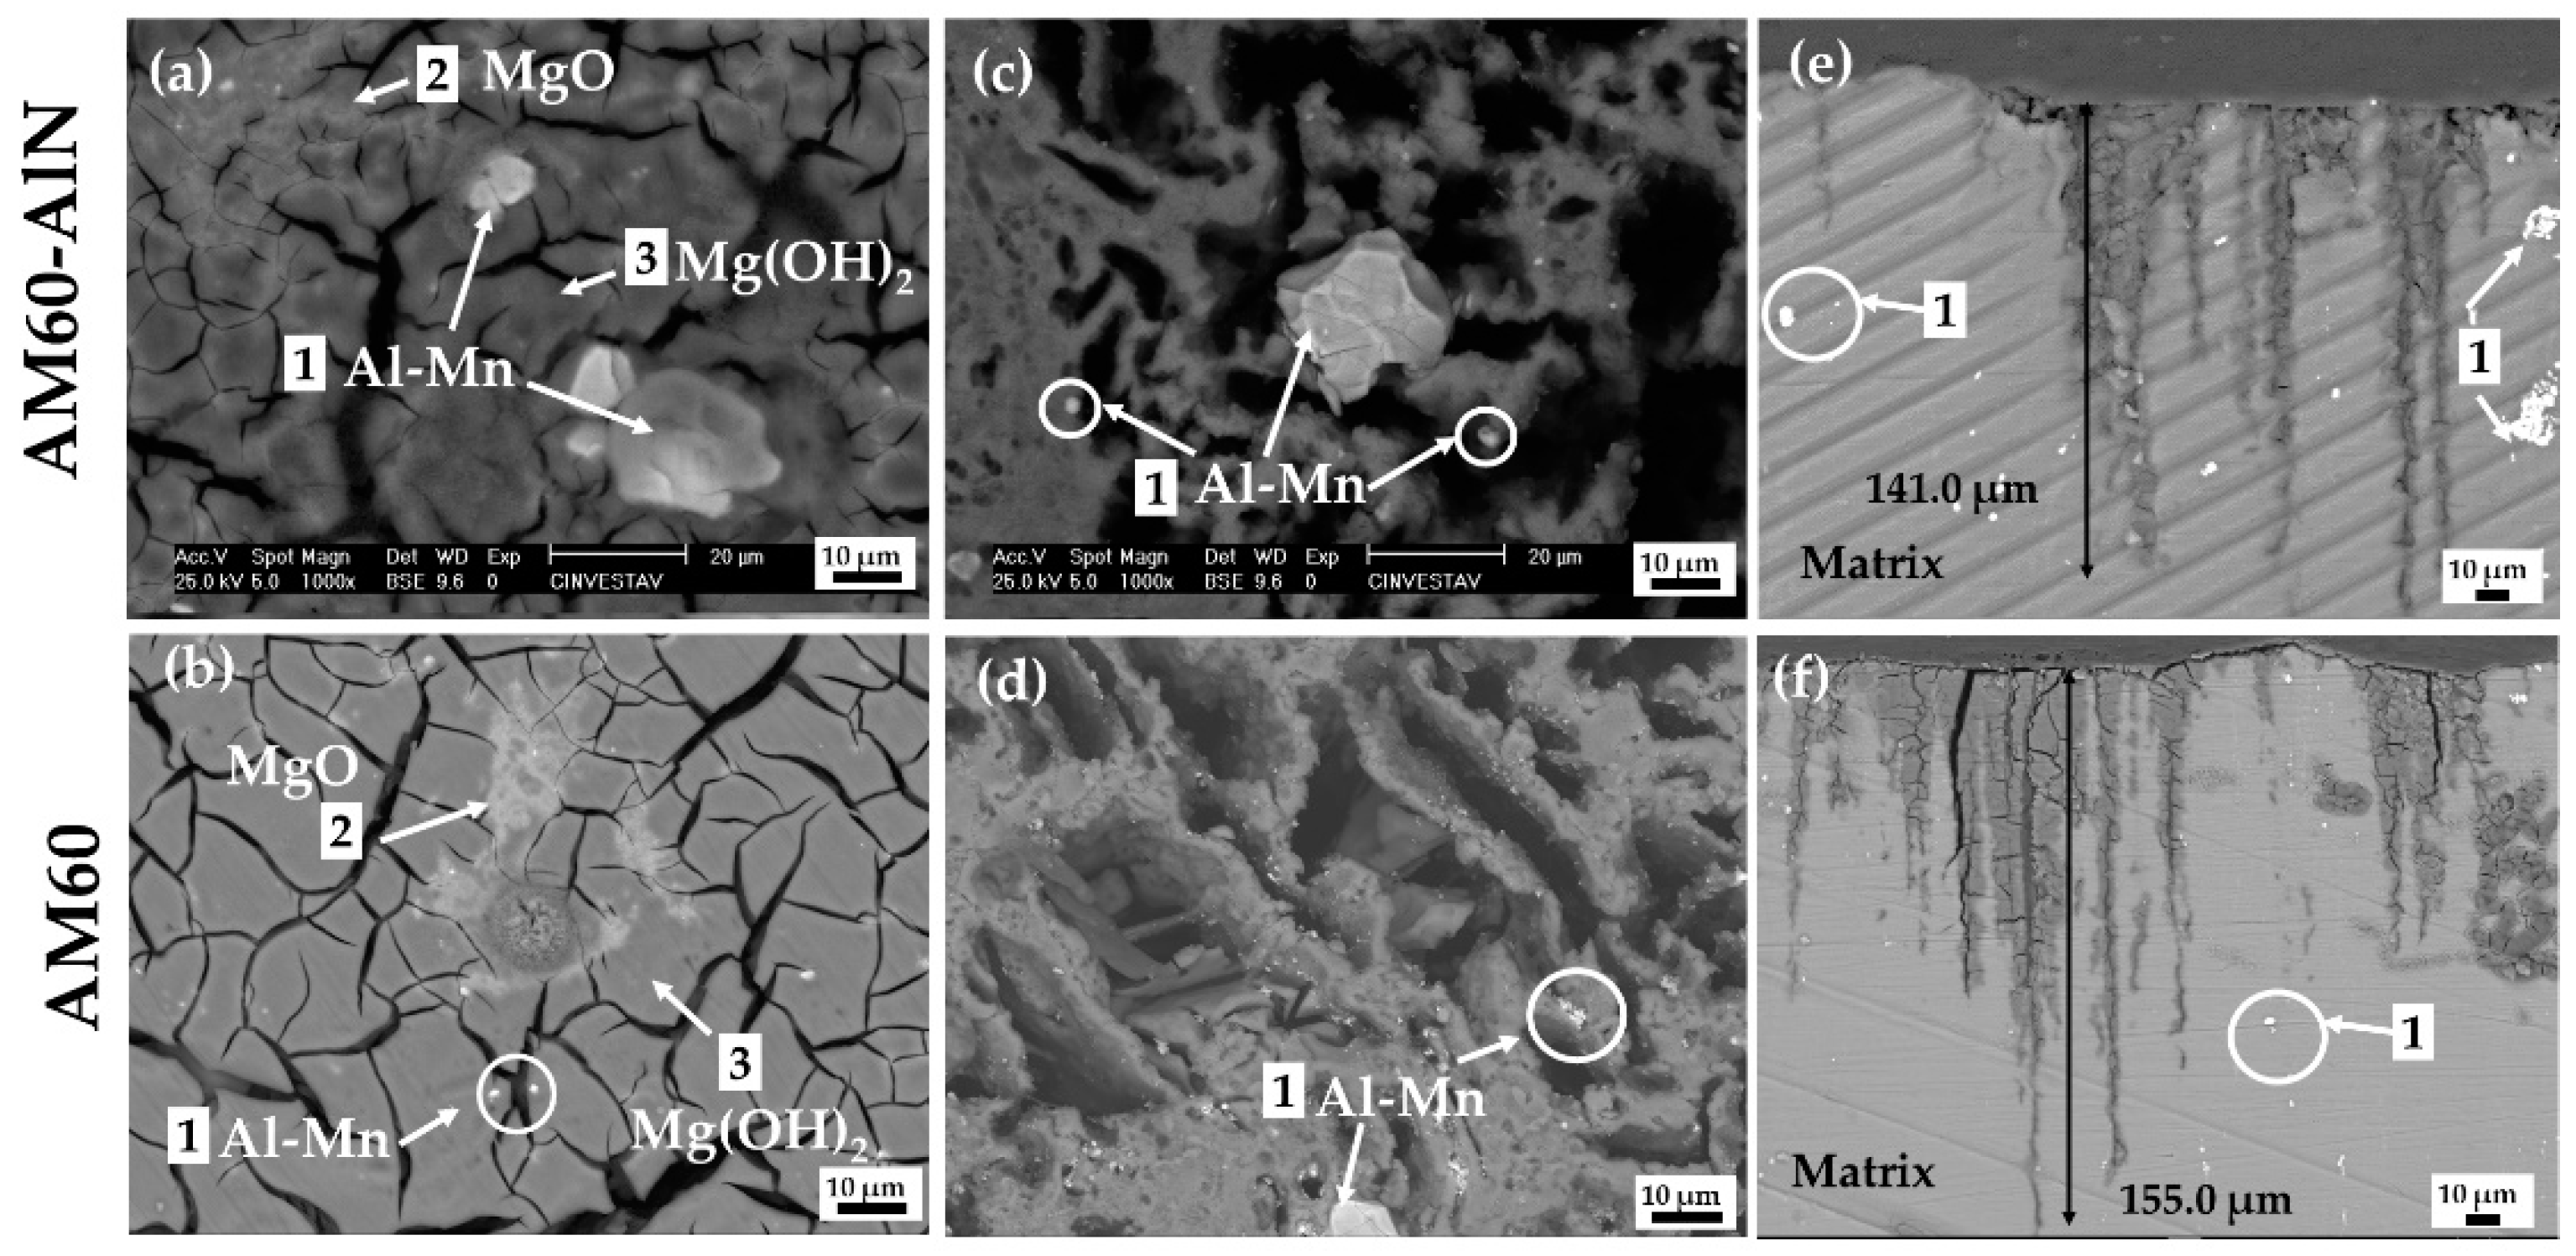
3.3.1. SEM-EDS Analysis
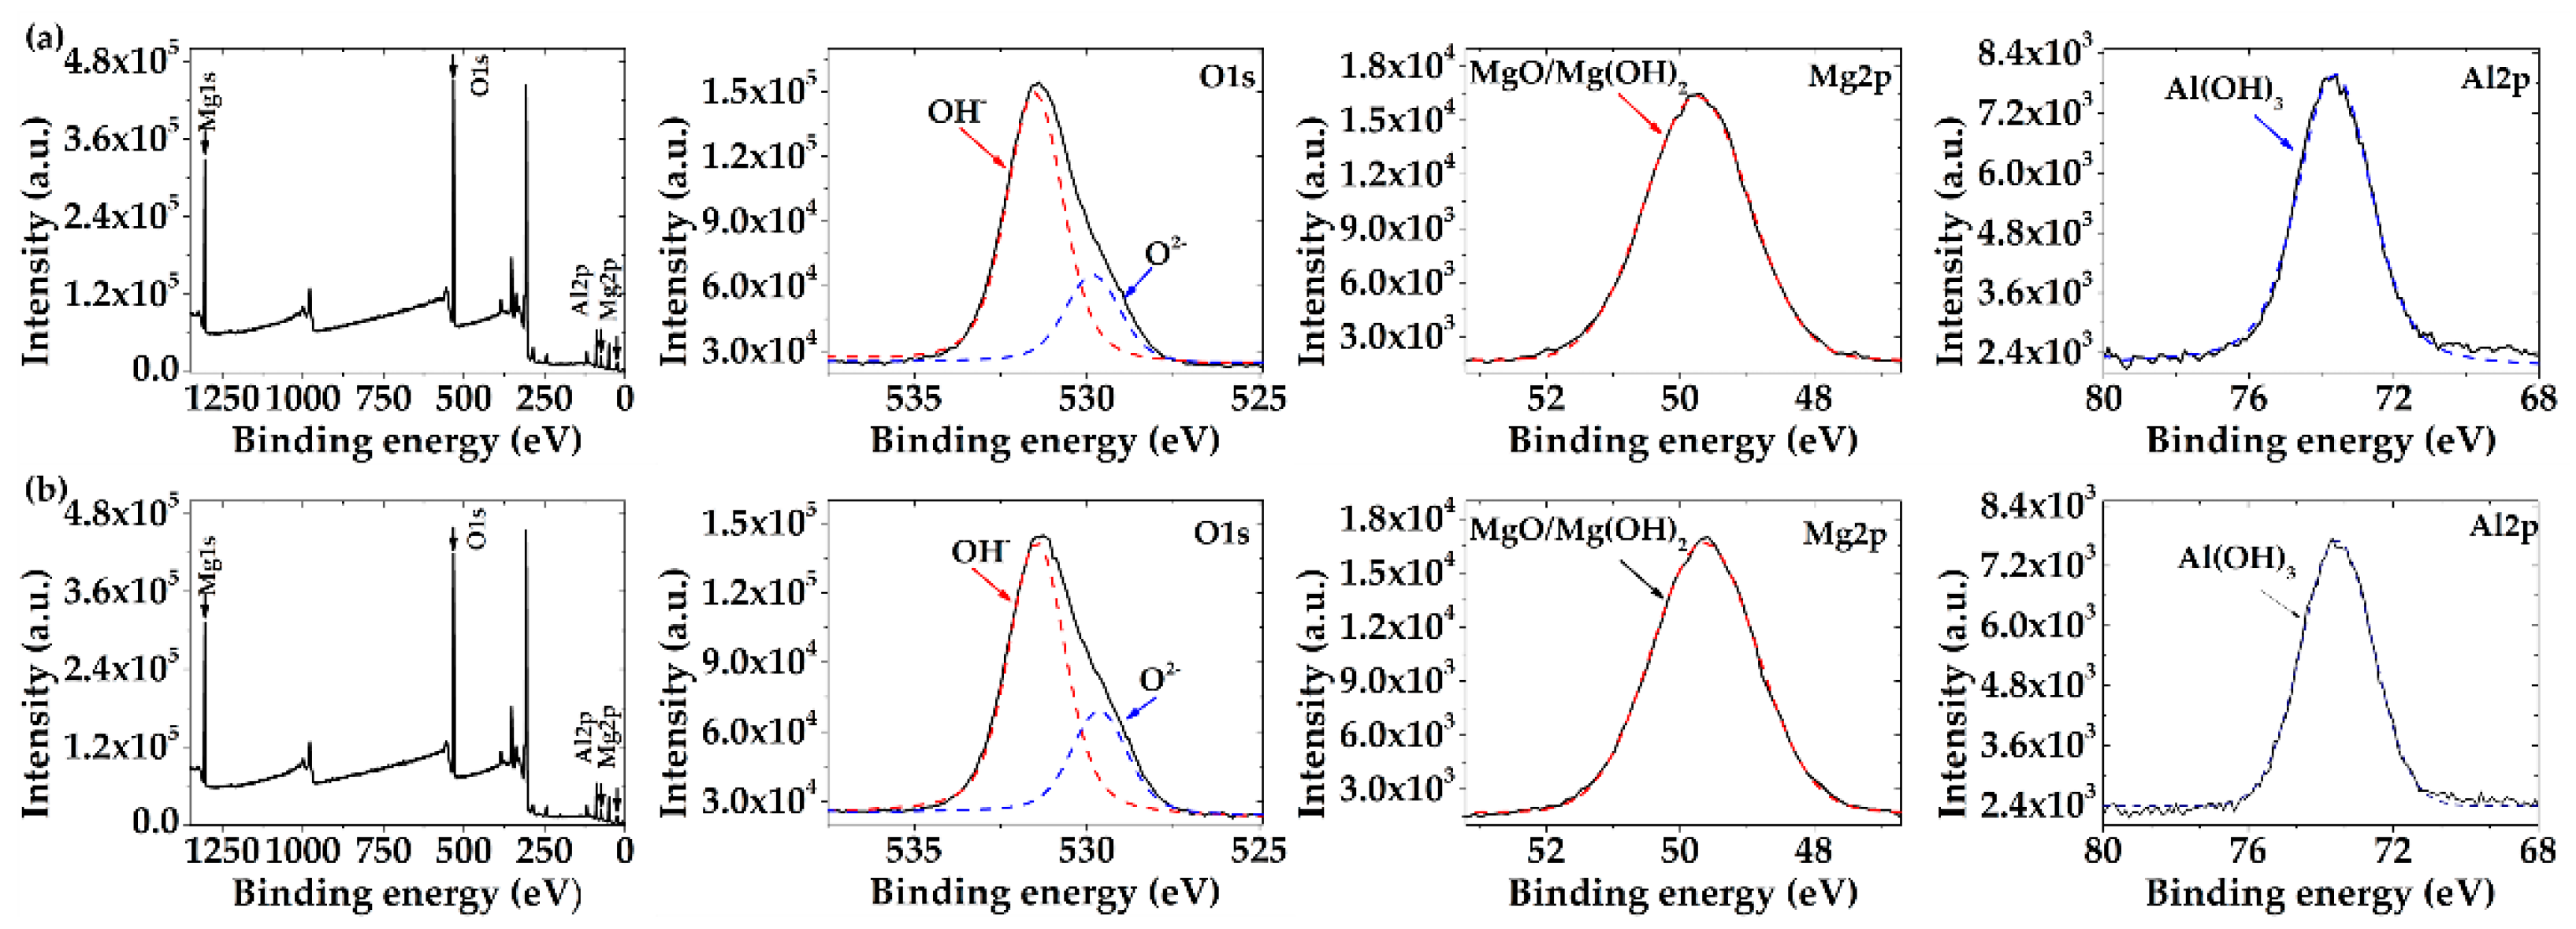
After exposure to acid rain (SAR) solution for up to 30 days, the layers grown on the AM60-AlN nanocomposite and AM60 alloy surfaces showed cracked layers of corrosion products (Figure 6a,b), which may act as channels connecting the Mg-matrix with the SAR solution, and also improve the diffusion of the released Mg2+ ions and H2 bubble evolution. The H2 bubble pressure within the pores of those layers may favor their fracture and eventual local detachment of the corrosion layer.
EDS analysis (Table 3) of the marked areas of interest confirmed the presence of the Mn-rich phase of Al-Mn intermetallic particles (labeled as 1) on the corroded surfaces (Figure 6a,b) even after the removal of the formed corrosion layers (Figure 6c,d). The SEM images confirmed the clusters of AlN-AlMn intermetallic particles, as observed on reference samples (Figure 3a). Their high content of Al (13.3 wt.%) suggests that the Al(OH)3 corrosion product was formed on their surface because of Al de-alloying (Equations (3)–(5)). It was reported that Al(OH)3 may be stable up to pH ≈ 8.5 because of its minimal solubility, and at pH > 9.5, the solubility will increase [77]. During the exposure of each material, the pH of SAR solution reached a value of ≈ 10 (Figure 4a). Thus, after 30 days of exposure to SAR solution, EDS did not detect the presence of the N element (Table 3), as being part of AlN nanoparticles. On the other hand, hydrolysis of aluminum nitride (Equations (3)–(5)) may start at pH ≈ 3 [78] and, thus, this reaction should also be considered as a possible in SAR solution.
The Al-Mn particles are considered local efficient cathodes [79,80,81,82] and, thus, they subsist on the Mg-matrix after the removal of corrosion layers (Figure 6c,d). However, it has been reported that, in the presence of chloride ions (NaCl), the Al-Mn phase is unstable and may suffer de-alloying, forming Al(OH)3 with its posterior delamination [82]. Scanning Kelvin probe force macroscopy (KPFM) maps of the Volta potential difference measurements, for Al-Mn alloys immersed in NaCl solution, have shown the cathodic character of Al-Mn particles, as nobler than the adjacent Mg-matrix; thus, induced localized corrosion is observed in their vicinity [80,81]. The cross-sectional morphology of the AM60-AlN (Figure 6e) nanocomposite and that of the AM60 alloy (Figure 6f) revealed a maximum depth of 141.0 µm of less intensive localized attack in the case of AM60-AlN and 155 µm for the AM60 alloy.
On the other hand, EDS analysis (Table 3) indicated clearly that the main corrosion product of the cracked surface of each alloy was Mg(OH)2, in addition to MgO (Figure 6a,b). The study of AM50 and AZ31 exposed to NaCl + MgCl2 solution reported the formation of Mn2O3 as an additional corrosion product [82]. The Mn standard potential (−1.18 V) was nobler than those of Al and Mg.

3.3.2. XPS Analysis

To complement the EDS elemental composition of the corrosion layers, formed on each alloy surface after 30 days of exposure to the acid rain model solution (SAR), XPS spectra analysis was performed (Figure 7). The binding energies (Table 4) of O1s, Mg2p, and Al2p were identified (Figure 7a,b). The high-resolution peak of O1s consists of two signals, according to the fitting-curves: the lower oxygen signal at 529.9 eV was attributed to MgO (O2−) and the high signal at 531.6 eV was associated with (OH) present in Mg(OH)2, as the main corrosion product, as well as a part of Al(OH)3. On the other hand, the signal of Mg2p contains the contributions of MgO and Mg(OH)2 [83,84,85], and the signal of Al2p contains the contribution of Al(OH)3 [86].

3.4. Electrochemical Measurements

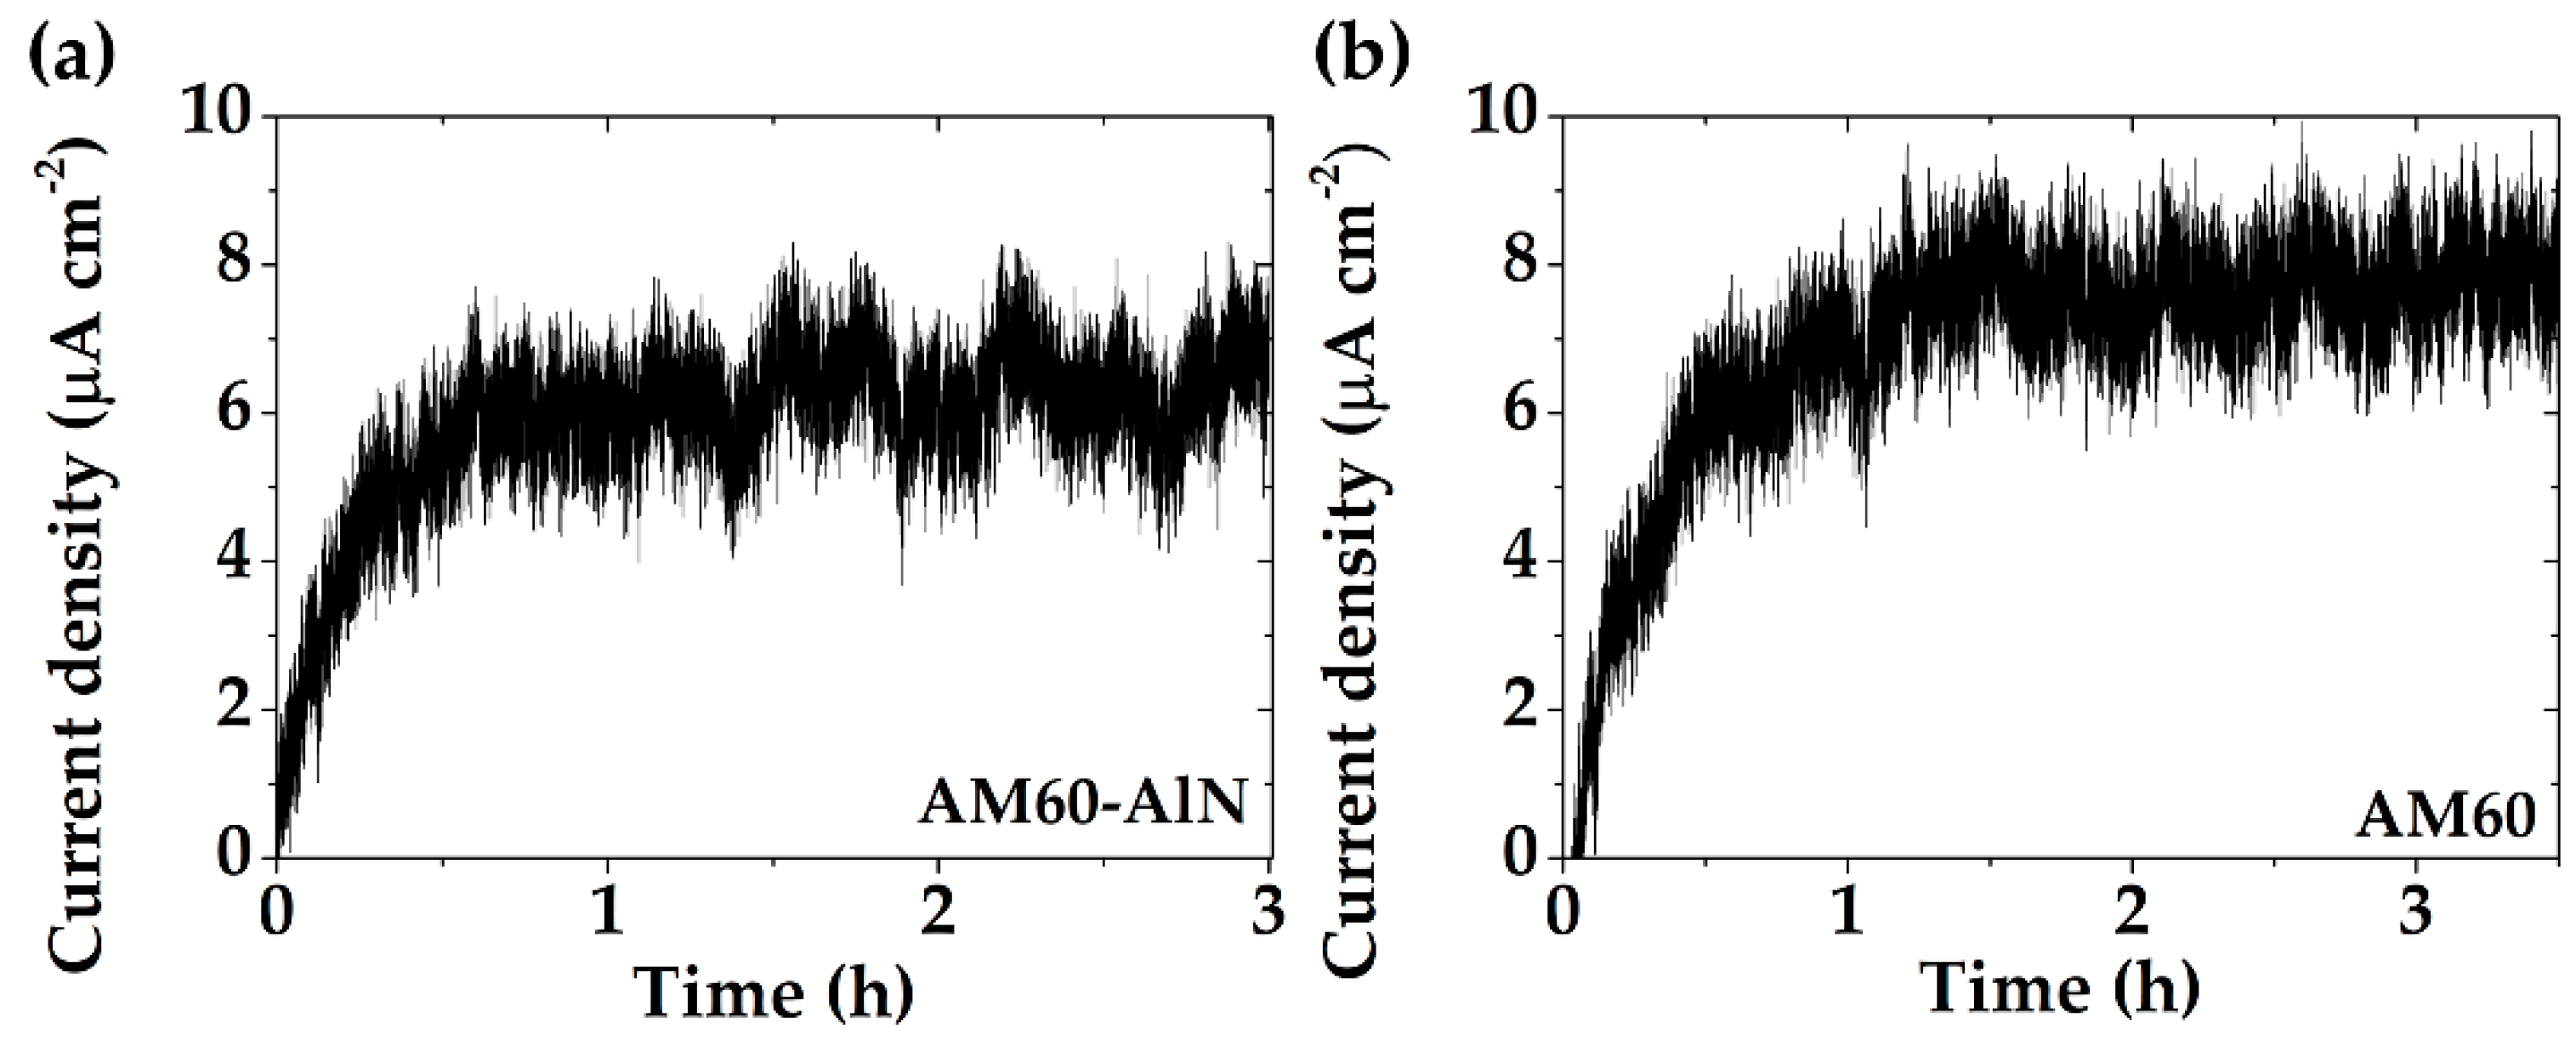
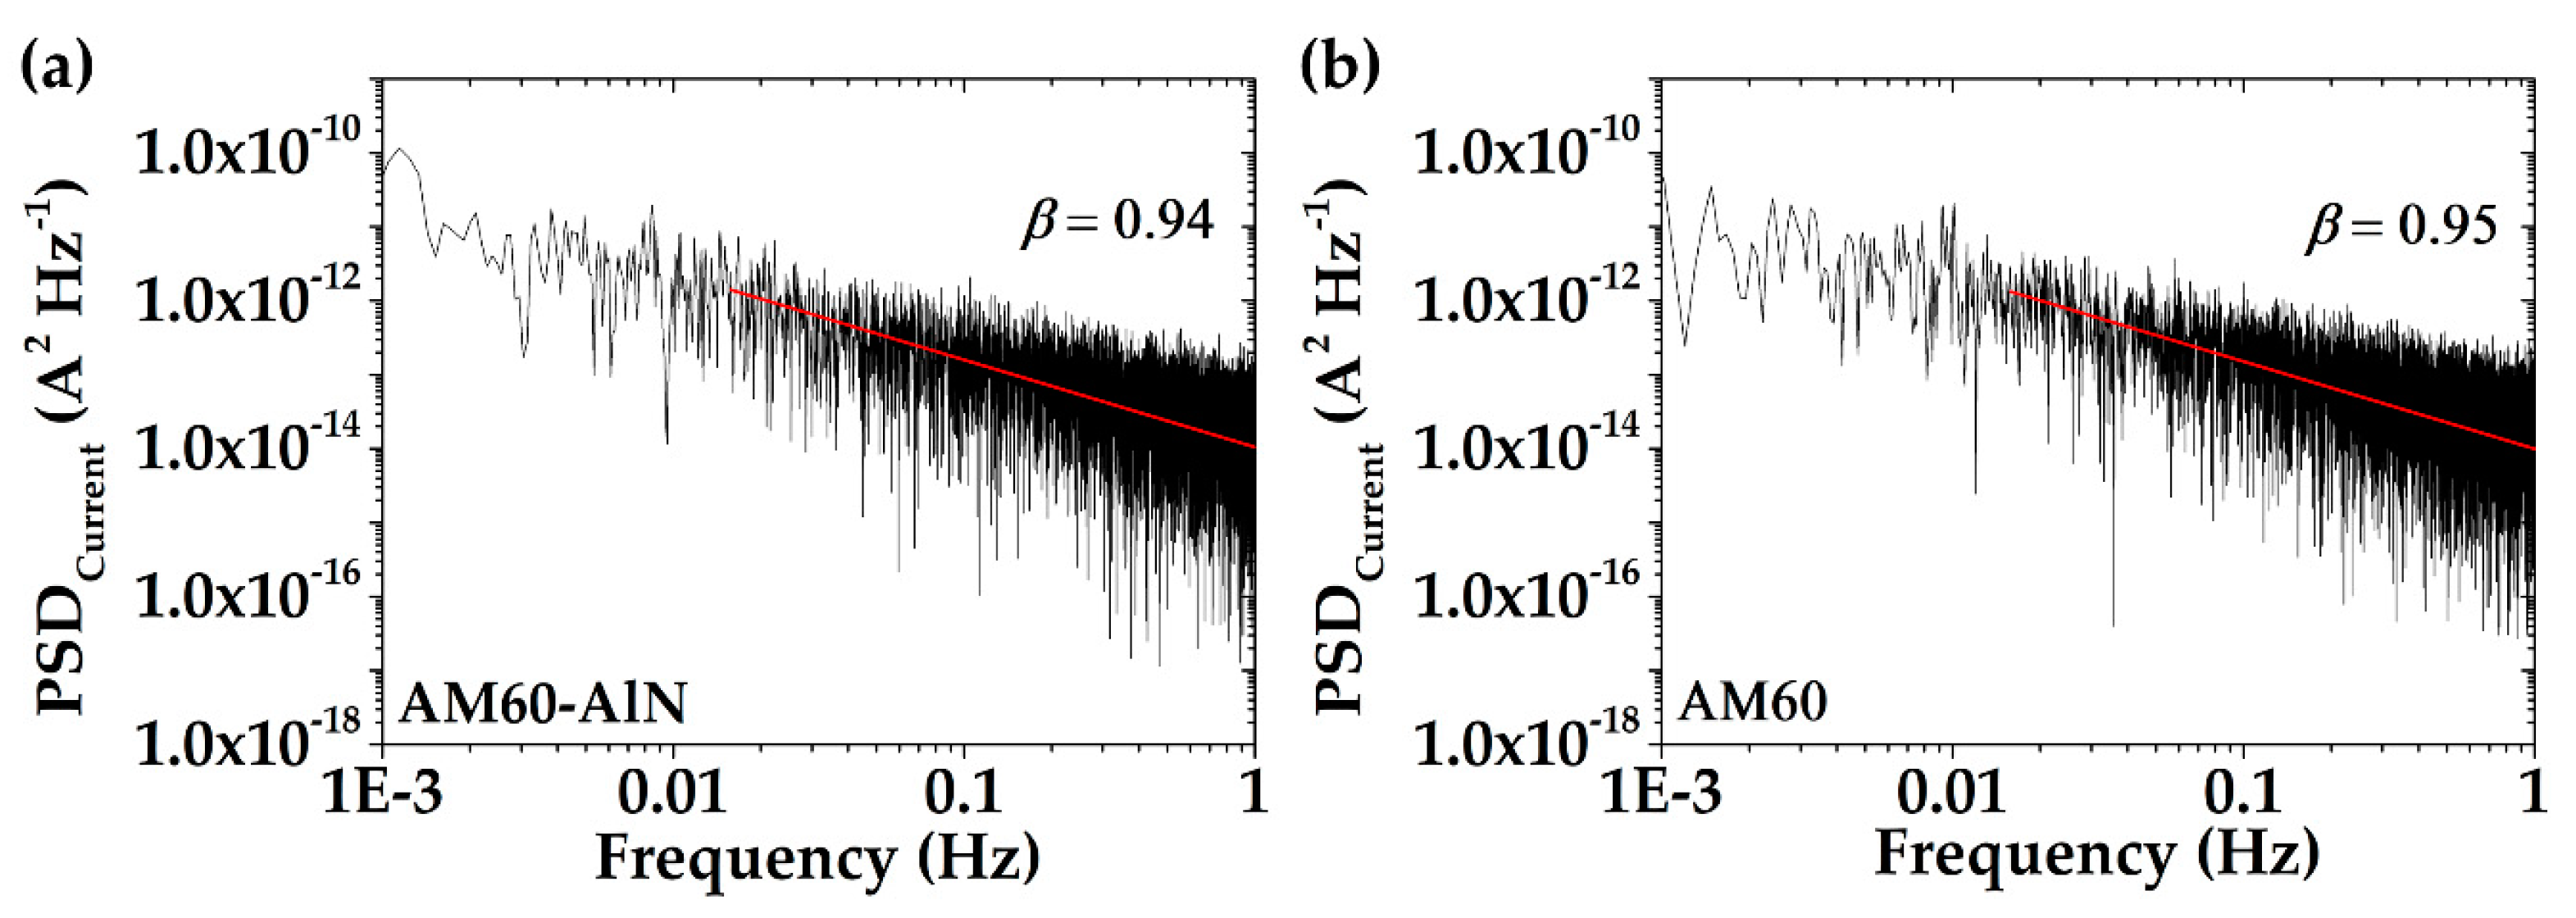
3.4.1. Electrochemical Noise (EN) Analysis

Table 4 compares the change in time of the open circuit potential (OCP) values of the AM60-AlN nanocomposite and AM60 alloy, exposed for 30 days in the SAR (acid rain model solution). After 7 days, the OCP reached less negative values, because of the formed corrosion layers on the alloy surfaces. Until the end of the experiment (30 days), the OCP values were almost constant, with those of the AM60-AlN nanocomposite being less negative. These results are consistent with the mass losses (Figure 5a), as well as with the concentration of the released Mg-ions (Figure 4b).
Figure 8 presents the fluctuations in corrosion current density (at OCP) for the AM60-AlN nanocomposite (Figure 8a) and AM60 alloy (Figure 8b), after 30 days of immersion in SAR solution. It is notable that the AM60 current density (≈7.8 µA cm−2) and its average amplitude (5.0 µA cm−2) were higher than those of the AM60-AlN nanocomposite (≈6.1 µA cm−2 and amplitude of 3.0 µA cm−2).
The spontaneous corrosion current fluctuations, associated with corrosion phenomena, were considered as electrochemical noise (EN), and the data were analyzed in the time and frequency domain, to identify the corrosion process. The analysis enabled the EN resistance ( R n ) values, related to the standard potential ( σ P ) and current ( σ i ) deviations, to be determined [67]. The Rn magnitude is considered an equivalent of the Rp, (polarization resistance) [87,88,89], and it is inversely proportional to the corrosion rate [90], when the corrosion mechanism is controlled by charge transfer [88]. The Rn values of the AM60-AlN nanocomposite (Table 5) after the first day and up to 30 days of exposure were 2–3 times higher than those of AM60, an indication of more efficient protective corrosion layers on the composite surface. The decreased Rn values at the end of the experiment (30 days) correlated with the observed localized corrosion on the surfaces of both studied alloys (Figure 6e,f).
The Rn (Rp) values were used to calculate the jcorr (Equation (8)) and the mass loss rate (MR), according to Equation (9), considering the tentative Tafel constant B’ of 52.80 mV [91], and the data are summarized in Figure 9.
j c o r r = B × R p 1
M R = K × i c o r r × E W
where K is a constant (8.958 × 10⁻³ g cm2/µA m2 d) and EW is the equivalent weight (11.91).
Figure 10 presents the PSD (power spectral density) of corrosion current fluctuations vs. frequency for the AM60-AlN nanocomposite and AM60 alloy (on a bi-logarithmic scale), after 30 days of exposure in the SAR model solution. The extracted exponent β values (0.94 and 0.95) of both alloys were similar and corresponded to fractional Gaussian noise (fGn, −1 < β < 1), as a stationary and persistent process [92,93,94]. This process may be considered as the persistent localized corrosion attacks, according to the SEM images (Figure 6e,f).

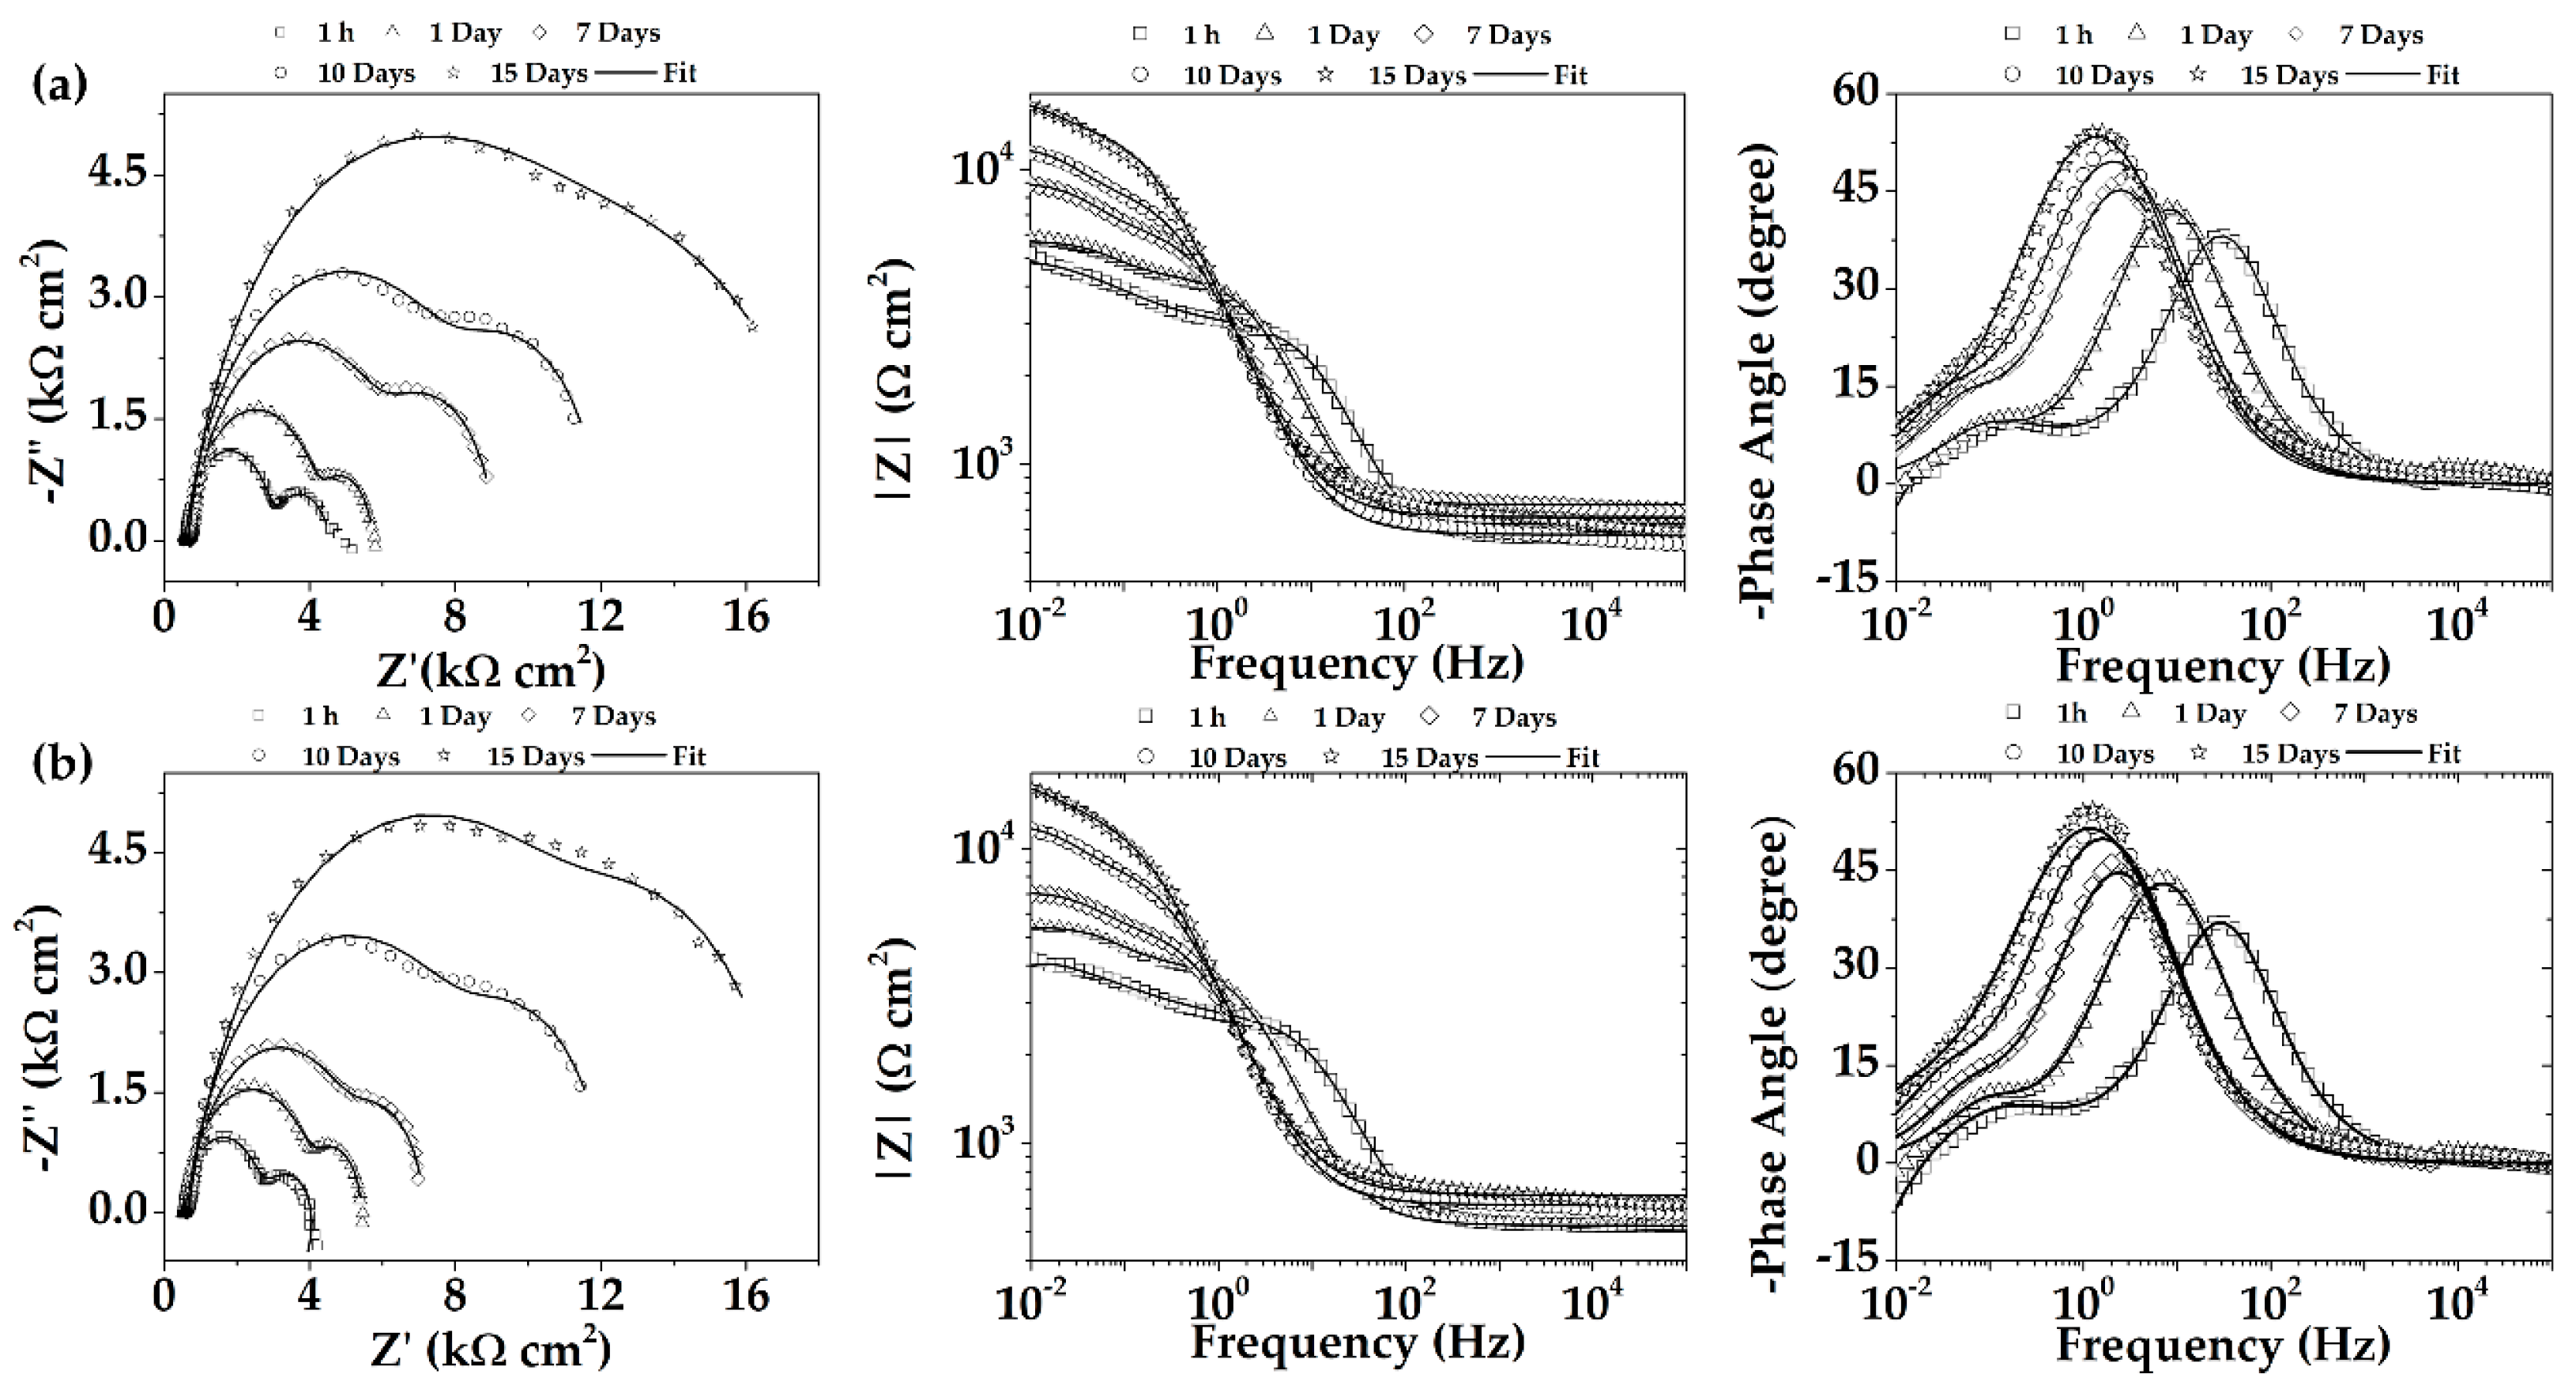
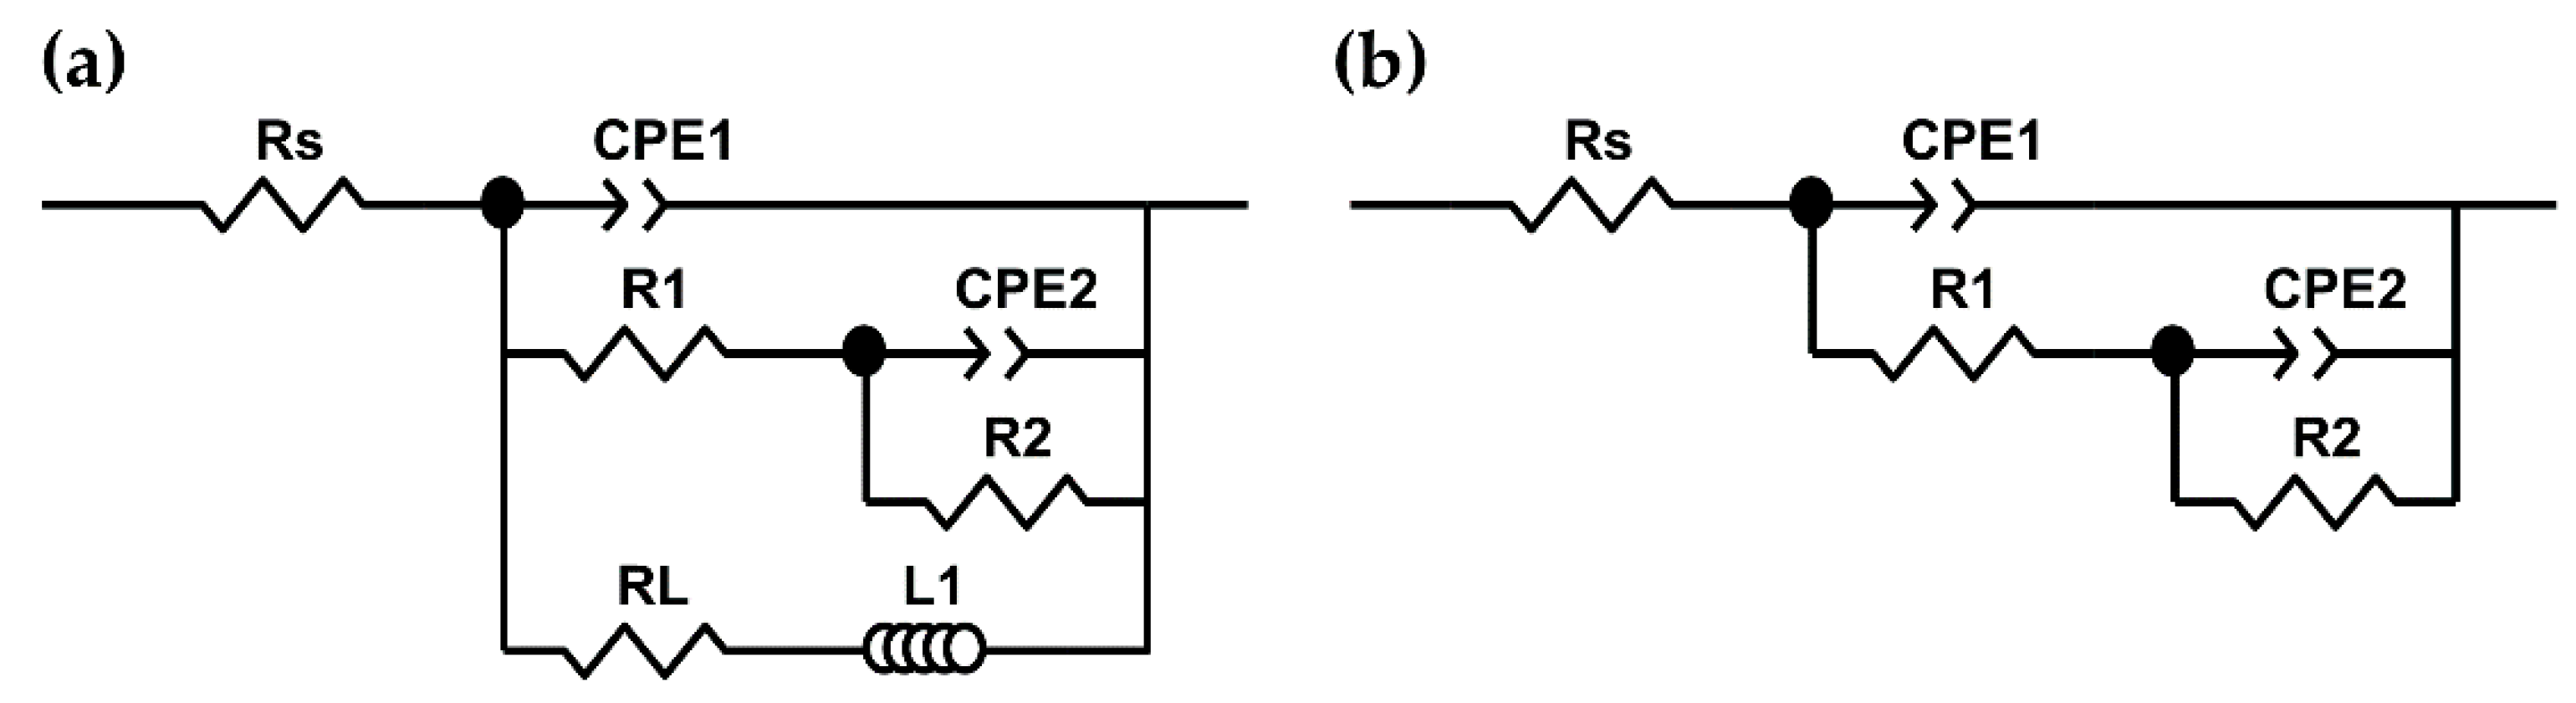
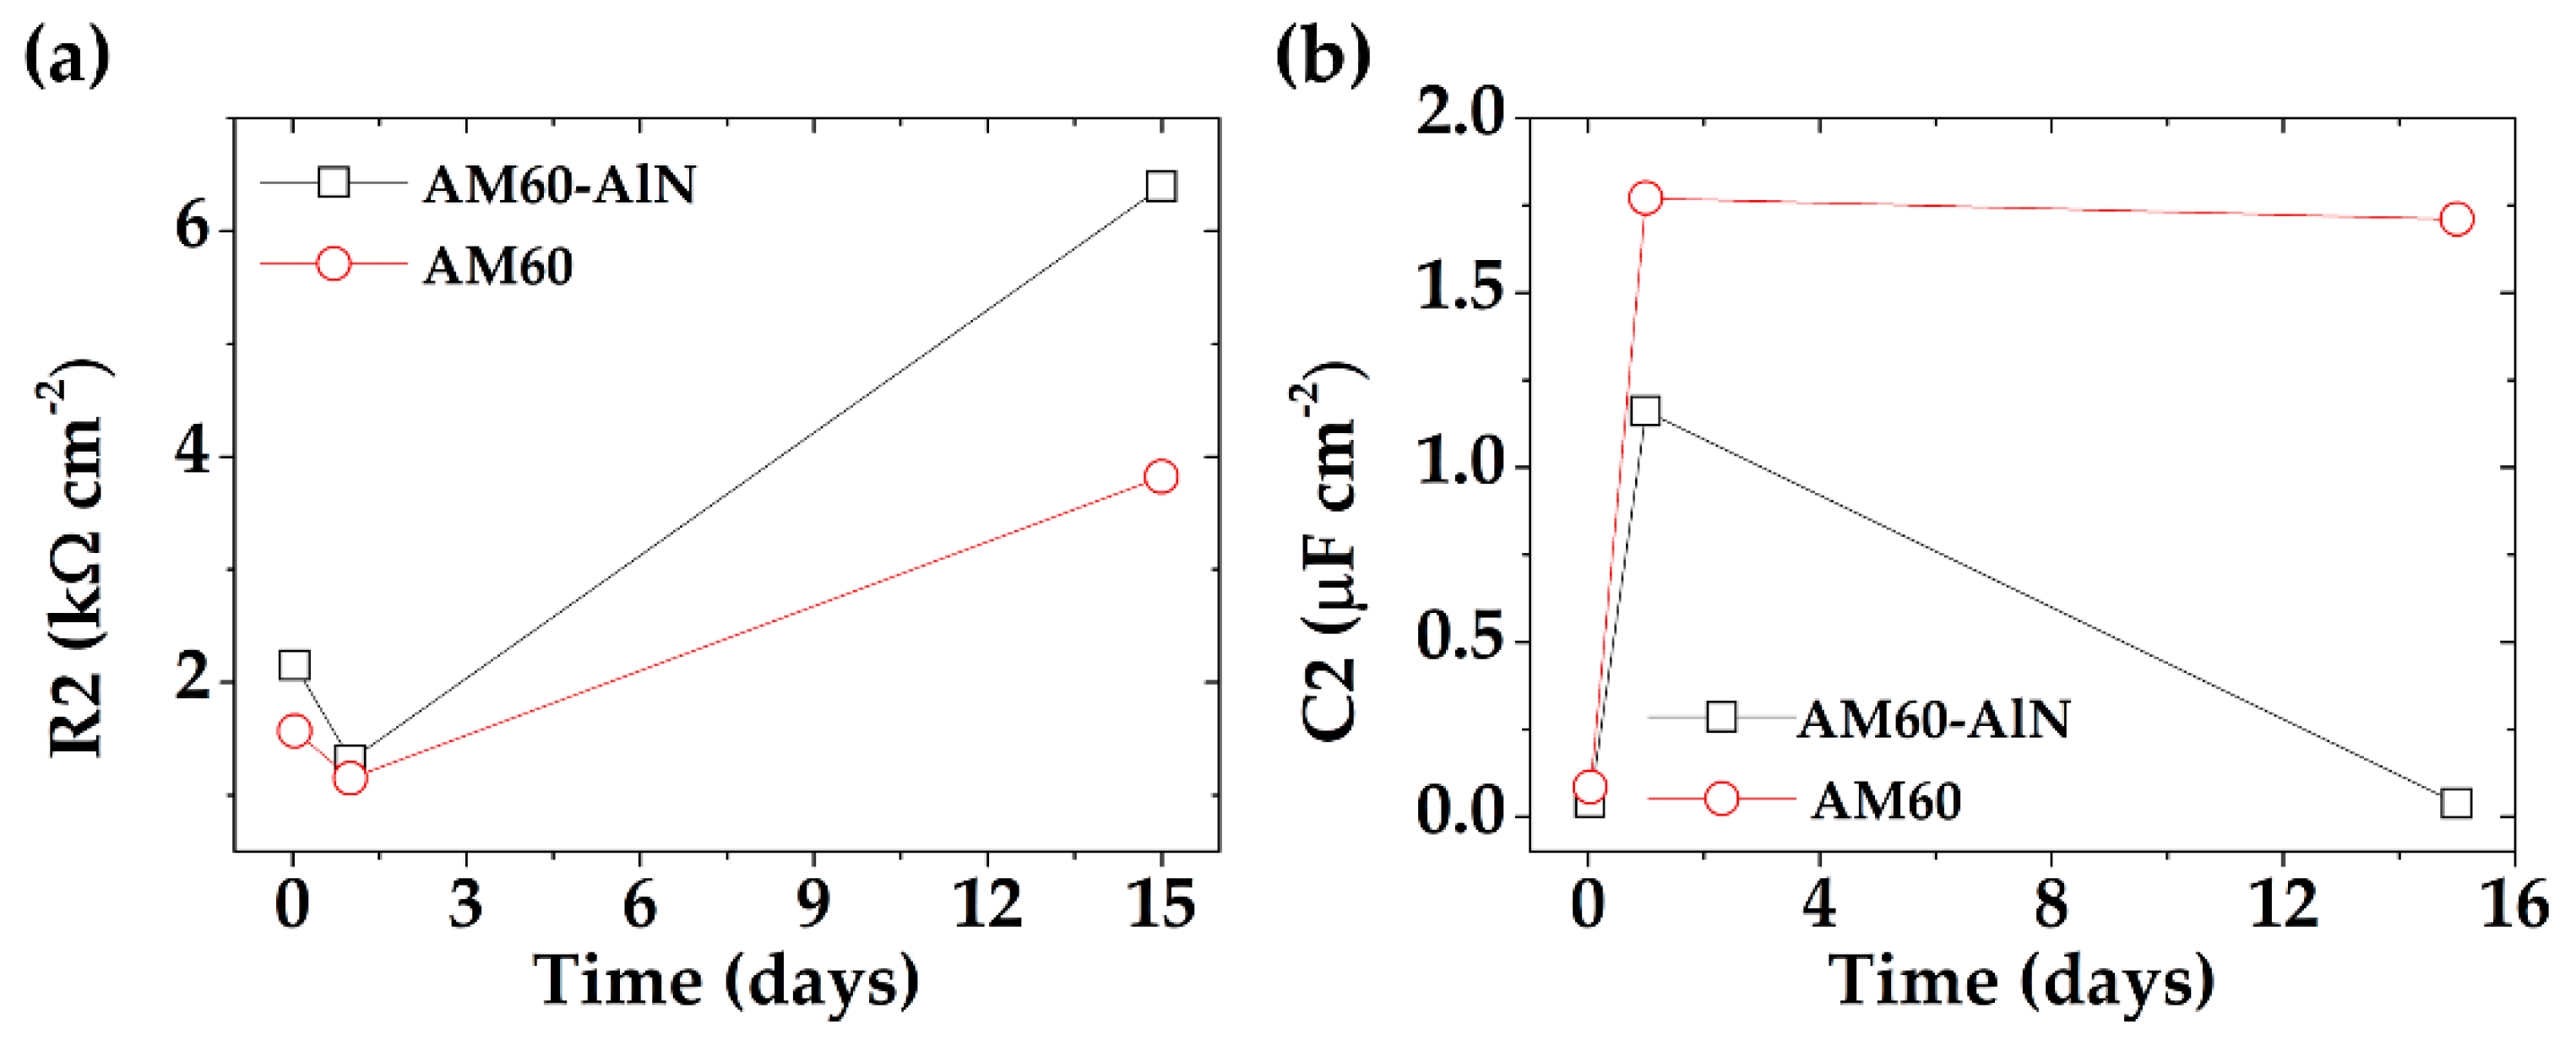
3.4.2. Electrochemical Impedance Spectroscopy (EIS)

Figure 11 shows the Nyquist and Bode plots for the AM60-AlN nanocomposite and AM60 alloy exposed to SAR solution for different periods of immersion. After the first hour of immersion, the impedance diagram displayed two capacitive loops at higher (HF) and medium frequencies (MF), followed by the beginning of an inductive loop at low frequencies (LF). The HF-capacitive loop diameter, as a measure of the charge transfer resistance (Rt) at the alloy interface, depends on the double-layer capacitance particularities, including the effect of the formed corrosion layers [86,95,96,97,98,99,100,101,102]. Its value is inversely related to the corrosion rate through the Stern–Geary equation [95,96,98]. The MF-capacitive loop was associated with mass transport processes connected to the diffusion of the released Mg2+ ion through the layer of the corrosion product [95,96,97,98,99], while the LF-inductive loop may result from the beginning of localized corrosion on the alloy surfaces and/or linked to adsorption/desorption of intermediates on the electrode surface. The inductive loop could disappear when the corrosion protective layer is formed on the surface [95,96,97,98,99]. The increase in immersion time led to a rise in the diameter of both HF and MF capacitive loops, suggesting the formation of corrosion layers on the surfaces, acting as a physical barrier over time against the SAR aggressive media. The Bode plots were found to be in good agreement with those observed in Nyquist diagrams.
The EIS experimental data were fitted with two equivalent circuits, which correspond to the initial immersion period of 1 h (Figure 12a) and the longer period up to 15 days (Figure 12b) [103]. The main components of the suggested circuits were: R1 (Rt) and CPE1 double layer “capacitance” at the substrate/electrolyte interface; R2 (Rct) and CPE2 “capacitance,” both characteristic of the charge transfer process in the presence of the corrosion layer, through which the released ions of Mg2+ diffuse. The constant phase element (CPE) was introduced instead of a capacitor, to account for the dispersion of the time-constant due to different factors such as heterogeneities and surface roughness [95,98]. In addition, the circuit (a) includes RL and L1 as inductive resistance and inductance, respectively, presenting the dependence of the corrosion process from the surface coverage by the corrosion layer and its characteristics (porosity, cavities, and cracks). The fitted values of the circuit elements (Table 6 and Table 7) were used to compare the corrosion behavior of the AM60-AlN nanocomposite to that of AM60 (the circuits have a fitting of 10−4).
The value of the polarization resistances (Rp) was calculated to compare the corrosion resistance of the studied materials exposed to SAR acid solution (Table 6 and Table 7), using the following equations derived from the equivalent circuits (Figure 12):
E q u i v a l e n t   c i r c u i t   ( a )   2   capacitive   loops   and   1   inductive :   1 R p = 1 R 1 + R 2 + 1 R L
E q u i v a l e n t   c i r c u i t   ( b )   2   capacitive   loops :   R P = R 1 + R 2  
The Rp values show that, with the development of the corrosion process, in the SAR aggressive environment, the AM60-AlN nanocomposite presented a Rp ≈ 7% higher than that of AM60, as an indication of the more efficient protective corrosion layer formed.
Figure 13a compares the evolution in time of charge transfer resistance (R2) values (Table 6 and Table 7) characteristic of the double layer in the presence of corrosion products. The higher R2 of the AM60-AlN nanocomposite suggests that the formed corrosion layer was probably denser, more protective, and less fractured than those of the AM60 alloy surface. The reported difference in R2 values (Figure 13a), based on EIS measurements, coincided with those obtained from EN measurements (Rn, Table 5).
Figure 13a compares the evolution in time of charge transfer resistance (R2), corresponding to the AM60-AlN nanocomposite and AM60 alloy. According to the Brug Equation (12), the values of CPE2 (Table 6 and Table 7) were transformed to the capacitance values (C2) of the double layer in the presence of corrosion products, using Rs, R2, and n2 values [104,105] (Figure 13b). The increase in time of AM60 alloy capacitance (Figure 13b) may be attributed to the formation of a thicker, although less protective, corrosion layer (lower R2 values).
C = C P E 1 n ( R s R c t R s + R c t ) 1 n n

4. Conclusions

This present study compared the initial stages of the corrosion process on a magnesium-aluminum AM60-AlN nanocomposite surface with those of AM60 immersed in model acid rain solution (SAR) for up to 30 days.
  • The incorporation of 1.0% wt.% AlN aluminum nitride nanoparticles (≈ 80 nm average diameter) in the AM60 matrix favored a grain size reduction of 12%, as revealed by the optical images, as well as a slight 7% increase in the Vickers hardness. The AlN particles were “attached” to the phase of Mn-rich Al-Mn intermetallic particles, forming a cluster, according to the SEM images.
  • The immersion test revealed that the increase in alkaline values of SAR solution was lower during the exposure of the AlN nanocomposite than that of the AM60 alloy. This fact correlates with the 24% lower concentration of the released Mg-ions from the AM60-AlN surface. However, the pH increase suggests that Al de-alloying may occur, as well as Al(OH)3 formation as a corrosion product, as suggested by XPS analysis.
  • The formed corrosion layers showed cracks at the end of the exposure and localized attacks near Al-Mn intermetallic particles, acting as efficient cathodic sites. The cross-sectional images revealed a higher intensity of attacks on the AM60 alloy surface without reinforcement.
  • The β exponents extracted from the PSD plots of the corrosion current fluctuations classified the corrosion of the studied materials as fractional Gaussian noise (fGn) of the stationary persistent localized process.
  • XPS analysis suggests that the main corrosion products were MgO and Mg(OH)2, as well as a lower content of Al(OH)3 that may delay the advance of the AM60-AlN corrosion process.
  • The EIS Nyquist plots and the parameters of the adjusted equivalent circuits indicated that the charge transfer resistance (R2) and capacitance values, characteristic of the double layer in the presence of corrosion products, were higher in the presence of AlN nanoparticles. This may favor the formation of a more dense and efficient protective corrosion layer because of a slight grain refinement. The tendency of the increase in R2 values for the AM60-AlN nanocomposite coincided with that of Rn values obtained from EN measurements.

Author Contributions

L.C. performed the preparation of samples and the corrosion tests. H.D. and D.G. contributed to the microstructural analysis of AM60 and AM60-AlN reference surfaces. S.F.J. contributed to EIS data analysis. L.C. and L.V. discussed the results and wrote the manuscript. All correspondence should be addressed to L.V. All authors have read and agreed to the published version of the manuscript.

Funding

This research received no external funding.

Institutional Review Board Statement

Not applicable.

Informed Consent Statement

Not applicable.

Data Availability Statement

Data presented in this study are available on request from the corresponding author. The data are not public, due to privacy issues.

Acknowledgments

Luis Chavez acknowledges the Mexican National Council for Science and Technology (CONACYT) for the scholarship granted to him for his Ph.D. study. The authors gratefully thank the National Laboratory of Nano- and Biomaterials (LANNBIO-CINVESTAV) for allowing the use of DRX, SEM-EDS and XPS facilities, and also to Daniel Aguilar, Victor Rejón Moo and Willian Cauich for their support in data acquisition.

Conflicts of Interest

The authors declare no conflict of interest.

References

  1. Avedesian, M.M.; Baker, H. Metallurgy and alloys. In ASM Speciality Handbook: Magnesium and Magnesium Alloys; Avedesian, M.M., Baker, H., Eds.; ASM International: Russel Towship, OH, USA, 1999; pp. 3–51. [Google Scholar]
  2. Kim, S.G.; Inoue, A.; Masumoto, T. Increase of mechanical strength of a Mg85Zn12Ce3 amorphous alloy by dispersion of ultrafine hcp-Mg particles. Mater. Trans. JIM 1991, 32, 875–878. [Google Scholar] [CrossRef] [Green Version]
  3. Polmear, I.; StJohn, D.; Nie, J.-F.; Qian, M. Magnesium alloys. In Light Alloys: Metallurgy of the Light Metals, 5th ed.; Butterworth-Heinemann: Oxford, UK, 2017; pp. 287–367. [Google Scholar]
  4. Kainer, K.U. The current state of technology and potential for futher development of magnesium applications. In Magnesium—Alloys and Technology; Kainer, K.U., Ed.; WILEY-VCH Verlag GmbH & Co. KGaA: Weinheim, Germany, 2003; pp. 1–22. [Google Scholar]
  5. Tokarska, K.B.; Gillett, N.P.; Weaver, A.J.; Arora, V.K.; Eby, M. The climate response to five trillion tonnes of carbon. Nat. Clim. Chang. 2016, 6, 851–856. [Google Scholar] [CrossRef]
  6. Cheah, L.; Evans, C.; Bandivadekar, A.; Heywood, J. Factor of two: Halving the fuel consumption of new US automobiles by 2035. In Reducing Climate Impacts in the Transportation Sector, 1st ed.; Daniel, S., James, S.C., Eds.; Springer: Berlin, Germany, 2008; pp. 49–71. [Google Scholar] [CrossRef] [Green Version]
  7. Li, H.; Li, X. The present situation and the development trend of new materials used in automobile lightweight. Appl. Mech. Mater. 2012, 189, 58–62. [Google Scholar] [CrossRef]
  8. Makar, G.L.; Kruger, J. Corrosion studies of rapidly solidified magnesium alloys. J. Electrochem. Soc. 1990, 137, 414–421. [Google Scholar] [CrossRef]
  9. Loose, W.S. Corrosion and protection of magnesium. In Metals Handbook; Pindgeon, L.M., Mathes, J.C., Woldmen, N.E., Eds.; ASM International: Russel Towship, OH, USA, 1946; pp. 173–260. [Google Scholar]
  10. Cheng, Y.-L.; Qin, T.-W.; Wang, H.-M.; Zhang, Z. Comparison of corrosion behaviors of AZ31, AZ91, AM60 and ZK60 magnesium alloys. Trans. Nonferrous Met. Soc. China 2019, 19, 517–524. [Google Scholar] [CrossRef]
  11. Makar, G.L.; Kruger, J. Corrosion of magnesium. Inter. Mater. Rev. 1993, 38, 138–153. [Google Scholar] [CrossRef]
  12. Song, G.L. Corrosion electrochemistry of magnesium (Mg) and its alloys. In Corrosion of Magnesium Alloys, 1st ed.; Song, G.L., Ed.; Woodhead Publishing: Cambridge, UK, 2011; pp. 3–65. [Google Scholar] [CrossRef]
  13. Song, G.L.; Atrens, A. Corrosion mechanisms of magnesium alloys. Adv. Eng. Mater. 1999, 1, 11–33. [Google Scholar] [CrossRef]
  14. Hu, T.T.; Xiang, B.; Liao, S.G.; Huang, W.Z. Corrosion of AM60B magnesium alloy in simulated acid rain. Anti Corros. Method. Mater. 2010, 57, 244–248. [Google Scholar] [CrossRef]
  15. LeBozec, N.; Jonsson, M.; Thierry, D. Atmospheric corrosion of magnesium alloys: Influence of temperature, relative humidity, and chloride deposition. Corrosion 2004, 60, 356–361. [Google Scholar] [CrossRef] [Green Version]
  16. Danaie, M.; Asmussen, R.M.; Jakupi, P.; Shoesmith, D.W.; Botton, G.A. The role of aluminum distribution on the local corrosion resistance of the microstructure in a sand-cast AM50 alloy. Corros. Sci. 2013, 77, 151–163. [Google Scholar] [CrossRef]
  17. Jönsson, M. Atmospheric Corrosion of Magnesium Alloys: Influence of Microstructure and Environment. Ph.D. Thesis, KTH, School of Chemical Science and Engineering, Stockholm, Sweden, 7 December 2007. [Google Scholar]
  18. Yang, L.-J.; Li, Y.-F.; Wei, Y.-H.; Hou, L.-F.; Li, Y.-G.; Tian, Y. Atmospheric corrosion of field-exposed AZ91D Mg alloys in a polluted environment. Corros. Sci. 2010, 52, 2188–2196. [Google Scholar] [CrossRef]
  19. Liu, F.; Song, Y.; Shan, D.; Han, E.-H. Corrosion Mechanism of AM50 Magnesium Alloy in Simulated Acid Rain. Recent Pat. Corros. Sci. 2013, 3, 47–57. [Google Scholar] [CrossRef]
  20. Cui, L.; Liu, Z.; Hu, P.; Shao, J.; Li, X.; Du, C.; Jiang, B. The corrosion behavior of AZ91D magnesium alloy in simulated haze aqueous solution. Materials 2018, 11, 970. [Google Scholar] [CrossRef] [Green Version]
  21. Dey, A.; Pandey, K.M. Magnesium Metal Matrix Composites—A Review. Rev. Adv. Mater. Sci. 2015, 42, 58–67. [Google Scholar]
  22. Dash, D.; Samanta, S.; Rai, R. Study on fabrication of magnesium based metal matrix composites and its improvement in mechanical and tribological properties—A Review. IOP Conf. Ser. Mater. Sci. Eng. 2018, 377, 012133–012140. [Google Scholar] [CrossRef]
  23. Chawla, K.K. Metal Matrix matrix composite. In Composite Materials: Science and Engeering, 3rd ed.; Chawla, K.K., Ed.; Springer: Birmingham, AL, USA, 2012; pp. 197–248. [Google Scholar] [CrossRef]
  24. Haghshenas, M. Metal-matrix composites. Ref. Mod. Mater. Sci. Mater. Eng. 2016, 03950–03953. [Google Scholar] [CrossRef]
  25. Nie, K.B.; Deng, K.X.; Wang, X.J.; Gan, W.M.; Xu, F.J.; Wu, K.; Zheng, M.Y. Microstructures and mechanical properties of SiCp/AZ91 magnesium matrix nanocomposites processed by multidirectional forging. J. Alloys Comp. 2015, 622, 1018–1026. [Google Scholar] [CrossRef]
  26. Jiang, Q.C.; Wang, H.Y.; Ma, B.X.; Wang, Y.; Zhao, F. Fabrication of B4C particulate reinforced magnesium matrix composite by powder metallurgy. J. Alloys Comp. 2005, 386, 177–181. [Google Scholar] [CrossRef]
  27. Moll, F.; Kainer, K.U. Particle-Reinforced Magnesium Alloys. In Magnesium—Alloys and Technology; Kainer, K.U., Ed.; WILEY-VCH Verlag GmbH & Co. KGaA: Weinheim, Germany, 2003; pp. 197–217. [Google Scholar] [CrossRef]
  28. Hassan, S.F.; Gupta, M. Development of high performance magnesium nano-composites using nano-Al2O3 as reinforcement. Mater. Sci. Eng. A 2005, 392, 163–168. [Google Scholar] [CrossRef]
  29. Goh, C.S.; Wei, J.; Lee, L.C.; Gupta, M. Properties and deformation behaviour of Mg-Y2O3 nanocomposites. Acta Mater. 2007, 55, 5115–5121. [Google Scholar] [CrossRef]
  30. Meenashisundaram, G.K.; Nai, M.H.; Almajid, A.; Gupta, M. Development of high performance Mg-TiO2 nanocomposites targeting for biomedical/structural applications. Mater Des. 2015, 65, 104–114. [Google Scholar] [CrossRef]
  31. Meenashisundaram, G.K.; Seetharaman, S.; Gupta, M. Enhancing overall tensile and compressive response of pure Mg using nano-TiB2 particulates. Mater. Character. 2014, 94, 178–188. [Google Scholar] [CrossRef]
  32. Paramsothy, M.; Chan, J.; Kwok, R.; Gupta, M. Nitride nanoparticle addition to beneficially reinforce hybrid magnesium alloys. Metall. Mater. Trans. A 2013, 44, 1123–1138. [Google Scholar] [CrossRef]
  33. Sankaranarayanan, S.; Habibi, M.K.; Jayalakshmi, S.; Jia Ai, K.; Almajida, A.; Gupta, M. Nano-AlN particle reinforced Mg composites: Microstructural and mechanical properties. Mater. Sci. Technol. 2015, 31, 1122–1131. [Google Scholar] [CrossRef]
  34. Meenashisundaram, G.K.; Nai, M.H.; Almajid, A.; Gupta, M. Reinforcing low-volume fraction nano-TiN particulates to monolithical, pure Mg for enhanced tensile and compressive response. Materials 2016, 9, 134. [Google Scholar] [CrossRef] [Green Version]
  35. Cao, G.; Choi, H.; Oportus, J.; Konishi, H. Li, X. Study on tensile properties and microstructure of cast AZ91D/AlN nanocomposites. Mater. Sci. Eng. A 2008, 494, 127–131. [Google Scholar] [CrossRef]
  36. Khrustalyov, A.P.; Garkushin, G.V.; Zhukov, I.A.; Razorenov, S.V.; Vorozhtsov, A.B. Quasi-static and plate impact loading of cast magnesium alloy ML5 reinforced with aluminum nitride nanoparticles. Metals 2019, 9, 715–726. [Google Scholar] [CrossRef] [Green Version]
  37. Yang, H.; Zander, D.; Jiang, B.; Huang, Y.; Gavras, S.; Kainer, K.U.; Dieringa, H. Effects of heat treatment on the microstructural evolution and creep resistance of Elektron21 alloy and its nanocomposite. Mater. Sci. Eng. A 2020, 789, 139669–139682. [Google Scholar] [CrossRef]
  38. Yang, H.; Zander, D.; Huang, Y.; Kainer, K.U.; Dieringa, H. Individual/synergistic effects of Al and AlN on the microstructural evolution and creep resistance of Elektron21 alloy. Mater. Sci. Eng. A 2020, 777, 139072–139086. [Google Scholar] [CrossRef]
  39. Yang, H.; Huang, Y.; Tolnai, D.; Kainer, K.U.; Dieringa, H. Influences of Al and high shearing dispersion technique on the microstructure and creep resistance of Mg-2.85-Nd-0.92-Gd-0.41-Zr-0.29Zn alloy. Mater. Sci. Eng. A 2019, 764, 138215–138225. [Google Scholar] [CrossRef]
  40. Yang, H.; Huang, Y.; Gavras, S.; Kainer, K.U.; Hort, N.; Dieringa, H. Influences of AlN/Al Nanoparticles on the Creep Properties of Elektron21 Prepared by High Shear Dispersion Technology. JOM 2019, 71, 2245–2252. [Google Scholar] [CrossRef]
  41. Yang, H.; Huang, Y.; Song, B.; Kainer, K.U.; Dieringa, H. Enhancing the creep resistance of AlN/Al nanoparticles reinforced Mg-2.85Nd-0.92Gd-0.41Zr-0.29Zn alloy by a high shear dispersion technique. Mater. Sci. Eng. A 2019, 755, 18–27. [Google Scholar] [CrossRef]
  42. Giannopoulou, D.; Dieringa, H.; Bohlen, J. Influence of AlN nanoparticle addition on microstructure and mechanical properties of extruded pure magnesium and an aluminum-free Mg-Zn-Y alloy. Metals 2019, 9, 667–679. [Google Scholar] [CrossRef] [Green Version]
  43. Dieringa, H. Properties of magnesium alloys reinforced with nanoparticles and carbon nanotubes: A review. J. Matr. Sci. 2011, 46, 289–306. [Google Scholar] [CrossRef]
  44. Wong, W.L.E.; Gupta, M. Enhancing thermal stability, modulus and ductility of magnesium using molybdenum as reinforcement. Adv. Eng. Mater. 2005, 7, 250–256. [Google Scholar] [CrossRef]
  45. Hassan, S.F.; Ho, K.F.; Gupta, M. Increasing elastic modulus, strength and CTE of AZ91 by reinforcing pure magnesium with elemental copper. Mater. Lett. 2004, 58, 2143–2146. [Google Scholar] [CrossRef]
  46. Hassan, S.F.; Gupta, M. Development of ductile magnesium composite materials using titanium as reinforcement. J. Alloys Compd. 2002, 345, 246–251. [Google Scholar] [CrossRef]
  47. Hassan, S.F.; Gupta, M. Development of a novel magnesium/nickel composite with improved mechanical properties. J. Alloys Compd. 2002, 335, L10–L15. [Google Scholar] [CrossRef]
  48. Casati, R.; Vedani, M. Metal matrix composites reinforced by nano-particles—A review. Metals 2014, 4, 65–83. [Google Scholar] [CrossRef]
  49. Malaki, M.; Xu, W.; Kasar, A.K.; Menezes, P.L.; Dieringa, H.; Varma, R.S.; Gupta, M. Advanced metal matrix nanocomposites. Metals 2019, 9, 330–368. [Google Scholar] [CrossRef] [Green Version]
  50. Nie, K.B.; Wang, X.J.; Deng, K.K.; Hu, X.S.; Wu, K. Magnesium matrix composite reinforced by nanoparticles—A review. J. Magnes. Alloys 2021, 15, 57–77. [Google Scholar] [CrossRef]
  51. Dieringa, H. Processing of magnesium-based metal matrix nanocomposites by ultrasound-assisted particle dispersion: A review. Metals 2018, 8, 431–447. [Google Scholar] [CrossRef] [Green Version]
  52. Kumar, N.; Soren, S. Selection of reinforcement for Al/Mg alloy metal matrix composites. Mater. Today Proc. 2020, 21, 1605–1609. [Google Scholar] [CrossRef]
  53. Kumari, S.S.; Pillai, U.; Pai, B. Synthesis and characterization of in situ Al–AlN composite by nitrogen gas bubbling method. J. Alloy. Comp. 2011, 509, 2503–2509. [Google Scholar] [CrossRef]
  54. Bruls, R.J.; Hintzen, H.T.; De With, G.; Metselaar, R. The temperature dependence of the Young’s modulus of MgSiN2, AlN and Si3N4. J. Eur. Ceram. Soc. 2001, 21, 263–268. [Google Scholar] [CrossRef]
  55. Toutanji, H.A.; Friel, D.; El-Korchi, T.; Katz, R.N.; Wechsler, G.; Rafaniello, W. Room temperature tensile and flexural strength of ceramics in AlN-SiC system. J. Eur. Ceram. Soc. 1995, 15, 425–434. [Google Scholar] [CrossRef]
  56. Chen, J.; Bao, C.-G.; Wang, Y.; Liu, J.-L.; Suryanarayana, C. Microstructure and lattice parameters of AlN particle-reinforced magnesium matrix composites fabricated by powder metallurgy. Acta Metall. Sin. 2015, 28, 1354–1363. [Google Scholar] [CrossRef] [Green Version]
  57. Bedolla, E.; Lemus-Ruiz, J.; Contreras, A. Synthesis and characterization of Mg-AZ91/AlN composites. Mater. Des. 2012, 38, 91–98. [Google Scholar] [CrossRef]
  58. Fu, H.M.; Zhang, M.-X.; Qiu, D.; Kelly, P.M.; Taylor, J.A. Grain refinement by AlN particles in Mg-Al based alloys. J. Alloys Comp. 2009, 478, 809–812. [Google Scholar] [CrossRef]
  59. Lee, Y.C.; Dahle, A.K.; StJohn, D.H. Grain refinement of magnesium. In Essential Readings in Magnesium Technology, 1st ed.; Mathaudhu., S.N., Luo, A.A., Neelameggham, N.R., Nyberg, E.A., Sillekens, W.H., Eds.; Springer: Berlin, Germany, 2016; pp. 247–254. [Google Scholar] [CrossRef]
  60. Dieringa, H.; Katsarou, L.; Buzolin, R.; Szakács, G.; Horstmann, M.; Wolff, M.; Mendis, C.; Vorozhtsov, S.; StJohn, D. Ultrasound assisted casting of an AM60 based metal matrix nanocomposite, its properties, and recyclability. Metals 2017, 7, 388. [Google Scholar] [CrossRef] [Green Version]
  61. Saboori, A.; Padovano, E.; Pavese, M.; Badini, C. Novel magnesium Elektron21-AlN nanocomposites produced by ultrasound-assisted casting; microstructure, thermal and electrical conductivity. Materials 2018, 11, 27. [Google Scholar] [CrossRef] [PubMed] [Green Version]
  62. Lerner, M.I.; Glazkova, E.A.; Lozhkomoev, A.S.; Svarovskaya, N.V.; Bakina, O.V.; Pervikov, A.V.; Psakhie, S.G. Synthesis of Al nanoparticles and Al/AlN composite nanoparticles by electrical explosion of aluminum wires in argon and nitrogen. Powder Technol. 2016, 295, 307–314. [Google Scholar] [CrossRef]
  63. Lerner, M.; Vorozhtsov, A.; Guseinov, S.; Storozhenko, P. Metal nanopowders production. In Metal Nanopowders: Production, Characterization, and Energetic Applications, 1st ed.; Gromov, A.A., Teipel, U., Eds.; Wiley-VCH: Hoboken, NJ, USA, 2014; pp. 79–106. [Google Scholar]
  64. Feng, L.; Song, Y.-W.; Shan, D.-Y.; Han, E.-H. Corrosion behavior of AZ31 magnesium alloy in simulated acid rain solution. Tran. Nonferrous Metals Soc. China 2010, 20, s638–s642. [Google Scholar] [CrossRef]
  65. ASTM-NACE/ASTM G31-12a. Standard Guide for Laboratory Immersion Corrosion Testing of Metals; ASTM International: West Conshohocken, PA, USA, 2021. [Google Scholar] [CrossRef]
  66. ASTM G1-03. Standard Practice for Preparing, Cleaning and Evaluating Corrosion Test Specimens; ASTM International: West Conshohocken, PA, USA, 2017. [Google Scholar] [CrossRef]
  67. ASTM G199-09. Standard Guide for Electrochemical Noise Measurement; ASTM International: West Conshohocken, PA, USA, 2020. [Google Scholar] [CrossRef]
  68. Dawson, J.L. Electrochemical noise measurement: The definitive in-situ technique for corrosion applications. In Electrochemical Noise Measurement for Corrosion Applications; Kearns, J., Scully, J., Roberge, P., Reichert, D., Dawson, J.L., Eds.; ASTM STP 1277; ASTM International: West Conshohocken, PA, USA, 1996; pp. 3–35. [Google Scholar] [CrossRef]
  69. Xia, D.-H.; Song, S.-Z.; Behnamian, Y. Detection of corrosion degradation using electrochemical noise (EN): Review of signal processing methods for identifying corrosion forms. Corros. Eng. Sci. Techn. 2016, 51, 527–544. [Google Scholar] [CrossRef]
  70. Somekawa, H.; Mukai, T. Effect of grain refinement on fracture toughness in extruded pure magnesium. Scr. Mater. 2005, 53, 1059–1064. [Google Scholar] [CrossRef]
  71. Kang, S.H.; Lee, Y.S.; Lee, J.H. Effect of grain refinement of magnesium alloy AZ31 by severe plastic deformation on material characteristics. J. Mater. Process. Techn. 2008, 201, 436–440. [Google Scholar] [CrossRef]
  72. Mukai, T.; Yamanoi, M.; Watanabe, H.; Ishikawa, K.; Higashi, K. Effect of grain refinement on tensile ductility in ZK60 magnesium alloy under dynamic loading. Mater. Trans. 2001, 42, 1177–1181. [Google Scholar] [CrossRef] [Green Version]
  73. Cao, P.; Qian, M.; StJohn, D.H. Effect of iron on grain refinement of high-purity Mg-Al alloys. Scr. Mater. 2004, 51, 125–129. [Google Scholar] [CrossRef]
  74. ASM International. Binary alloy diagrams. In ASM Handbook. Alloy Phase Diagrams, 10th ed.; ASM International: Materials Park, OH, USA, 1992; Volume 3, p. 48. [Google Scholar]
  75. Bowen, P.; Highfield, J.G.; Mocellin, A.; Ring, T.A. Degradation of aluminum nitride powder in an aqueous environment. J. Am. Ceram. Soc. 1990, 73, 724–728. [Google Scholar] [CrossRef]
  76. Haynes, W.M. Properties of the elements and inorganic compounds. In CRC Handbook of Chemistry and Physics, 97th ed.; Haynes, W.M., Ed.; CRC Press Technology: Boca Raton, FL, USA, 2017; pp. 4–71. [Google Scholar]
  77. Svedberg, L.M.; Arndt, K.C.; Cima, M.J. Corrosion of aluminum nitride (AlN) in aqueous cleaning solutions. J. Am. Ceram. Soc. 2000, 83, 41–46. [Google Scholar] [CrossRef]
  78. Krnel, K.; Kosmač, T. Reactivity of aluminum nitride powder in dilute inorganic acids. J. Am. Ceram. Soc. 2000, 83, 1375–1378. [Google Scholar] [CrossRef]
  79. Lunder, O.; Nordien, J.H.; Nisancioglu, K. Corrosion resistance of cast Mg-Al alloys. Corross Rev. 1997, 15, 439–470. [Google Scholar] [CrossRef]
  80. Davoodi, A.; Pan, J.; Leygraf, C.; Norgren, S. The role of intermetallic particles in localized corrosion of aluminium alloy studied by SKPFM and integrated AFM/SECM. J. Electrochem. Soc. 2008, 155, C211–C218. [Google Scholar] [CrossRef] [Green Version]
  81. Pawar, S.; Zhou, X.; Thompson, G.E.; Scamans, G.; Fan, Z. The role of intermetallics on corrosion initiation of twin roll cast AZ31 Mg Alloy. J. Electrochem. Soc. 2015, 162, C442–C448. [Google Scholar] [CrossRef]
  82. Asmussen, R.M.; Binns, W.J.; Parfov-Nia, R.; Jakupi, P.; Shoesmith, D.W. The stability of aluminium-manganese intermetallic phases under the microgalvanic coupling conditions. Mater. Corros. 2016, 67, 39–50. [Google Scholar] [CrossRef]
  83. Santamaria, M.; Di Quarto, F.; Zanna, S.; Marcus, P. Initial surface film on magnesium metal: A characterization by X-ray photoelectron spectroscopy (XPS) and photocurrent spectroscopy (PCS). Electrochim. Acta 2007, 53, 1314–1324. [Google Scholar] [CrossRef] [Green Version]
  84. Fournier, V.; Marcus, P.; Olefjord, I. Oxidation of magnesium. Surf. Inter. Anal. 2002, 34, 494–497. [Google Scholar] [CrossRef]
  85. Moulder, J.F.; Stickle, W.F.; Sobol, P.E.; Bomben, K.D. Handbook of X-Ray Photoelectron Spectroscopy; Physical Electronics Inc.: Chanhassen, MN, USA, 1992. [Google Scholar]
  86. Liao, J.; Hotta, M. Corrosion products of field-exposed Mg-Al series magnesium alloys. Corros. Sci. 2016, 112, 276–288. [Google Scholar] [CrossRef]
  87. Cottis, R.A. Interpretation of electrochemical noise data. Corrosion 2001, 57, 265–285. [Google Scholar] [CrossRef]
  88. Bertocci, U.; Gabrielli, C.; Huet, F.; Keddam, M. Noise resistance applied to corrosion measurements I. theoretical analysis. J. Electrochem. Soc. 1997, 144, 31–37. [Google Scholar] [CrossRef]
  89. Bertocci, U.; Gabrielli, C.; Huet, F.; Keddam, M.; Rousseau, P. Noise resistance applied to corrosion measurements ii. experimental tests. J. Electrochem. Soc. 1997, 144, 37–43. [Google Scholar] [CrossRef]
  90. Sanchez-Amaya, J.M.; Cottis, R.A.; Botana, F.J. Shot noise and statistical parameters for the estimation of corrosion mechanisms. Corros Sci. 2005, 47, 3280–3299. [Google Scholar] [CrossRef]
  91. Acosta, G.; Mena-Morcillo, E.; Veleva, L. Electrochemical assesment of the Mg-Zn-Ca alloy degradation in Hanks’ physiological solution. Rev. Metal. 2020, 56, e181. [Google Scholar] [CrossRef]
  92. Eke, A.; Herman, P.; Bassingthwaighte, J.; Raymond, G.; Percival, D.; Cannon, M.; Balla, I.; Ikrényi, C. Physiological time series: Distinguishing fractal noises from motions. Pflügers Archiv. 2000, 439, 403–415. [Google Scholar] [CrossRef] [PubMed]
  93. Delignieres, D.; Ramdani, S.; Lemoine, L.; Torre, K.; Fortes, M.; Ninot, G. Fractal analyses for ‘short’ time series: A re-assessment of classical methods. J. Math. Psychol. 2006, 50, 525–544. [Google Scholar] [CrossRef]
  94. Malamud, B.D.; Turcotte, D.L. Self-affine time series: Measures of weak and strong persistence. J. Stat. Plan. Inference 1999, 80, 173–196. [Google Scholar] [CrossRef]
  95. Dinodi, N.; Shetty, A.N. Alkyl carboxylates as efficient and green inhibitors of magnesium alloy ZE41 corrosion in aqueous salt solution. Corros. Sci. 2014, 85, 411–427. [Google Scholar] [CrossRef]
  96. Coy, A.E.; Viejo, F.; Garcia-Garcia, F.J.; Liu, Z.; Skeldon, P.; Thompson, G.E. Effect of excimer laser surface melting on the microstructure and corrosion performance of the die cast AZ91D magnesium alloy. Corros. Sci. 2010, 52, 387–397. [Google Scholar] [CrossRef]
  97. Galicia, G.; Pébère, N.; Tribollet, B.; Vivier, V. Local and global electrochemical impedances applied to the corrosion behaviour of an AZ91 magnesium alloy. Corros. Sci. 2009, 51, 1789–1794. [Google Scholar] [CrossRef] [Green Version]
  98. Ardelean, H.; Frateur, I.; Zanna, S.; Atrens, A.; Marcus, P. Corrosion protection of AZ91 magnesium alloy by anodizing in niobium and zirconium-containing electrolytes. Corros. Sci. 2009, 51, 3030–3038. [Google Scholar] [CrossRef]
  99. Baril, G.; Pebere, N. The corrosion of pure magnesium in aerated and deaerated sodium sulphate solutions. Corros. Sci. 2001, 43, 471–484. [Google Scholar] [CrossRef]
  100. Baril, G.; Blanc, C.; Pébère, N. AC impedance spectroscopy in characterizing time-dependent corrosion of AZ91 and AM50 magnesium alloys characterization with respect to their microstructures. J. Electrochem. Soc. 2001, 148, B489–B496. [Google Scholar] [CrossRef]
  101. Baril, G.; Galicia, G.; Deslouis, C.; Pébère, N.; Tribollet, B.; Vivier, V. An impedance investigation of the mechanism of pure magnesium corrosion in sodium sulfate solutions. J. Electrochem. Soc. 2006, 154, C108–C113. [Google Scholar] [CrossRef] [Green Version]
  102. Ascencio, M.; Pekguleryuz, M.; Omanovic, S. An investigation of the corrosion mechanisms of WE43 Mg alloy in a modified simulated body fluid solution: The influence of immersion time. Corros. Sci. 2014, 87, 489–503. [Google Scholar] [CrossRef]
  103. Feliu, S., Jr. Electrochemical impedance spectroscopy for the measurement of the corrosion rate of magnesium alloys: Brief review and challenges. Metals 2020, 10, 775. [Google Scholar] [CrossRef]
  104. Souza, J.S.D.; Oliveira, L.A.D.; Sayeg, I.J.; Antunes, R.A. Electrochemical study of the AISI 409 ferritic stainless steel: Passive film stability and pitting nucleation and growth. Mater. Res. 2017, 20, 1669–1680. [Google Scholar] [CrossRef] [Green Version]
  105. Bacelis, Á.; Veleva, L.; Feliu, S.; Cabrini, M.; Lorenzi, S. Corrosion Activity of Carbon Steel B450C and Low Chromium Ferritic Stainless Steel 430 in Cement Extract Solution. Buildings 2021, 11, 220. [Google Scholar] [CrossRef]
Figure 1. Optical images of microstructure: (a) AM60-AlN (1 wt.%) longitudinal section (extrusion direction →), (b) AM60-AlN (1 wt.%) cross-section, (c) AM60 longitudinal section (extrusion direction →), (d) AM60 cross-section.
Metals 11 00990 g001
Figure 2. XDR patterns of: (a) AM60-AlN and (b) AM60.
Metals 11 00990 g002
Figure 3. SEM images (×2000) of (a) AM60-AlN nanocomposite and (b) AM60 alloy reference samples.
Metals 11 00990 g003
Figure 4. Change in time of (a) pH and (b) concentration of released Mg2+ ions after exposure of AM60-AlN nanocomposite and AM60 alloy samples to SAR solution for up to 30 days.
Metals 11 00990 g004
Figure 5. (a) Mass loss values and (b) annual corrosion rates of AM60-AlN and AM60 after exposure in SAR solution.
Metals 11 00990 g005
Figure 6. SEM images (×1000) of surface morphology for AM60-AlN nanocomposite and AM60 alloy: (a,b) after 30 days of exposure to SAR; (c,d) removal of corrosion layers; (e,f) cross-sections. (The SEM images of (a,c,e) were performed by the Philips microscope, while those of (b,d,f) were performed by the JEOL microscope.)
Metals 11 00990 g006
Figure 7. XPS spectra of the corrosion products formed on (a) AM60-AlN nanocomposite and (b) AM60 surfaces after exposure to SAR solution for 30 days.
Metals 11 00990 g007
Figure 8. Corrosion current density fluctuations (at OCP) of (a) AM60-AlN nanocomposite and (b) AM60 alloy, exposed to SAR solution for 30 days.
Metals 11 00990 g008
Figure 9. Change in time of jcorr and MR of AM60-AlN nanocomposite and AM60 alloy, exposed to SAR solution for up to 30 days.
Metals 11 00990 g009
Figure 10. PSD plot of corrosion current noise (Figure 8) vs. frequency and corresponding β values for (a) AM60-AlN and (b) AM60 exposed to SAR solution up for 30 days.
Metals 11 00990 g010
Figure 11. Nyquist and Bode plots of EIS for (a) AM60-AIN nanocomposite and (b) AM60 alloy after different immersion times in SAR model solution.
Metals 11 00990 g011
Figure 12. Equivalent circuits used for fitting experimental EIS spectra of AM60-AIN nanocomposite and AM60 alloy after immersion in SAR solution for (a) 1 h and (b) from 1 to 15 days.
Metals 11 00990 g012
Figure 13. Evolution in time of (a) R2 and (b) C2 values of AM60-AlN nanocomposite and AM60 (red color) during the exposure to acid rain environment (SAR) up to 15 days.
Metals 11 00990 g013
Table 1. Vickers hardness and grain size of AM60-AlN nanocomposite and AM60 alloy.
MaterialAM60-AlNAM60
Vickers hardness (HVs-longitudinal section)71.0 ± 1.566.1 ± 3.9
Vickers hardness (HVs-cross section)64.0 ± 1.868.0 ± 3.6
Grain size-longitudinal section (µm)2.9 ± 0.13.3 ± 1.1
Grain size-cross-section (µm)2.9 ± 0.43.3 ± 0.2
Table 2. EDS elemental analysis (wt. %) of AM60-AlN nanocomposite and AM60 reference samples.
ZoneCNOMgAlMn
1--3.690.16.3-
24.6-5.37.632.450.1
3-2.55.438.526.926.7
4 -1.264.432.9-
Table 3. EDS elemental analysis (wt.%) of different surface zones on AM60-AlN nanocomposite and AM60 alloy (labeled in Figure 6), after exposure to SAR solution up to 30 days.
ZoneCOMgAlSiMn
16.135.918.613.3-26.1
24.633.056.35.80.2-
36.363.225.84.7--
Table 4. Change in time of values of AM60-AlN nanocomposite and AM60 alloy surfaces exposed to SAR (acid rain) solution for up to 30 days.
OCP (V vs. SCE)
Time (Days)Initial17101530
AM60-AlN−1.59 ± 0.07−1.55 ± 0.04−1.49 ± 0.02−1.50 ± 0.03−1.50 ± 0.02−1.49 ± 0.01
AM60−1.59 ± 0.09−1.56 ± 0.02−1.52 ± 0.02−1.52 ± 0.01−1.52 ± 0.01−1.53 ± 0.01
Table 5. Change in time of electrochemical resistance (Rn) values of AM60-AlN nanocomposite and AM60 alloy exposed to SAR solution up to 30 days.
Rn (kΩ cm−2)
Time (Days)Initial17101530
AM60-AlN1.812.232.583.702.400.80
AM602.741.021.410.900.950.37
Table 6. Fitting parameters estimated from EIS data of AM60-AlN nanocomposite immersed in SAR for up to 15 days.
Circuit Elements1 h24 h15 Days
Rs (kΩ)0.56 ± 0.010.62 ± 0.010.66 ± 0.01
CPE1 (µsn/Ω cm2)7.95 ± 0.6620.20 ± 0.1249.5 ± 3.53
n10.91 ± 0.020.90 ± 0.010.87 ± 0.01
R1 (kΩ cm2)2.44 ± 0.083.78 ± 0.0911.34 ± 0.38
CPE2 (msn/Ω cm2)0.89 ± 0.111.58 ± 0.280.58± 0.10
n20.67 ± 0.100.95 ± 0.090.72 ± 0.01
R2 (kΩ cm2)2.15 ± 0.411.31 ± 0.166.39 ± 0.27
L1 (kH cm2)408.0 ± 1.5--
RL (kΩ cm2)0.17 ± 0.01--
Rp (kΩ cm2)0.165.0917.73
Table 7. Fitting parameters estimated from EIS data of AM60 alloy immersed in SAR for up to 15 days.
Circuit Elements1 h24 h15 Days
Rs (kΩ)0.53 ± 0.010.53 ± 0.010.67 ± 0.01
CPE1 (µsn/Ω cm2)9.24 ± 0.6127.5 ± 1.1763.87 ± 1.31
n10.91 ± 0.010.89 ± 0.010.84 ± 0.01
R1 (kΩ cm2)2.10 ± 0.033.75 ± 0.0812.71 ± 0.28
CPE2 (msn/Ω cm2)0.98 ± 0.191.77 ± 0.391.71 ± 0.61
n20.71 ± 0.071.00 ± 0.101.00 ± 0.14
R2 (kΩ cm2)1.57 ± 0.071.15 ± 0.143.82 ± 0.73
L1 (kH cm2)266 ± 6.2--
RL (kΩ cm2)0.42 ± 0.06--
Rp (kΩ cm2)0.374.9016.53
Publisher’s Note: MDPI stays neutral with regard to jurisdictional claims in published maps and institutional affiliations.

