Article

A Thermo-Mechanical Analysis of Laser Hot Wire Additive Manufacturing of NAB

1
Department of Mechanical Engineering, Pennsylvania State University, University Park, PA 16802, USA
2
Applied Research Laboratory, Pennsylvania State University, University Park, PA 16802, USA
3
Naval Surface Warfare Center, Carderock Division, West Bethesda, MD 12116, USA
*
Author to whom correspondence should be addressed.
Metals 2021, 11(7), 1023; https://doi.org/10.3390/met11071023
Submission received: 27 May 2021 / Revised: 15 June 2021 / Accepted: 21 June 2021 / Published: 25 June 2021
(This article belongs to the Special Issue Advances in Modeling and Analysis of Additive Manufactured Materials)

Abstract

:
There is increased interest in using nickel aluminum bronze (NAB) alloys in large-scale directed energy deposition additive manufacturing (DEDAM) processes for maritime applications, but one challenge lies in the component distortion that results from residual stress generated during fabrication. This paper describes the development and evaluation of thermo-mechanical simulations for laser hot wire (LHW) DEDAM of NAB to predict part distortion. To account for the dearth of temperature-dependent properties for NAB C95800 in open literature and public databases, temperature-dependent material and mechanical properties for NAB C95800 were experimentally measured using test specimens fabricated with a variety of DEDAM processes. Autodesk’s Netfabb Local Simulation software, a commercial finite-element based AM solver, was employed but with its heat source model modified to accommodate LHW DEDAM’s oscillating laser path and additional energy input supplied by the preheated wire feedstock. Thermo-mechanical simulations were conducted using both the acquired temperature-dependent material and mechanical properties and the constant room-temperature properties to assess the impact on simulation accuracy. The usage of constant properties in the thermo-mechanical analysis resulted in significantly different predicted distortion compared to those using the temperature-dependent properties, at times even predicting substrate displacement in an opposite direction.

1. Introduction

Nickel aluminum bronze (NAB) alloys are used in a variety of maritime applications [1] due to their combination of strength, toughness, and corrosion resistance. The alloy is commonly sprayed or weld-deposited as a surfacing material (e.g., applied to a steel substrate to prevent wear), or to improve corrosion or sparking resistance [2]. In particular, NAB is used for large-scale, small-production-quantity castings such as propellers [3].
Unfortunately, it is challenging to cast NAB consistently in complex geometries or in thin sections, and the porosity and coarse microstructure often present in components made with traditional casting processes can lead to a degradation in the mechanical properties of the finished component. There is growing interest in fabricating NAB components using additive manufacturing (AM)-based technologies [4,5,6,7,8,9]. Tang et al. studied the application of laser surface alloying NAB using aluminum powder [4]. They found that the process could increase in corrosion and erosion resistance. Murray et al. explored selective laser melting (SLM) of NAB powder [5]. The components obtained from the SLM process were found to exhibit properties at least as good as their cast or wrought counterparts. Heat treatment on wire arc additive manufacturing (WAAM) NAB components was found to increase yield strength and elongation considerably [6]. Dharmendra et al. studied the morphology and crystallography of NAB alloy bars produced with WAAM [7]. They also investigated enhancing the mechanical properties of the WAAM NAB bars using several heat treatment cycles [8]. Gustmann et al. was able to increase the relative density of NAB specimens by re-melting already processed layers during an SLM process [9].
There are many different methods that can be used to process NAB material. Although laser powder bed fusion (L-PBF) AM is attractive for its net shape processing, current technology does not have the capability to produce large components that are of interest to shipbuilding and other large-scale industries. As such, large-format directed energy deposition additive manufacturing (DEDAM) techniques, such as WAAM, electron beam additive manufacturing (EBAM), and laser-powder/laser-wire DEDAM have started to receive more attention [10,11,12,13,14,15,16]. The heat source and feedstock associated with each of these processes offer their own merits and disadvantages. For example, although laser absorption in powder is significantly higher than wire, the specifications of wire feedstock are well established for the welding industry, and wire feedstock is readily available and generally less expensive than powder. Additionally, proper handling of powder is more challenging than wire, since the high surface area of powder is more prone to contamination. The use of an electric arc heat source has been well established for many decades in the welding industry; therefore, equipment cost is relatively low compared to laser or electron beam. However, laser and electron beam both offer much higher power and a more highly controllable heat source compared to electric arc, and thus are more capable of controlling deposition quality. Finally, lasers have the ability to operate in ambient pressure environments, unlike electron beam processes that must operate in a vacuum. Liu and Ding found that laser hot wire (LHW), which couples the laser with a specialized power supply used to preheat the wire through Joule resistance heating, increased the deposition rate four to six times faster than the cold wire counterpart [10]. For these reasons, this work focuses on the LHW DEDAM processing.
Several research groups have conducted studies to improve LHW cladding or DEDAM processes, with focus ranging from improving process development to optimizing path planning. Ding et al. found that for a LHW AM process, an increase in laser power resulted in decreased bead height and increased bead width. An increase in wire feed speed was found to have the opposite effects on bead geometry [11]. They also found that adding a lead-in and lead-out distance for depositing as well as pulling the laser head away at a higher speed from the end of the bead increased build quality [12]. For an LHW cladding process, Liu et al. found that the applied voltage significantly affected wire stability, with arcing becoming more prevalent at higher voltage [13]. When arcing occurred, large amounts of spatter were generated, which reduced the process stability and the controllability of the resulting bead geometry. Similarly, Zhang et al. found that the build quality was mainly determined by the preheated temperature of the hot wire, which was directly controlled by the applied voltage [14]. Han et al. developed a rule-based process control method to maintain bead geometry width as planned and to prevent the accumulation of height deviations on individual layers for arc-based DEDAM [15]. Energy efficiency analysis for LHW DEDAM of Nickel 625 and Ti-6Al-4V was performed by Pangsrivinij et al. [16], which showed that LHW is more energy efficient and provides higher build rates than direct metal laser sintering.
One challenge associated with LHW DEDAM lies in the excessive component distortion during fabrication. High fidelity thermo-mechanical simulations are needed to predict the residual stress and distortion during the AM process to enable compensation or mitigation strategies to be employed. A thermal simulation examining the temperature field of a 304 L stainless steel deposition using the LHW process was conducted by Shiqing et al. [17]. In their work, a transient heat conduction model, comprised of resistance heating of the wire, laser reflection off the wire and substrate, and heat conduction of the melt-pool was developed and used to examine wire transfer stability under various process conditions. Furthermore, a differential conduction equation was used to simulate the melt pool stability with different boundary conditions. Their study found that preheating the wire improves process stability and that the wire temperature field is the key factor for wire transfer stability. In a later study, the same group of authors used similar models to investigate, classify, and control wire transfer behaviors and to study their impact on weld formation quality in the LHW cladding and welding [18]. Liu et al. conducted a thermo-mechanical simulation and experimental study of LHW processing of A36 Steel plates and ER70S-6 steel wire [19], where finite-element analysis (FEA) was applied to study thermal stress evolution under laser welding and hybrid laser-arc welding. Nie et al. conducted a thermo-mechanical simulation on the LHW deposition of H13 steel [20], where the temperature field, stress–strain field, and the resulting distortion for depositing a block part of H13 steel on an H13 substrate were computed using the FEA software ABAQUS. Predictions of temperature evolution at a few selected locations were validated using in situ thermocouple measurements, and distortion of the side edge of the block part was measured to compare with the FEA prediction. However, none of the existing studies has explored simulating LHW processes for NAB.
This paper focuses on the thermo-mechanical modeling and simulation of LHW DEDAM of NAB to predict part distortion. The contributions of this paper include: (1) experimentally measuring temperature-dependent material properties of NAB alloys; (2) developing and assessing heat-source model simplification to account for hot wire and oscillating laser beam; and (3) conducting thermo-mechanical analysis and evaluating the effect of using temperature-dependent versus constant material properties on distortion prediction.

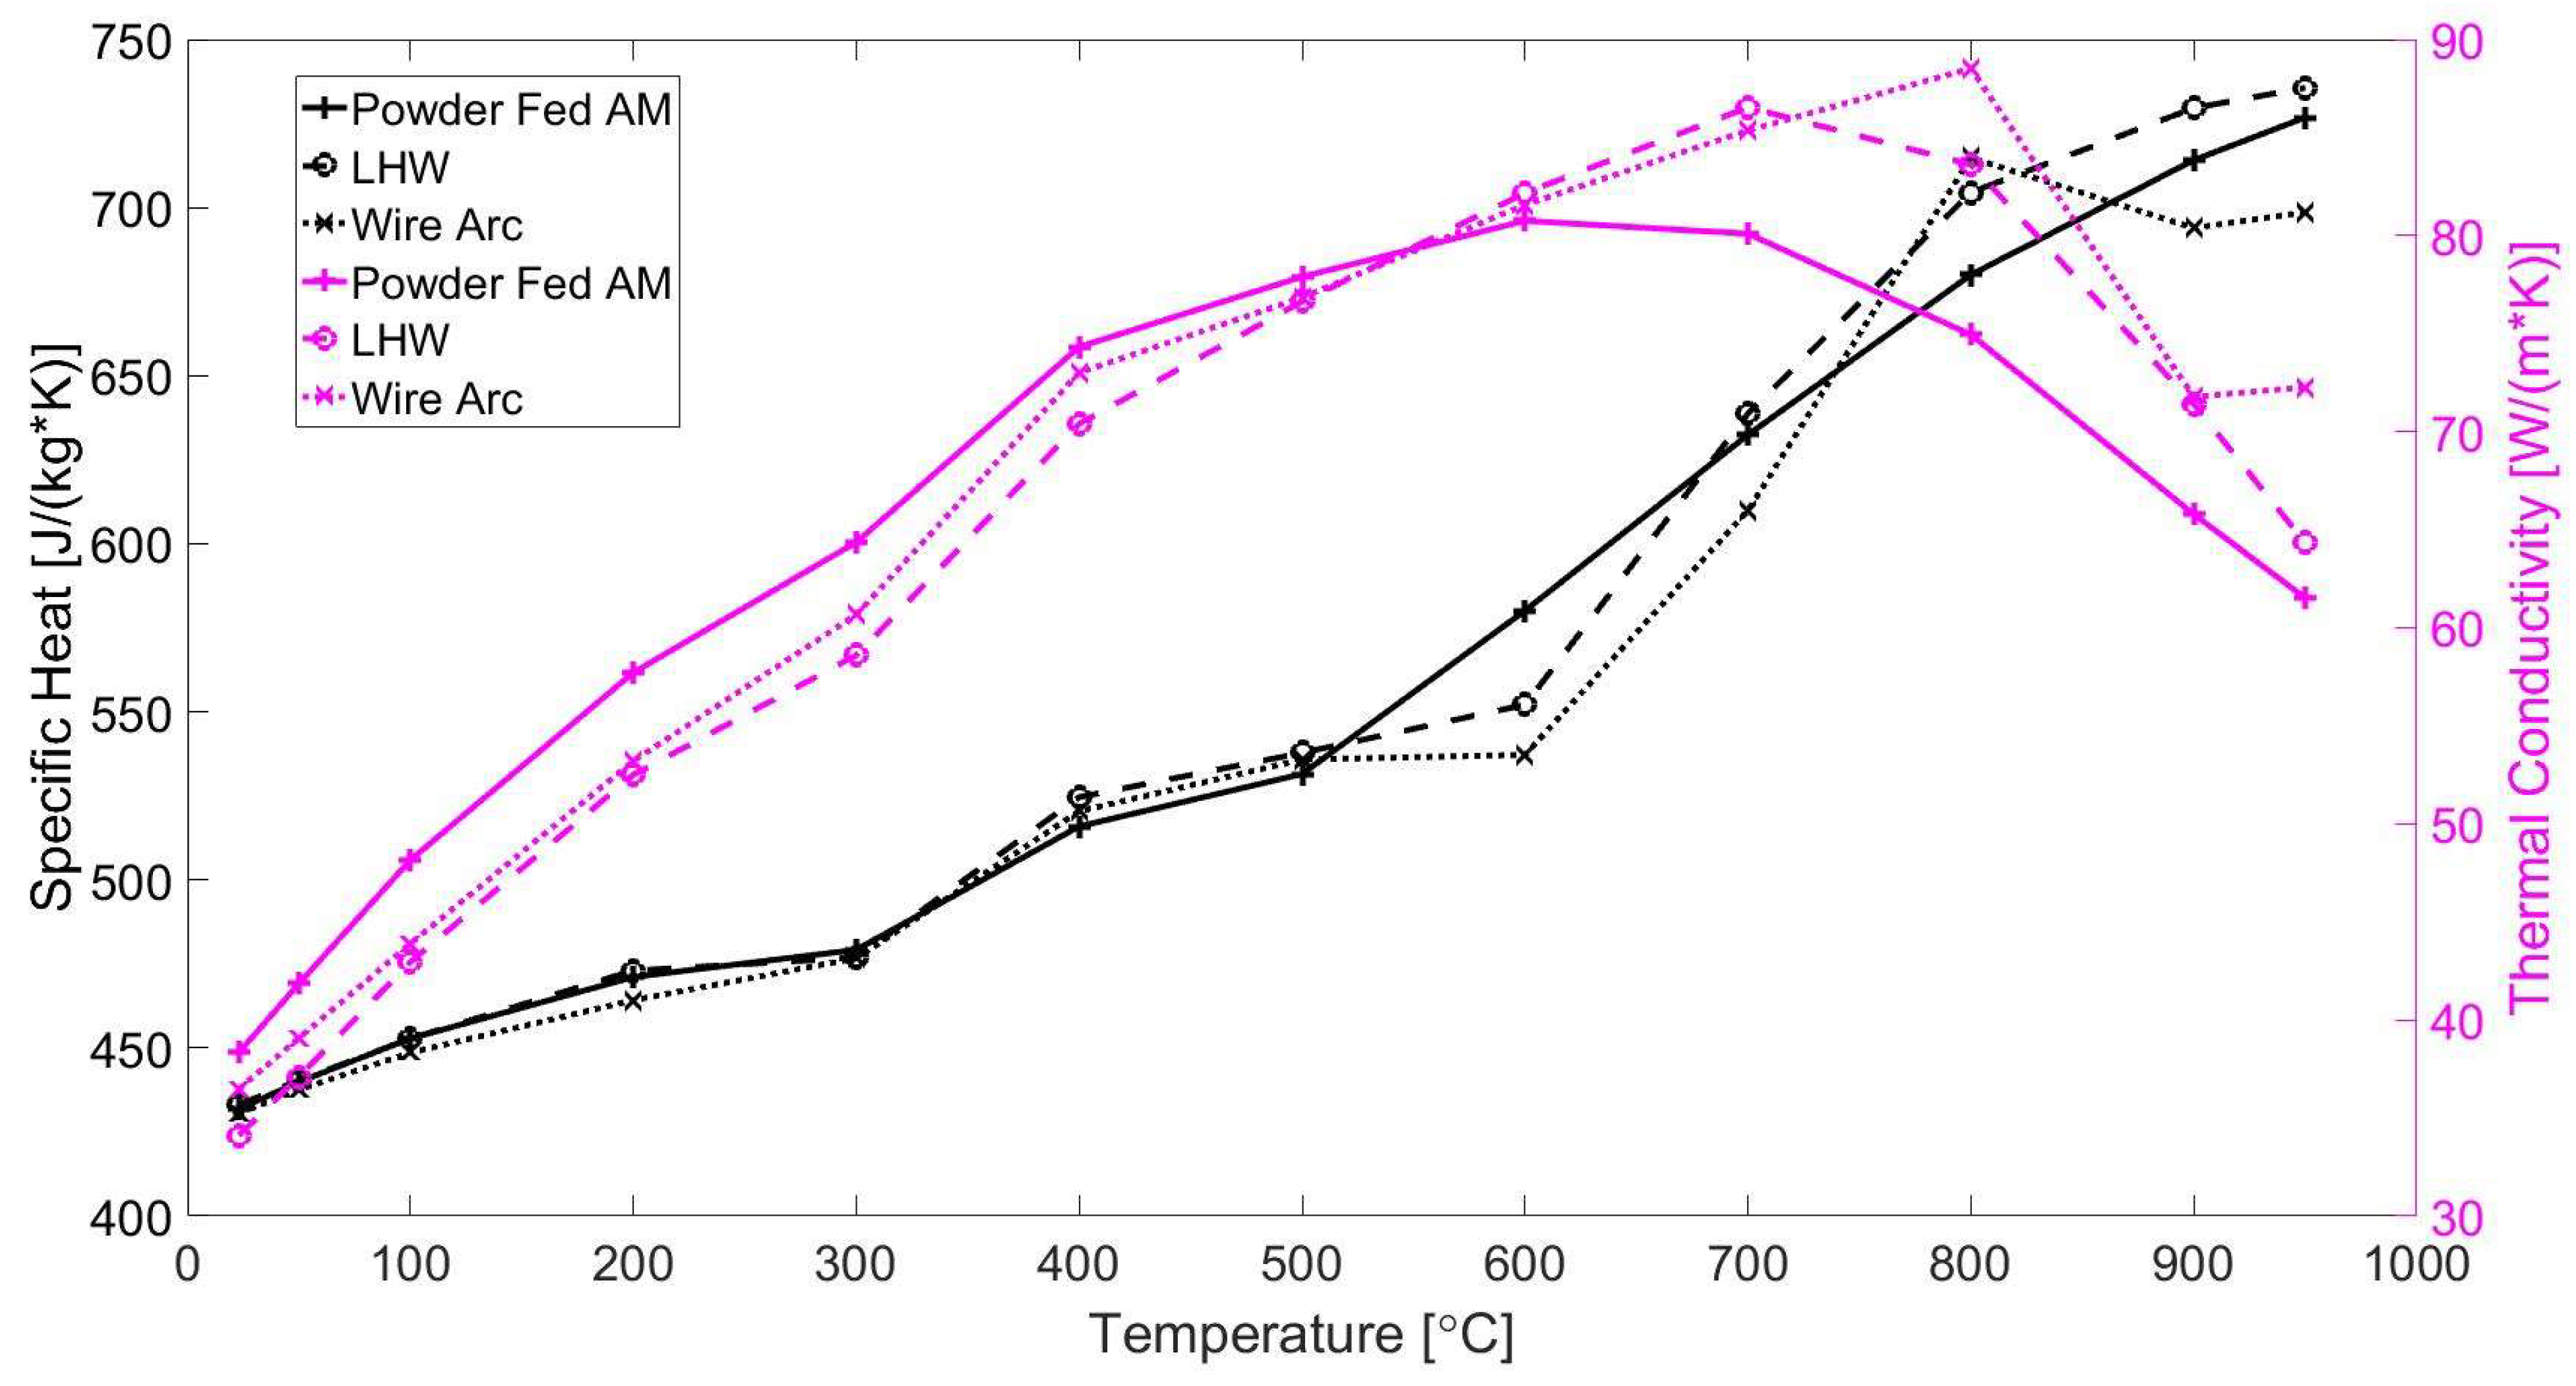
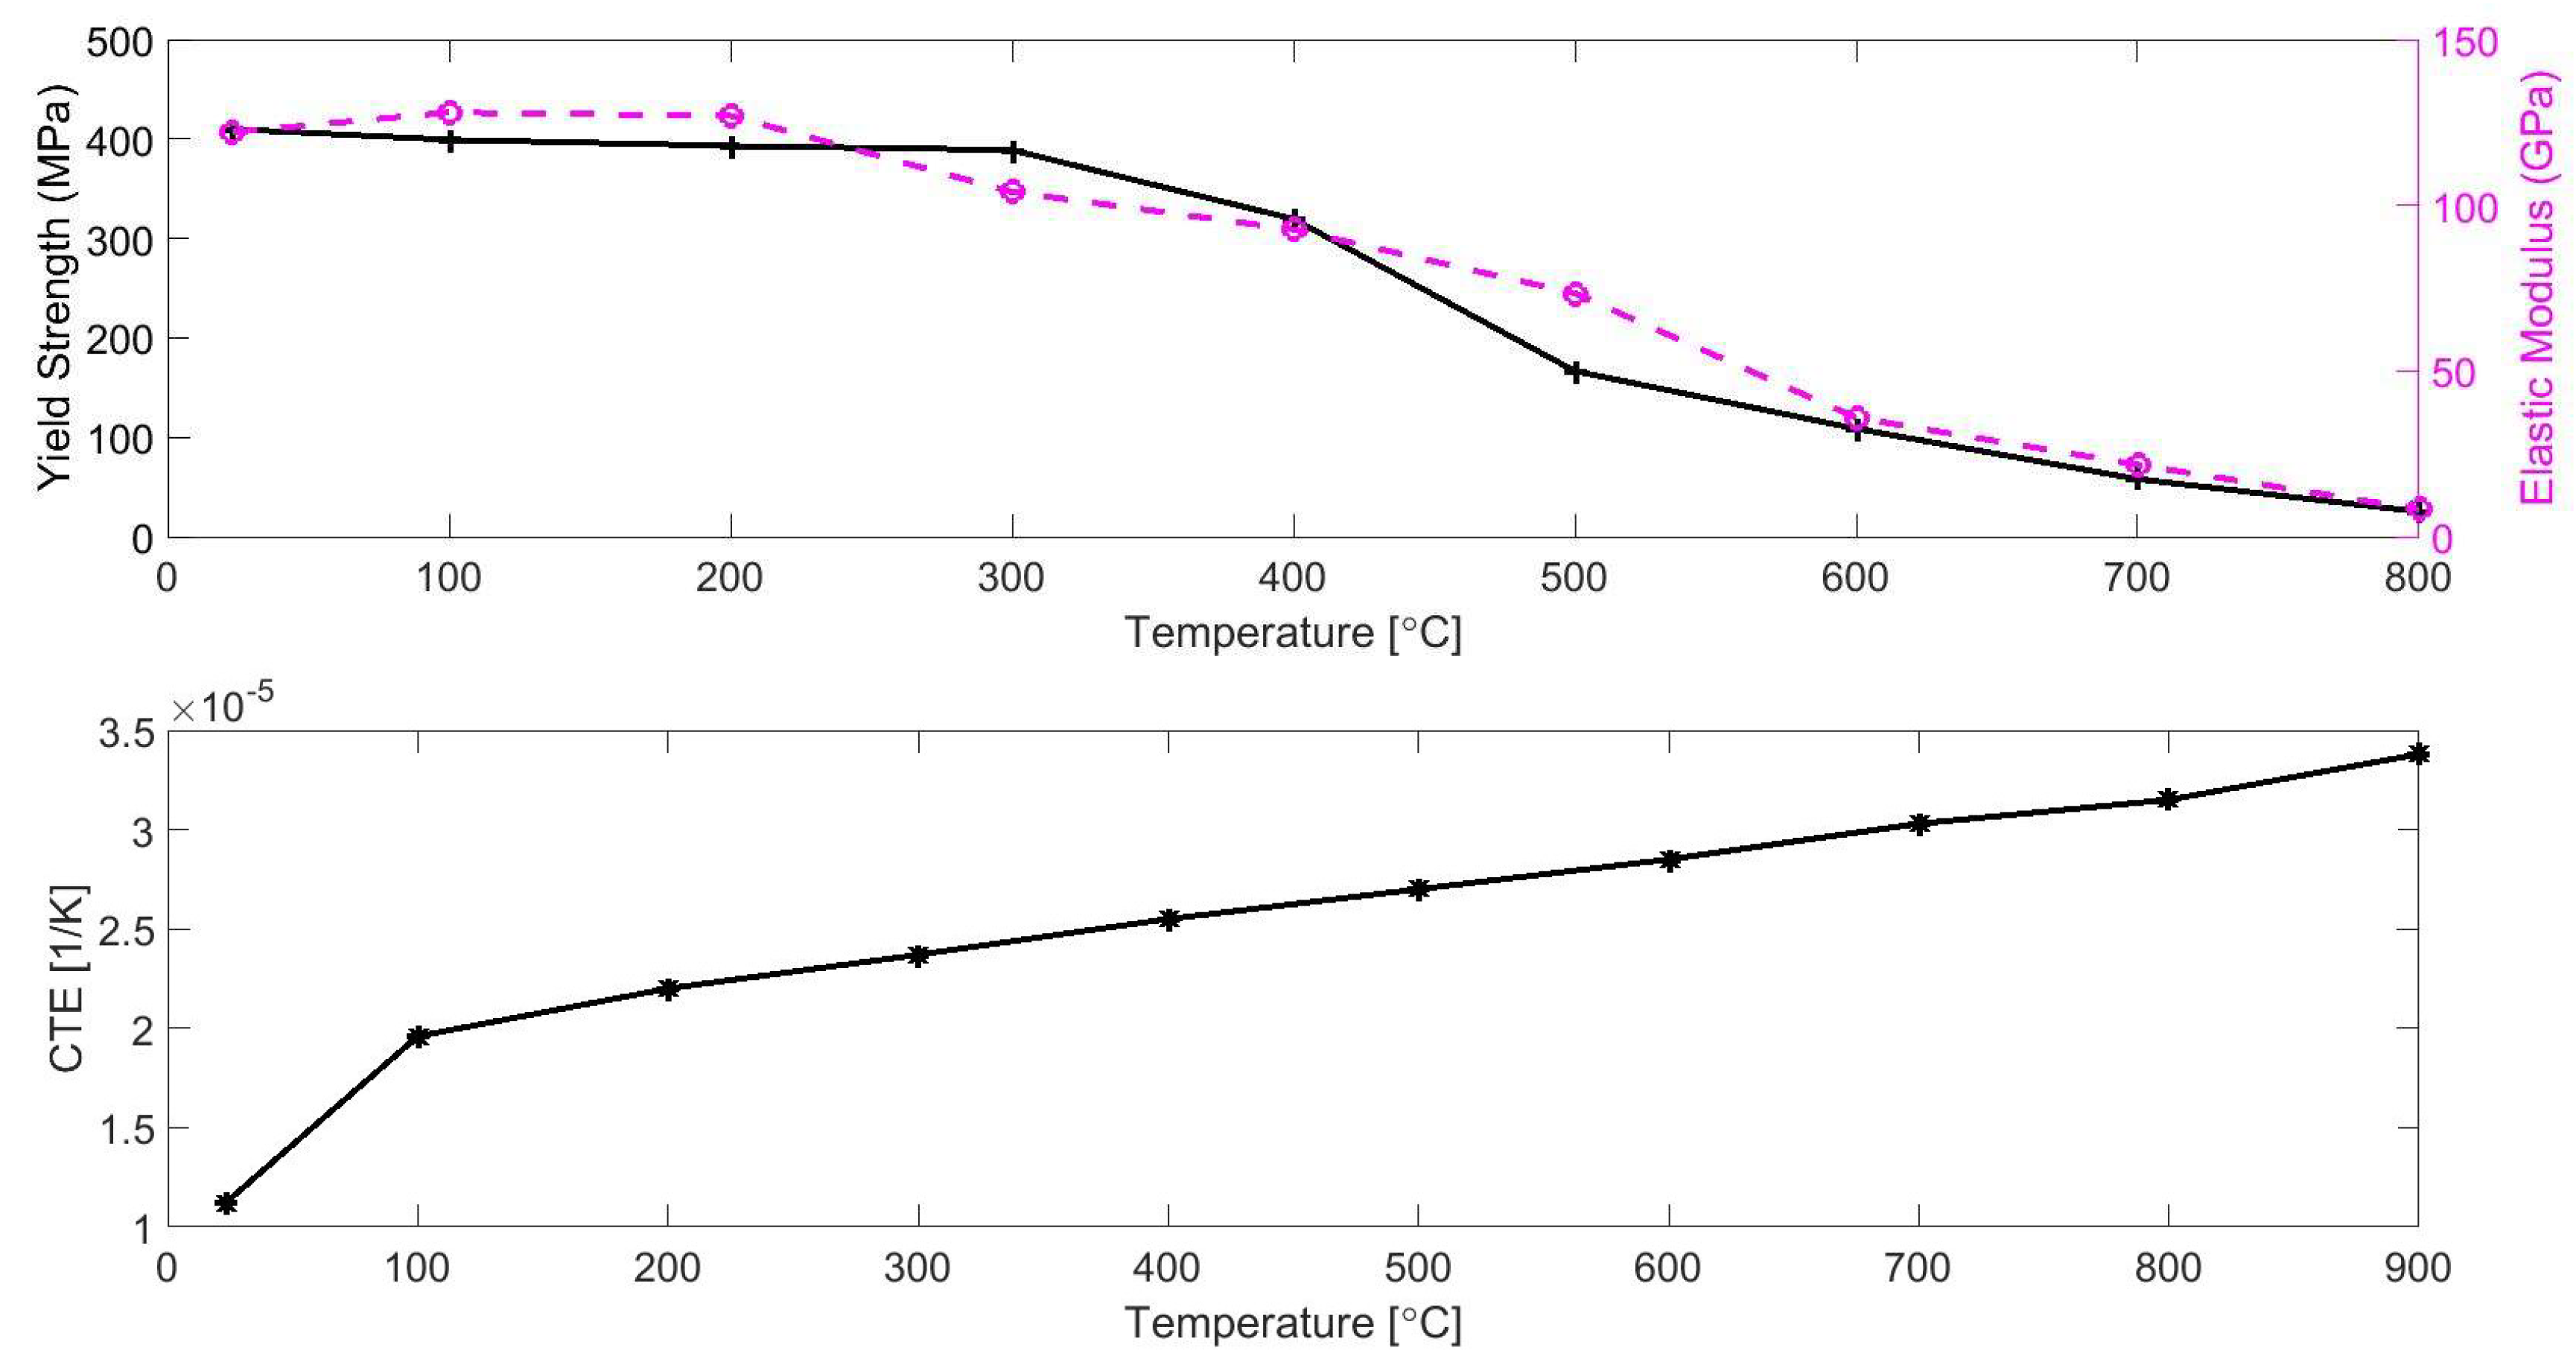
2. Experimental Measurement of Temperature-Dependent Material Properties of NAB

In order to measure the temperature-dependent material properties of NAB, three DEDAM processes, including gas metal arc welding (GMAW), powder fed direct energy deposition (PFDED), and LHW DEDAM, were applied to manufacture respective test coupons using the ASTM standard NAB alloys equivalent to C95800 [21]. The test specimens machined from each DEDAM process were circular disks with an average diameter of 13 mm and thickness of 3 mm.
The feedstock material used for the GMAW and LHW specimens complied with MIL-CuNiAl wire requirements [22], while the PFDED specimen used CU-172-C62 powder obtained from the Praxair Surface Technologies (Indianapolis, IN, USA). The substrate material used for the GMAW test specimen was C63000, defined by ASTM B171 [23], which is the standard specification for copper alloy plates and sheets for pressure vessels, condensers, and heat exchangers. The substrate material used for both the PFDED and LHW specimens was C63200, defined by ASTM B150 [24], which is the standard specification for aluminum-bronze rods, bars, and shapes. Table 1 summarizes the measured chemical compositions from the as-built DEDAM test specimens, where the specifications of the C95800 (Cast NAB) composition [21] and MIL-CuNiAl feedstock [22] are also included for reference. Note that the C95800 specification requires that the Cu content plus the sum of the named elements must meet a 99.5% minimum of the composition, and Fe content must not exceed the Ni content. The chemical compositions of as-built test specimens do not necessarily comply with all requirements of the cast material specification. The materials in Table 1 will subsequently be referred to as NAB in the remainder of the paper.
The material properties measured from each test specimen included density, specific heat, and thermal diffusivity. Bulk density values were calculated from the sample’s geometry and mass at room temperature. The specific heat and thermal diffusivity were measured at a range of temperatures from 20 to 900 °C. To obtain the temperature-dependent specific heat, a certified testing lab used standard ASTM E1269 [25] with sapphire as the reference material. The test to obtain the temperature-dependent thermal diffusivity was performed at a certified testing lab using the flash method given in ASTM E1461 [26]. Thermal conductivity values were calculated as a product of the specific heat, thermal diffusivity, and density.
The density values of the specimens from the three processes are given in Table 2. The temperature-dependent thermal conductivity and specific heat are plotted in Figure 1, with values given in Table A1 of the Appendix A. The difference among the thermal conductivity values measured from specimens fabricated by different processes may be due to porosity, slight changes in chemical composition, or other microstructural differences resulting from each individual DED process. Further investigation of these differences is beyond the scope of this paper.
The temperature-dependent yield strength, elastic modulus, and coefficient of thermal expansion (CTE) were measured only from a test sample fabricated with LHW DEDAM and not from the other two DED processes. These properties, mainly affecting the mechanical properties during fabrication, were characterized across a temperature-dependent domain of 20–900 °C according to ASTM E21-17 [27]. At each temperature, the elastic modulus and yield strength of a sample were measured in both the transverse direction (perpendicular to the bead direction) and the longitudinal direction (parallel to the beads). At every temperature, both of these values were averaged together to calculate the final value of each property, as plotted in Figure 2. The averaged values are also provided in Table A2 of the Appendix A.
The material data presented in this section are critical to performing thermo-mechanical simulations of LHW DEDAM of NAB, and they form a foundation for analysis. Note that linear interpolation or extrapolation of the measured properties from the closest temperatures is used to compute the material properties at any given temperature during the simulations in the remainder of the paper. Other temperature-independent properties of C95800 cast NAB [28] that will also be used in the modeling and simulation are summarized in Table 3.

3. Methods for Modeling and Simulation of LHW

3.1. LHW System and Processing Conditions

This study considers a robotic LHW system, comprising a 6-axis ABB IRB-6700 150/3.2 robot (ABB, Zurich, Switzerland) along with an ABB IRBP A-750/1450 two-axis work piece positioner as illustrated in Figure 3. The system uses an IPG Photonics YLR-12000-C 12 kW Ytterbium fiber laser (IPG Photonics, Oxford, MA, USA) with a Laser Mechanisms’ FiberSCAN HR laser processing head (Laser Mechanisms, Novi, MI, USA), and a computer-controlled hot-wire power supply to prevent arc initiation. The processing head uses a set of two parabolic optics to collimate and focus the beam onto the build surface and then scan the beam in 1 or 2 dimensions. This study focused on a scenario where the beam oscillates in a single dimension at 7.5 Hz perpendicular to the deposition direction. The wire feedstock is delivered to the melt pool via a Lincoln Electric Autodrive 4R220 wire feeder (Lincoln Electric, Euclid, OH, USA) in a wire-leading configuration, where the wire feeder is coupled to the Lincoln Hot Wire Power Supply with the STT (surface tension transfer) Module to provide feedstock delivery and wire preheating.
Table 4 summarizes the process conditions and parameters used for the simulation studies in this paper. The process parameter set was obtained by performing an experimental trial-and-error on the LHW system shown in Figure 3 to produce reliable and repeatable components of reasonable quality.

3.2. Part Configuration

As a case study, a 40-layer block, with 4 beads in each layer, was simulated. As illustrated in Figure 4, the block part is 98 mm by 25 mm by 76 mm, built on a substrate of 152 mm by 51 mm by 16 mm. The overall number of 40 layers was selected so that the block would go through a wide range of temperatures during simulation while being small enough in size to allow the simulation time to be manageable. The deposition sequence for the beads is from 1 to 4 on odd layers and in the reverse order 4 to 1 on even layers. All beads are unidirectional, i.e., deposited in the same direction. In the simulations of LHW deposition, the substrate is modeled as a cantilever beam being deposited on, with one end clamped and the three other sides free. In Figure 4, points T1, T2, and T3, which are located in the center of either the length or the width of the side of the substrate, are selected to be the points where the temperature evolution is simulated. Points D1, D2, and D3, which are located along the center line of the width at the bottom of the substrate, are selected to illustrate the predicted vertical displacement post-fabrication.

3.3. Modeling of Wire Heat Source

Autodesk’s Netfabb Local Simulation (2021.0, Autodesk, San Francisco, CA, USA) was used in this work for the three-dimensional (3D) thermo-mechanical simulations of the LHW system shown in Section 3.1. Netfabb Simulation has been extensively demonstrated and validated on PFDED systems and L-PBF AM processes [29], but not for LHW DEDAM. Compared to the PFDED process that uses a laser as a single heat source, LHW uses the hot wire as a second heat source in addition to the laser heat source. Furthermore, the oscillating laser used in the LHW forms a triangular path along the deposition, which has not been modeled previously in Netfabb. Therefore, model modifications were made to the FEA simulation to accommodate the wire heat source and laser line path.
First, the input power of the LHW DEDAM has to account for the additional energy supplied by the wire through Joule heating. Similar to Shiqing et al. [17], Joule’s law was used to calculate the heat flux due to the resistance heating produced by the hot wire as follows:
q = I 2 · p S 2
where q represents the heat flux, I represents the current, p   represents the resistivity of the wire (used the C95800 value [28] in Table 3), and S represents the cross-sectional area of the wire. The heat flux was then converted into the total heat power added along the length of the wire,
P w i r e = q · S · v · L    
where Pwire represents the power, v represents the wire feed rate velocity, and L represents the length of the wire with applied current, i.e., from the end of the contact tip to the melt pool. Using the parameters given in Table 4, the power added from the resistance heating of NAB hot wire was estimated to be 887 W.
In order to model the LHW DEDAM process using Netfabb, the energy input from the heated wire was added to the energy provided by the laser and incorporated into a single heat input, where the single heat source model was adjusted to account for 100% of the resistance heating being deposited at the melt pool location. The NAB alloy under test was highly reflective, and this property was accounted in the model by setting the laser optical absorptivity value to be an estimated 15%. This absorptivity value was also used in Nie et al. [20] for the deposition of H13 steel.

3.4. Modeling of Laser Line Path

The oscillating laser used in the LHW process forms a triangular path along the deposition. However, in simulation, there is a significant computational benefit to replacing the oscillating laser path of the actual process with a straight path. Specifically, a larger heat source with a 9 mm bead width was used in this study to replace the 4 mm diameter oscillating laser from the physical system. This larger heat source approximation used the same linear heat input as the oscillating laser, i.e., the same total energy per unit length over the same amount of time was used. To assess the effect of this simplification on the simulation accuracy, a single-layer thermal simulation using each of these two laser-path models was performed, and the resulting temperature histories at points T1–T3 are plotted in Figure 5. Then, a mechanical analysis was performed to predict the distortion at point D3, as shown in Figure 6. The temperature-dependent material and mechanical properties obtained from the LHW test specimens were used for the thermo-mechanical analysis. By replacing the triangular path with a straight path, the resulting average errors in T1, T2, and T3 were 5.72%, 2.74%, and 7.40% respectively, and the resulting steady-state error in the predicted vertical displacement at D3 was 0.27%.
The simulations were performed on a computer of 8-core 3.4 GHz processor with 8 GB RAM computer. In terms of computational cost, using the triangular-wave laser path for a single-layer simulation took 1072 s, whereas the single-layer simulation using the simplified straight path took 184 s. The amount of computational time saved would become significant when simulating a forty-layer build later in this paper. On average, it took approximately 4.5 h to simulate the forty-layer build with the simplified straight path. With a conservative estimation where the simulation time was assumed to scale linearly, simulation of the forty-layer build would require 27 h if the triangular-wave laser-path was used.

3.5. FEA Simulation Parameters for Moving Heat Source Model

The FEA software, Netfabb Local Simulation, uses an adaptive meshing method to define the elements in simulating an as-built part. The software refines the mesh near the melt pool as the simulation progresses to ensure adequate capture of high temperature and stress gradients, but it automatically coarsens the mesh as the laser gets further away and gradients decrease to improve simulation efficiency [30]. For laser cladding processes, Gouge et al. performed a mesh convergence study with respect to using 2, 3, or 4 elements per laser diameter and analyzed the resulting effect on temperature prediction [31]. For DED processes, Li et al. conducted a mesh coarsening study by analyzing the effect of using 2, 4, or 8 fine layers beneath the heat source on the resulting prediction of temperature history, residual stress, plastic strain, and substrate distortion [32]. This paper used the largest number of elements (4 elements) per laser diameter and the largest number of fine layers (8 fine layers) for the mesh parameters that have been investigated in the existing mesh-parameter studies using Netfabb. Hex8 elements and reduced integration were used in the simulation. Figure 7 shows the mesh used at the beginning of the deposition process, during the process (10th layer), and at the end of the process.
In addition to the meshing, Netfabb also uses adaptive time steps to reduce computational burden while providing adequate results. The adaptive time-step parameters used in this study are given in Table 5. The maximum number of cutbacks per increment is used in the Newton-Raphson solver that Netfabb employs. The simulation will cut back if the solution does not converge within the specific number of iterations in the solver. Other simulation parameters in Netfabb were set to the software’s default values—readers are referred to the software manual [30].

3.6. Comparison of Thermo-Mechanical Analysis

A sequential thermo-mechanical analysis was performed in this study, where the thermal simulation of the LHW DEDAM process was first conducted by solving the 3D heat transfer energy balance equation; then, results from the thermal analysis were used as inputs for the quasi-static mechanical analysis. Readers are referred to [29] for the detailed mathematical equations. Fully coupled thermo-mechanical simulation is needed when the mechanical analysis results in the generation of heat such as adiabatic heating during impact. The mechanical response in the DED process is rather slow, and adiabatic heating is negligible. Another need for full coupling would be if the mechanical response affects the thermal analysis boundary conditions such as a change in contact between the part and the fixture. Again, this was not the case in this study, and hence, a sequential analysis was justified.
In the prediction of component distortion, the temperature history during and after deposition is critical. A separate thermal simulation was performed using the set of temperature-dependent material properties obtained from test specimens fabricated by each of the three processes of LHW, PFDED, and GMAW (see Section 2). Then, they are compared to a baseline simulation performed using the constant material property data (denoted as Constant) measured at room temperature [28]. That is, all simulations were performed for the LHW process, with the difference lying in that each simulation used temperature-dependent properties experimentally determined from LHW, PFDED, and GMAW, or constant properties from the room temperature.
In the Netfabb Local Simulation, the mechanical simulation uses the temperature outputs from the thermal simulation to predict the component distortion. Based on the outputs from each of the three thermal simulations using temperature-dependent material properties, a respective mechanical simulation was conducted. All these three mechanical simulations used the same temperature-dependent mechanical properties obtained from the LHW specimen shown in Figure 2. The resulting mechanical simulations are denoted as LHW–LHW, GMAW–LHW, and PFDED–LHW respectively, with the first part of the nomenclature denoting the process producing the test samples for measuring the thermal-related material properties, and the second part denoting the process producing the test samples for measuring the mechanical properties. Then, these three mechanical simulations are compared to a baseline mechanical simulation (denoted as Constant–Constant) performed with the constant mechanical properties and the thermal outputs generated with constant material properties.

4. Results and Discussion

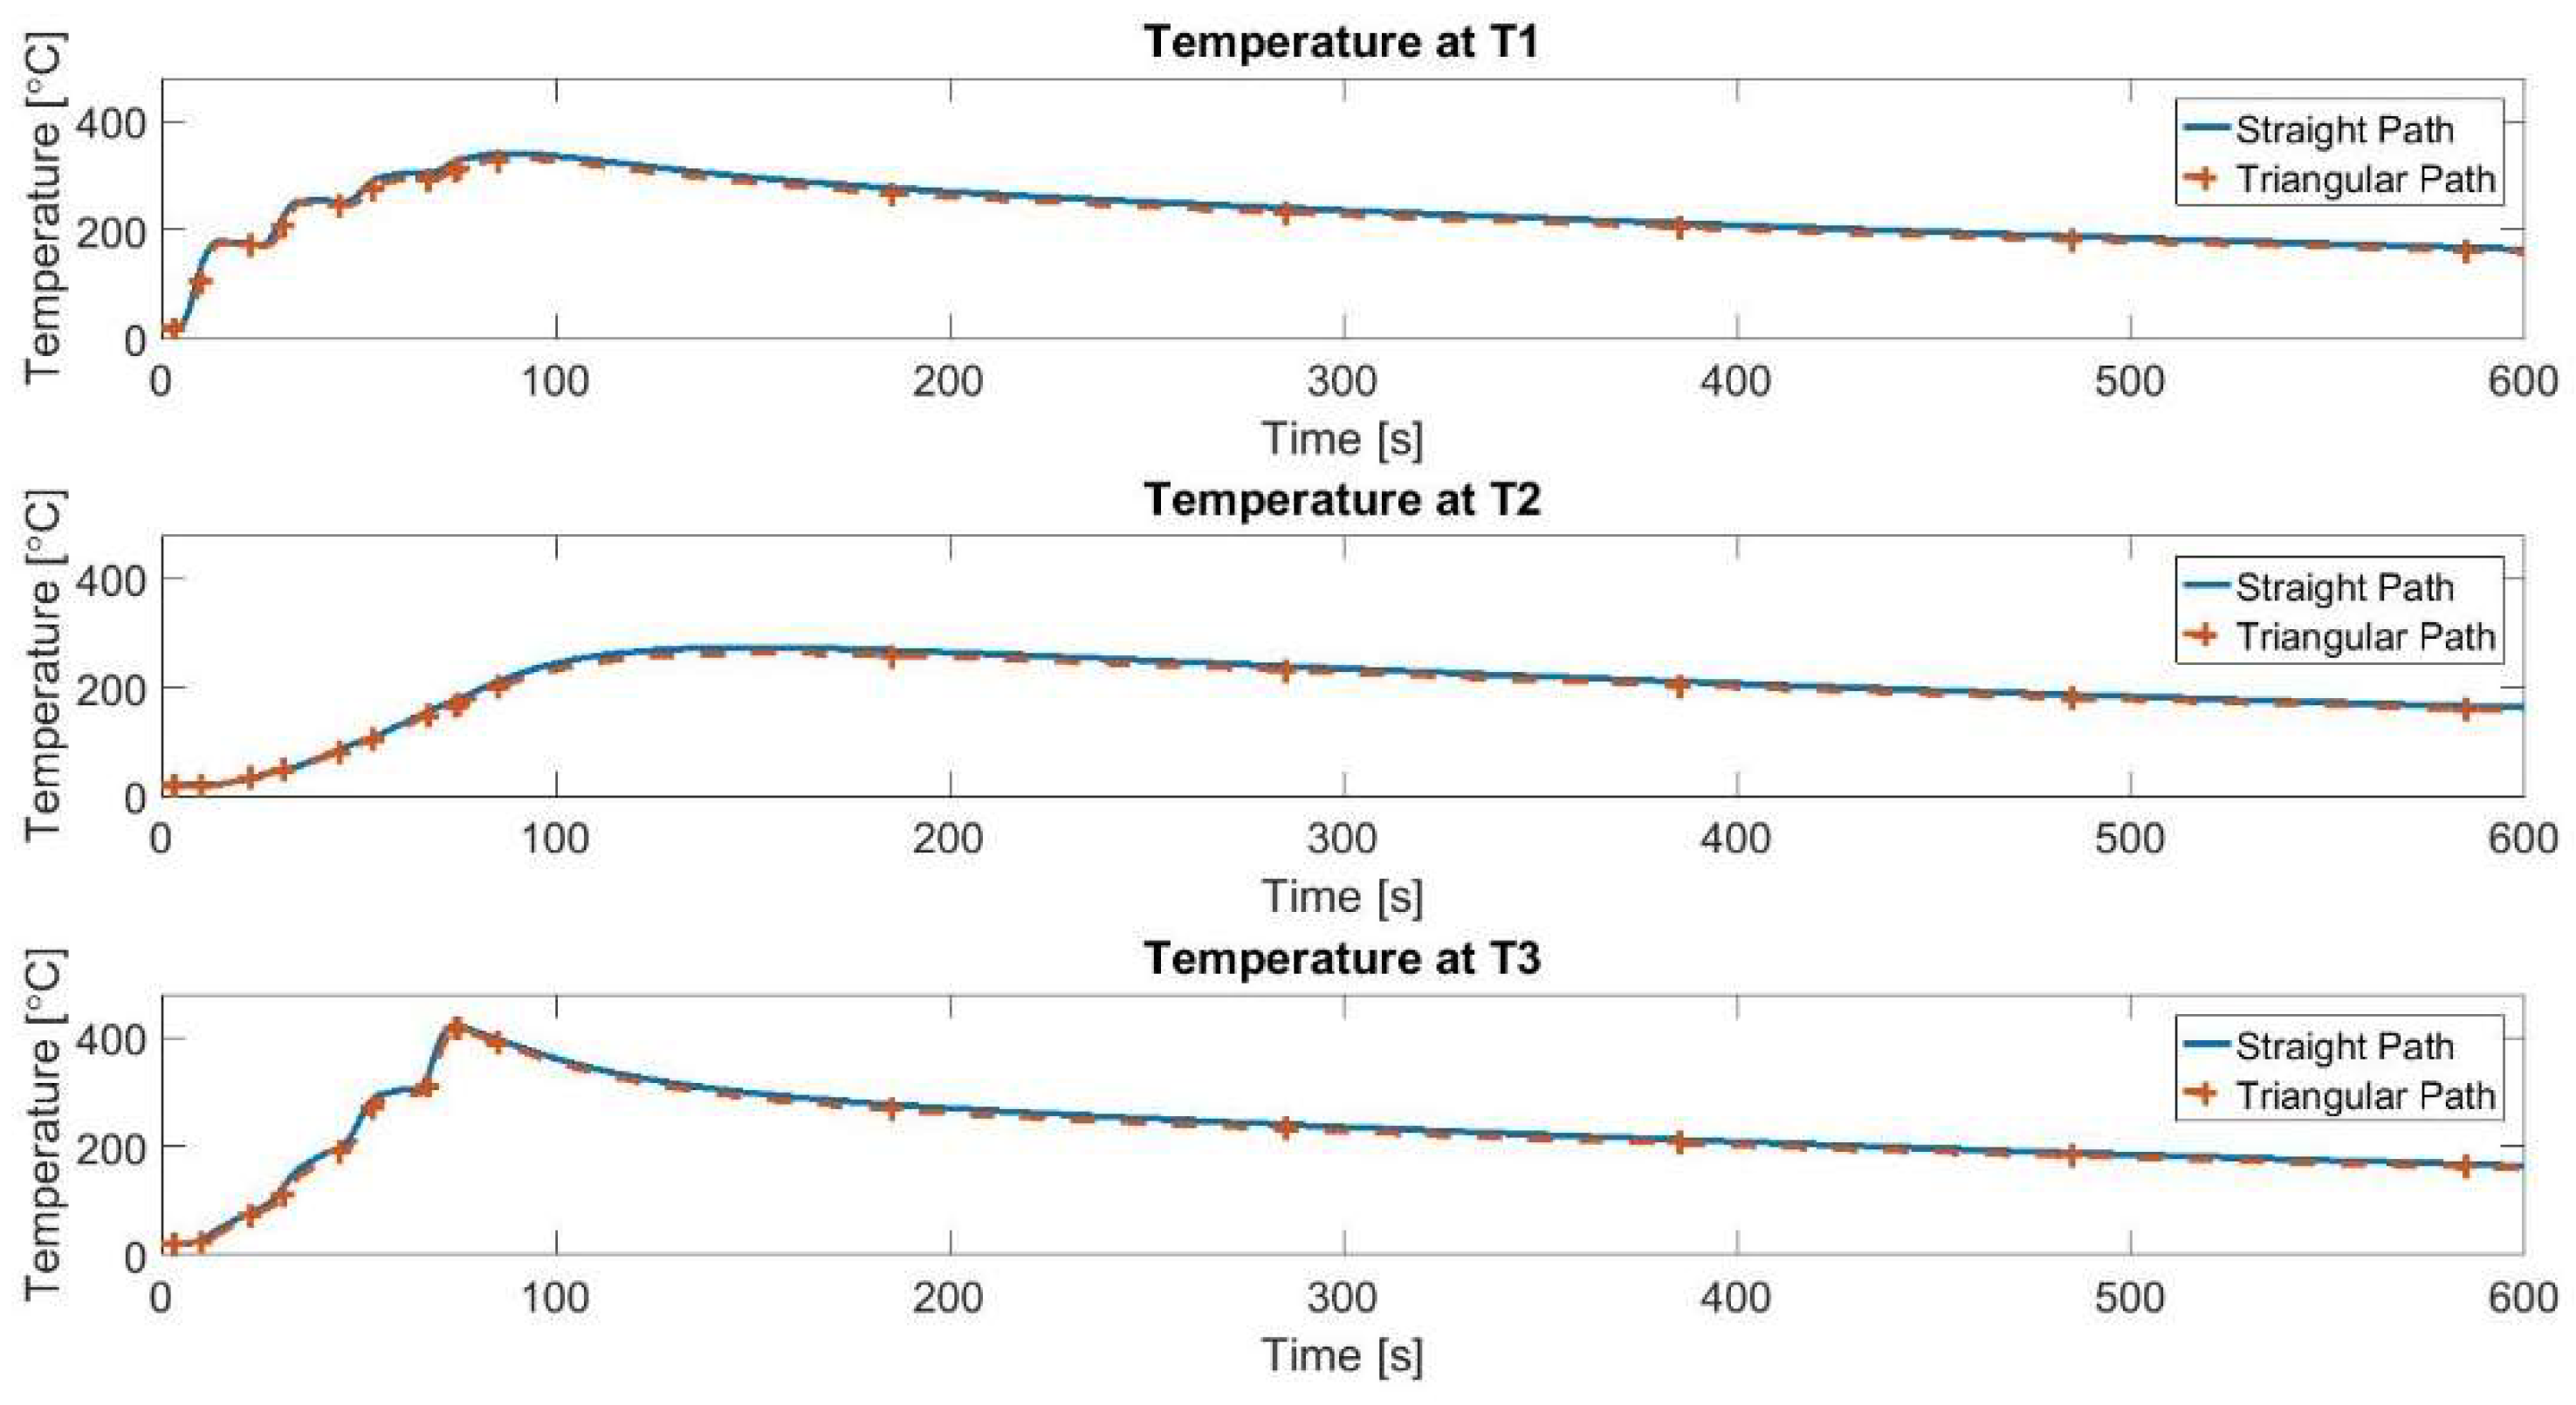
4.1. Thermal Simulation Results

For thermal simulations, three representative points, Points T1, T2, and T3 as shown in Figure 4, were chosen to compare among the aforementioned four groups of simulations: LHW, GMAW, PFDED, and Constant. Figure 8 shows the temperature comparison, where the vertical dashed line marks the ending time of the deposition for the block part, while the horizontal dashed line indicates the solidus temperature of the NAB. Although the general shape of the time history at Point T1 is similar to that at Point T3, close observation of the markers representing the sample points in each temperature trajectory reveals the difference in temperature changes at the early stage of the deposition. As the deposition sequence for the beads are from 1 to 4 on odd layers, and in the reverse order 4 to 1 on even layers, the temperature at Point T1 rises quicker during the beginning stage of the simulation than the temperature at Point T3.
Figure 8 shows a substantial difference between the simulations using the temperature-dependent properties (LHW, GMAW, PFDED) and the one using the constant material properties (Constant). For temperature history at Point T1 and Point T3, the Constant reached about 40 °C higher in peak temperature and cooled at a faster rate than the other three simulations using the temperature-dependent material properties. In contrast, the difference in peak temperature among the three groups of simulations using the temperature-dependent properties was less than 20 °C at T1 and T3, with the LHW having the lowest peak temperature and the GMAW having the highest peak temperature. Note that the peak temperature of 1044 °C reached by the Constant was slightly above the solidus temperature of C95800 at 1043 °C, indicating that the area on the backside of the substrate was beginning to melt during the simulated build process. At Point T2, similar to at T1 and T3, the temperature history under the Constant reached its peak temperature faster and then cooled off more quickly than those using the temperature-dependent material properties, but the peak temperature under the Constant was similar to that of PFDED, which was slightly higher than the peak temperature under the LHW but about 20 °C lower than the peak temperature under the GMAW.

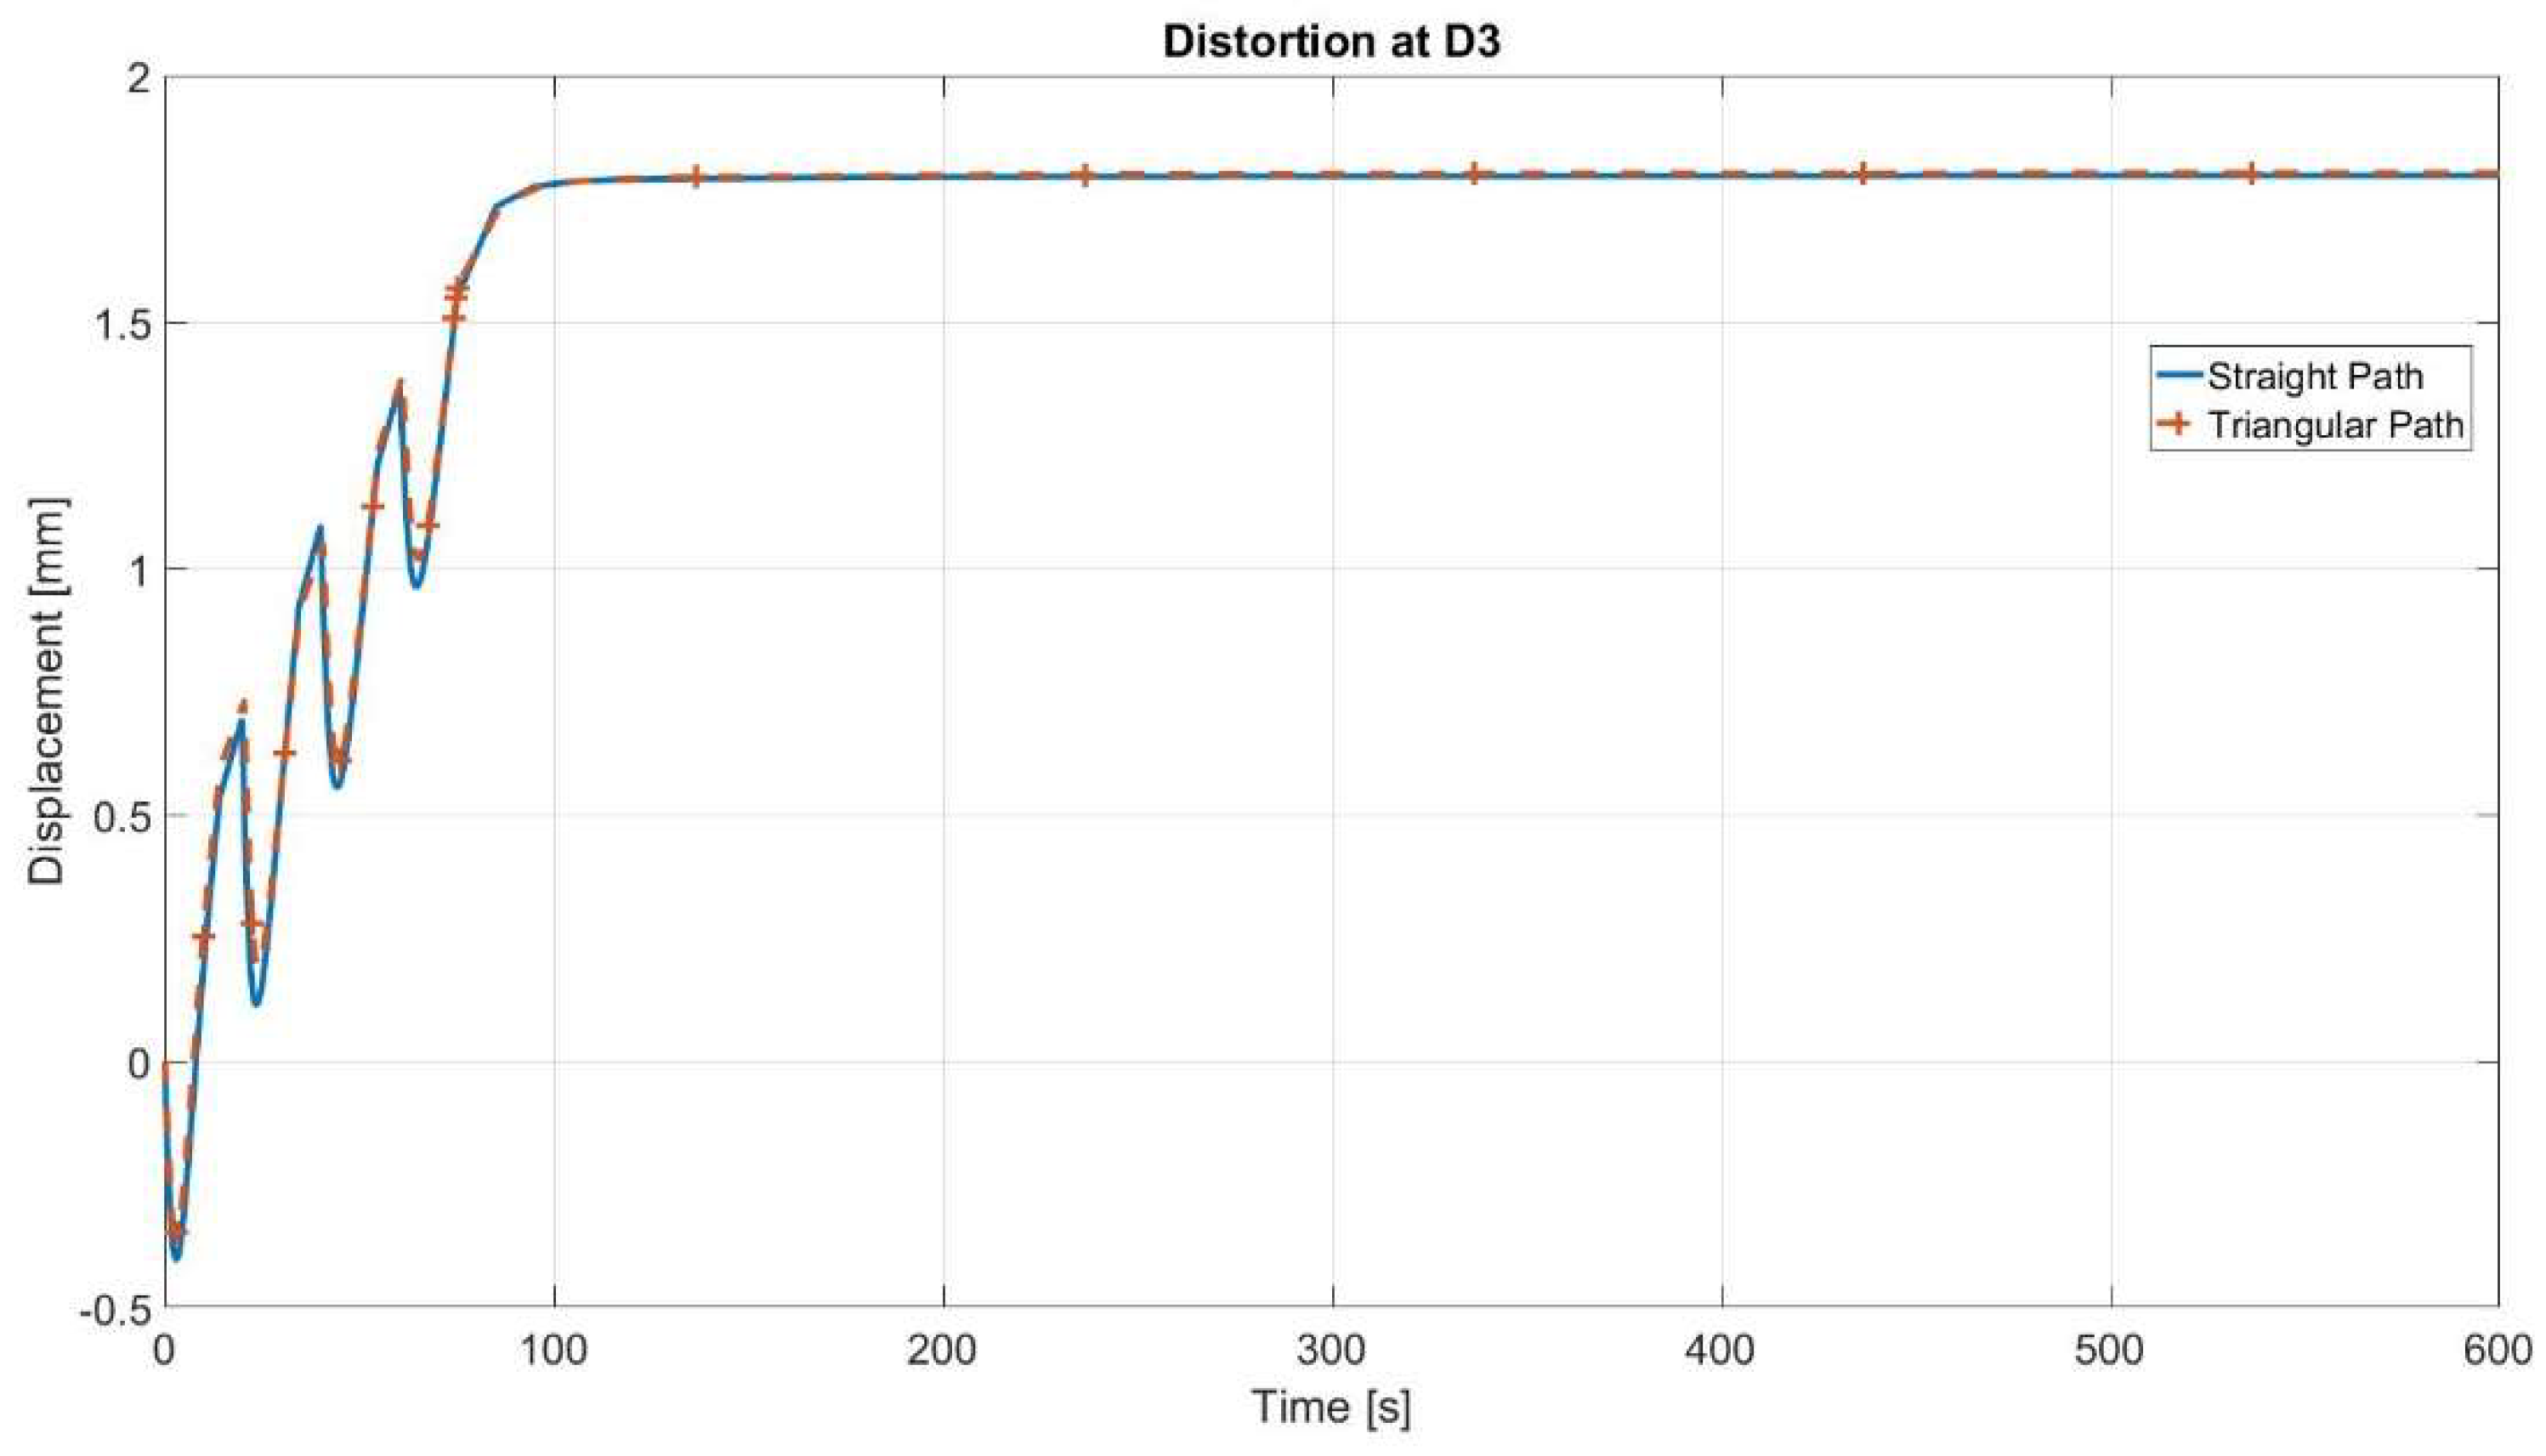
4.2. Mechanical Simulation Results

The mechanical simulations take the thermal simulation results as input and then predict the distortion during and after component deposition. As illustrated in Figure 4, Points D1–D3, located along the center line of the width at the bottom of the substrate, were selected to illustrate the predicted vertical displacement. Comparison of the simulated residual stress under the four different mechanical simulations (LHW–LHW, GMAW–LHW, PFDED–LHW, Constant–Constant) is illustrated in Figure 9, and the corresponding comparison of the simulated plastic strain is given in Figure 10. While the residual stress and plastic strain are similar among the three simulations using temperature-dependent properties, the LHW–LHW case has a higher magnitude of plastic strain that affects a slightly larger area of the substrate and of the bottom layers of the component.
Figure 11 shows the comparison of the predicted vertical displacement at Points D1–D3. Since Point D1 lies in the simulated clamped end of the substrate, the corresponding vertical displacement is equal to zero. For Points D2 and D3, Figure 11b,c show that the vertical displacement under the Constant–Constant is substantially under-predicted compared to the other three groups of simulations using temperature-dependent properties. Especially, the predicted displacement after the end of the deposition process (marked by the vertical dashed line) under the Constant–Constant remains negative in contrast to the positive displacement predicted by the other three groups. The rapid change in displacement after reaching the melting temperature (marked by the vertical solid line) under the Constant–Constant indicates a complete relaxation of the part, noting that the predicted displacement is in the opposite direction from the other three groups. At Point D3, the predicted peak displacement under the LHW–LHW is close to 2.6 mm, which is close to three times as large as the peak displacement (about 0.8 mm) predicted under the Constant–Constant. Among the three groups of simulations using temperature-dependent properties, the predicted displacement under the LHW-LHW is slightly higher than the GMAW-LHW and PFDED-LHW at Point D2 (< 0.1 mm) and about 0.5 mm higher at Point D3.
Next, to identify the source of the disparity in predicted displacement between the LHW–LHW and Constant–Constant, Figure 12 shows the comparison of the predicted vertical displacement at Point D3 between the LHW–LHW and LHW–Constant. The latter was generated using the LHW thermal simulation results but with constant mechanical properties. A difference of about 1.7 mm in the predicted displacement was observed after the simulations converged. The peak vertical displacement of both LHW–LHW and LHW–Constant occurred after the finish of the deposition (marked by the vertical dashed line).
In summary, Figure 11 and Figure 12 indicate that if only constant room-temperature material property values are used in the thermo-mechanical analysis, it could cause significant difference in the predicted vertical displacement. Furthermore, if the temperature-dependent material properties were measured from test specimens fabricated from a DED process other than LHW, it would also result in prediction difference in vertical displacement.

5. Conclusions

This paper conducted thermo-mechanical analysis for LHW deposition of NAB alloys. To enable the analysis, temperature-dependent material properties of NAB alloys were measured from test specimens fabricated from three different DED processes, including LHW, PFDED, and GMAW. Then, to simulate processing with a LHW DEDAM system that utilizes hot wire and an oscillating laser beam, the laser heat-source model in the Netfabb was modified to account for resistance heating of the hot wire, and a simplified straight laser path was used to replace the triangular-wave laser path in the physical process to reduce the computation expense. For a 40-layer part with the dimensions of 98 mm by 25 mm by 76 mm on a substrate of 152 mm by 51 mm by 16 mm, the predicted largest vertical displacement at the un-clamped free end of the substrate was about 3 mm, using the temperature-dependent material properties. The simulation results demonstrated that if constant material properties were used instead, the predicted displacement at the free end of the substrate would occur in the opposite direction. In addition, simulation results indicated that if the temperature-dependent material properties were measured from test specimens fabricated from a DED process other than LHW, it would also result in prediction difference in vertical displacement. In the future work, experimental validation of the thermo-mechanical analysis will be performed using in situ measurements of temperature via thermal couples and measurements of vertical displacement via laser displacement sensors along the bottom of the substrate.

Author Contributions

Conceptualization, G.W.H., Q.W. and E.W.R.; Data curation, G.W.H., C.R.F. and J.K.S.; Formal analysis, G.W.H.; Funding acquisition, E.W.R.; Methodology, G.W.H., Q.W. and E.W.R.; Project administration, E.W.R. and C.R.F.; Resources, E.W.R. and C.R.F.; Supervision, Q.W. and E.W.R.; Writing—original draft, G.W.H.; Writing—review & editing, Q.W., E.W.R. and C.R.F. All authors have read and agreed to the published version of the manuscript.

Funding

This work was supported in part by the Naval Sea Systems Command (NAVSEA) under Contract No. N00024-12-D-6404, Task Order No. N00024-17-F-8346, and by the U.S. Army Combat Capabilities Development Command’s Army Research Laboratory under Contract No. N00024-18-D-6401, Task Order No. N00024-19-F-8497. Any opinions, findings, and conclusions or recommendations expressed in this material are those of the author(s) and do not necessarily reflect the views of the Naval Sea Systems Command (NAVSEA).

Institutional Review Board Statement

Not Applicable.

Informed Consent Statement

Not Applicable.

Data Availability Statement

The data presented in this study are available on request from the corresponding author subject to approval from the Naval Surface Warfare Center.

Acknowledgments

The authors were also grateful for the assistance of Wesley Mitchell and Evan West from Penn State Applied Research Lab for providing process descriptions, parameters, and diagrams of the LHW DEDAM system used in this work.

Conflicts of Interest

The authors declare no conflict of interest.

Appendix A

Table A1. NAB thermal properties.
ProcessesPowder Fed Directed Energy DepositionLaser Hot Wire Additive ManufacturingGas Metal Arc Welding
Temperature [°C]Thermal Diffusivity [m2/s]
X(103)
Specific Heat [J/(kg·K)] Thermal Conductivity [W/(m·K)]Thermal Diffusivity [m2/s]
X(103)
Specific Heat [J/(kg·K)]Thermal Conductivity [W/(m·K)]Thermal Diffusivity [m2/s]
X(103)
Specific Heat [J/(kg·K)]Thermal Conductivity [W/(m·K)]
230.12043238.30.10443334.10.11343136.5
500.12944041.90.11244037.10.11943839.1
1000.14445348.20.12645343.00.13144943.9
2000.16647157.70.14747352.50.15346453.2
3000.18247964.40.16347758.60.17047760.7
4000.19551674.30.17852570.40.18752073.0
5000.19953277.90.18953876.60.19253676.8
6000.18958080.80.19755282.20.20353781.6
7000.17263280.10.17963986.50.18761085.4
8000.14968074.90.15770583.60.16571588.5
9000.12571465.80.13073071.40.13869471.8
9500.11572761.50.11673664.30.13869972.3
Table A2. NAB LHW mechanical properties.
Temperature [°C]Coefficient of Thermal Expansion [1/°C]Young’s Modulus [GPa]Yield Strength [MPa]
2311.2122410
10019.6128399
20022.0127393
30023.7104389
40025.592.7320
50027.073.4167
60028.535.9109
70030.321.757.9
80031.58.2725.2
90033.8n/an/a

References

  1. Rashidi, M.M.; Ahmad, A.H. Investigation of nickel aluminium bronze castings properties by degassing agent technique. IOP Conf. Ser. Mater. Sci. Eng. 2019, 469, 012037. [Google Scholar]
  2. Richardson, I. Guide to Nickel Aluminium Bronze for Engineers; Copper Development Association: McLean, VA, USA, 2016; p. 100. [Google Scholar]
  3. Ding, D.; Pan, Z.; van Duin, S.; Li, H.; Shen, C. Fabricating superior NiAl bronze components through wire arc additive manufacturing. Materials 2016, 9, 652. [Google Scholar] [CrossRef] [PubMed] [Green Version]
  4. Tang, C.H.; Cheng, F.T.; Man, H.C. Laser surface alloying of a marine propeller bronze using aluminium powder. Part II: Corrosion and erosion-corrosion synergism. Surf. Coat. Technol. 2006, 200, 2594–2601. [Google Scholar] [CrossRef]
  5. Murray, T.; Thomas, S.; Wu, Y.; Neil, W.; Hutchinson, C. Selective laser melting of nickel aluminium bronze. Addit. Manuf. 2020, 33, 101122. [Google Scholar] [CrossRef]
  6. Shen, C.; Pan, Z.; Ding, D.; Yuan, L.; Nie, N.; Wang, Y.; Luo, D.; Cuiuri, D.; van Duin, S.; Li, H. The influence of post-production heat treatment on the multi-directional properties of nickel-aluminum bronze alloy fabricated using wire-arc additive manufacturing process. Addit. Manuf. 2018, 23, 411–421. [Google Scholar] [CrossRef]
  7. Dharmendra, C.; Hadadzadeh, A.; Amirkhiz, B.S.; Janaki Ram, G.D.; Mohammadi, M. Microstructural evolution and mechanical behavior of nickel aluminum bronze Cu-9Al-4Fe-4Ni-1Mn fabricated through wire-arc additive manufacturing. Addit. Manuf. 2019, 30, 100872. [Google Scholar] [CrossRef]
  8. Dharmendra, C.; Amirkhiz, B.S.; Lloyd, A.; Ram, G.D.J.; Mohammadi, M. Wire-arc additive manufactured nickel aluminum bronze with enhanced mechanical properties using heat treatments cycles. Addit. Manuf. 2020, 36, 101510. [Google Scholar] [CrossRef]
  9. Gustmann, T.; Schwab, H.; Kühn, U.; Pauly, S. Selective laser remelting of an additively manufactured Cu-Al-Ni-Mn shape-memory alloy. Mater. Des. 2018, 153, 129–138. [Google Scholar] [CrossRef]
  10. Liu, S.; Ding, Y. Wire-based direct metal deposition with Ti6Al4V. In Proceedings of the SPIE LASE, San Francisco, CA, USA, 4 March 2019; p. 17. [Google Scholar]
  11. Akbari, M.; Ding, Y.; Kovacevic, R. Process development for a robotized laser wire additive manufacturing. In Proceedings of the ASME 2017 12th International Manufacturing Science and Engineering Conference, MSEC 2017 collocated with the JSME/ASME 2017 6th International Conference on Materials and Processing, Los Angeles, CA, USA, 4–8 June 2017; Volume 2, pp. 1–11. [Google Scholar]
  12. Ding, Y.; Akbari, M.; Kovacevic, R. Process planning for laser wire-feed metal additive manufacturing system. Int. J. Adv. Manuf. Technol. 2018, 95, 355–365. [Google Scholar] [CrossRef]
  13. Liu, S.; Liu, W.; Harooni, M.; Ma, J.; Kovacevic, R. Real-time monitoring of laser hot-wire cladding of Inconel 625. Opt. Lasers Technol. 2014, 62, 124–134. [Google Scholar] [CrossRef]
  14. Zhang, Z.; Kong, F.; Kovacevic, R. Laser hot-wire cladding of Co-Cr-W metal cored wire. Opt. Lasers Eng. 2020, 128, 105998. [Google Scholar] [CrossRef]
  15. Han, Q.; Li, Y.; Zhang, G. Online Control of Deposited Geometry of Multi-layer Multi-bead Structure for Wire and Arc Additive Manufacturing. In Transactions on Intelligent Welding Manufacturing; Chen, S., Zhang, Y., Feng, Z., Eds.; Springer: Singapore, 2018; pp. 85–93. [Google Scholar]
  16. Pangsrivinij, S.; McGuffin-Cawley, J.; Quinn, R.; Narayanan, B.; Zhang, S.; Denney, P. Calculation of Energy Balance and Efficiency in Laser Hot Wire (LHW) Cladding Process. In Proceedings of the International Symposium on Flexible Automation ISFA 2016, Cleveland, OH, USA, 1–3 August 2016; Volume 2. [Google Scholar]
  17. Shiqing, Z.; Peng, W.; Zhenhua, F.; Jiguo, S. Numerical simulation of wire temperature field for prediction of wire transfer stability in laser hot wire welding. In Proceedings of the ICALEO 2013—32nd Congress on Applications of Lasers & Electro-Optics, Miami, FL, USA, 6–10 October 2013; Volume 294, pp. 294–301. [Google Scholar]
  18. Peng, W.; Jiguo, S.; Shiqing, Z.; Gang, W. Control of wire transfer behaviors in hot wire laser welding. Int. J. Adv. Manuf. Technol. 2016, 83, 2091–2100. [Google Scholar] [CrossRef]
  19. Liu, W.; Ma, J.; Liu, S.; Kovacevic, R. Experimental and numerical investigation of laser hot wire welding. Int. J. Adv. Manuf. Technol. 2015, 78, 1485–1499. [Google Scholar] [CrossRef]
  20. Nie, Z.; Wang, G.; McGuffin-Cawley, J.D.; Narayanan, B.; Zhang, S.; Schwam, D.; Kottman, M.; Rong, Y. Experimental study and modeling of H13 steel deposition using laser hot-wire additive manufacturing. J. Mater. Process. Technol. 2016, 235, 171–186. [Google Scholar] [CrossRef]
  21. ASTM International. B148-18 Standard Specifications for Aluminum-Bronze Sand Castings; ASTM International: West Conshohocken, PA, USA, 2018. [Google Scholar]
  22. Naval Sea Systems Command. Military Specification: Electrodes and Rods- Welding, Bare, Solid Copper Alloy; Naval Sea Systems Command: Washington, DC, USA, 1986. [Google Scholar]
  23. ASTM International. B171/B171M-18 Standard Specification for Copper-Alloy Plate and Sheet for Pressure Vessels, Condensers, and Heat Exchangers; ASTM International: West Conshohocken, PA, USA, 2018. [Google Scholar]
  24. ASTM International. B150/B150M-19 Standard Specification for Aluminum Bronze Rod, Bar, and Shapes; ASTM International: West Conshohocken, PA, USA, 2019. [Google Scholar]
  25. ASTM International. E1269-11(2018) Standard Test Method for Determining Specific Heat Capacity by Differential Scanning Calorimetry; ASTM International: West Conshohocken, PA, USA, 2018. [Google Scholar]
  26. ASTM International. E1461-13 Standard Test Method for Thermal Diffusivity by the Flash Method; ASTM International: West Conshohocken, PA, USA, 2013. [Google Scholar]
  27. ASTM International. E21-20 Standard Test Methods for Elevated Temperature Tension Tests of Metallic Materials; ASTM International: West Conshohocken, PA, USA, 2017. [Google Scholar]
  28. Copper Alliance; C95800; Copper Development Association Inc.: McLean, VA, USA, 2020; Volume 10, pp. 1–12.
  29. Gouge, M.; Michaleris, P. (Eds.) Thermo-Mechanical Modeling of Additive Manufacturing, 1st ed.; Butterworth-Heinemann: Oxford, UK, 2017. [Google Scholar]
  30. Autodesk Inc. Netfabb Local Simulation Keyword User Manual; Autodesk Inc.: San Rafael, CA, USA, 2017. [Google Scholar]
  31. Gouge, M.F.; Heigel, J.C.; Michaleris, P.; Palmer, T.A. Modeling forced convection in the thermal simulation of laser cladding processes. Int. J. Adv. Manuf. Technol. 2015, 79, 307–320. [Google Scholar] [CrossRef]
  32. Li, C.; Denlinger, E.R.; Gouge, M.; Irwin, J.E.; Michaleris, P. Numerical verification of an Octree mesh coarsening strategy for simulating additive manufacturing processes. Addit. Manuf. 2019, 30, 100903. [Google Scholar] [CrossRef]
Figure 1. Measured temperature-dependent specific heat and calculated thermal conductivity from test specimens fabricated by three DED processes. These values are used in corresponding simulations.
Metals 11 01023 g001
Figure 2. Measured temperature-dependent mechanical properties from test specimen fabricated by LHW DEDAM.
Metals 11 01023 g002
Figure 3. The robotic LHW system used in this study.
Metals 11 01023 g003
Figure 4. Configuration and dimensions of the 40-layer block used for simulation (all dimensions in mm). Points T1–T3 are selected to demonstrate temperature evolution, and Points D1–D3 are selected to demonstrate vertical displacement prediction. The left end of the substrate (where D1 resides) represents where the simulated clamps were placed. (a) Top view. (b) Side view. (c) Bottom view of the substrate. (d) Sketch of the block part on substrate.
Metals 11 01023 g004
Figure 5. Temperature comparison between using the triangular wave path and simplified straight laser path for a single layer deposition. Temperature dependent material properties from LHW test specimens are used in the simulation.
Metals 11 01023 g005
Figure 6. Comparison of predicted vertical displacement at point D3 between using the triangular wave path and simplified straight laser path for a single layer deposition. Temperature dependent material and mechanical properties from LHW specimens are used in the simulation.
Metals 11 01023 g006
Figure 7. Netfabb adaptive meshing.
Metals 11 01023 g007
Figure 8. Comparison of temperature history at three selected locations (Points T1–T3) among LHW, GMAW, PFDED, and Constant. The red dash line marks the solidus temperature and the vertical black line marks the end of deposition.
Metals 11 01023 g008
Figure 9. Comparison of simulated residual stress under LHW–LHW, GMAW–LHW, PFDED–LHW, and Constant–Constant.
Metals 11 01023 g009
Figure 10. Comparison of simulated plastic strain under LHW–LHW, GMAW–LHW, PFDED–LHW, and Constant–Constant.
Metals 11 01023 g010
Figure 11. Comparison of simulated distortion under LHW–LHW, GMAW–LHW, PFDED–LHW, and Constant–Constant at three locations: (a) D1, (b) D2, and (c) D3. The vertical solid line indicates the substrate reaching melting temperature by the Constant at Point T1 (see Figure 8), and the vertical dashed line indicates the end of deposition.
Metals 11 01023 g011
Figure 12. Comparison of predicted vertical displacement at Point D3 between LHW–LHW and LHW–Constant to illustrate the effect of temperature-dependent mechanical properties on distortion prediction. The vertical solid line indicates the substrate reaching melting temperature under the Constant (Figure 8), and the vertical dashed line indicates the end of deposition.
Metals 11 01023 g012
Table 1. Measurements of chemical compositions of as-built DEDAM test specimens. C95800 (Cast NAB) composition [21] and MIL-CuNiAl wire feedstock [22] are included as a reference.
CompositionsCuPbFeNiAlMnSiFeedstock Material
C95800 Specification>79.0<0.033.5–4.54.0–5.08.5–9.50.8–1.5<0.10N/A
MIL-CuNiAl SpecificationRemainder<0.203.0–5.04.0–5.58.5–9.50.6–3.5n/aN/A
GMAW Specimen82.630.033.114.359.060.820.03MIL-CuNiAl
PFDED Specimen81.6n/a4.034.608.581.190.03CU-172-C62
LHW DEDAM Specimen81.7n/a3.295.408.670.810.11MIL-CuNiAl
Table 2. Density of specimens fabricated from three DED processes.
PFDED7.381 kg/m3
LHW7.550 kg/m3
GMAW7.482 kg/m3
Table 3. Temperature-independent properties of C98500 Cast NAB [28].
Latent Heat of Fusion230 kJ/kg
Solidus Temperature1043 °C
Liquidus Temperature1060 °C
Electrical Conductivity7% IACS
Electrical Resistivity 2.428 × 10⁻⁷ Ω · m
Table 4. LHW process parameters used for simulation.
Hot-Wire Parameters
Current Supplied100 A
Average Voltage2.26 V
Wire Feed Speed60 mm/s
Wire Diameter1.14 mm
Wire Length with Current Applied
(from contact tip to melt pool)
22.5 mm
Laser Parameters
Laser Radius2 mm
Power9 kW
Beam Scanning ShapeLine
Beam Scanning Frequency7.5 Hz
Beam Scanning Width9 mm
Deposition Parameters
Hatch Step5 mm
Layer Step2 mm
Travel Speed7 mm/s
Ambient Temperature20 °C
Table 5. Netfabb adaptive time step parameters.
Begin Time0 s
End Time1850 s
Initial Time Increment0.001 s
Maximum Allowable Time Increment10 s
Min Allowable Time Increment0.00001 s
Time Tolerance (1)2.5
Maximum Number of Cutbacks per Increment10
Maximum Total Number of Increments Allowed99999
Maximum Iterations20
Maximum Residual1020
(1) Time tolerance is a dimensionless value that represents how quickly the time steps increase to the maximum value during cooling.
Publisher’s Note: MDPI stays neutral with regard to jurisdictional claims in published maps and institutional affiliations.

