The FeSiC system is a basic system for steels and cast irons and was chosen as a target alloy, due to several specific limitations and possibilities regarding phase and microstructure evolution in the LPBF process. With this alloy system, several effects like thermal history and liquid/solid solution dissolving can be investigated, which help to understand different process sequences in LPBF on the basis of chemical homogeneity and microstructure distribution. The system was limited to two important elements used in different steels and cast iron: Si and C.
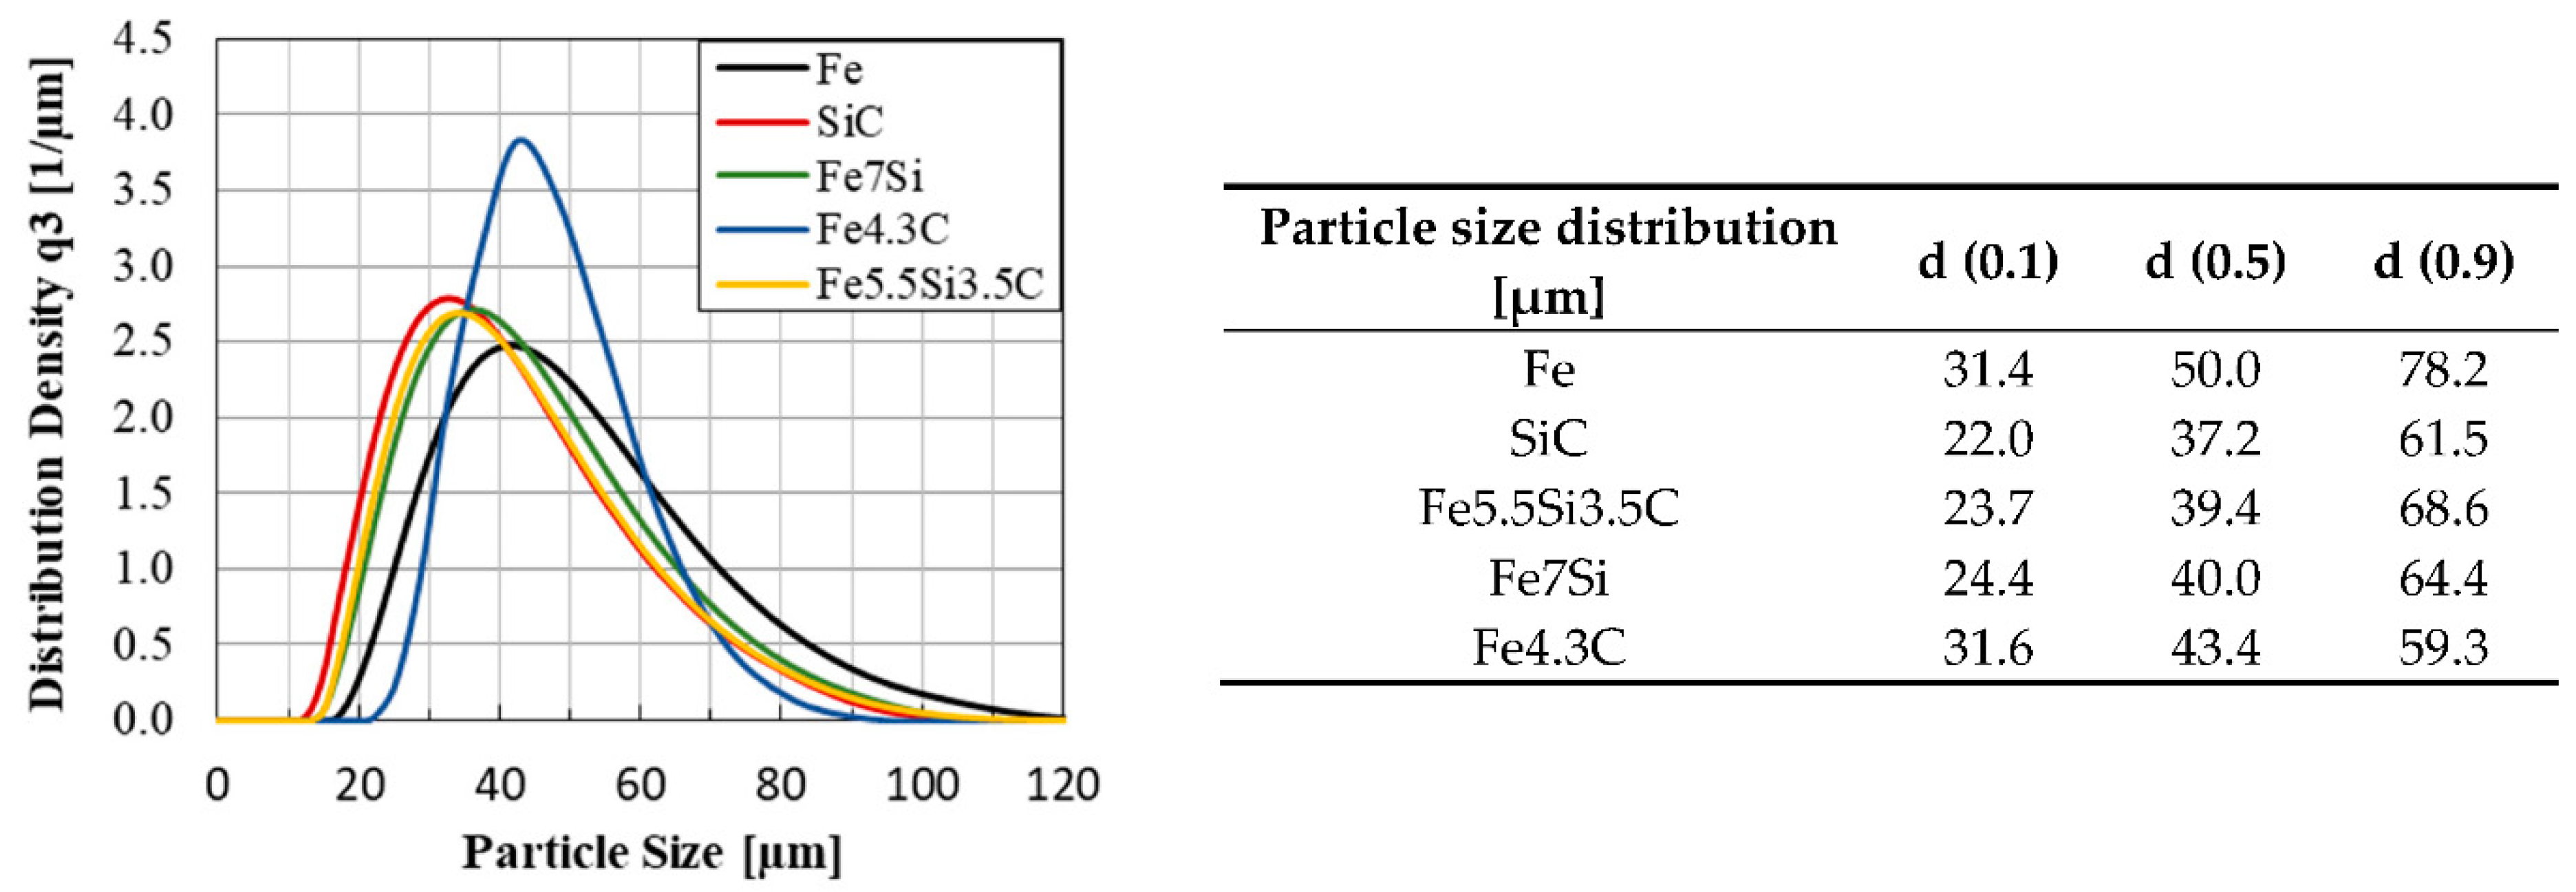
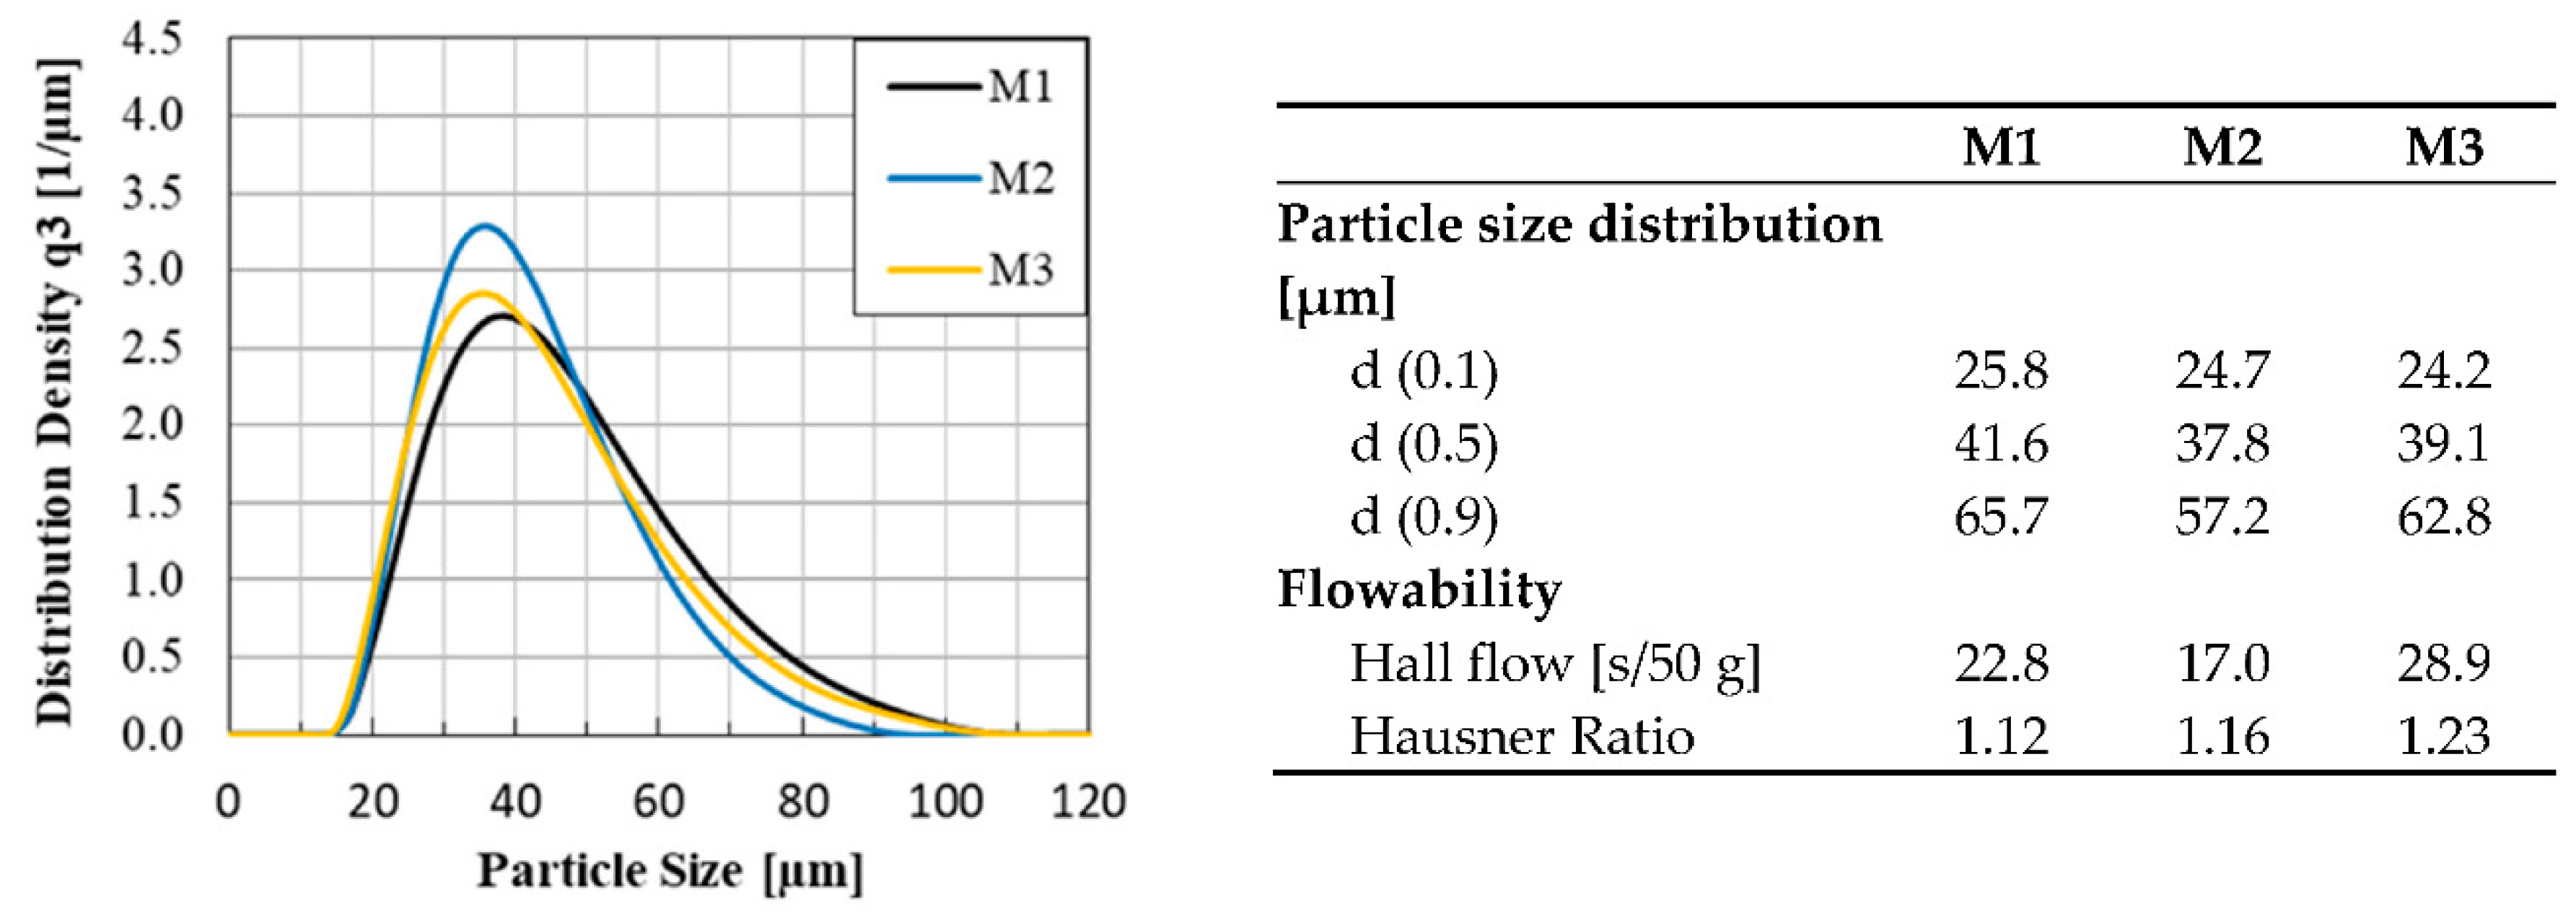
In addition to the influence of the alloying elements on the microstructure evolution, the composition of the powder blends is also exerting great influence. Therefore, the blends are produced using different raw alloys (pure Fe, binary and ternary ferroalloys) so that their impact on the chemical homogeneity of the LPBF-manufactured samples can be investigated.
3.6. Chemical Composition and Homogeneity
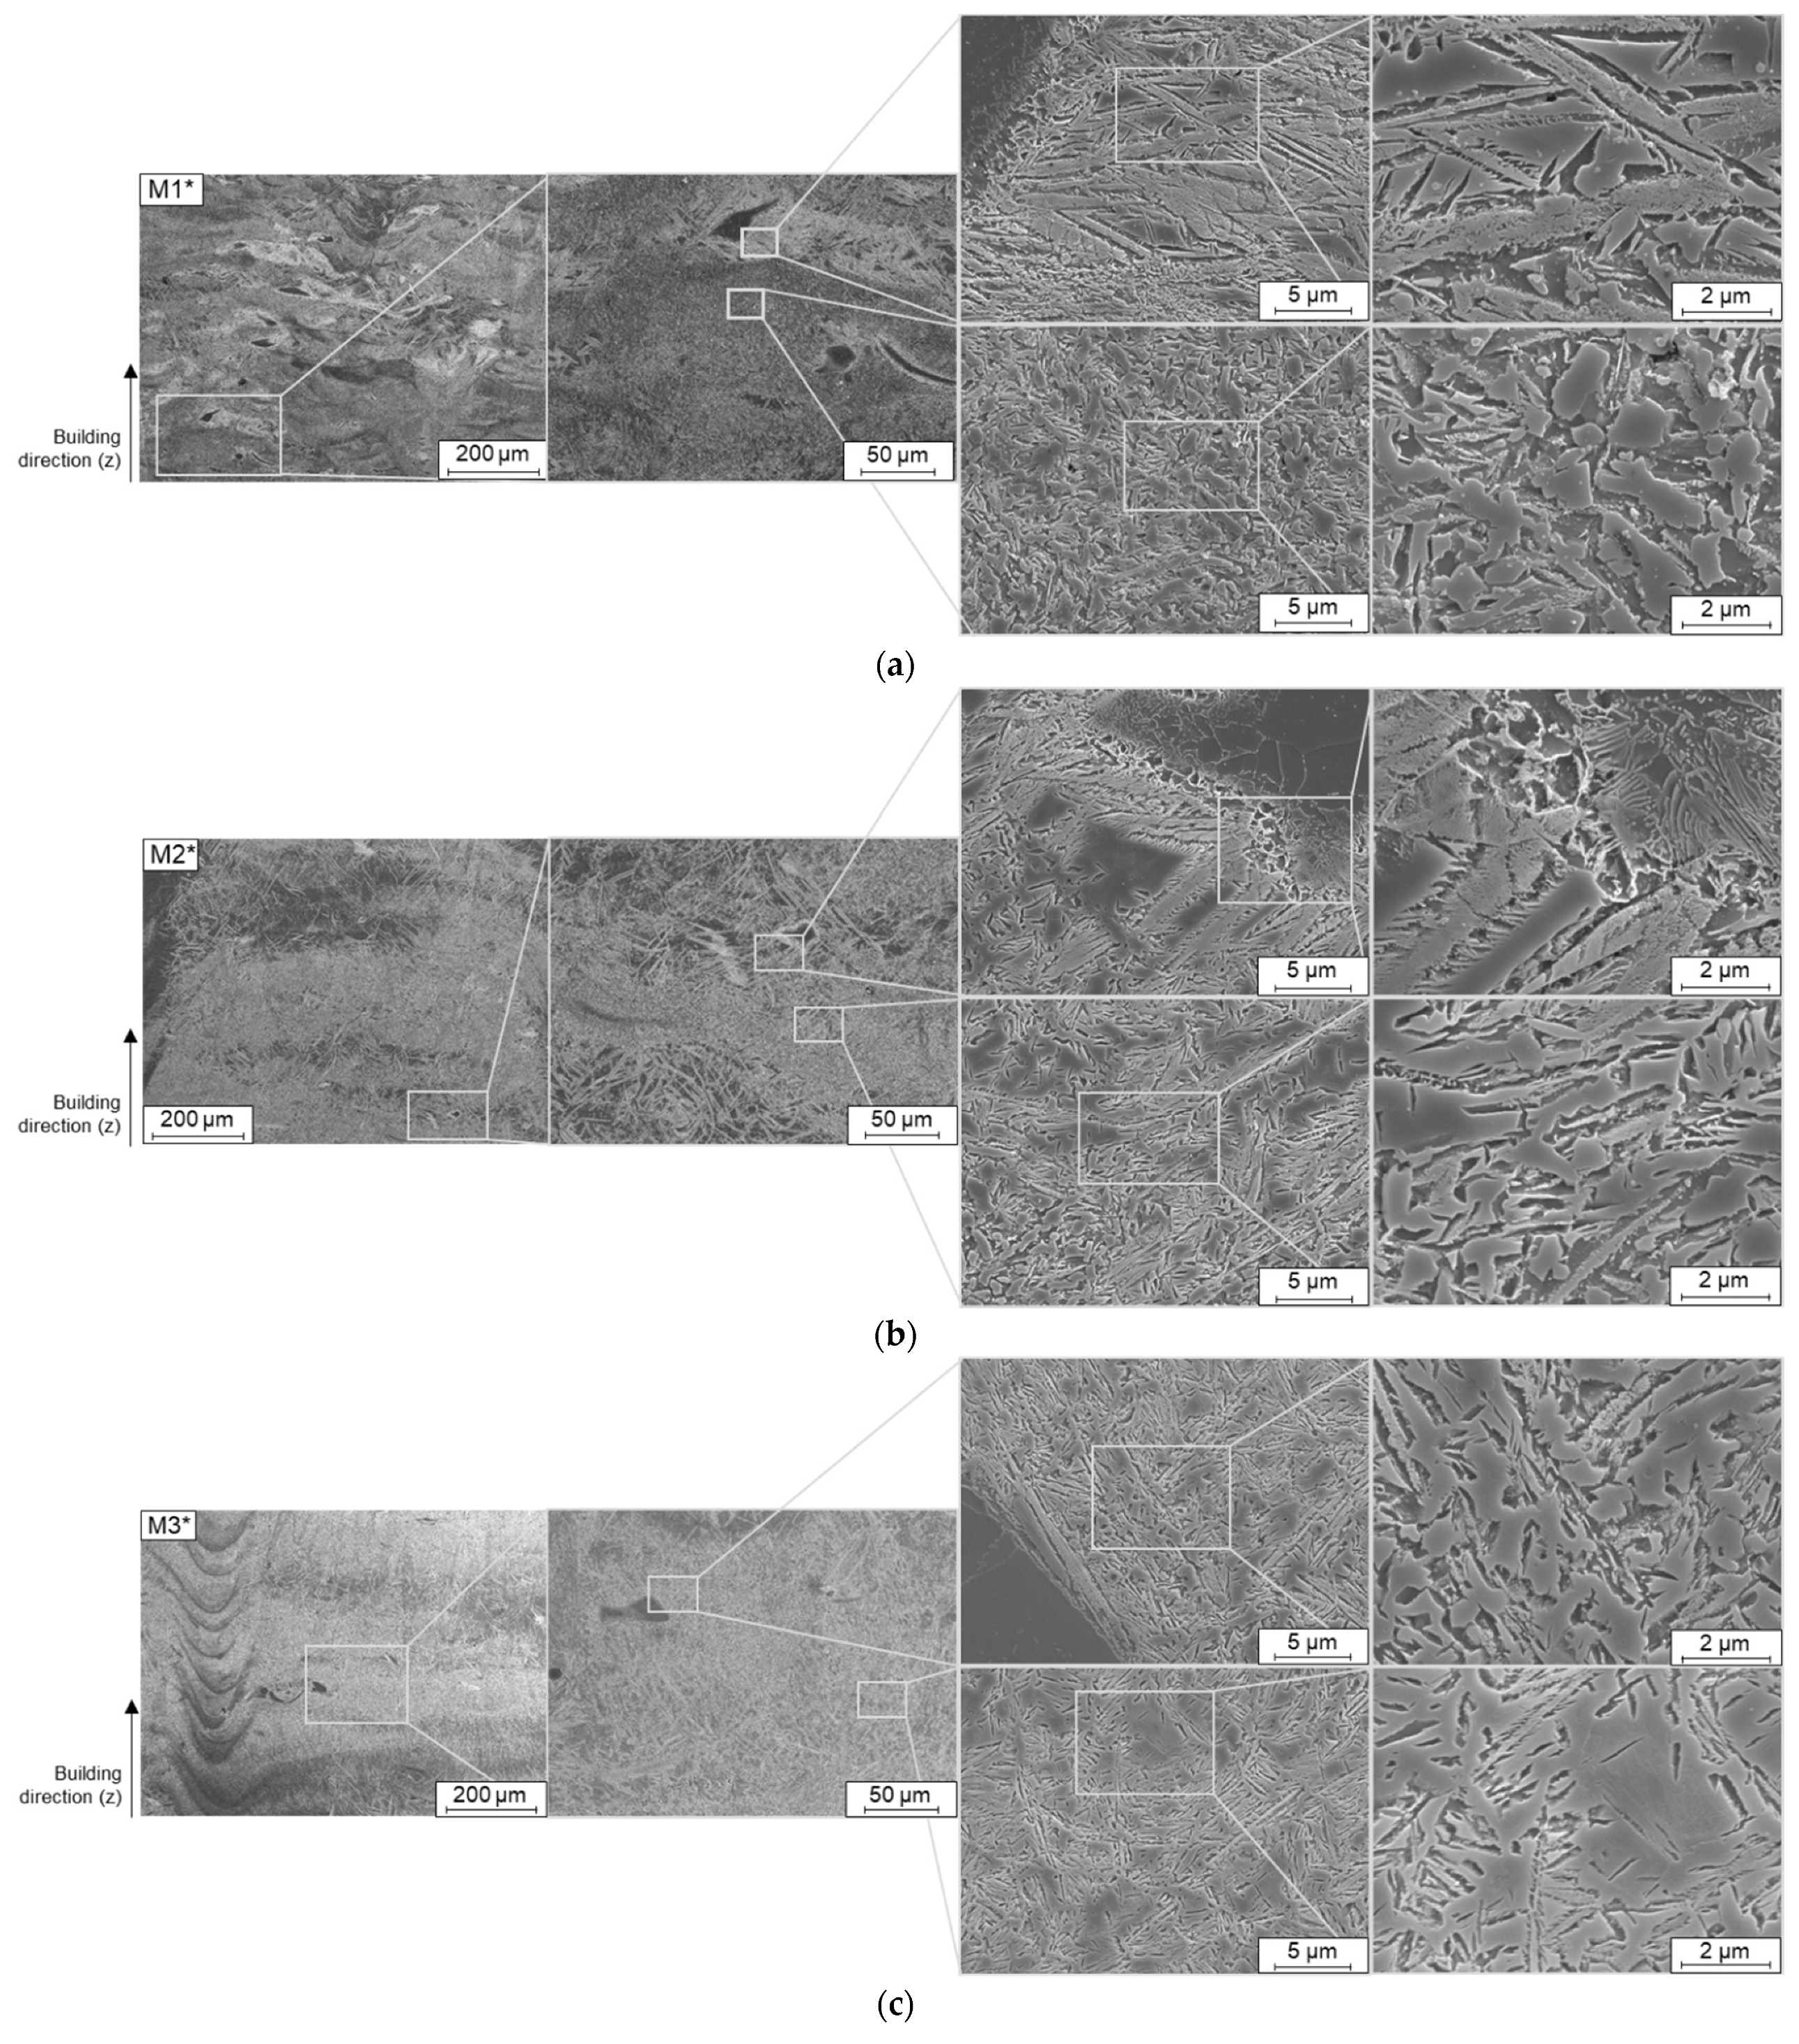
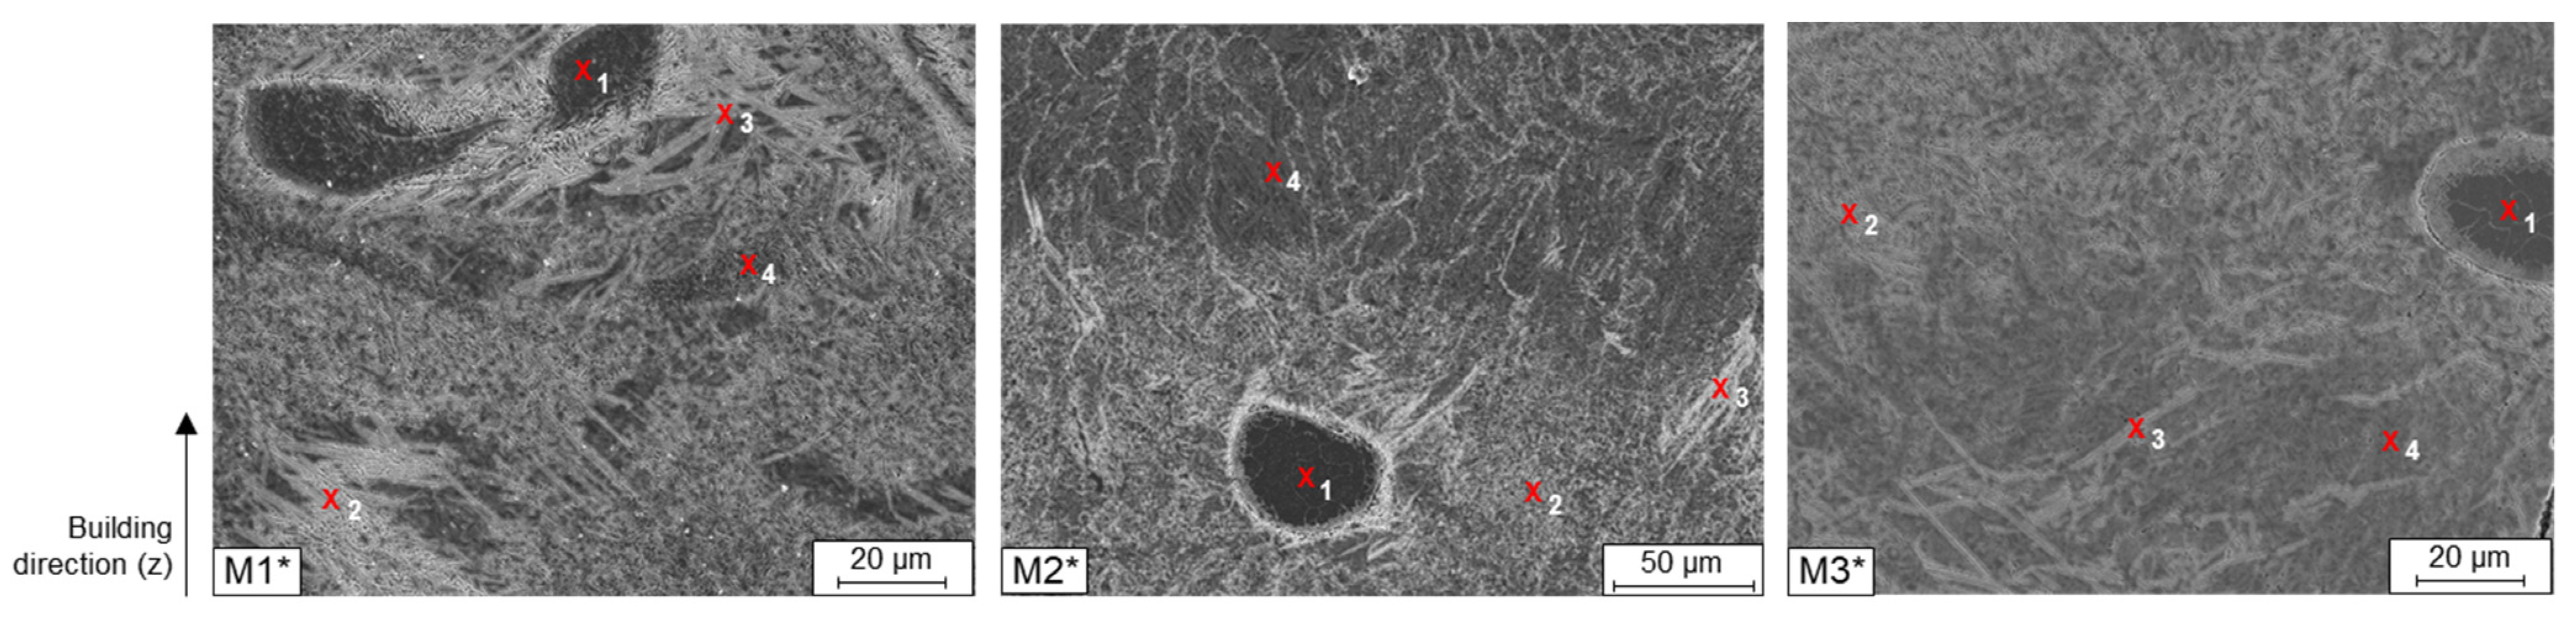
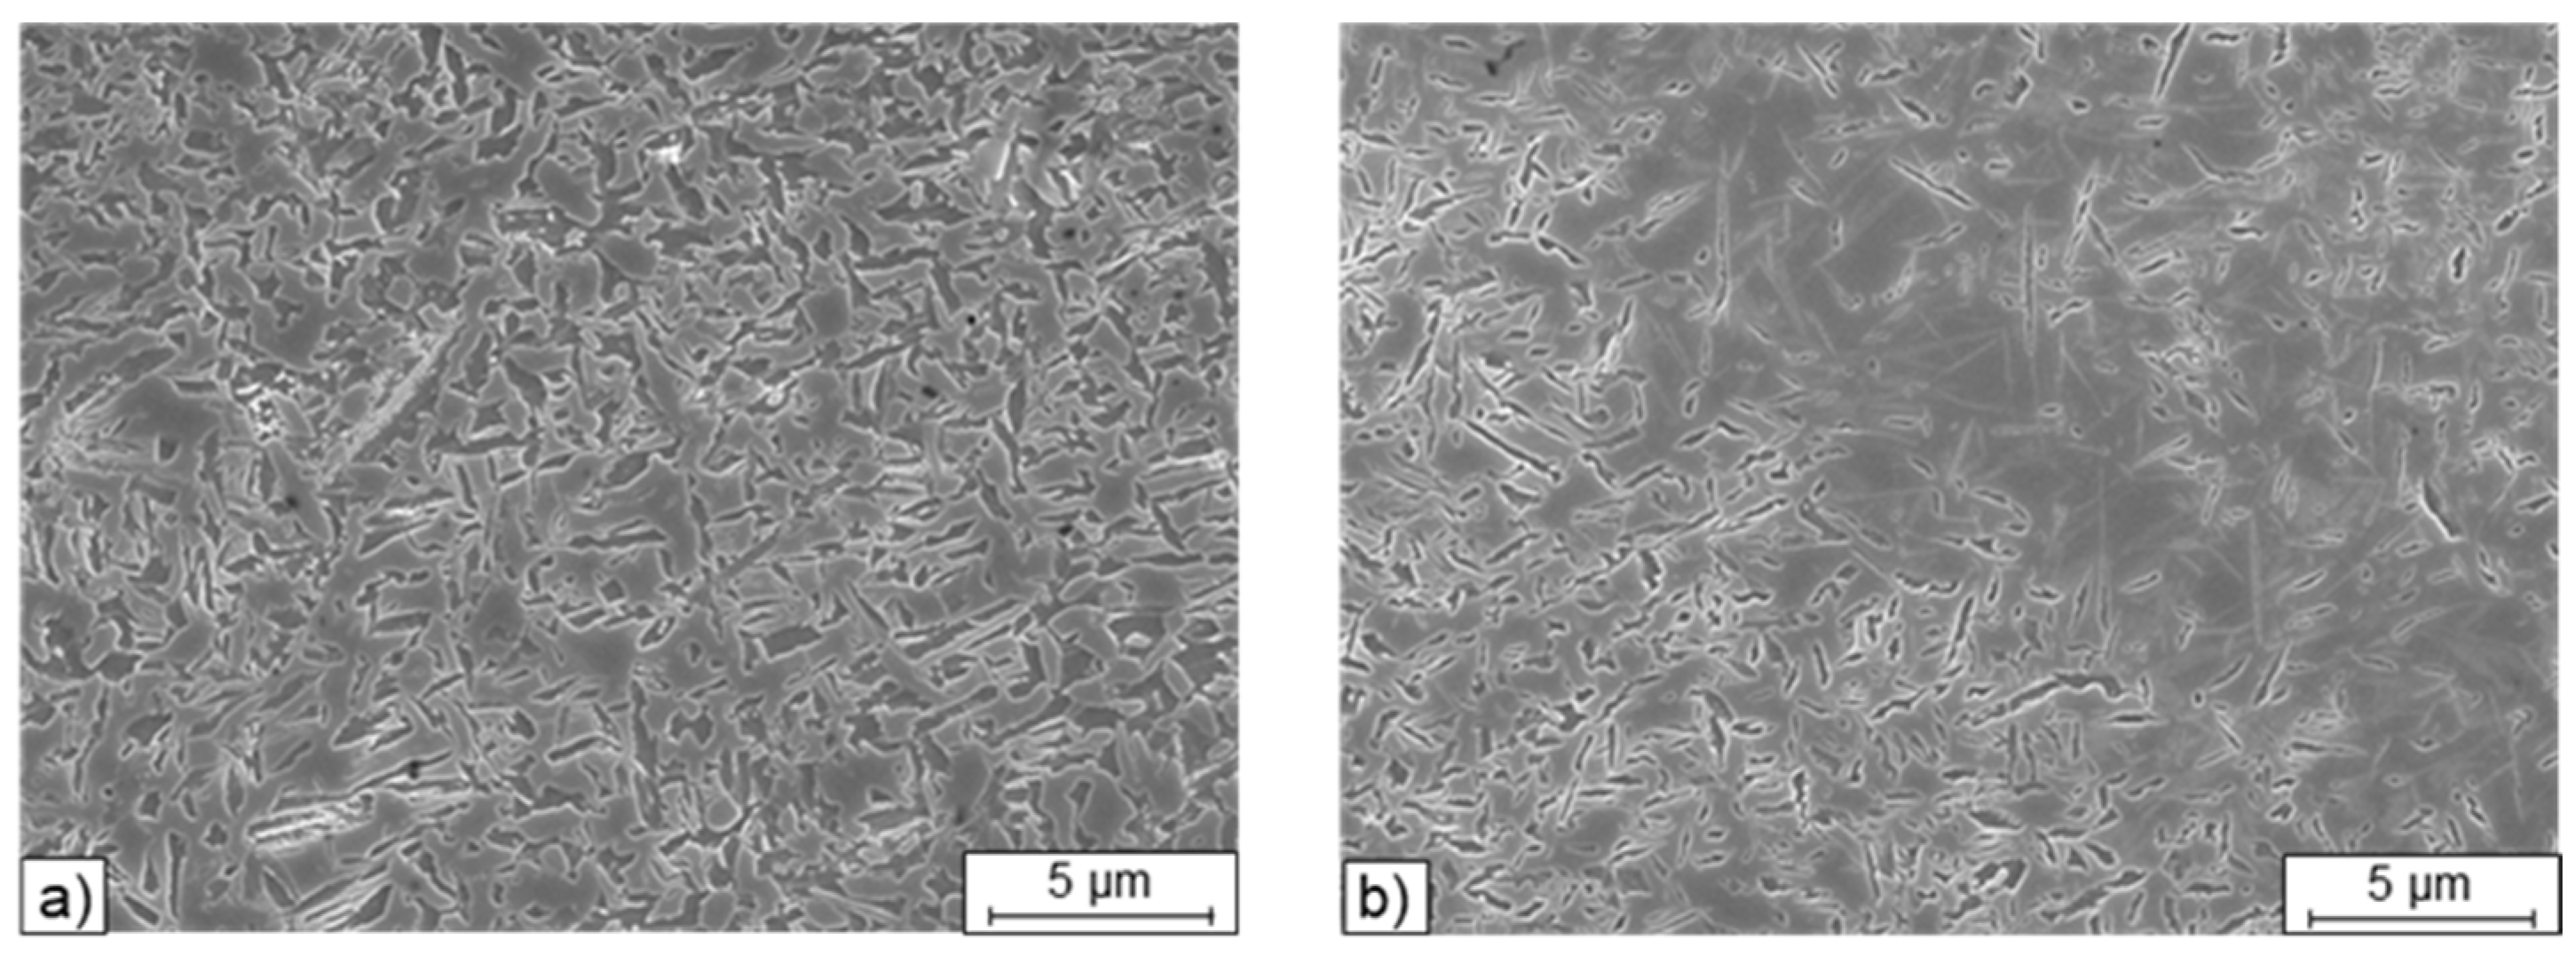
When examining the individual microstructures by means of SEM, unmolten particles were noticed in all blends (
Figure 6). With a closer examination by EDS these particles could be identified as not fully molten, pure Fe particles. In
Table 4 it can be seen that the Si and C contents at the locations marked with 1 drop down to 0 wt. % and the Fe content rises to almost 97 wt. % in all three used blends. Around the non-melted particles at the marked points 2–4, the Fe and Si contents fluctuate evenly.
The particles seen in
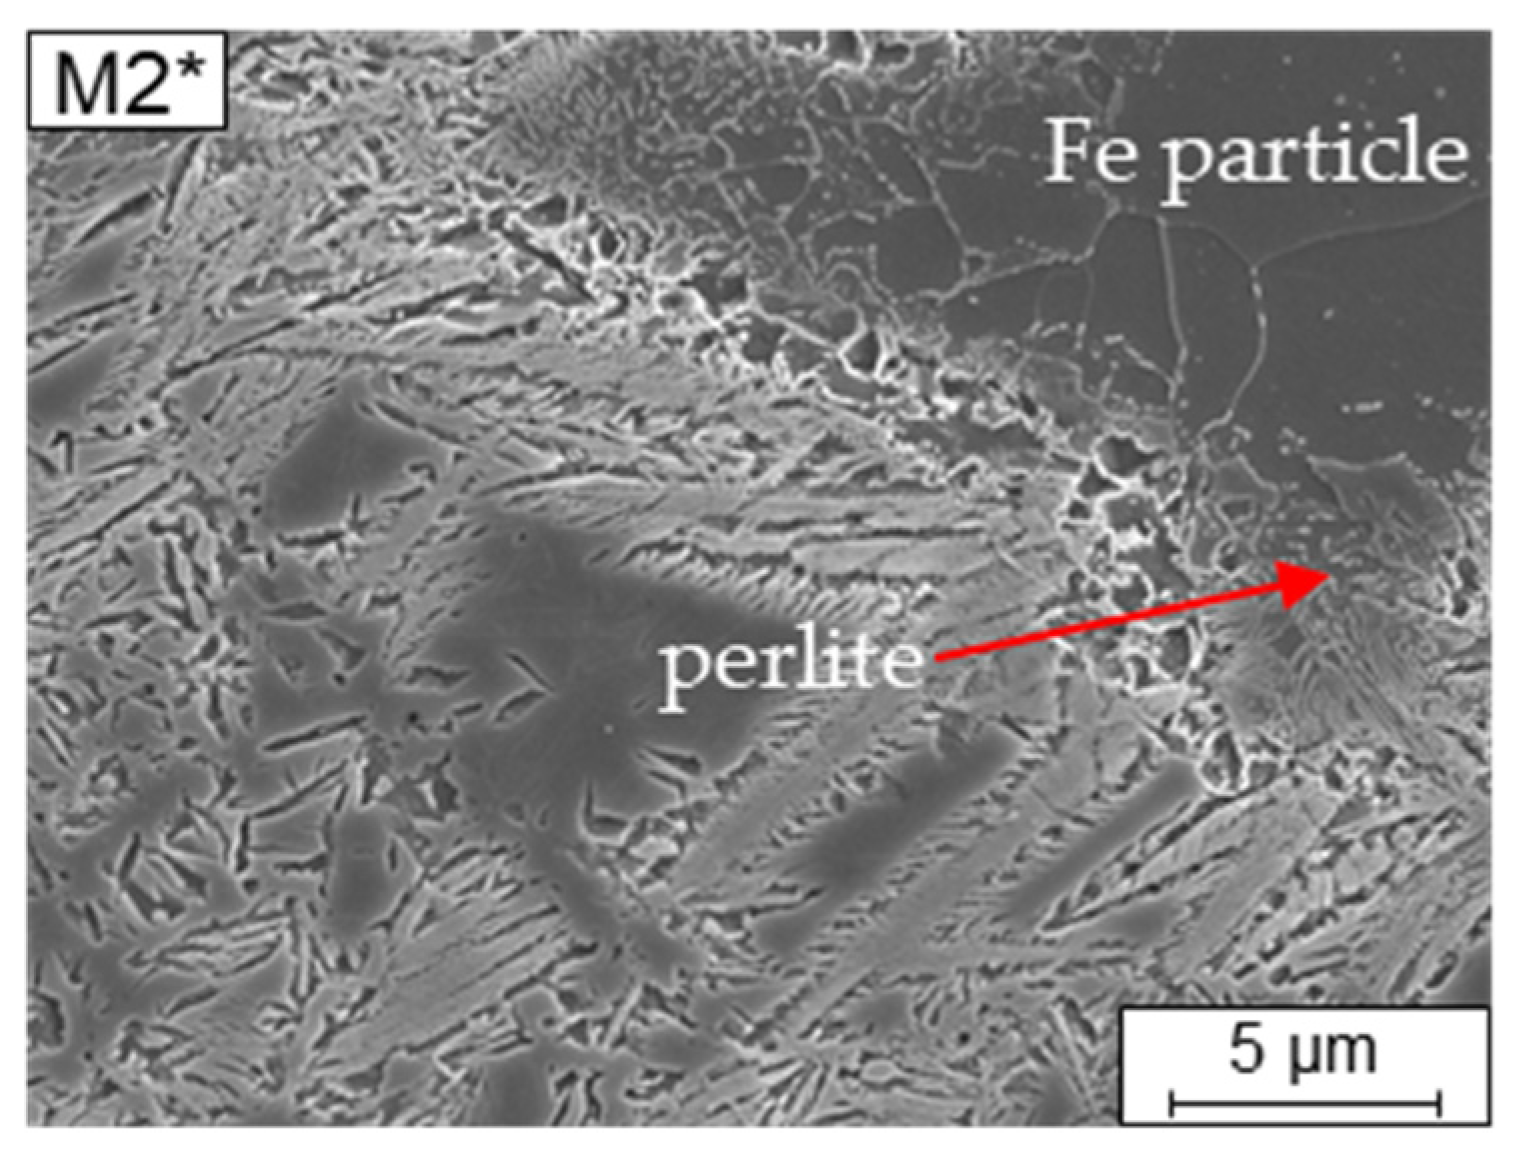
Figure 6 are partially melted during the short residence time of the melt pool during the LPBF process. This can be seen in the stream-lined drop shape of the remaining Fe particles in M1*. The diffusion zones around the partly molten particles can be identified as bright areas in the SE contrast. Near the unmolten Fe-particles a predominantly bainitic microstructure is formed owing to the locally decreased C and Si content (
Table 4). The re-melting of an already solidified layer will happen twice at a maximum. Therefore, the Fe-particle act like Si and C content drops for the surrounding matrix, depleting predominantly C in their surroundings. Consequently, a changed microstructure morphology can be seen in the transition zones. Additionally, one can observe an internal seam in the unmolten Fe-particles due to C diffusing into the Fe particle during the LPBF process, increasing the local C content. Because of the carbon lacking in the Fe-particle a mainly ferritic microstructure can be observed (
Figure 7) in the particle and a seam of bainite and perlite is formed due to the carbon diffusing into the particle from the melt and solidified surrounding material. This area then is suffering from a carbon depletion and is showing a different transformation behavior either.
During cooling a lower bainite microstructure with carbides is achieved. Because of the intrinsic heat treatment [
44] by adding new layers being molten by the laser, the temperature interval of the solidified material is kept for some time in the temperature field of the bainitic transformation. Thus, bainite not only is formed during continuous cooling but also isothermally during the subsequent time when the temperature is kept within the temperature field of bainitic transformation because of the intrinsic heat treatment occurring during layered manufacturing.
The microstructure over all is not perfectly homogeneous. Because of the melt pool movement, it could be seen, that with changing direction of laser movement at each exposed layer a predominant microstructure alignment has happened due to directed solidification. Besides, it seems to make a distinct difference if already solidified material is remolten and solidified and then intrinsically heat treated afterwards. Therefore, a mixed microstructure is derived consisting of martensite, austenite and bainite in the matrix inheriting some directed orientation from laser passage during exposure. Additionally, microstructure is impacted by chemical inhomogeneity that mainly appear in the vicinity of poorly or unmolten Fe-particles.
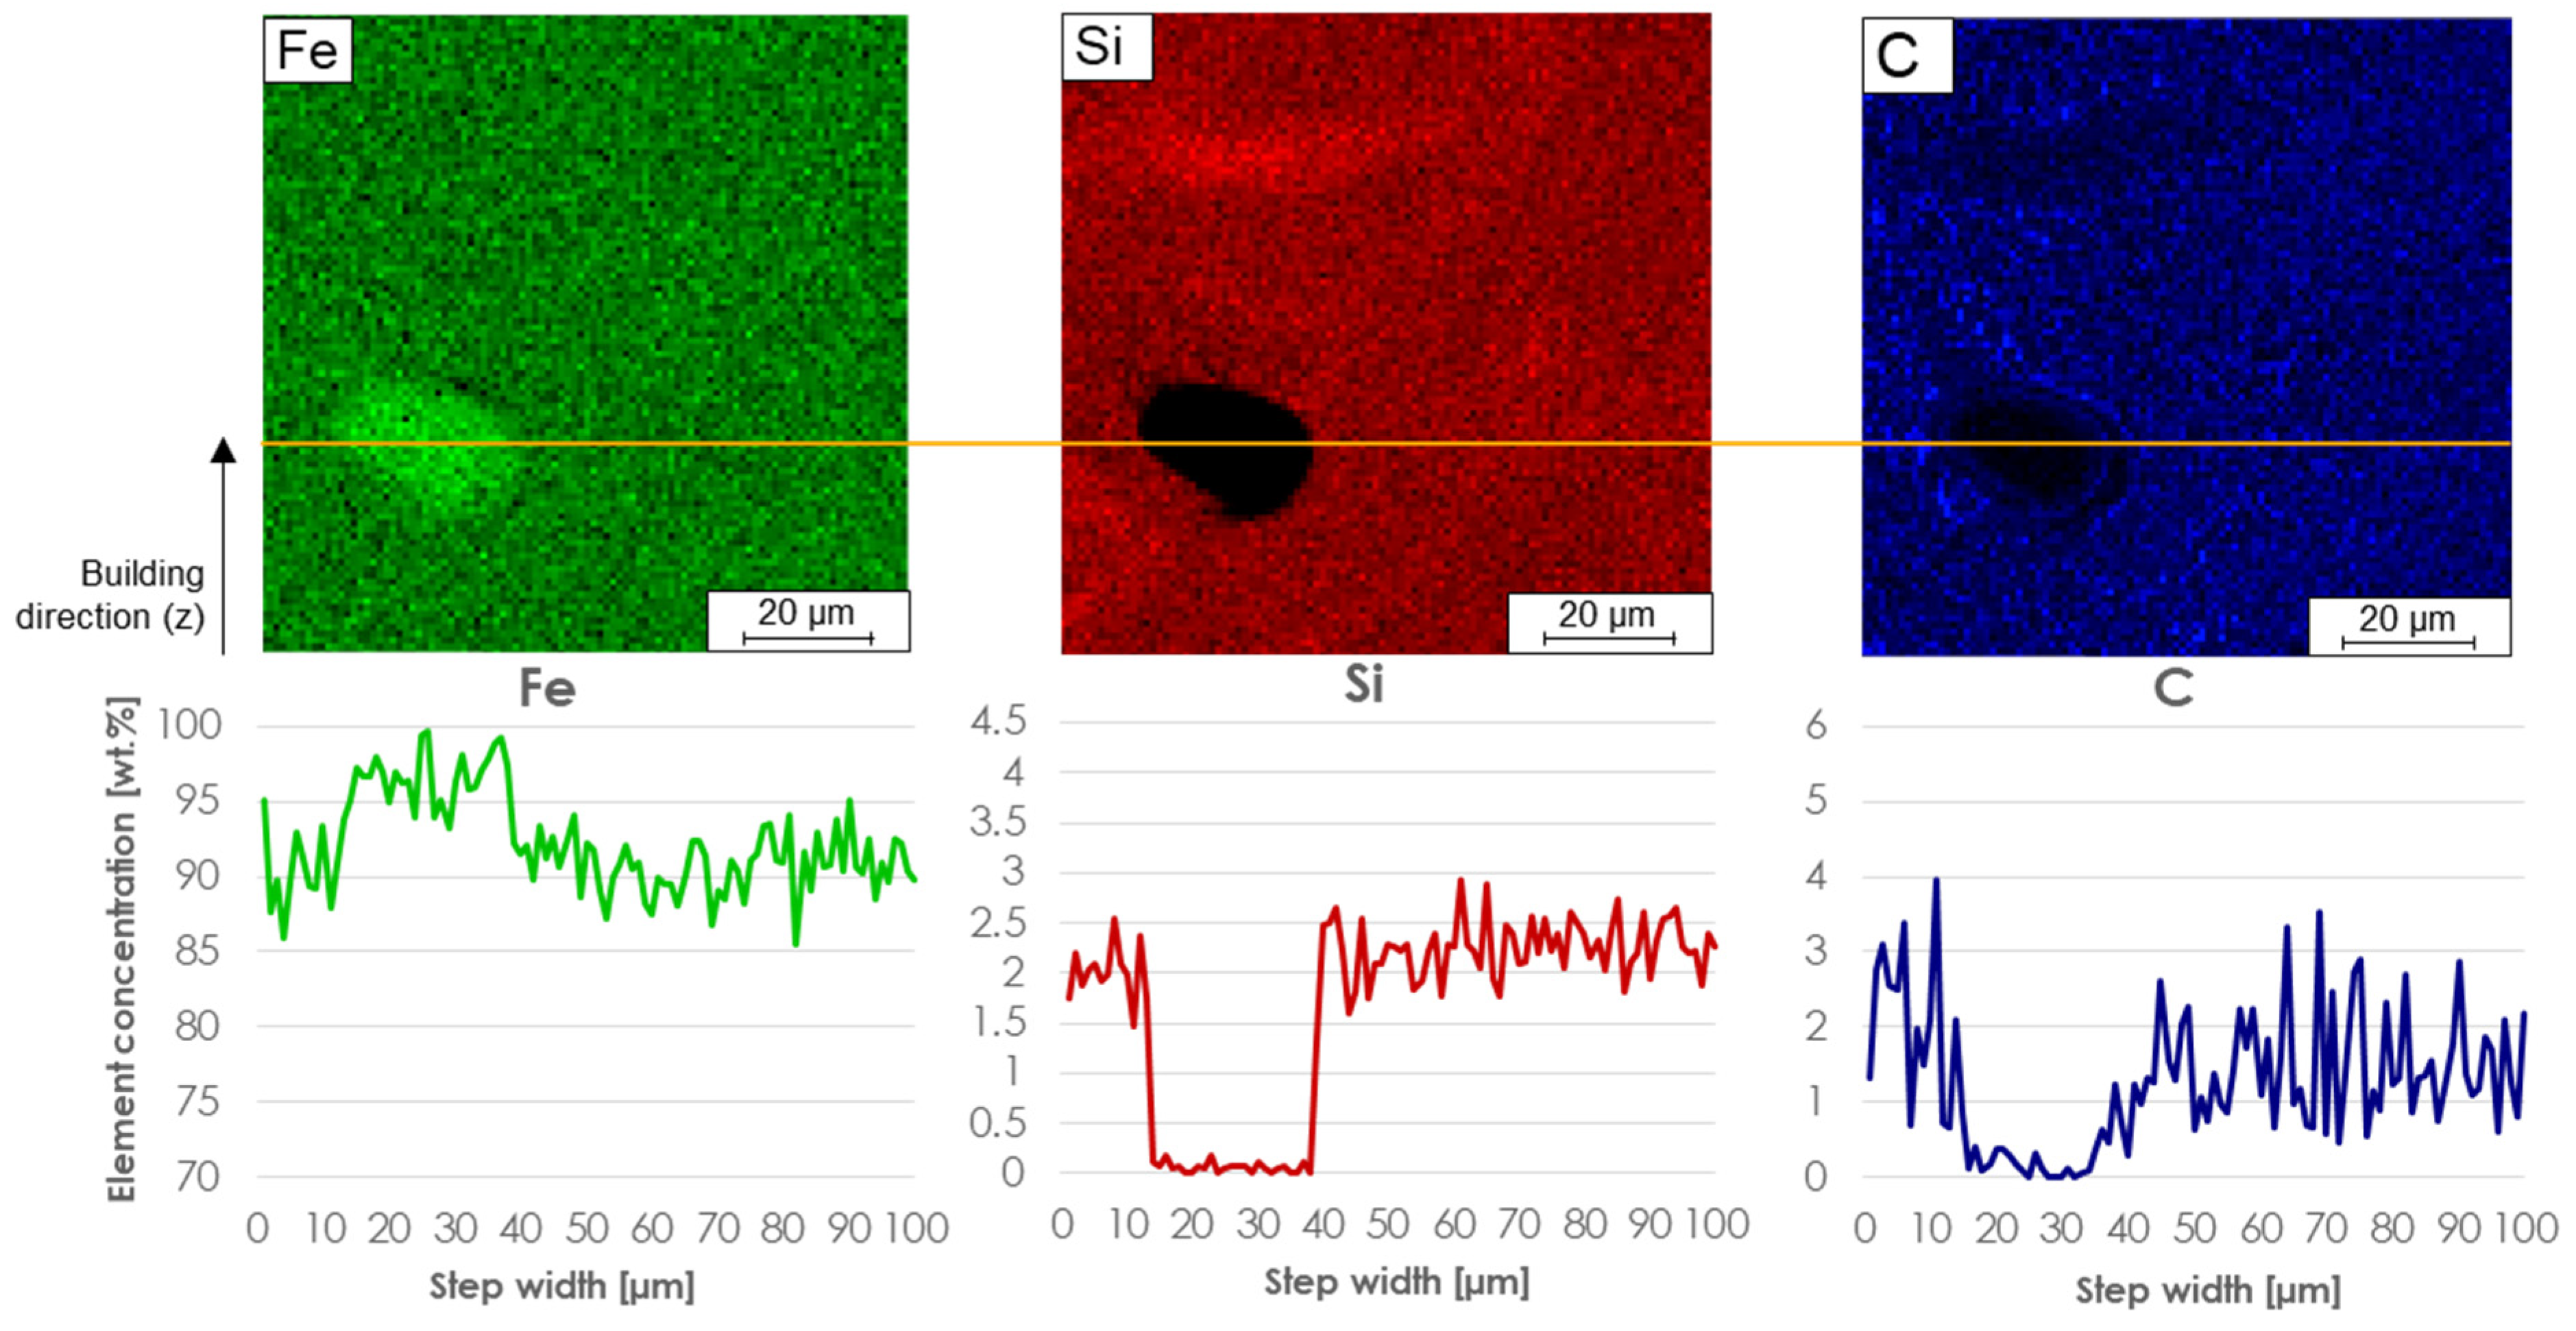
To determine the local chemical element distribution in an area surrounding the unmelted Fe particles, micro probe mappings (wavelength dispersive x-ray spectroscopy) were carried out (
Figure 8). The Fe particles are the only particles that were not dissolved during the LPBF densification. These can be found in all three samples.
Figure 8 shows a line scan (plotted in orange) of an example particle from M3*, where it is visible that that the Fe value on such a particle increases, but the Si and C values decrease to 0 wt. %. This eliminates the possibility that it is anything other than a pure Fe particle. The line scan also shows that around the particle the element distribution of all three elements fluctuate but are present everywhere. Compared to the other elements, the C value varies strongly between 0.5 and 4 wt. % in the environment of an unmelted particle.
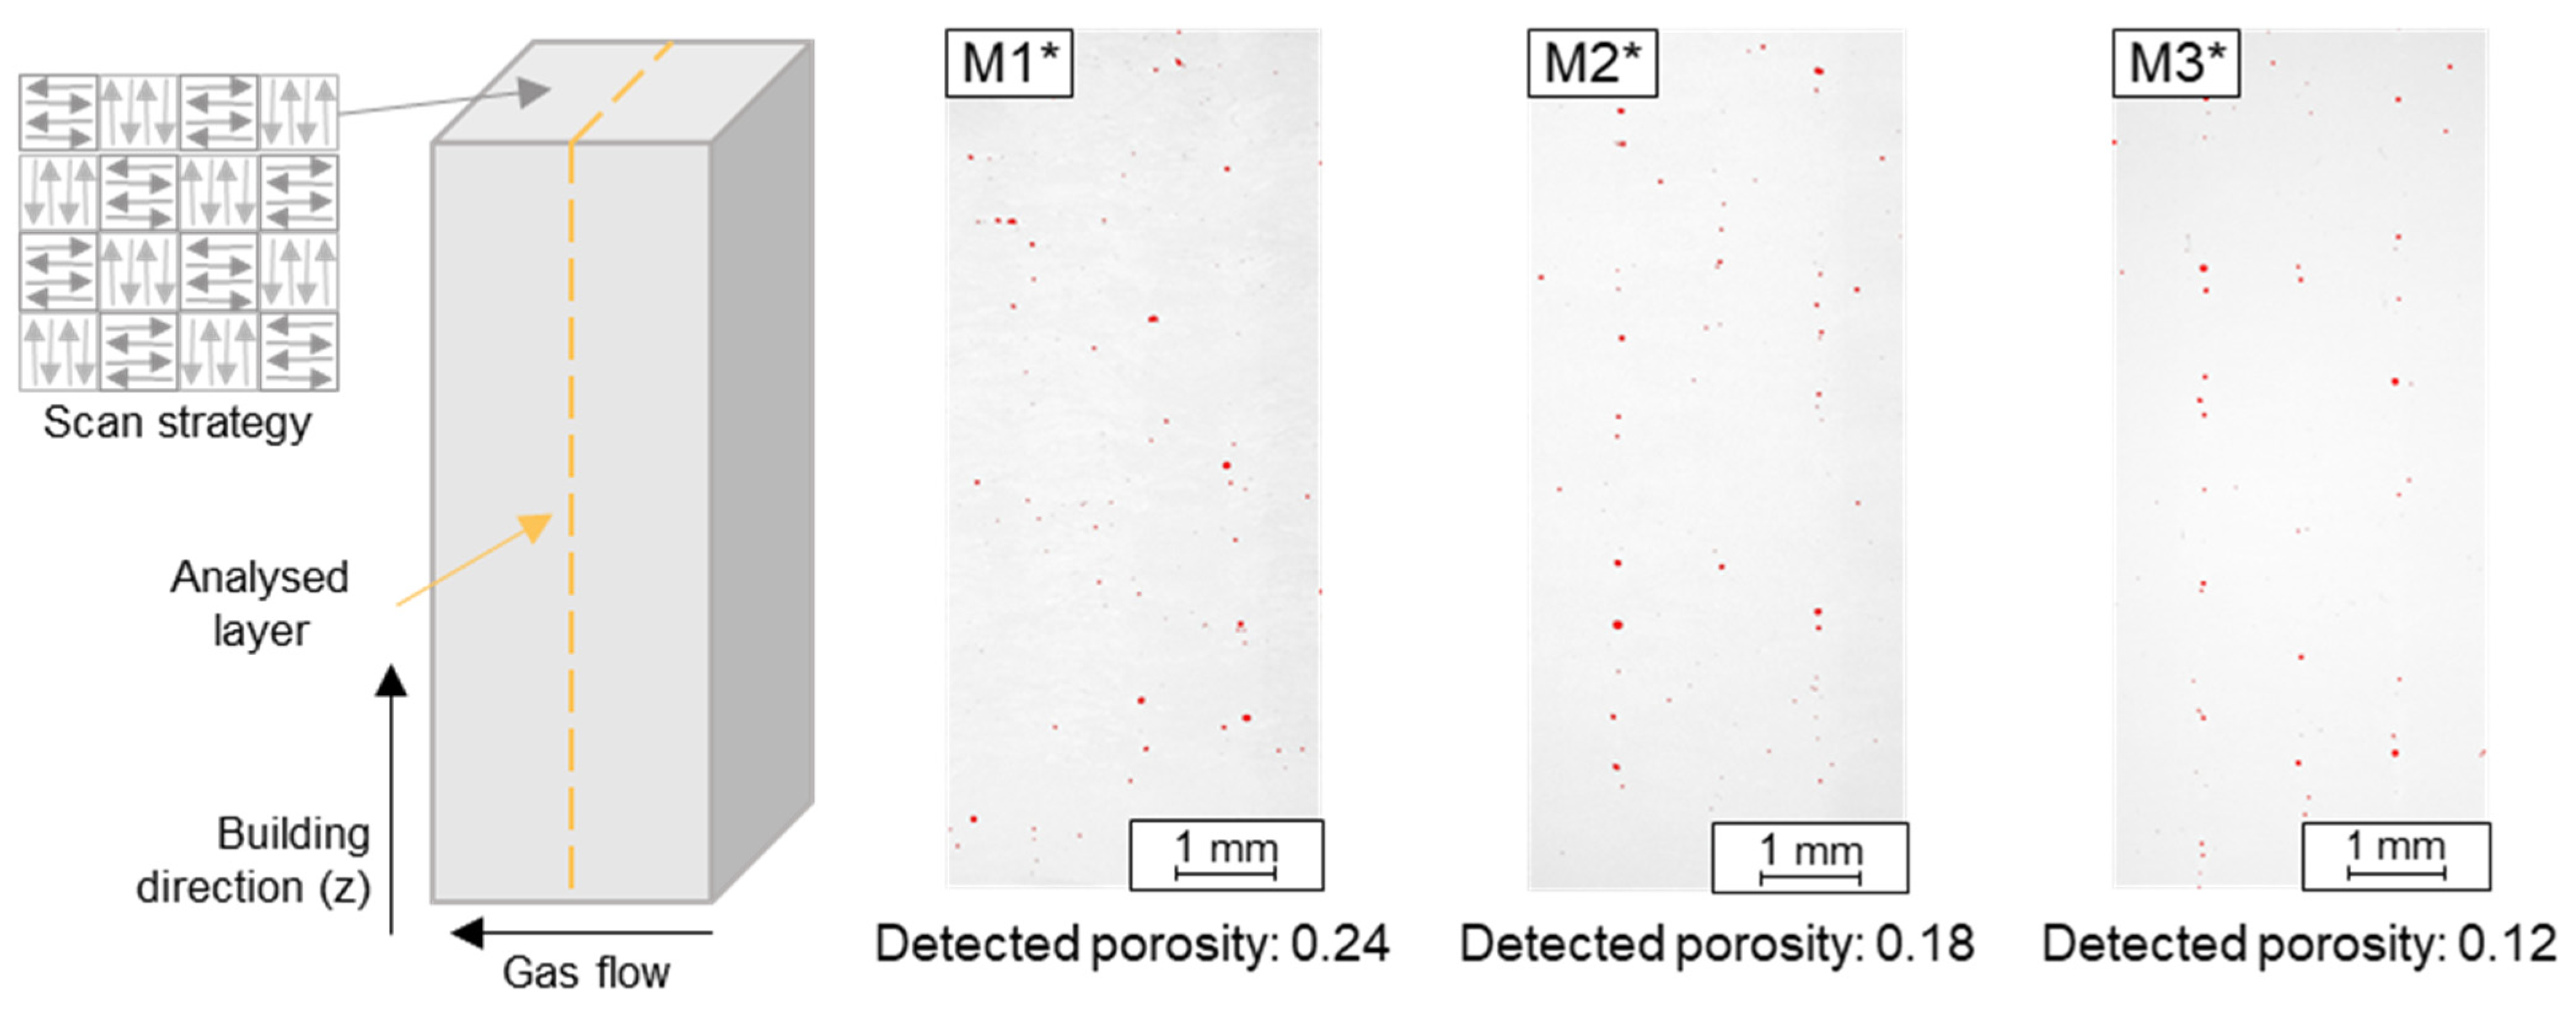
This also means that the energy introduced was not sufficient for all Fe particles to be completely melted. Most particles were detected in M1*, although a VED of 143 W/mm³ was introduced there. In comparison, 89 W/mm³ was used for M2* and M3*. Due to the higher number of unmelted particles in M1* and the amount of 95% of the Fe raw alloys in the M1 blend, this indicates that too many larger pure Fe particles >63 µm were present in the blend despite the higher energy applied. Likewise, the size of the particles seen in
Figure 8 indicates that the Fe particles of the feedstocks must have been too large before the LPBF process, otherwise the particles would have dissolved completely. To avoid unmelted Fe particles, a higher energy input can be used or Fe particles >63 µm must be avoided. Above the unmolten Fe particle in the Si-distribution mapping in
Figure 8 an additional inhomogeneity can be seen. There is an area with an arc like distribution of Si which is increased above average value in the image. Deriving from the above mentioned inhomogeneity it is recommended to use smaller particles instead of increased energy input, because higher energy input can lead to other defects, e.g., balling effects or so-called keyhole pores [
9,
45,
46,
47].
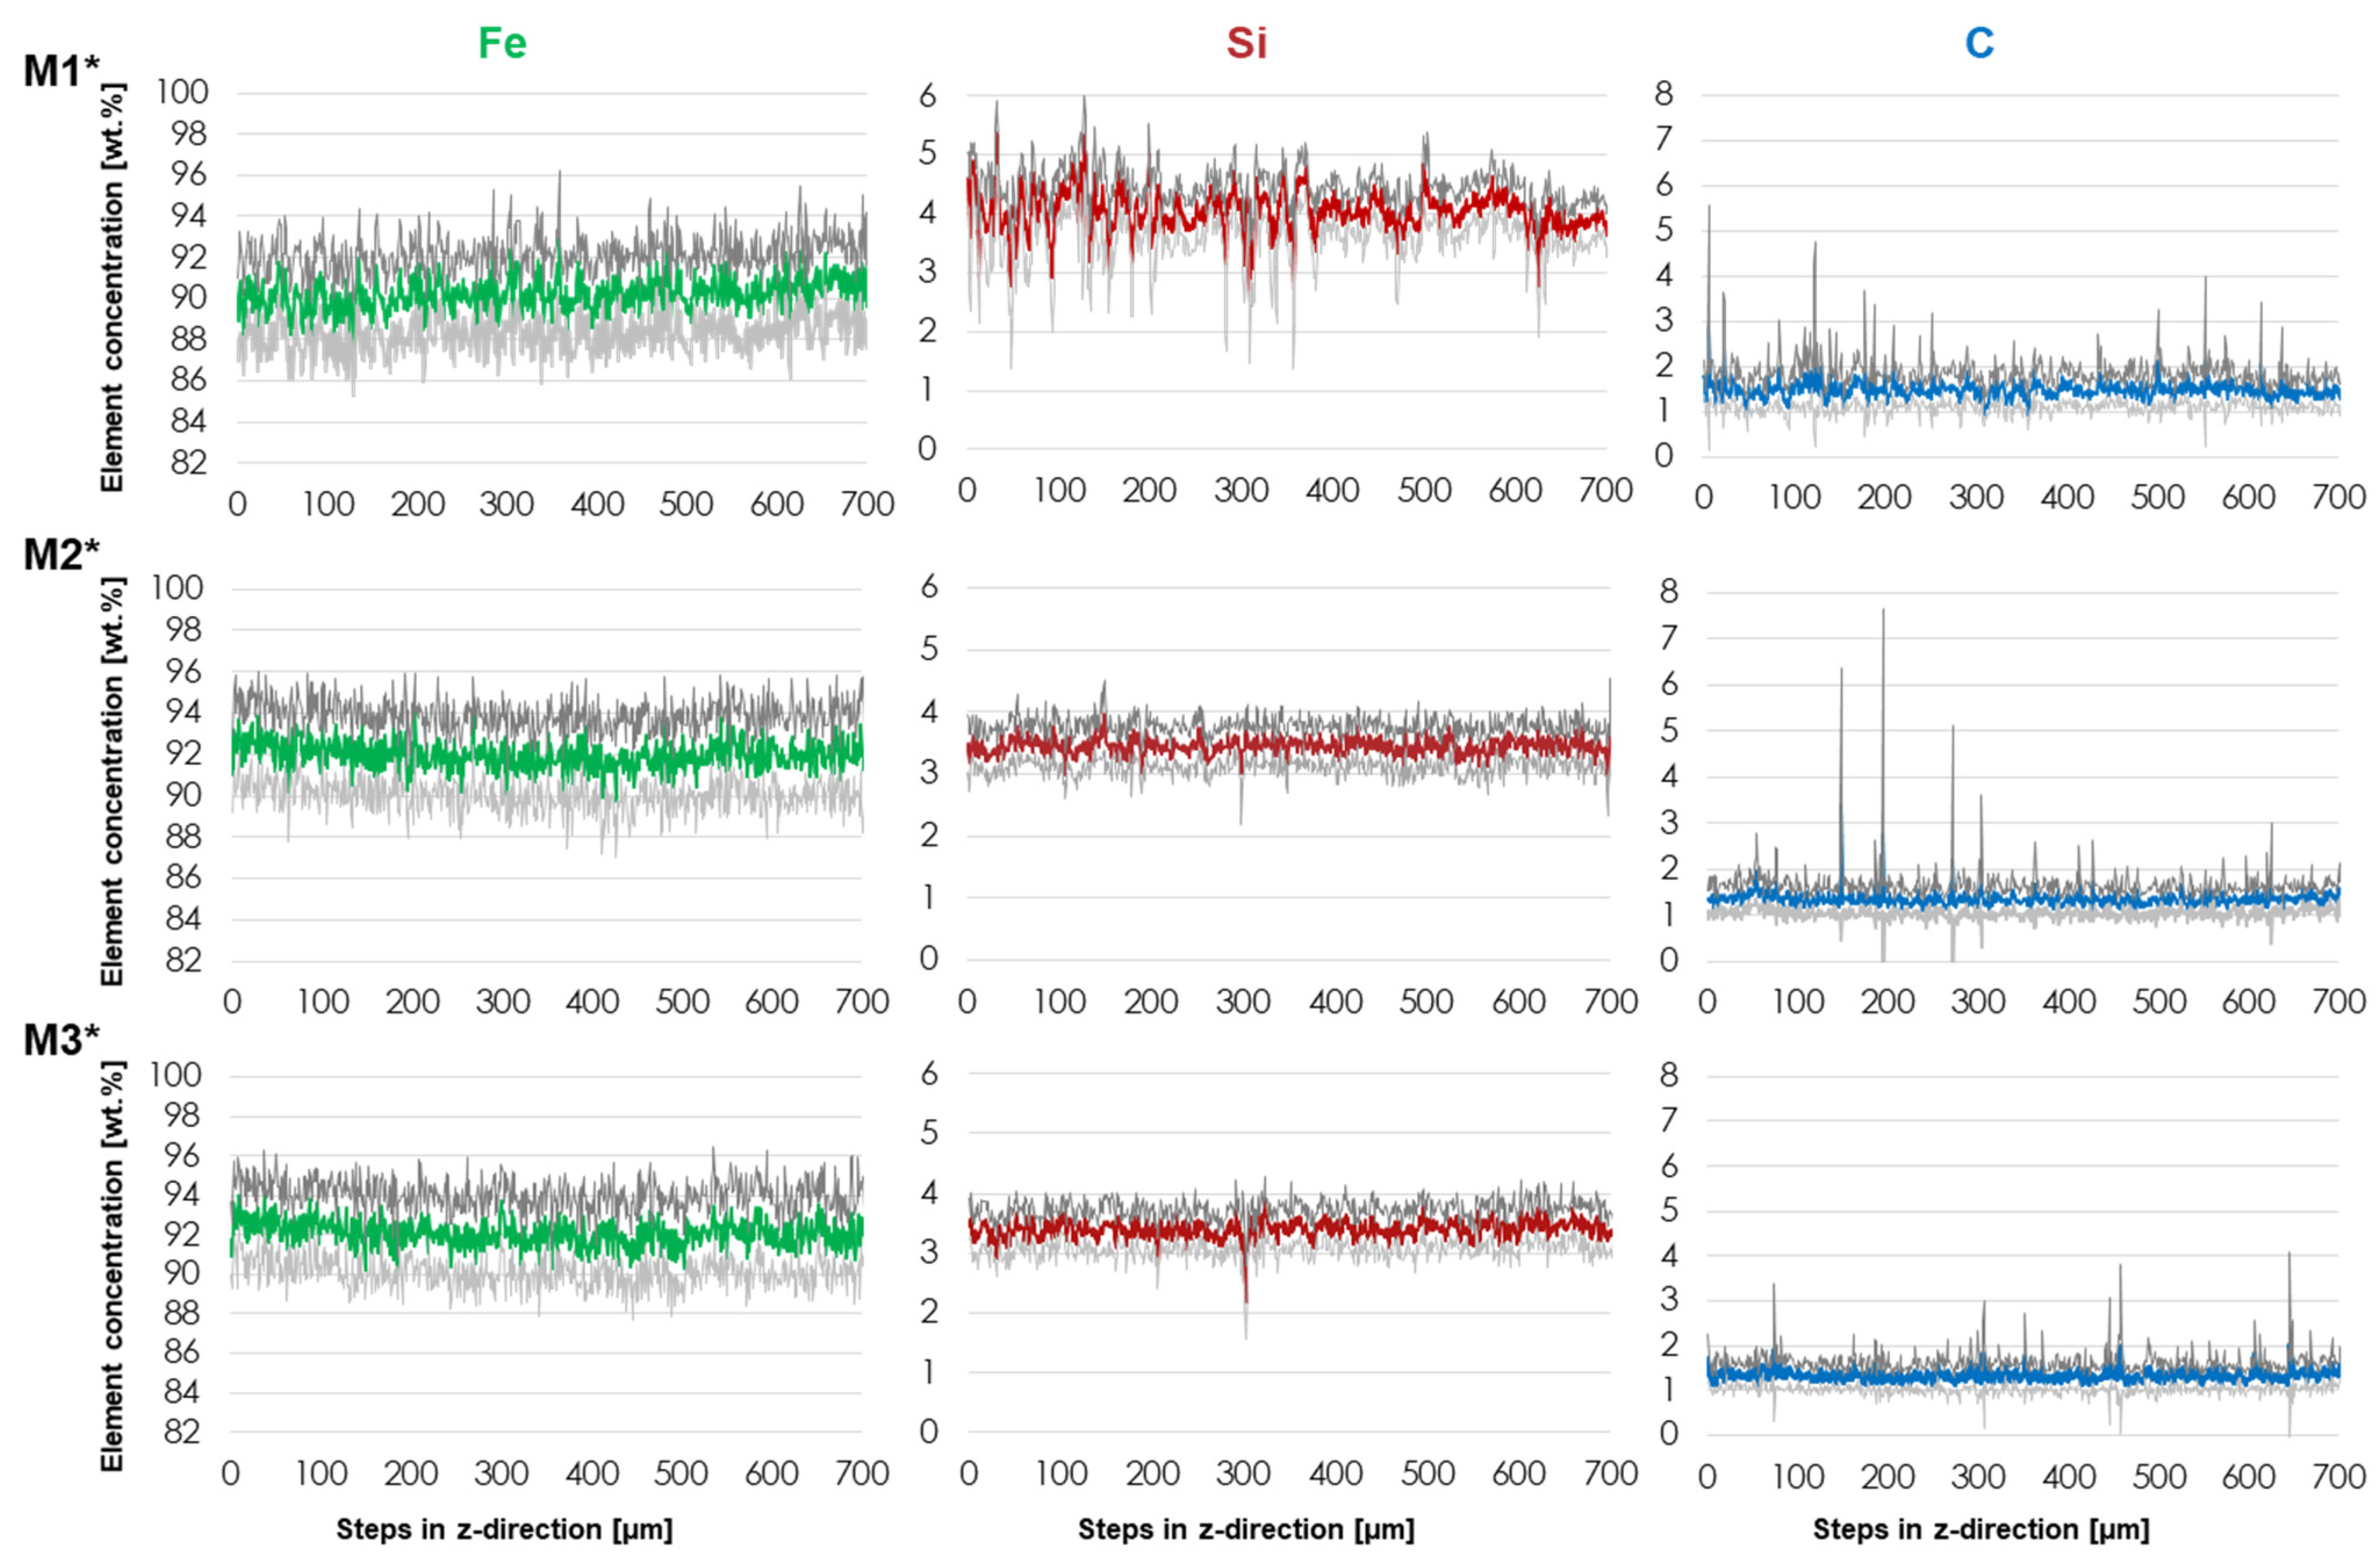
As the microstructures show local chemical inhomogeneities, the microprobe investigation was used to obtain a value to describe this issue. Thus, these investigations are carried out to develop a methodology and a value to determine the blends and produced alloys in terms of their quality. The deviation of the element distribution is used as a measure to draw conclusions on the overall homogeneity. The element with the highest sensitivity of the measurements with respect to the element distribution is used as the evaluation criterion. In this case, the distribution of Si is used as a measure of homogeneity in the microstructure, as it shows the highest sensitivity because of the low diffusion coefficient and therefore only limited mobility by the means of diffusion after solidification (
Figure 9) [
48].
For the evaluation, a range of 11 measurement points was selected for all samples in which no pores or defects were present, so that possible deviations can be excluded. The green lines in
Figure 9 show the mean value for Fe, the red lines refer to the mean value of Si and the blue lines indicate that of C. The mean value of the 11 measuring points is always shown over one measuring step in the z-direction so that the local fluctuations in z-direction can be displayed. The dark grey line shows the mean plus the standard deviation; the light grey represents the mean minus the standard deviation of the 11 measured values per z-measurement step.
As can be seen in
Figure 9, the microprobe measurements of the individual elements show differences regarding the LPBF samples examined from the different blends. The pure Fe content varies similarly for all of them, yet around a mean value of about 90 wt. % for M1* and 92 wt. % for M2* and M3*. The Si content varies more significantly for M1* than the other two blends. For M2* and M3*, the values vary more evenly around a value of 3.5 wt. %, with M3* showing a peak towards 2 wt. %. For C, all blends vary on average around a value of 1.5 wt. %, but the variations differ for the individual blends that are used. For M1*, the fluctuations are highest over the entire sample length; but for M2*, individual measuring points are clearly above the remaining deviation of the entire sample. In M3* there are also individual peaks, but they are smaller in comparison and thus shows the smallest variation.
In order to evaluate which powder blend is most suited to be densified by LPBF from these diagrams, the value of the standard deviation over the complete measuring range is used as the basis for evaluation. The smaller the standard deviation and thus the local variations, the more homogeneous the element distribution of the overall structure.
Table 5 shows the mean values and standard deviations of the entire sample cross-section of the measurements shown in
Figure 9. It is proven that the mean value of M1* is lowest for pure Fe, but highest for Si and C. M2* and M3*, contrastively, are similar with regard to the mean value of all elements. The highest deviations in the standard deviation are also found for M1*. For M2* and M3*, the standard deviation of Fe and Si are almost identical. However, the standard deviation of the C content is higher for M2* than for M3*. Since the C content can cause the formation of martensite, graphite or carbides, the evaluation here is based on the most sensitive element, which is the Si content. The variation of the standard deviation around the mean is used as a criterion. Consequently, there is a fluctuation of 15% around the mean value for M1* and 11% for M2* and M3*. Also, the quality in terms of homogeneity of M2* and M3* are similar, but M1* can be described as more inhomogeneous.


 ,
, 


