Article

Structural and Magnetic Properties of P Microalloyed Fe76Cu0.8Nb2.2B9Si12 Alloys

1
CAS Key Laboratory of Magnetic Materials and Devices and Zhejiang Province Key Laboratory of Magnetic Materials and Application Technology, Ningbo Institute of Materials Technology & Engineering, Chinese Academy of Sciences, Ningbo 315201, China
2
University of Chinese Academy of Sciences, Beijing 100049, China
3
Faculty of Materials Science and Chemical Engineering, Ningbo University, Ningbo 315211, China
4
School of Electrical Engineering, Beijing Jiaotong University, Beijing 100044, China
*
Authors to whom correspondence should be addressed.
Metals 2021, 11(7), 1110; https://doi.org/10.3390/met11071110
Submission received: 14 June 2021 / Revised: 8 July 2021 / Accepted: 8 July 2021 / Published: 12 July 2021

Abstract

:
The development of Fe-based nanocrystalline alloys with high saturation magnetization (Bs), excellent magnetic softness and good manufacturability is highly desirable. Here, the effect of substituting 1 at% P for B and Si on the thermal stability, microstructure and magnetic properties of Fe76Cu0.8Nb2.2B9Si12 alloy has been studied in detail. It was found that replacing B with P effectively reduces the coercivity (Hc) of the alloy without deteriorating the Bs and permeability (μ). However, replacing Si with P has little effect on the Hc and Bs, yet significantly reduces the μ. The variation in the magnetic properties can be well understood from the evolution of the microstructure and magnetic anisotropy induced by P microalloying. The Fe76Cu0.8Nb2.2B8Si12P1 alloy with a good processing window, a high Bs of 1.41 T, a great μ of 29,000 at 1 kHz and a low Hc of 0.6 A/m is suitable for high-power electronic devices.

1. Introduction

Fe-Si-B-Nb-Cu nanocrystalline alloys first, demonstrated by Yoshizawa et al. in 1988 [1], have been the most widely studied and used nanocrystalline soft magnetic alloys. The nanocrystalline soft magnetic alloys have an amorphous/nanocrystalline dual-phase structure, comprising α-Fe(Si) crystallites of less than 20 nm in diameter, uniformly embedded in a residual amorphous matrix that is approximately 1–2 nm thick [2,3,4]. This structure possesses large magnetization, small magnetocrystalline anisotropy and low magnetostrictive coefficient, which makes the Fe-Si-B-Nb-Cu nanocrystalline alloys present high permeability (μ) and ultra-low coercivity (Hc) values [5,6,7]. However, the Fe-Si-B-Nb-Cu alloys currently in commercial use (named Finemet, with a typical composition of Fe73.5Si13.5B9Nb3Cu1) have a low saturation magnetization (Bs) of around 1.24 T, which struggles to meet the development needs of the miniaturization and high power of electronic devices.
Increasing the quantity of Fe and Co elements is the most effective way to increase the Bs of Fe-based nanocrystalline alloys [8,9,10,11]. In addition, reducing the content of non-magnetic metalloids [12], large early transition metals (Nb, Mo, Zr, etc.) [13,14,15,16] and post-transition metals such as Cu [17,18] is also beneficial to improve Bs. However, a high content of ferromagnetic elements usually leads to an increase in the magnetic anisotropy and a decrease in the amorphous-forming ability, which would deteriorate the soft magnetic properties of Fe-based nanocrystalline alloys [6,13,19]. Several studies have attempted to increase Bs without degrading the soft magnetic properties and amorphous-forming ability of the nanocrystalline alloys with high Fe content by microalloying P [20,21], Al [22], Nb [10,23], Sn [24], Mo [25,26,27] and C [28]. Among them, P has less negative impact on Bs than early transition metals such as Nb [29], and is more effective than metalloids such as B [30] and Si [31] in inhibiting the growth of α-Fe(Si) grains.
Recently, we fabricated an Fe76Cu1Nb2B8Si13 nanocrystalline alloy with good soft magnetic properties and manufacturability [10,32]. However, the low μ limits its application. It was found that the addition of Mn effectively enhances the high-frequency permeability of the alloy, but reduces Bs, and requires a harsh rapid heating annealing process [33]. In addition, P microalloying also improves the μ of the alloy. However, the optimal annealing temperature range for this P-doped alloy is narrow and the corresponding annealing time is short (10 min) [21]. Therefore, the manufacturability of these alloys needs to be further improved for large-scale production.
It was reported that the optimized Cu content required for nanocrystalline alloys with high Fe content to obtain the highest μ is about 0.6 at% [18]. Based on this work, we have recently optimized the composition of Fe76Cu1Nb2B8Si13 alloy, and unexpectedly found that the annealing window of Fe76Cu0.8Nb2.2B9Si12 alloy is very wide, that is, the difference between the first and second onset crystallization temperatures is as high as 207 °C and the annealing time can be as long as 1 h or more. Unfortunately, although the μ of the Fe76Cu0.8Nb2.2B9Si12 alloy is as high as 29,000 at 1 kHz, the coercivity Hc is larger than 3 A/m, which would lead to high hysteresis loss [3].
The aim of this work is to evaluate the effectiveness of P microalloying in reducing the Hc without decreasing the Bs and μ of the Fe76Cu0.8Nb2.2B9Si12 alloy, and to reveal why slight changes in P, B and Si contents have a significant impact on the soft magnetic properties of the alloy. It was found that although the addition of 1 at% P significantly reduces the annealing temperature range of the alloy, it still has greater manufacturability than that of the Mn-doped and P-doped Fe76Cu1Nb2B8Si13 alloys. In addition, substituting 1 at% P for B and Si has significantly different effects on the microstructure and soft magnetic properties of the alloys. We have explored this interesting phenomenon by studying the evolution of microstructure and magnetic anisotropy. The developed Fe76Cu0.8Nb2.2B8Si12P1 alloy exhibits a high Bs of 1.41 T, a great μ of 29,000 at 1 kHz and a low Hc of 0.6 A/m, making it suitable for high-power electronic devices.

2. Experimental

Master alloy ingots with nominal compositions of Fe76Cu0.8Nb2.2B9Si12, Fe76Cu0.8Nb2.2B8Si12P1 and Fe76Cu0.8Nb2.2B9Si11P1 (at%) were prepared by induction melting with highly pure raw materials of Fe (99.99 wt%), Cu (99.99 wt%), Nb (99.99 wt%), B (99.95 wt%), Si (99.99 wt%) and pre-alloyed Fe3P (99.99 wt%) under a pure argon atmosphere. Melt-spun ribbons with a thickness of approximately 27–30 μm and a width about 1 mm were produced by a single-roller melt-spinning method with a copper roller speed of 35 m/s in an argon atmosphere. Nanocrystalline ribbons were prepared by annealing the melt-spun ribbons at 510–590 °C for 60 min in an isothermal tube annealing furnace (Shanghai Y-feng electrical furnace Co., Ltd., Shanghai, China) under a vacuum degree of 5 × 10⁻³ Pa followed by water quenching.
Thermal parameters, including the onset crystallization temperatures of the melt-spun ribbons, were evaluated by differential scanning calorimetry (DSC, NETZSCH 404C, Selb, Germany) at a heating rate of 0.67 °C/s under high-purity argon flow. Magnetic properties such as Bs, Hc and μ were measured by a vibrating sample magnetometer (VSM, Lakeshore 7410, Columbus, OH, USA) under a maximum applied field of 800 kA/m, a DC B-H loop tracer (EXPH-100, Riken Deshi Co., Ltd., Saitama, Japan) under a maximum applied field of 800 A/m and an HP4294A impedance analyzer with a frequency from 1 kHz to 110 MHz in a field of 1 A/m, respectively. The amorphous structure of the melt-spun ribbons and the precipitates of the annealed ribbons were identified by X-ray diffraction (XRD, Bruker D8 Advance, Karlsruhe, Germany) with Cu-Kα radiation and transmission electron microscopy (TEM, TF20, Hillsboro, OR, USA).

3. Results and Discussion

Figure 1 shows the XRD patterns of the melt-spun Fe76Cu0.8Nb2.2B9Si12, Fe76Cu0.8Nb2.2B8Si12P1 and Fe76Cu0.8Nb2.2B9Si11P1 ribbons. For convenience, we abbreviate the chemical formulas of the above alloys as B9Si12, B8Si12P1 and B9Si11P1, respectively. The melt-spun ribbons have typical diffraction peaks of an amorphous structure, that is, broad diffuse reflection peaks, and no sharp crystal diffraction peaks can be seen. The fully amorphous structure of the 30 μm thick ribbons indicates the good amorphous-forming ability of the present alloys, which is beneficial to obtain homogeneous and fine nanocrystalline grains [2].
Figure 2 shows the DSC curves of the melt-spun B9Si12, B8Si12P1 and B9Si11P1 ribbons. All ribbons have two distinct exothermic peaks, and the first and second crystallization peaks represent the precipitation of α-Fe(Si) and Fe-boride phases, respectively [21,33]. The difference between the first and second onset crystallization temperatures (ΔT = Tx2Tx1) of the B9Si12 ribbon is as high as 207 °C, which is much greater than that of the previously developed Fe76Cu1Nb2B8Si13 (163 °C) alloy [10]. It should be pointed out that the DSC results of the ribbons obtained by re-preparing the master alloy all confirm that the ΔT of B9Si12 is 207 ± 2 °C. The large ΔT can extend the processing window, so that single α-Fe(Si) nanocrystalline grains can be formed in a wider annealing temperature range and a longer annealing time [2]. It is clearly seen that the addition of 1 at% P has little effect on Tx1, whereas it significantly decreases Tx2, resulting in the ΔT of B8Si12P1 and B9Si11P1 alloys decreasing to 158 °C and 149 °C, respectively. The phenomenon that P doping leads to a decrease in Tx2 is consistent with previous results [13,20,21]. It is reasonable to deduce that since the mixing enthalpy of P and B is positive (0.5 kJ/mol [34]), when P and B are excluded from the α-Fe(Si) grains during crystallization, the mutual repulsion of P and B may promote the precipitation of Fe-B phase, resulting in the decrease in Tx2. Nevertheless, the ΔT of B8Si12P1 is still larger than that of typical Finemet alloys (140 °C) [35], and recently developed Fe73Cu1Nb2B8Si13Mn3 (149 °C) [33], Fe76Cu1Nb2B7Si13P1 (152 °C) and Fe76Cu1Nb1.5B8Si13Mo0.5 (151 °C) alloys [21], implying the good annealing process window of the present alloys.
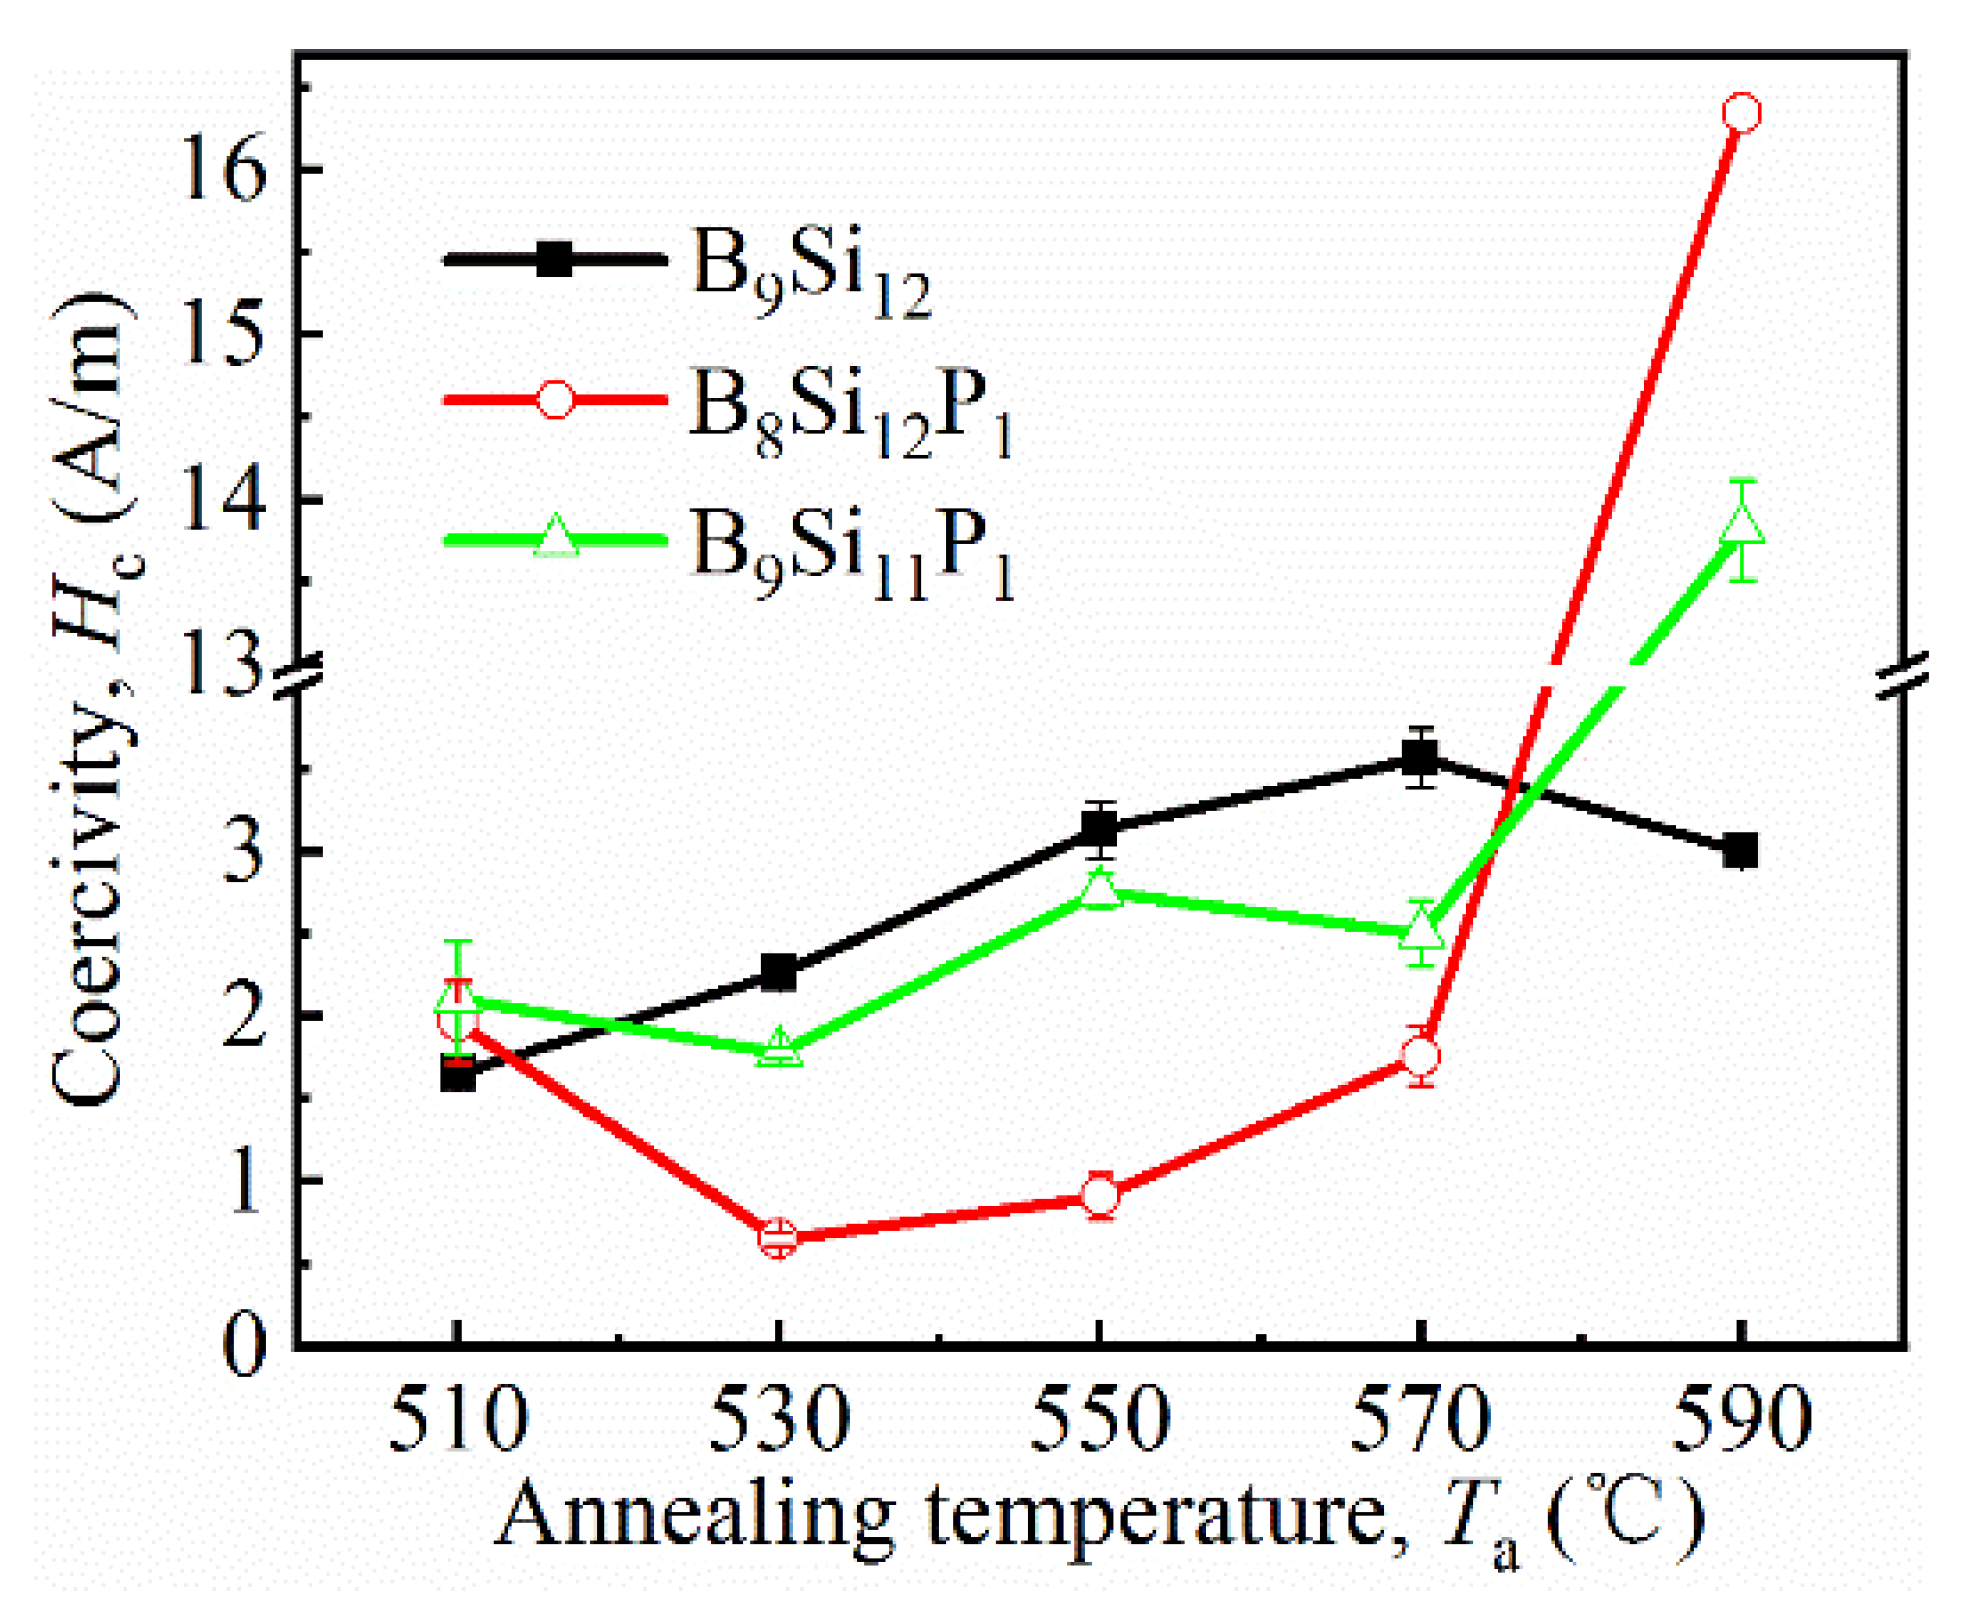
In order to obtain homogeneous and fine α-Fe(Si) grains, the annealing temperature was selected from 510–590 °C based on the DSC results [2,3]. Figure 3 shows the Hc of the melt-spun B9Si12, B8Si12P1 and B9Si11P1 ribbons as a function of annealing temperature. The Hc was obtained by testing the hysteresis loop of the ribbons with a length of about 70 mm by a DC B-H loop tracer. As the annealing temperature rises from 510 to 570 °C, the Hc of B9Si12 and B9Si11P1 increases from 1.7 to 3.6 A/m and 2.1 to 2.5 A/m, respectively, whereas the Hc of B8Si12P1 first decreases from 2.0 to 0.6 A/m and then increases to 1.8 A/m. The reduced Hc of B8Si12P1 with increasing temperature may be related to the stable and fine α-Fe(Si) grains, as well as the increased crystalline volume fraction [2]. However, an excessively high annealing temperature may cause the grains to grow and precipitate Fe-boride phase, thus the Hc increases. The relationship between structure and Hc will be discussed in detail below. Therefore, substituting 1 at% P for Si has limited effect in reducing Hc, while substituting 1 at% P for B can effectively reduce the Hc to the level of the commercial Finemet alloys [35]. However, when the annealing temperature increases to 590 °C, the Hc of B9Si12 decreases slightly. On the contrary, the Hc of B8Si12P1 and B9Si11P1 increases significantly. This result may originate from the reduced ΔT of the P-doped alloys, which easily precipitate Fe-boride compounds with high magnetocrystalline anisotropy during high-temperature and long-term annealing [3]. Nevertheless, the Hc of B8Si12P1 in the annealing temperature range of 510–570 °C is less than 2 A/m, which is advantageous compared with the B9Si12 and B9Si11P1 alloys.
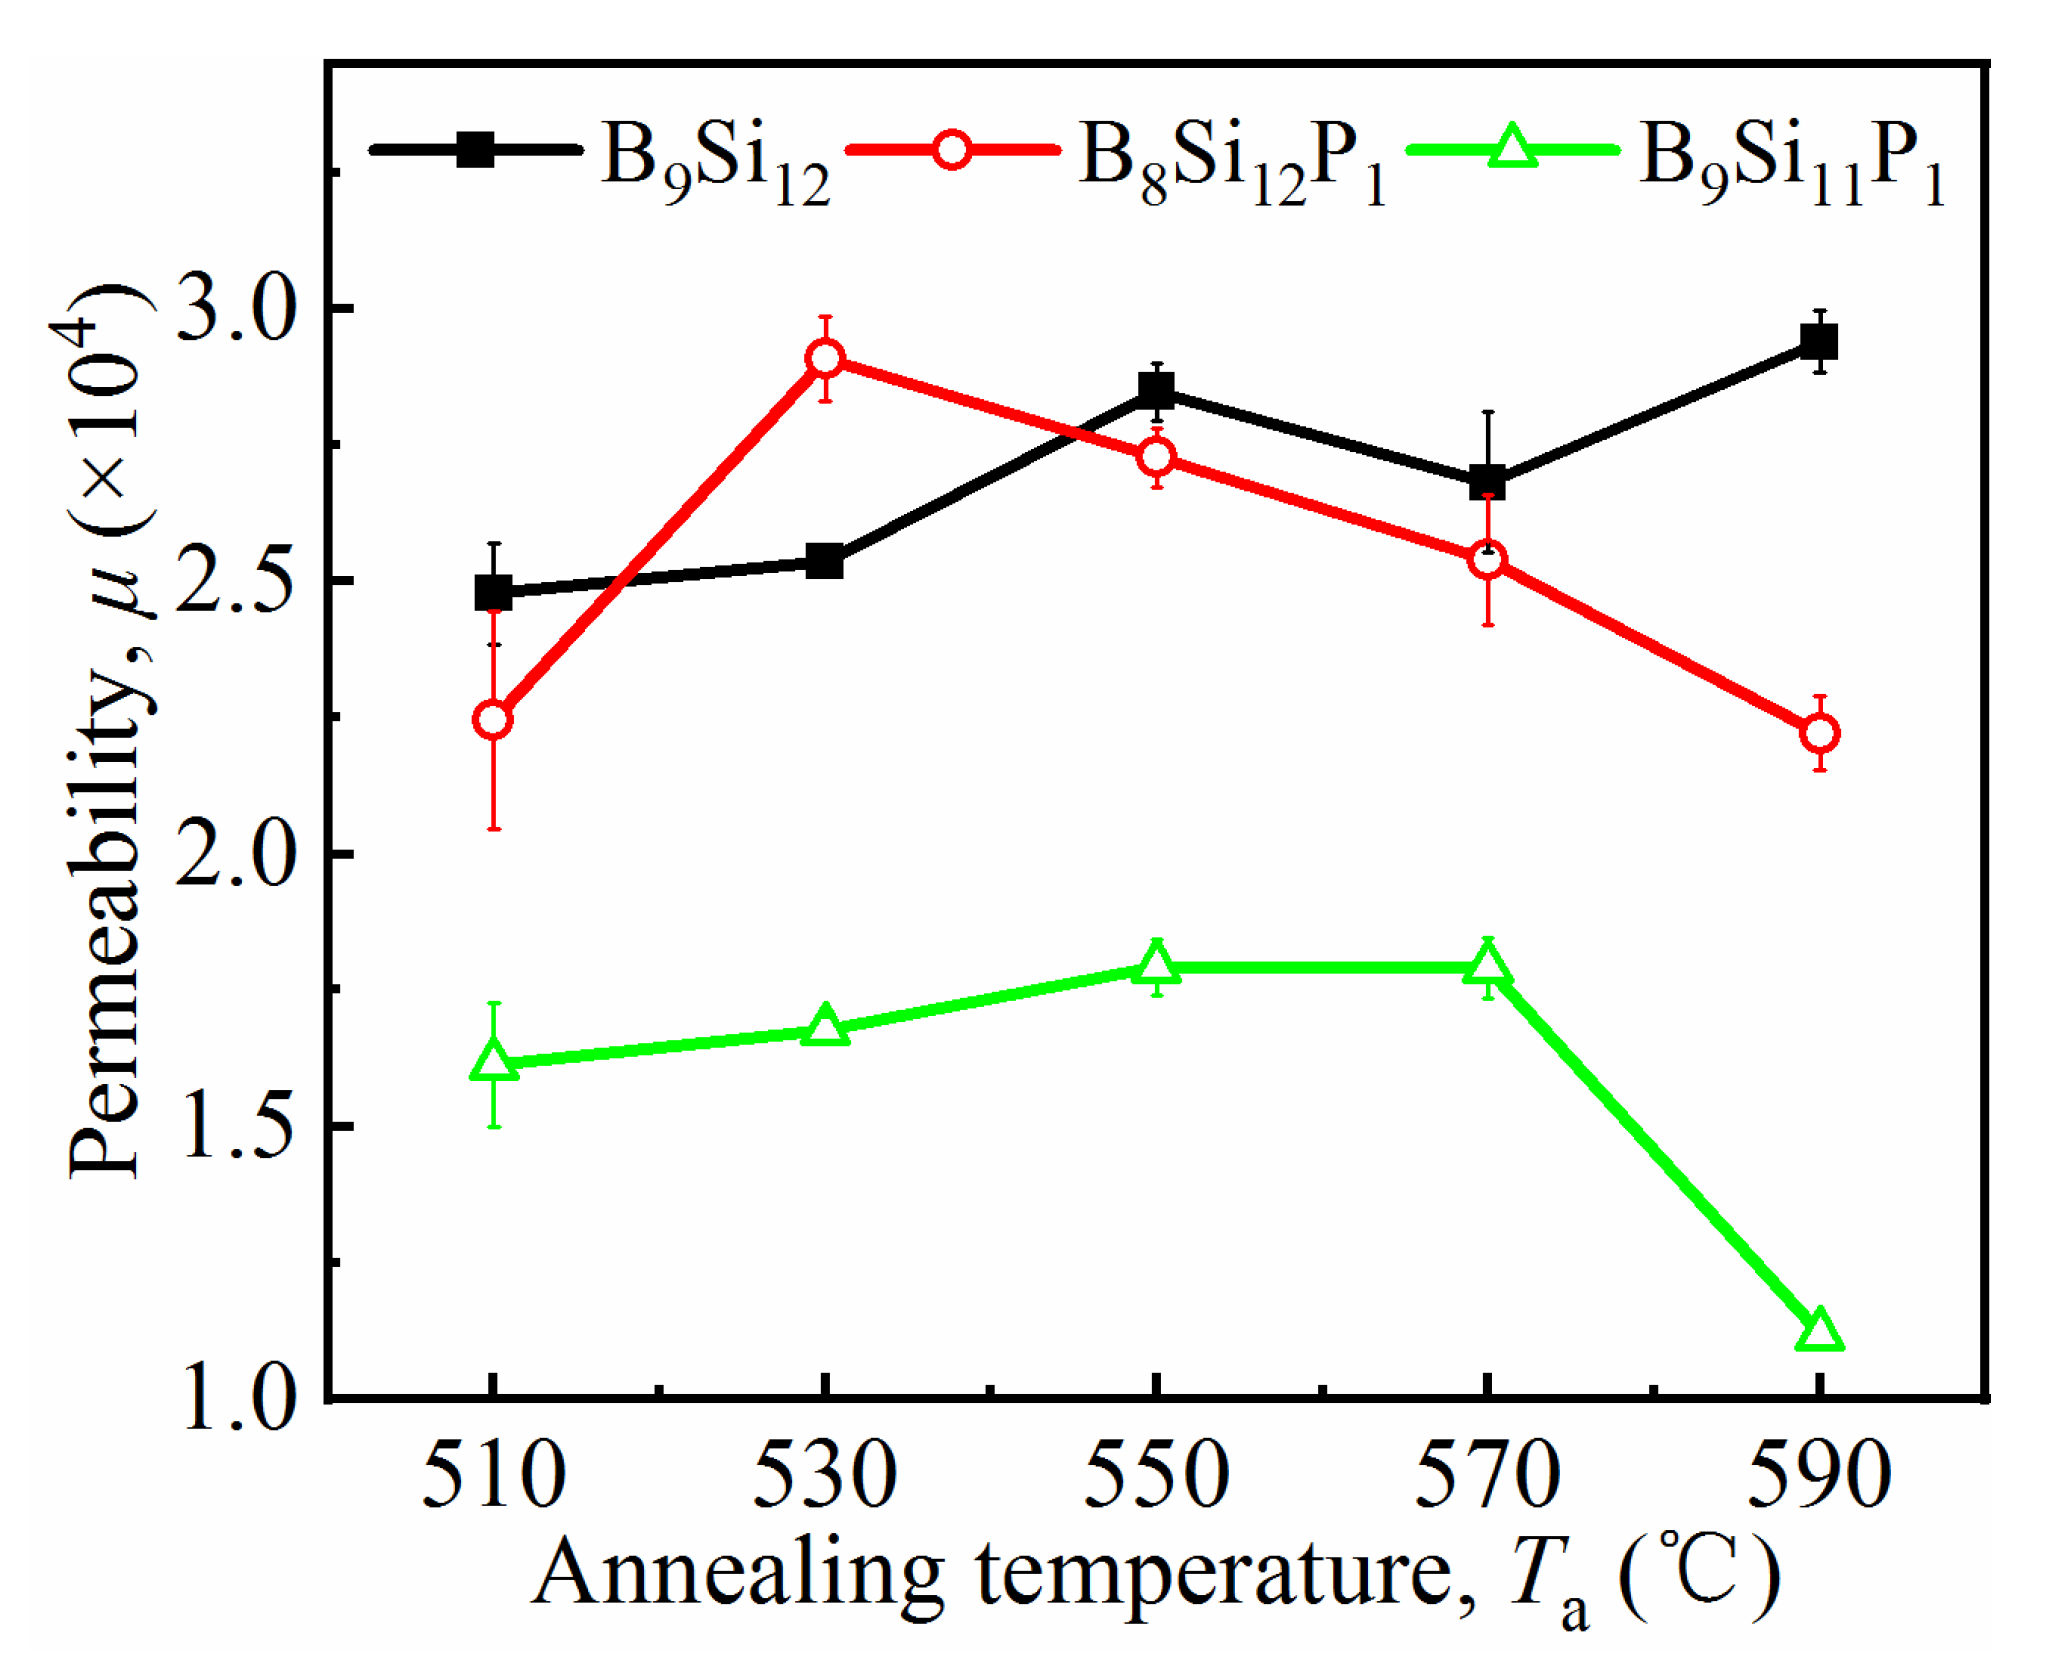
Figure 4 shows the μ of the melt-spun B9Si12, B8Si12P1 and B9Si11P1 ribbons as a function of annealing temperature. The μ was obtained by measuring the magnetic spectrum of the 50 mm long ribbons by an HP4294A impedance analyzer in a field of 1 A/m. The μ of B9Si12 increases gradually with the increase in annealing temperature, reaching 29,000 at 590 °C. The μ of B8Si12P1 and B9Si11P1 first increases and then decreases with increasing annealing temperature. However, B8Si12P1 has a μ comparable to that of B9Si12 in the temperature range of 510–570 °C, while the μ of B9Si11P1 is very low, less than 18,000. Except for B8Si12P1, the μ of B9Si12 and B9Si11P1 does not change inversely to the Hc. Similar phenomena can also be found in other nanocrystalline alloy systems [22,36]. It is well known that the magnetoelastic anisotropy of Fe-Cu-Nb-B-Si nanocrystalline alloys is sensitive to Si content, which significantly affects the μ of the alloys. When the Si content is around 15 at%, the magnetoelastic anisotropy of the alloys is close to zero [36]. Moreover, a slight change in Si content also has a remarkable effect on the μ of nanocrystalline alloys [36,37]. For example, in the Fe-Si-B-P-Cu system, the μ of alloys that differ only by 1 at% Si differs by more than 3000. Therefore, B9Si11P1 with less Si content has a smaller μ than B9Si12 and B8Si12P1, which may be related to the increased magnetoelastic anisotropy [3,36].
Figure 5 shows typical hysteresis loops of the B9Si12, B8Si12P1 and B9Si11P1 ribbons after annealing at 550 °C for 60 min. The Bs of the samples (a total of eight 3 mm long ribbons) was obtained by a VSM at a maximum field strength of 800 kA/m. All samples show a slender hysteresis loop, and the curves have a high slope under a small applied magnetic field, typical characteristics of soft magnetic materials. The Bs values of the annealed B9Si12, B8Si12P1 and B9Si11P1 ribbons are 1.36 T, 1.41 T and 1.42 T, respectively, implying that the substitution of 1 at % P for metalloids has little effect on the Bs of the alloys. Therefore, the above results demonstrate the effectiveness of P microalloying in reducing the Hc without decreasing the Bs and μ of the Fe76Cu0.8Nb2.2B9Si12 alloy. In addition, the annealing time can be over 60 min in the optimal temperature range of 510–570 °C, indicating the good annealing process window of the alloys. Compared with the previously reported Fe76Cu1Nb2B8Si13 [10,32], Fe76−xCu1Nb2B8Si13Mnx [33], Fe76Cu1Nb2B7Si13P1 and Fe76Cu1Nb1.5B8Si13Mo0.5 alloys [21], the present Fe76Cu0.8Nb2.2B8Si12P1 alloy has better annealing processability and superior overall magnetic properties.
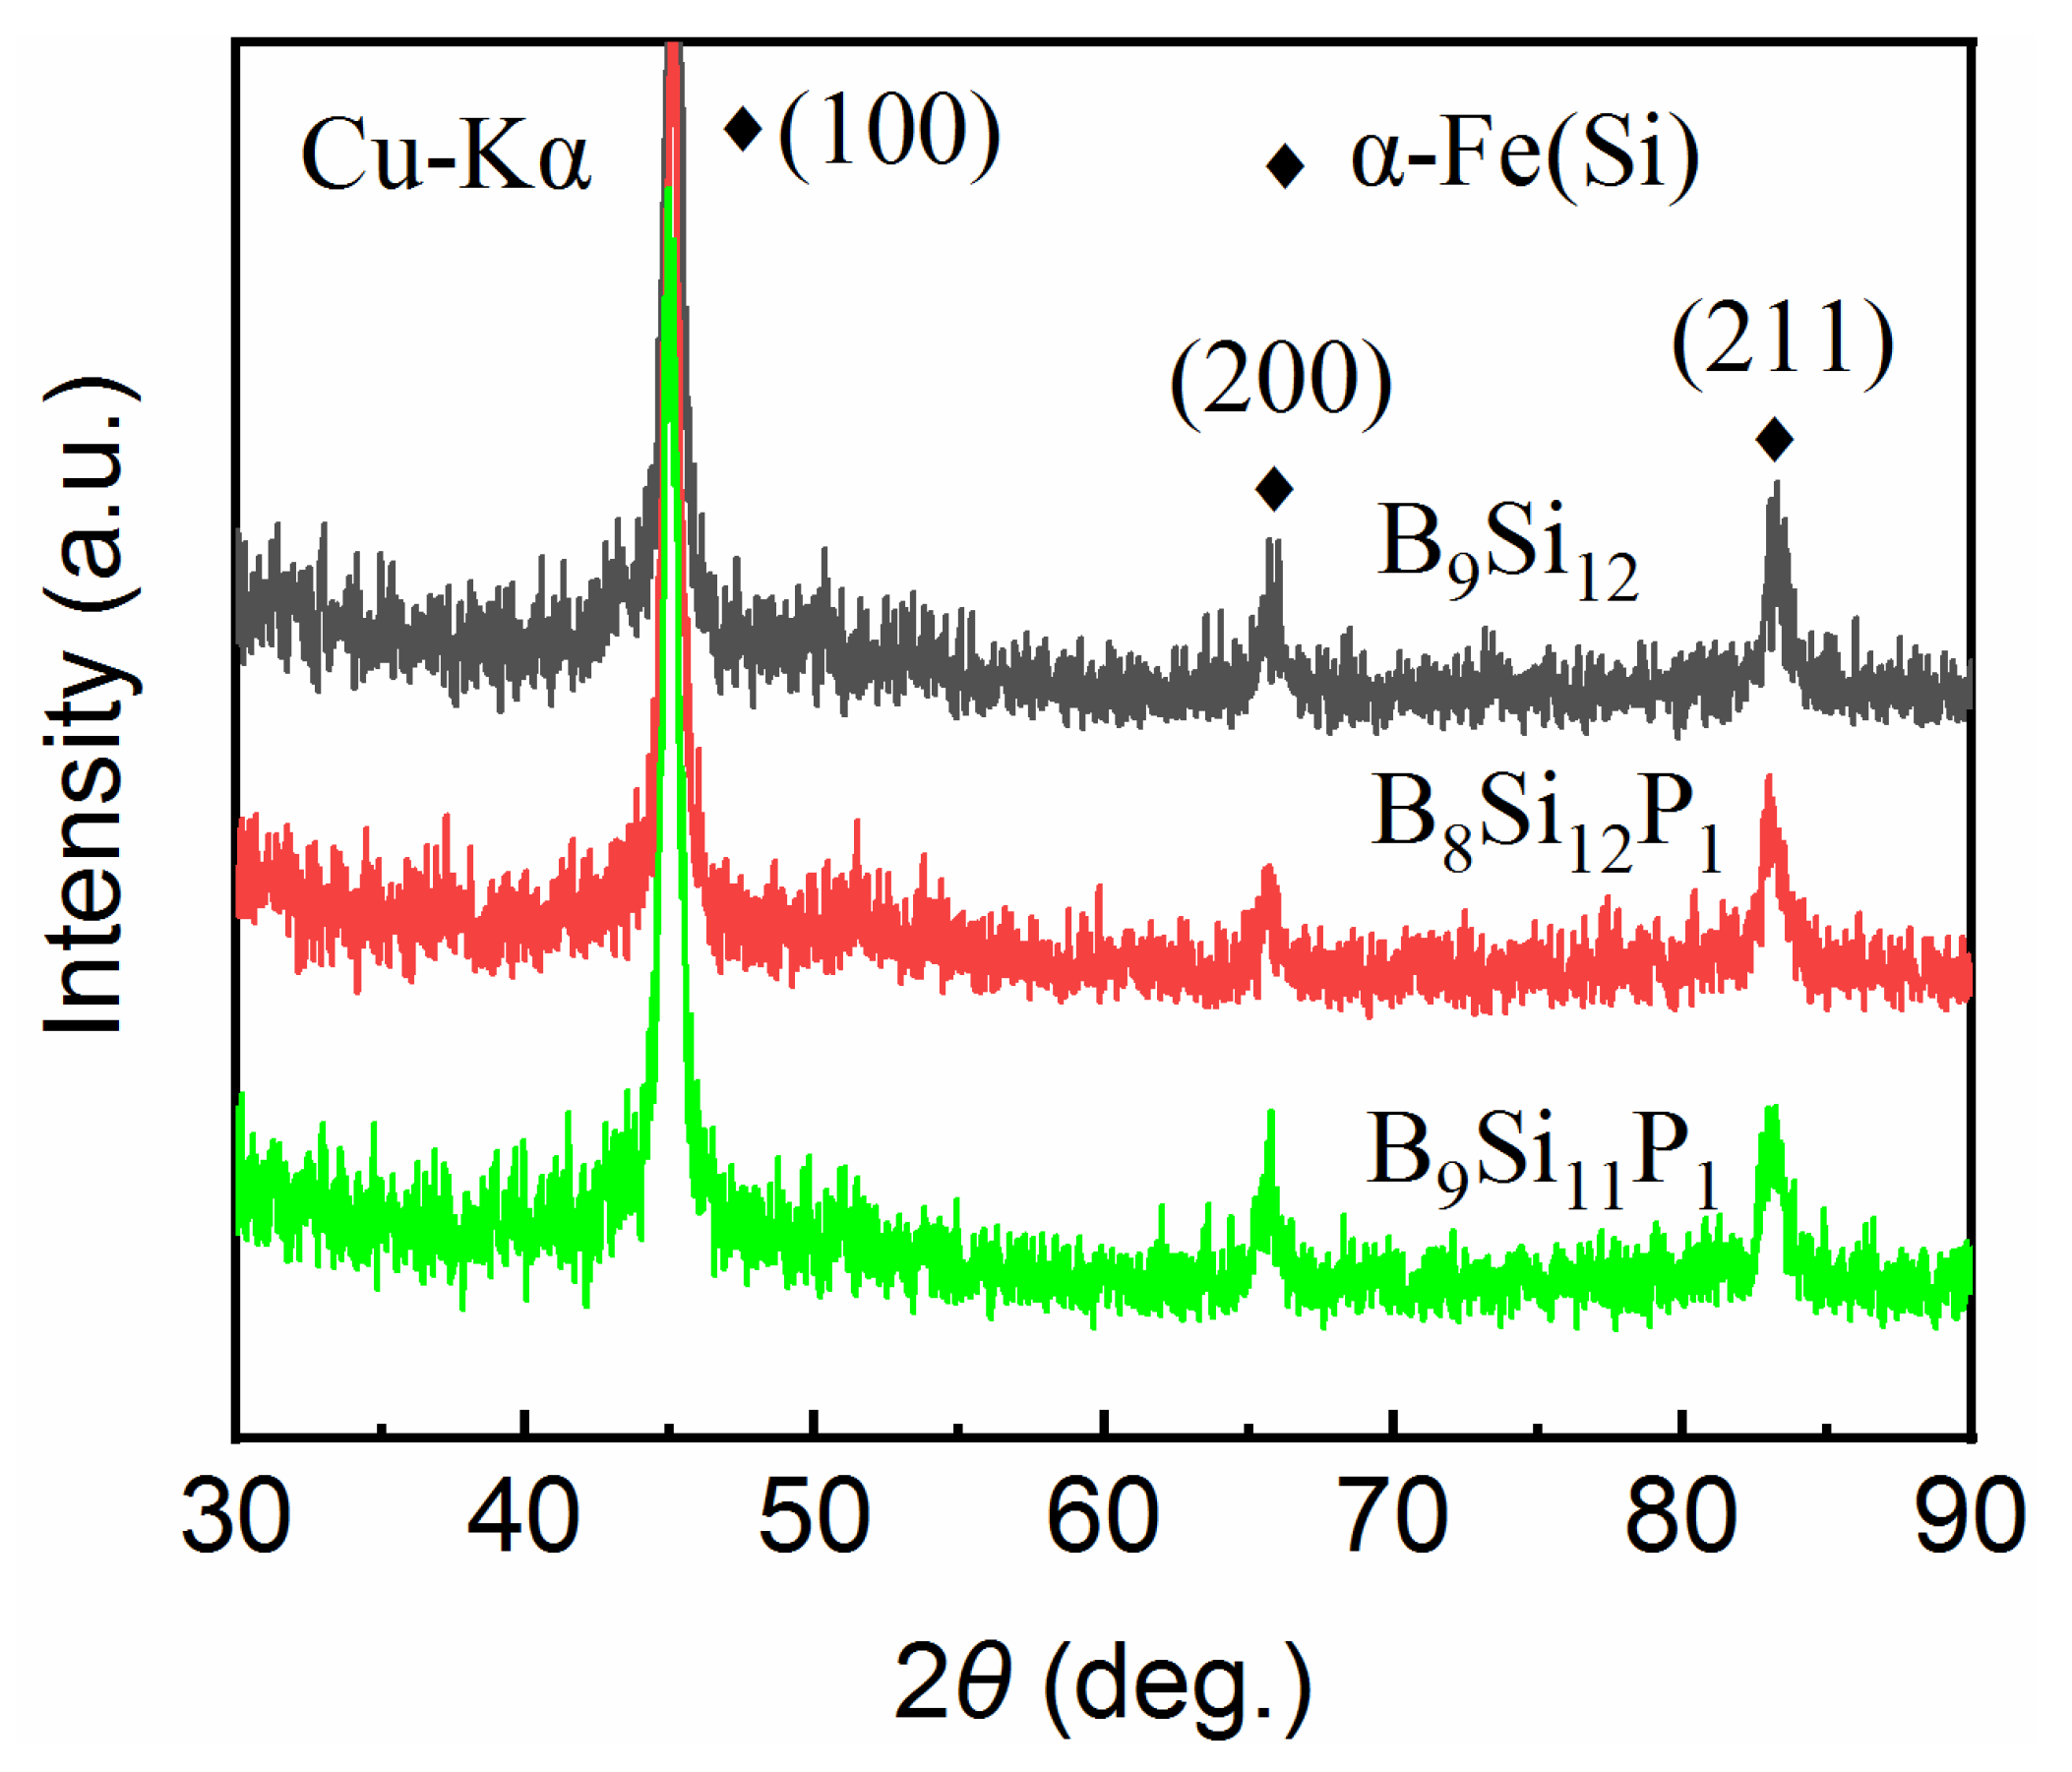
According to Herzer’s random anisotropy model, the Hc of nanocrystalline alloys is proportional to the sixth power of grain size for grain sizes below about 50 nm [36]. Thus, we investigated the influence of P microalloying on the Hc of the alloys in terms of the variation in grain size and its distribution. Figure 6 shows the XRD patterns of the B9Si12, B8Si12P1 and B9Si11P1 ribbons annealed at 550 °C for 60 min. The XRD patterns show one main diffraction peak at about 2θ = 45° and two sub-diffraction peaks at about 2θ = 65° and 83°. The sharp diffraction peaks indicate that the annealed ribbons have undergone obvious crystallization, and only α-Fe(Si) grains are precipitated in the amorphous matrix. The full width at half maximum of the diffraction peaks of B8Si12P1 (0.65°) is larger than that of B9Si12 (0.64°) and B9Si11P1 (0.71°). The crystallite size can be calculated using the following equation: L = /(Bcosθ), where L is the linear dimension of crystallite, K is the numerical constant (0.9), λ is the wave-length of the incident X-ray, and B is the full width at half maximum [38,39,40]. The crystallite sizes of B9Si12, B8Si12P1 and B9Si11P1 obtained from the XRD patterns are about 13 nm, 12 nm and 13 nm, respectively. Thus, B8Si12P1 has the smallest grain size.
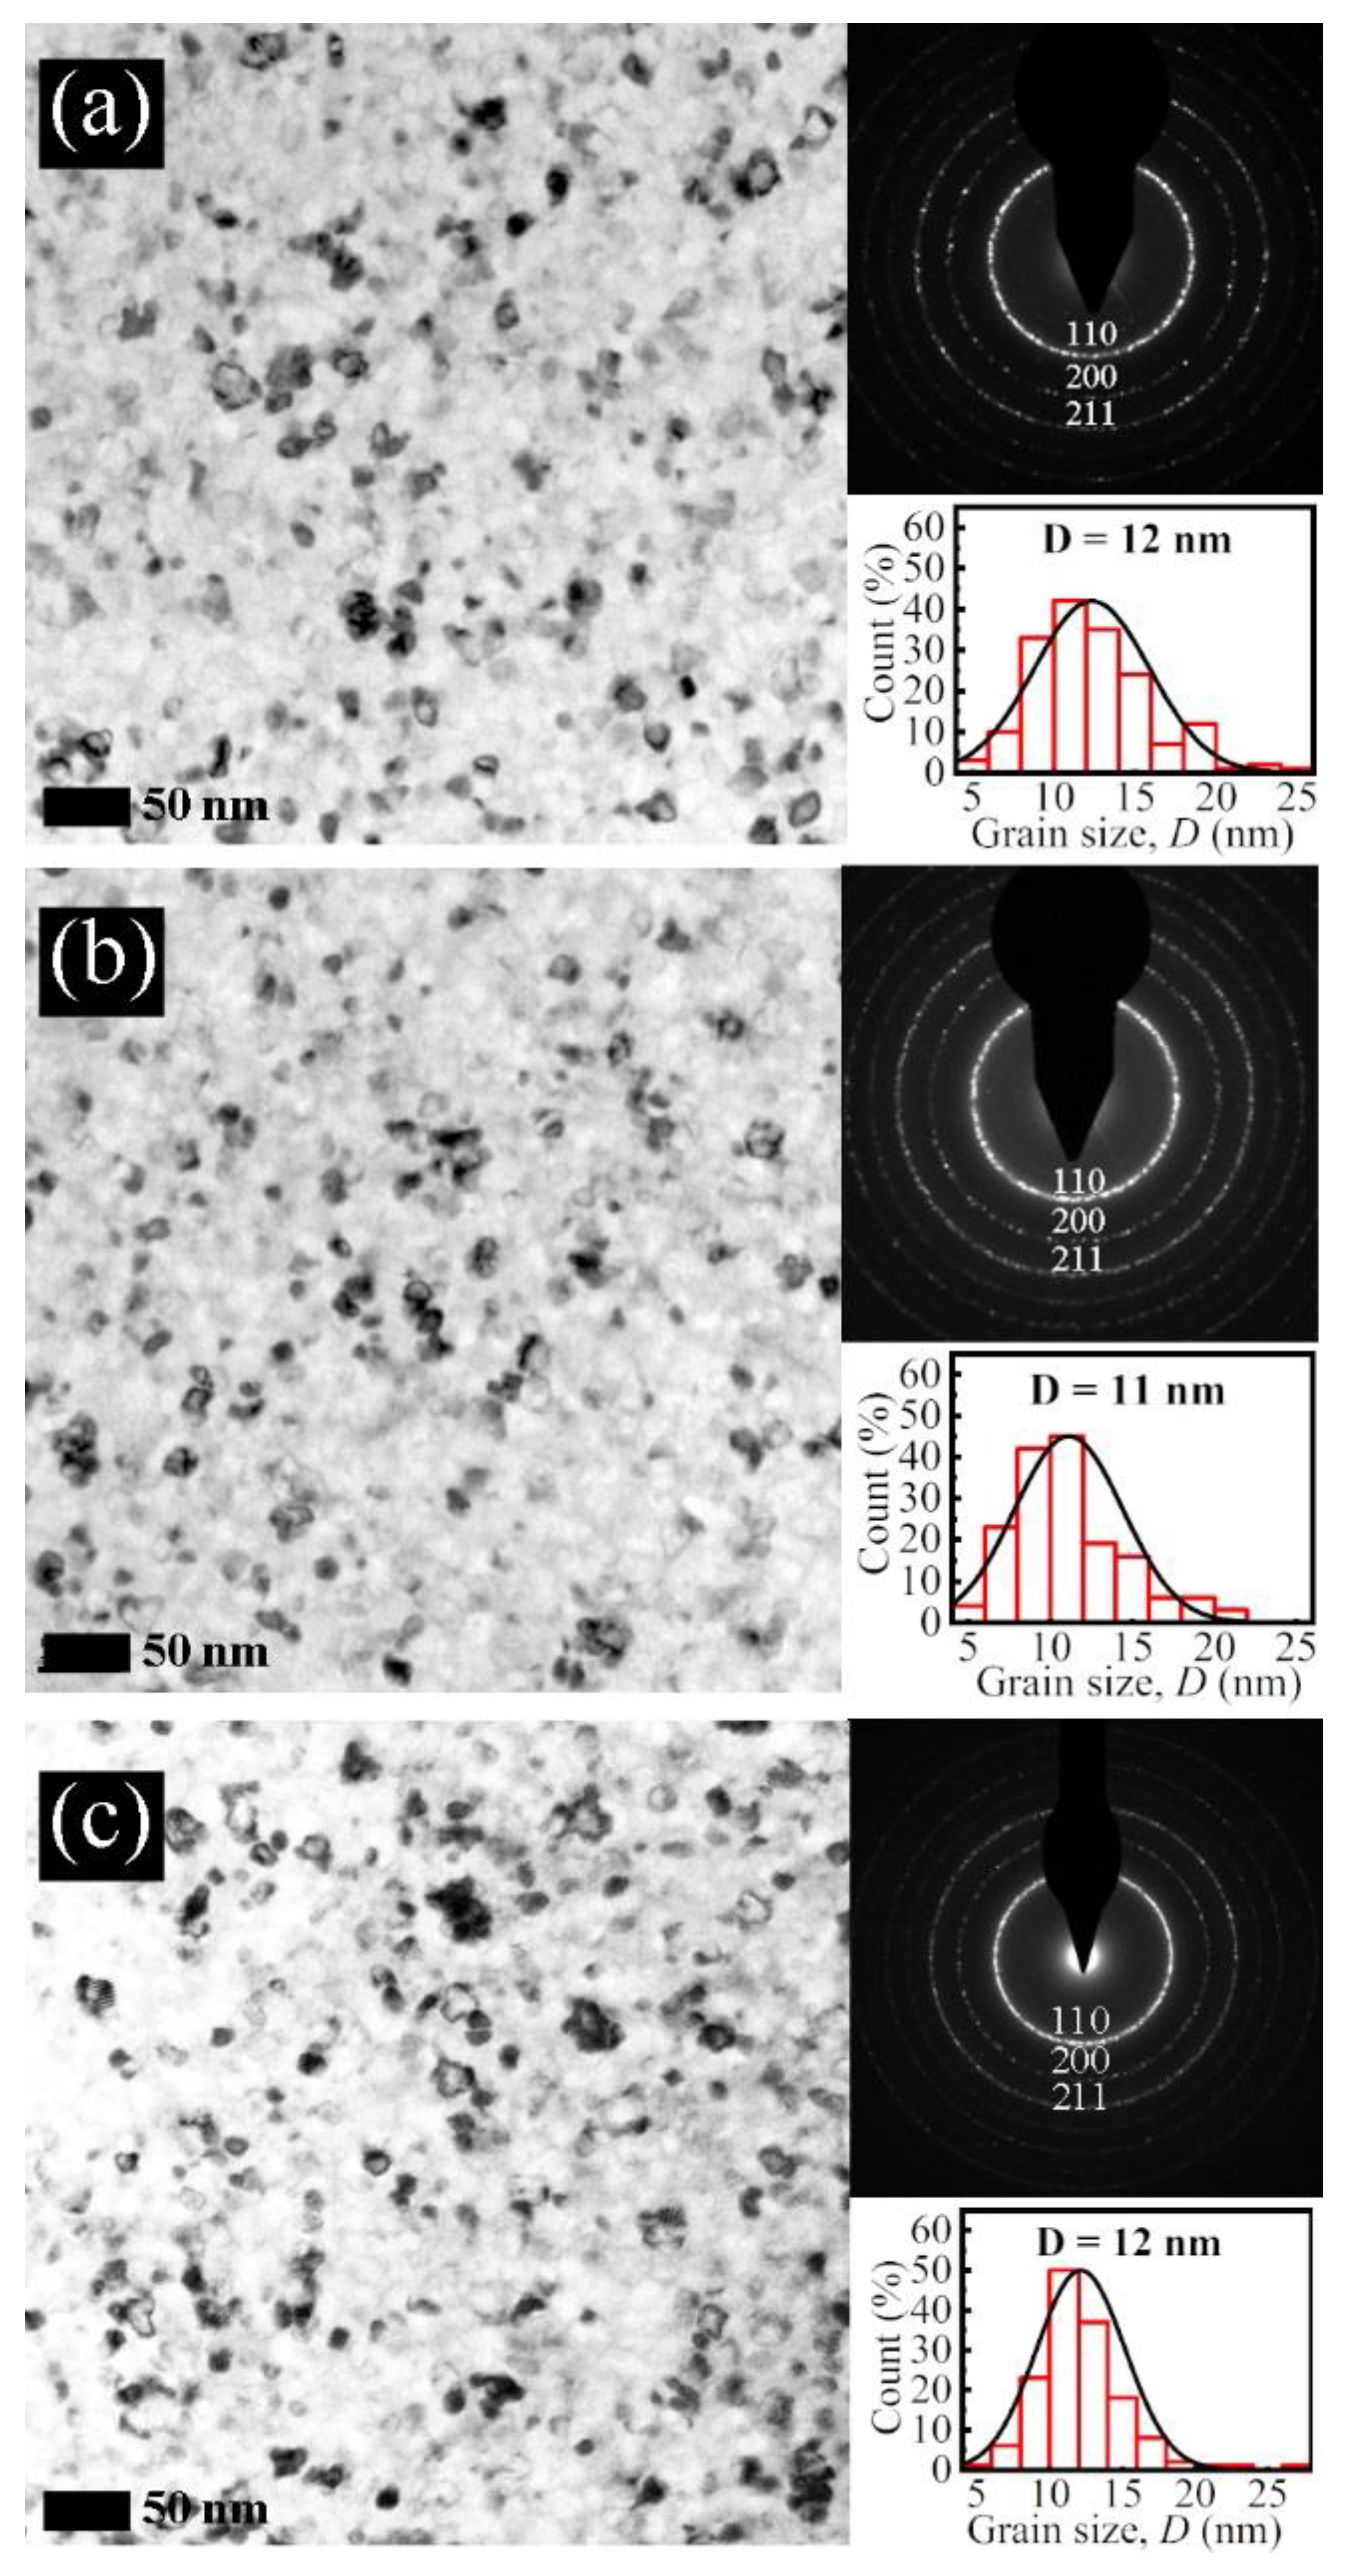
In order to further confirm the influence of P microalloying on the crystalline phase and its size and distribution, we observed the TEM micrographs, selected-area electron diffraction (SAED) and characteristic grain size distribution of the B9Si12, B8Si12P1 and B9Si11P1 ribbons annealed at 550 °C. As shown in Figure 7, all ribbons exhibit a typical nanocrystalline structure where α-Fe(Si) grains (confirmed by the SAED) are randomly embedded in the residual amorphous matrix, which is consistent with the XRD results. The α-Fe(Si) grains of B9Si12, B8Si12P1 and B9Si11P1 have an average size of approximately 12 nm, 11 nm and 12 nm, respectively. The XRD and TEM results indicate that substituting 1 at% P for B and Si is beneficial for reducing the size of α-Fe(Si) grains. In particular, the substitution of P for B is more beneficial to refine grain size than that of P for Si. Since the mixing enthalpies of the P-B atomic pair, P-Si atomic pair and Si-B atomic pair are 0.5 kJ/mol, −25.5 kJ/mol and −14 kJ/mol, respectively [34], the substitution of P for B effectively improved the negative mixing enthalpies of atomic pairs, which helps to inhibit long-range diffusion between atoms [41], making the grain size of B8Si12P1 the smallest. In addition, the grain size of B8Si12P1 is rarely above 22 nm and mainly distributed around 10 nm. Based on the random anisotropy model [36], the smaller the average grain size of α-Fe(Si) grains, the smaller the Hc. Therefore, the reduced grain size of B8Si12P1 is the main factor for achieving the minimum Hc.

4. Conclusions

The effect of P microalloying on the thermal stability, microstructure and magnetic properties of Fe76Cu0.8Nb2.2B9Si12 alloy has been investigated. The slight changes in P, B and Si contents have little effect on Bs, but significantly affect the Hc and μ of the alloy. Substituting 1 at% P for Si has a limited effect in reducing Hc, yet significantly reduces μ. On the other hand, substituting 1 at% P for B can effectively decrease Hc and keep μ basically unchanged. The Fe76Cu0.8Nb2.2B8Si12P1 alloy exhibits good annealing processability, a high Bs of 1.41 T, a great μ of 29,000 at 1 kHz and a low Hc of 0.6 A/m, which can be mainly attributed to the formation of more homogeneous and finer α-Fe(Si) grains.

Author Contributions

J.L.: Conceptualization, Data curation, Formal analysis, Funding acquisition, Investigation, Writing—original draft. Q.D.: Data curation, Investigation, Methodology, Software. C.W.: Investigation, Validation. A.H.: Funding acquisition, Writing—review and editing. Y.D.: Writing—review and editing, D.L.: Writing—review and editing. All authors have read and agreed to the published version of the manuscript.

Funding

This work was supported by National Natural Science Foundation of China (Grant No. 51771215), Public Projects of Zhejiang Province (Grant No. LGG20E010003), Ningbo Major Special Projects of the Plan “Science and Technology Innovation 2025” (Grant No. 2018B10084).

Institutional Review Board Statement

Not applicable.

Informed Consent Statement

Not applicable.

Data Availability Statement

The data presented in this study are available within the paper.

Conflicts of Interest

The authors declare no conflict of interest.

References

  1. Yoshizawa, Y.; Oguma, S.; Yamauchi, K. New Fe-based soft magnetic alloys composed of ultrafine grain structure. J. Appl. Phys. 1988, 64, 6044–6046. [Google Scholar] [CrossRef]
  2. Willard, M.A.; Daniil, M. Chapter Four-Nanocrystalline Soft Magnetic Alloys Two Decades of Progress. In Handbook of Magnetic Materials; Buschow, K.H.J., Ed.; Elsevier: Amsterdam, The Netherlands, 2013; pp. 173–342. [Google Scholar]
  3. Herzer, G. Modern soft magnets: Amorphous and nanocrystalline materials. Acta Mater. 2013, 61, 718–734. [Google Scholar] [CrossRef]
  4. Li, F.C.; Liu, T.; Zhang, J.Y.; Shuang, S.; Wang, Q.; Wang, A.D.; Wang, J.G.; Yang, Y. Amorphous–nanocrystalline alloys: Fabrication, properties, and applications. Mater. Today Adv. 2019, 4, 100027. [Google Scholar] [CrossRef]
  5. Azuma, D.; Ito, N.; Ohta, M. Recent progress in Fe-based amorphous and nanocrystalline soft magnetic materials. J. Magn. Magn. Mater. 2020, 501, 166373. [Google Scholar] [CrossRef]
  6. Lopatina, E.; Soldatov, I.; Budinsky, V.; Marsilius, M.; Schultz, L.; Herzer, G.; Schafer, R. Surface crystallization and magnetic properties of Fe84.3Cu0.7Si4B8P3 soft magnetic ribbons. Acta Mater. 2015, 96, 10–17. [Google Scholar]
  7. Pradeep, K.G.; Herzer, G.; Choi, P.; Raabe, D. Atom probe tomography study of ultrahigh nanocrystallization rates in FeSiNbBCu soft magnetic amorphous alloys on rapid annealing. Acta Mater. 2014, 68, 295–309. [Google Scholar] [CrossRef]
  8. Yoshizawa, Y.; Fujii, S.; Ping, D.H.; Ohnuma, M.; Hono, K. Magnetic properties of nanocrystalline Fe–Co–Cu–M–Si–B alloys (M: Nb, Zr). Mater. Sci. Eng. A. 2004, 375–377, 207–212. [Google Scholar] [CrossRef]
  9. Yoshizawa, Y.; Fujii, S.; Ping, D.H.; Ohnuma, M.; Hono, K. Magnetic properties of nanocrystalline FeMCuNbSiB alloys (M: Co, Ni). Scripta Mater. 2003, 48, 863–868. [Google Scholar] [CrossRef]
  10. Wan, F.P.; He, A.N.; Zhang, J.H.; Song, J.C.; Wang, A.D.; Chang, C.T.; Wang, X.M. Development of FeSiBNbCu Nanocrystalline Soft Magnetic Alloys with High Bs and Good Manufacturability. J. Electron. Mater. 2016, 45, 4913–4918. [Google Scholar] [CrossRef]
  11. Hasiak, M.; Fukunaga, H.; Ciurzyńska, W.H.; Yamashiro, Y. Effect of Co addition on microstructure and magnetic properties of (Fe86−xCox)-Zr-B alloys. Scripta Mater. 2001, 44, 1465–1469. [Google Scholar] [CrossRef]
  12. Li, H.; Wang, A.; Liu, T.; Chen, P.; He, A.; Li, Q.; Luan, J.; Liu, C.T. Design of Fe-based nanocrystalline alloys with superior magnetization and manufacturability. Mater. Today 2021, 42, 49–56. [Google Scholar] [CrossRef]
  13. Shi, L.; Yao, K. Composition design for Fe-based soft magnetic amorphous and nanocrystalline alloys with high Fe content. Mater. Des. 2020, 189, 108511. [Google Scholar]
  14. Makino, A.; Men, H.; Kubota, T.; Yubuta, K.; Inoue, A. FeSiBPCu Nanocrystalline Soft Magnetic Alloys with High Bs of 1.9 Tesla Produced by Crystallizing Hetero-Amorphous Phase. Mater. Trans. 2009, 50, 204–209. [Google Scholar] [CrossRef] [Green Version]
  15. Ohta, M.; Yoshizaw, Y. Magnetic properties of nanocrystalline Fe82.65Cu1.35SixB16−x alloys (x=0–7). Appl. Phys. Lett. 2007, 91, 062517. [Google Scholar]
  16. Parsons, R.; Li, Z.; Suzuki, K. Nanocrystalline soft magnetic materials with a saturation magnetization greater than 2 T. J. Magn. Magn. Mater. 2019, 485, 180–186. [Google Scholar] [CrossRef]
  17. Suzuki, K.; Parsons, R.; Zang, B.; Onodera, K.; Kishimoto, H.; Kato, A. Copper-free nanocrystalline soft magnetic materials with high saturation magnetization comparable to that of Si steel. Appl. Phys. Lett. 2017, 110, 012407. [Google Scholar] [CrossRef]
  18. Ohnuma, M.; Hono, K.; Linderoth, S.; Pedersen, J.S.; Yoshizawa, Y.; Onodera, H. Small-angle neutron scattering and differential scanning calorimetry studies on the copper clustering stage of Fe-Si-B-Nb-Cu nanocrystalline alloys. Acta Mater. 2000, 48, 4783–4790. [Google Scholar] [CrossRef]
  19. Kuhnt, M.; Xu, X.D.; Amalraj, M.; Kozikowski, P.; Pradeep, K.G.; Ohkubo, T.; Marsilius, M.; Strache, T.; Polak, C.; Ohnuma, M.; et al. The effect of Co addition on magnetic and structural properties of nanocrystalline (Fe,Co)-Si-B-P-Cu alloys. J. Alloy Compd. 2018, 766, 686–693. [Google Scholar] [CrossRef]
  20. Wang, C.; Li, J.; Zhang, X.; Wu, J.; He, A.; Dong, Y. Effect of P microalloying on magnetic properties and structure of FeSiBNbCu nanocrystalline alloy. J. Mater. Sci. Mater. Electron. 2021, 32, 4177–4184. [Google Scholar] [CrossRef]
  21. Xiao, H.Y.; Dong, Y.Q.; He, A.N.; Sun, H.; Wang, A.D.; Li, H.; Liu, L.; Liu, X.C.; Li, R.W. Magnetic softness and magnetization dynamics of FeSiBNbCu(P,Mo) nanocrystalline alloys with good high-frequency characterization. J. Magn. Magn. Mater. 2019, 478, 192–197. [Google Scholar] [CrossRef]
  22. Wu, J.; He, A.; Dong, Y.; Li, J.; Lu, Y. Structural and magnetic characterization of Al microalloying nanocrystalline FeSiBNbCu alloys. J. Magn. Magn. Mater. 2020, 505, 166746. [Google Scholar] [CrossRef]
  23. Wu, L.; Li, Y.; Yubuta, K.; He, A.; Zhang, Y.; Zhang, W. Optimization of the structure and soft magnetic properties of a Fe87B13 nanocrystalline alloy by additions of Cu and Nb. J. Magn. Magn. Mater 2020, 497, 166001. [Google Scholar] [CrossRef]
  24. Ohta, M.; Chiwata, N. Development of Fe-based high Bs nanocrystalline alloy powder. J. Magn. Magn. Mater. 2020, 509, 166838. [Google Scholar] [CrossRef]
  25. Ohta, M.; Hasegawa, R.; Itabashi, H. Development of Block Cores Comprising High-Bs Nanocrystalline Alloy Ribbon. IEEE Trans. Magn. 2018, 54, 1–4. [Google Scholar] [CrossRef]
  26. Zanaeva, E.N.; Bazlov, A.I.; Milkova, D.A.; Churyumov, A.Y.; Inoue, A.; Tabachkova, N.Y.; Wang, F.; Kong, F.L.; Zhu, S.L. High-Frequency soft magnetic properties of Fe-Si-B-P-Mo-Cu amorphous and nanocrystalline alloys. J. Non-Cryst Solids 2019, 526, 119702. [Google Scholar] [CrossRef]
  27. Jia, X.; Li, Y.; Xie, G.; Qi, T.; Zhang, W. Role of Mo addition on structure and magnetic properties of the Fe85Si2B8P4Cu1 nanocrystalline alloy. J. Non-Cryst Solids 2018, 481, 590–593. [Google Scholar] [CrossRef]
  28. Fan, X.; Zhang, T.; Jiang, M.; Yang, W.; Shen, B. Synthesis of novel FeSiBPCCu alloys with high amorphous forming ability and good soft magnetic properties. J Non-Cryst Solids 2019, 503, 36–43. [Google Scholar] [CrossRef]
  29. Jia, Y.R.; Wang, Z.; Wang, F.; Han, Y.; Xie, Z.Y.; Li, L.J.; Zhang, L. Effect of P substitution for Nb on structure and soft magnetic properties of Si-rich FeCuNbSiB nanocrystalline alloys. Mater. Sci. Eng. B 2017, 222, 55–59. [Google Scholar] [CrossRef]
  30. Butvinova, B.; Butvin, P.; Brzozka, K.; Kuzminski, M.; Mat’Ko, I.; Sr, P.S.; Chromcikova, M. Effects of surface crystallization and oxidation in nanocrystalline FeNbCuSiB(P) ribbons. J. Magn. Magn. Mater. 2017, 424, 233–237. [Google Scholar] [CrossRef]
  31. Xu, J.; Yang, Y.; Yan, Q.; Hou, F.; Fan, C.; Wang, G.; Luo, T. Effects of the substitution of Si by P on crystallization behavior, soft magnetic properties and bending ductility of FeSiBCuPC alloys. J. Alloy Compd. 2019, 816, 152534. [Google Scholar] [CrossRef]
  32. Xiao, H.; Wang, A.; Zhao, C.; He, A.; Zhang, G.; Li, H.; Li, R.-w.; Liu, X. Industrialization of a FeSiBNbCu nanocrystalline alloy with high Bs of 1.39 T and outstanding soft magnetic properties. J. Mate. Sci. Mater. Electron. 2018, 29, 19517–19523. [Google Scholar] [CrossRef]
  33. Zhang, B.; Yang, F.; He, A.; Xiao, H.; Dong, Y.; Li, J.; Han, Y. Rapid Annealing Optimizing Magnetic Softness and Thermal Stability of Mn-Substituted Fe-Based Nanocrystalline Alloys. Metals 2021, 11, 20. [Google Scholar] [CrossRef]
  34. Takeuchi, A.; Inoue, A. Classification of bulk metallic glasses by atomic size difference, heat of mixing and period of constituent elements and its application to characterization of the main alloying element. Mater. Trans. 2005, 46, 2817–2829. [Google Scholar] [CrossRef] [Green Version]
  35. McHenry, M.E.; Willard, M.A.; Laughlin, D.E. Laughlin, Amorphous and nanocrystalline materials for applications as soft magnets. Prog. Mater. Sci. 1999, 44, 291–433. [Google Scholar] [CrossRef]
  36. Herzer. Chapter 3-Nanocrystalline soft magnetic alloys. In Handbook of Magnetic Materials; Buschow, K.H.J., Ed.; Elsevier: Amsterdam, The Netherlands, 1997; pp. 415–462. [Google Scholar]
  37. Makino, A. Nanocrystalline Soft Magnetic Fe-Si-B-P-Cu Alloys With High Bs of 1.8–1.9T Contributable to Energy Saving. IEEE Trans. Magn. 2012, 48, 1331–1335. [Google Scholar] [CrossRef]
  38. Cullity, B.D.; Stock, S.R. Elements of X ray Diffraction, 3rd ed.; Prentice Hall: Upper Saddle River, NJ, USA, 2001. [Google Scholar]
  39. Mitra, R.; Ungár, T.; Weertman, J.R. A comparison of grain size measurements by X-ray diffraction and transmission electron microscopy methods. Trans. Indian Inst. Met. 2005, 58, 1125. [Google Scholar]
  40. Gubicza, J. X-ray Line Profile Analysis in Materials Science; IGI-Global: Hershey, PA, USA, 2014; ISBN 978-1-4666-5852-3. [Google Scholar]
  41. Inoue, A. Stabilization of metallic supercooled liquid and bulk amorphous alloys. Acta Mater. 2000, 48, 279–306. [Google Scholar] [CrossRef]
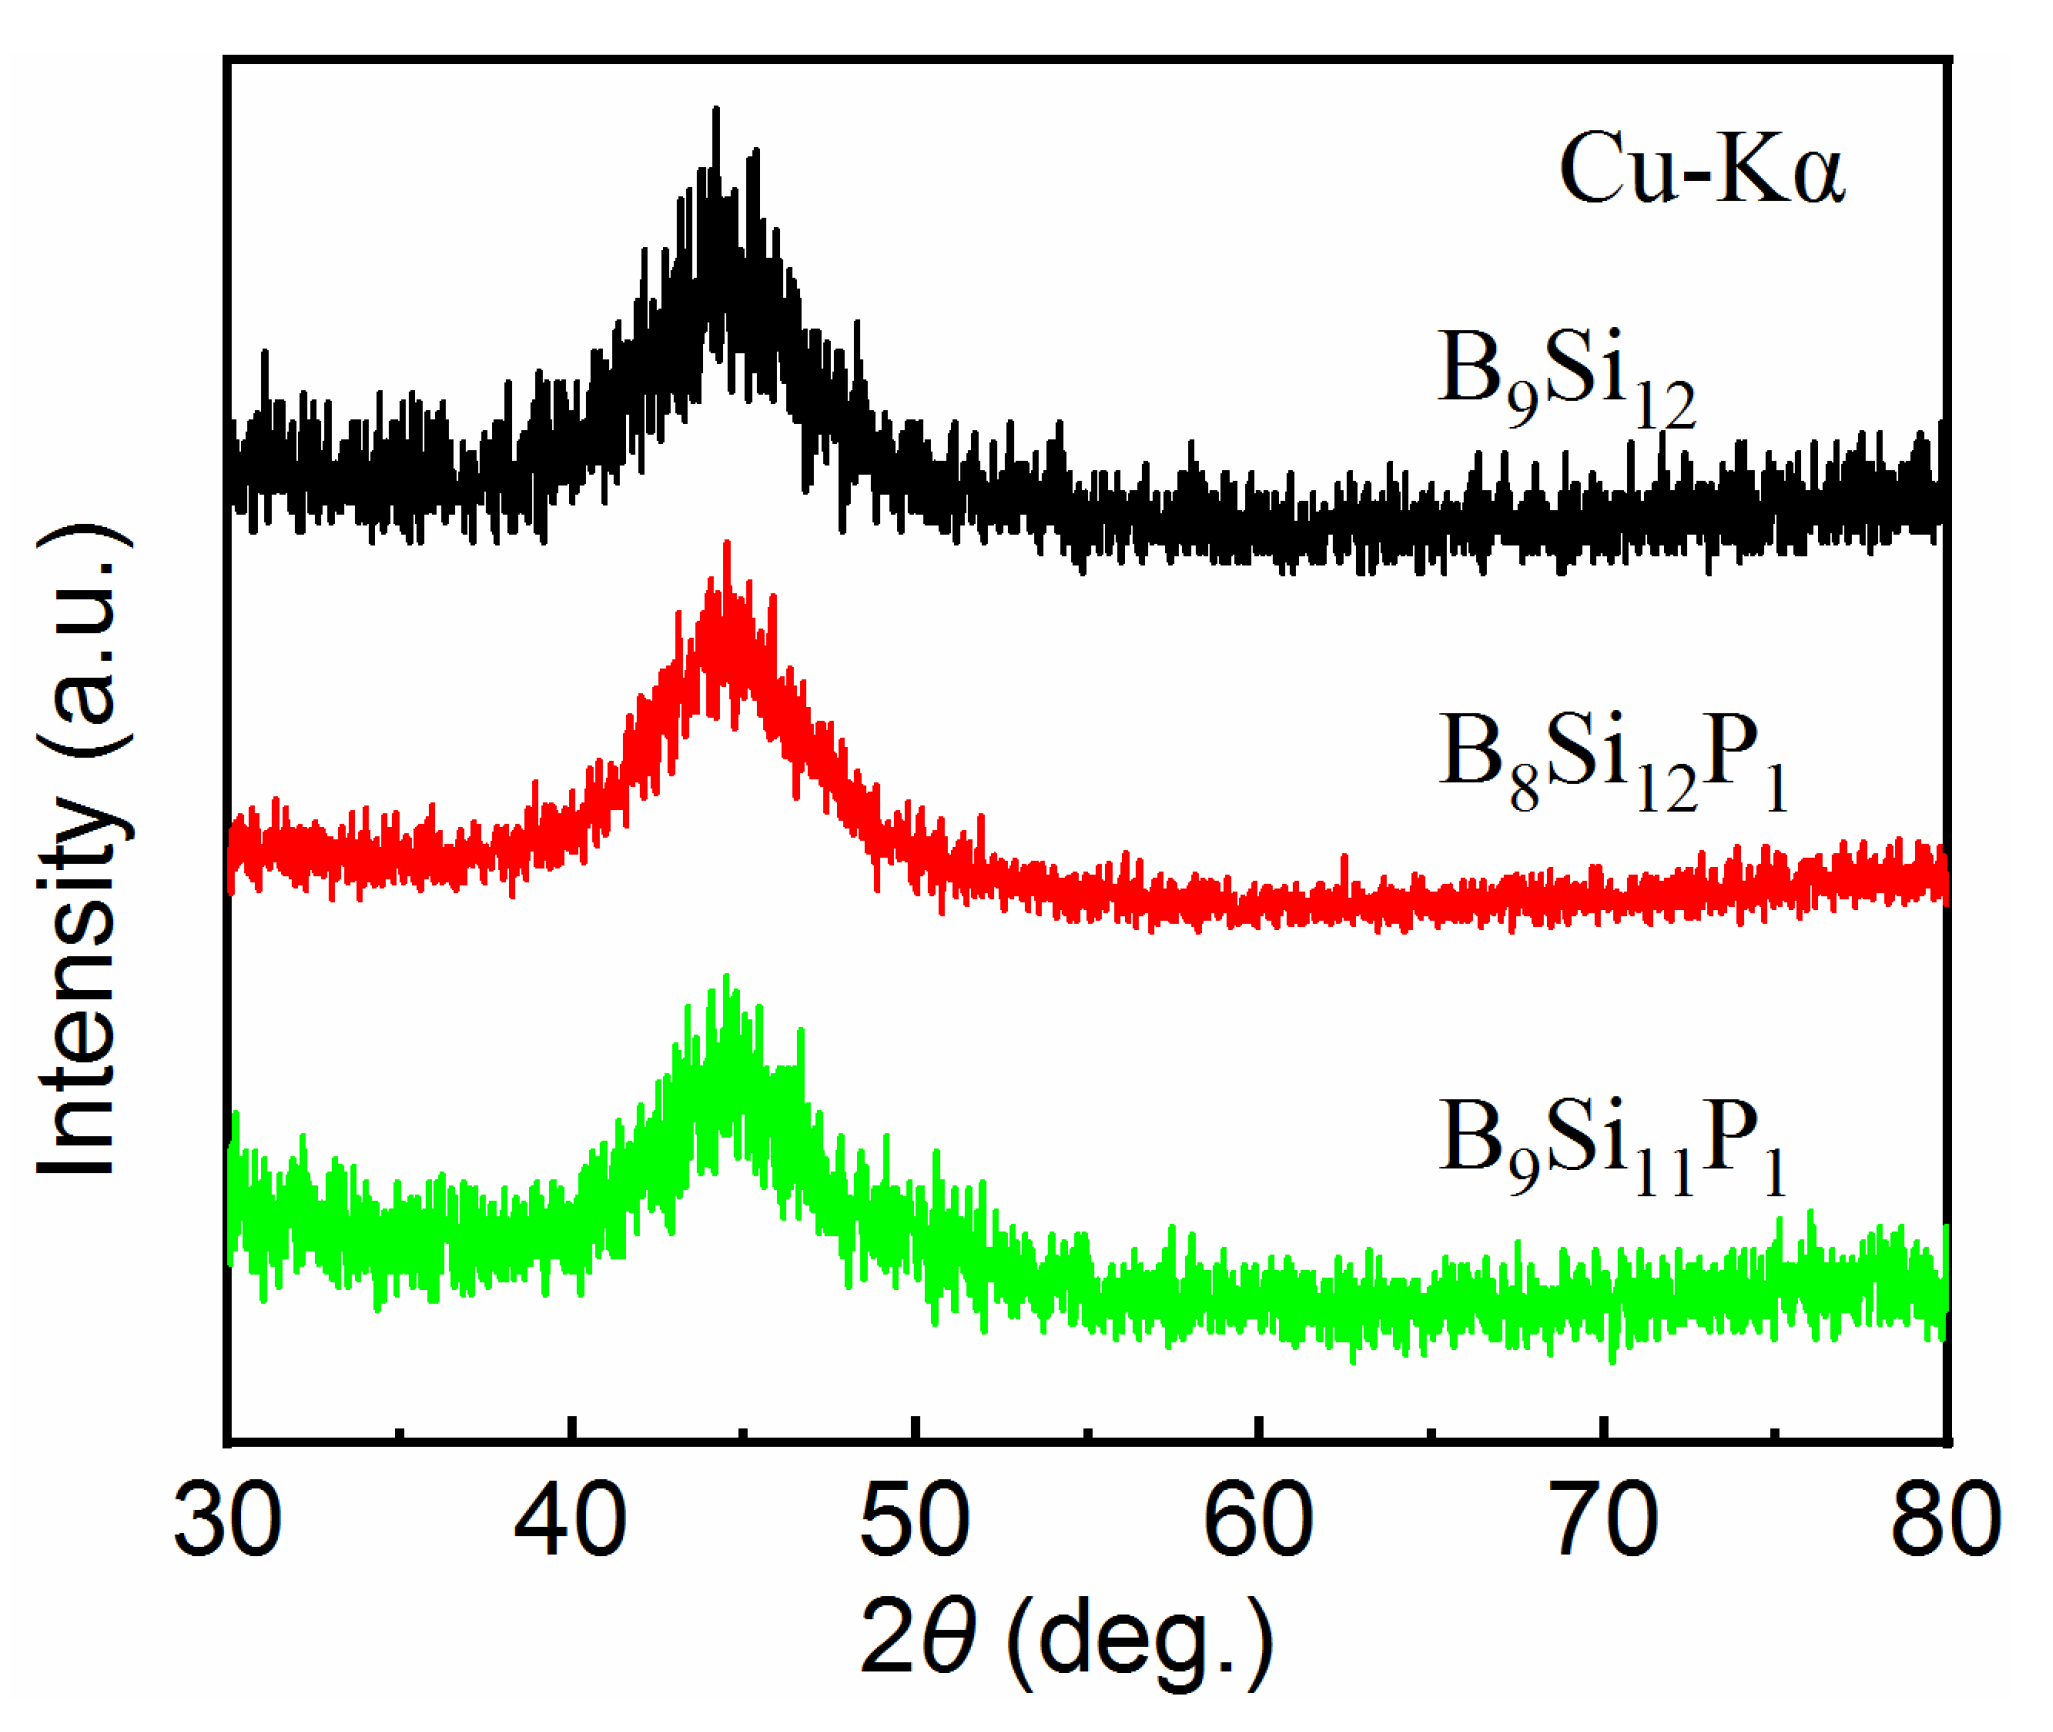
Figure 1. XRD patterns of melt-spun Fe76Cu0.8Nb2.2B9Si12 (B9Si12), Fe76Cu0.8Nb2.2B8Si12P1 (B8Si12P1) and Fe76Cu0.8Nb2.2B9Si11P1 (B9Si11P1) ribbons.
Metals 11 01110 g001
Figure 2. DSC curves of melt-spun B9Si12, B8Si12P1 and B9Si11P1 ribbons at a heating rate of 0.67 °C/s. Tx1 and Tx2 denote the first and second onset crystallization temperatures, respectively. ΔT = Tx2Tx1, reflecting the annealing temperature range for obtaining single fine nanocrystalline grains.
Metals 11 01110 g002
Figure 3. Hc of B9Si12, B8Si12P1 and B9Si11P1 ribbons as a function of annealing temperature. The annealing time is 60 min.
Metals 11 01110 g003
Figure 4. μ of B9Si12, B8Si12P1 and B9Si11P1 ribbons at 1 kHz as a function of annealing temperature. The annealing time is 60 min.
Metals 11 01110 g004
Figure 5. Typical hysteresis loops of B9Si12, B8Si12P1 and B9Si11P1 ribbons annealed at 550 °C for 60 min.
Metals 11 01110 g005
Figure 6. XRD patterns of B9Si12, B8Si12P1 and B9Si11P1 ribbons annealed at 550 °C for 60 min.
Metals 11 01110 g006
Figure 7. TEM micrographs, SAED and characteristic grain size distribution of (a) B9Si12, (b) B8Si12P1 and (c) B9Si11P1 ribbons annealed at 550 °C for 60 min.
Metals 11 01110 g007
Publisher’s Note: MDPI stays neutral with regard to jurisdictional claims in published maps and institutional affiliations.