Article

Failure Mechanism and Strength Prediction Model of T-Joint of Composite Sandwich Structure

School of Mechanical and Power Engineering, Nanjing Tech University, Nanjing 211816, China
*
Authors to whom correspondence should be addressed.
Metals 2021, 11(8), 1197; https://doi.org/10.3390/met11081197
Submission received: 10 June 2021 / Revised: 19 July 2021 / Accepted: 22 July 2021 / Published: 27 July 2021
(This article belongs to the Special Issue Special Materials for Shipbuilding)

Abstract

:
Composite sandwich structures are widely used in many fields. T-joint plays a significant role in the composite sandwich structural connection. In this paper, a type of adhesive T-joint was manufactured and tested under bending and shearing load. According to the experiment, the finite element model was established to reveal the failure process. A strength prediction model was proposed based on the simulation. The results showed that the T-joint’s lower connector and the web’s lower face panel controlled its maximum load-bearing capacity, and the failure mode is the fiber compressive damage. The predicted ultimate bearing capacity of the T-joint showed a good agreement with the simulation, and the maximum relative error was less than 3%.

1. Introduction

The composite sandwich structure has become a potential lightweight alternative option in aviation, aerospace, navigation, construction, vehicle engineering, rail transit, and other fields due to its excellent specific stiffness, specific strength, functional integration, and designability. In the marine industry, the lightweight of the superstructure can lower the ship’s center of gravity, improve the ship’s navigation performance, and save fuel. Due to the large scale and complex structure, it is inevitable to apply various connections in the superstructure. Due to the unweldability of fiber-reinforced composites, the bonding technology of composites is the key to restricting the application of composites. Due to the unique structure form of the composite sandwich structure, the mechanical properties of the joints have become a hot spot [1].
Composite structures were widely used in load-bearing structures. The composite sandwich panels could meet bearing requirements with a lighter mass than aluminum alloy or steel. The sandwich panel was the main body of composite structures. Its mechanical properties seriously affect the overall performance of the structure. Hou et al. [2], Bedon [3], Zhao et al. [4], and Fan et al. [5] subjected the sandwich panels with different lattice cores to edgewise compression loading. Failure modes were observed. The interfacial properties between core and face sheets affect the overall property of the panels significantly. With different interfacial strengths, global buckling, interface debonding, local buckling, or strength fracture may occur. Bending load is another major load that the structure needs to bear. Lu [6], Li [7], Serna et al. [8], Liu [9] and Sun et al. [10] investigated the sandwich panels’ mechanical responses under bending load. The results showed that the different combinations of face and core would make the failure modes various. When the interface is strong enough, the face sheets’ strength can be fully exploited. The core in bending serves as support between two face sheets. The sandwich panels with good bending and edgewise compressing properties would provide a good load-bearing capacity if the connections are strong enough.
The primary connection forms of composite materials include mechanical connection, adhesive connection, suture connection, Z-PIN connection, mixed connection, etc. Due to the limitation of equipment, suture connection and Z-pin connection are only used as auxiliary means, which cannot meet the requirements of mass manufacturing in terms of construction efficiency [11]. As the bonding technology of composite materials becomes more and more mature, its application in production and daily life is increasing. This benefits from the researchers’ in-depth study on the bonding technology of composite materials [12]. On the other hand, the bonding performance of adhesive materials is getting better, while the price is reduced, which makes its cost performance significantly improved. The research on the bonding of composite materials began in the 1940s. Aimmanee et al. [13] established a mathematical model of variable stiffness bonded pipe joints to study the influence of geometric shape on the bonding stress of the joints.
T-joint is a typical joint in structural connection, which plays the role of connecting two plates or beams in different directions, such as the connection between the cabin deck and the bulkhead of a ship. The joint structure is discontinuous, and the loading condition is complicated. T-joints bear both shear loads and additional bending moments due to eccentric loading. Therefore, the performance of the T-joint is critical to the structural performance. Researchers have carried out many studies on T-joints of composite structure, of which the most common method is to test the mechanical properties of T-joints. The early studies were mainly focused on the failure process and failure mode in the experimental procedure. With the development of finite element technology, the numerical simulation method has shown significant advantages in strength check, damage mode discussion, structural optimization design, and other aspects of composite connection structure. More and more researchers choose to study composite material T-joint by combining experiments and numerical simulation [14,15]. Koricho et al. [16] studied the transverse bending mechanical properties of carbon fiber fabric/epoxy composite T-joint by combining experimental and numerical simulation. T-joint was made by RTM (resin transfer modeling) process. The failure mode is fiber tensile failure. The experiment and the finite element simulation are in good agreement with each other. According to the experiment and the simulation, the error of strength of the T-joint is about 20%, and the error of stiffness is less than 3%.
Bigaud et al. [17,18,19,20] designed and prepared a composite T-joint and revealed the influence of the failure mode of the T-joint on the ultimate bearing capacity of the structure under tensile load. Mohammad et al. [21] tested the mechanical properties of composite sandwich structure T-joints under different aging environments. Wu et al. [22] established a finite element model of composite T-joint under tensile load based on the Tsai-Wu failure criterion and the cohesive model. Failure mechanism, ultimate bearing capacity, and in-plane and interlayer damage behavior of the T-joint were simulated and analyzed. The results show that the bearing capacity of the composite T-joint is mainly determined by the failure mode, which can be realized by reducing the filling rate of the T-joint fillet or changing the initiation and propagation path of delamination cracks between fillet and rib. Burns et al. [23] designed and fabricated a composite T-joint bearing bending load. By optimizing the lay-up angle, the interlaminar tensile stress was minimized. Compared with the original structure, the initial bending load of failure of the optimal structure was increased by 40%, and the elastic strain energy was increased by 75%. Hisada et al. [24] examined the relationship between the strain distribution and the failure pattern of the deltoid in T-joint. Three types of deltoid structures were used. A deltoid configuration to suppress process-induced failure was established based on the experiment results and analysis to enhance the T-joint’s property. Abbasi et al. [25] investigated the properties of through-thickness weaving of thin metal filaments reinforced T-shaped laminate joints. Stiffener pull-off tests were performed on the cured T-joints. The results demonstrate that through-thickness weaving of continuous metallic filaments is highly effective at strengthening T-joints made of laminated composites. Mohsen et al. [26] investigated the failure assessment and stress distribution on the adhesive region in a composite T-joint under bending load case using the cohesive zone method (CZM). Different adhesives and geometrical parameters are considered in the investigation of micromechanical properties of reinforced fiber composite adherends. The results show that the fiber volume fraction of composite adherends has a significant effect on failure behavior. Ravindran et al. [27] presented an experimental study into the strengthening of composite T-shaped joints using carbon nanoparticles. The experiment reveals that the strengthening effect of carbon nanofibers is the best. Carbon nanofibers could enhance the interlaminar fracture toughness properties. Therefore the T-joint properties are improved. Guo et al. [28] investigated the failure mechanism and strength improvement of a composite sandwich T-joint bonded and reinforced by fasteners made of thermoplastic composite. Numerical simulation and experiment revealed that the fasteners could reinforce bonded interface to avoid shear failure. The bonding strength of the reinforced T-joint showed a nearly 19% increase compared to the T-joint without fasteners. Bai et al. [29] investigated the mechanical behavior of the RTM (resin transfer molding)-made composite T-joints under tensile loading. Initial failure and damage evolution behaviors of the T-joint were revealed. Progressive damage models were established based on the Hashin, Chang-Chang, Hou criteria and the mixed criterion. Simulation based on the mixed criterion showed the best correlation with the experiments because the interlaminar delamination could be identified. Khosravani et al. [30] investigated the honeycomb sandwich T-joints with different strain rates experimentally and numerically. The influence of different loading conditions on failure and fracture of honeycomb sandwich T-joints was revealed. Hou et al. [31] established a multi-objective design optimization methodology on geometry and lay-ups for carbon fiber reinforced plastics (CFRP) T-joints in automobiles. The CFRP T-joint was subjected to an out-of-plane bending load. The result of the bending test of the optimized hat-shaped composite T-joint verified the optimization methodology. Omidali et al. [20] investigated the common lightweight T-joint with triangle fillets and modified the geometry based on FEM to increase the tension load-bearing capacity. The results showed that a change in joint geometry could dramatically enhance strength. Adhesion interfaces were modeled with contact elements along with the Cohesive Zone Model in ANSYS. The results of numerical analyses were in good agreement with experimental tests. Khosravani et al. [21] investigated composite honeycomb sandwich T-joint connections experimentally. Quasistatic tension experiments revealed the effect of loading and aging on the adhesively bonded joints. The results showed that all sandwich specimens fail by brittle fracture of the adhesive. The aging effect on the strength is mainly caused by the exposure time rather than the temperature range.
To sum up, the research on composite T-joint mainly focuses on the mechanical joint, hybrid joint, and adhesive joint. When applied to the ship superstructure, the mechanical joint cannot achieve good radar stealth performance, and the weight of the connection is too large. Mechanical joint requires cutting holes in the composite laminates to be connected, which will cause damage around the hole and reduce the strength and fatigue resistance of the overall connection structure. In contrast, composite bonding avoids the drawbacks of mechanical joint. While ensuring the strength of the structure, it also meets the requirements of a lightweight structure.
This study aims to investigate the failure mechanism of the new type of adhesive T-joint under bending and shearing load. A rapid and effective prediction model of the T-joint was established to provide a reference for engineering designers about the T-joint’s mechanical properties. This predictive model is based on 2D structure in which the flange plate forms the rigid base, and the web together with two connectors are represented as beams connected with rotary joints. So a bunch of costs and time could be saved in the design process. The T-joint used in the superstructure was manufactured by vacuum assisted resin injection (VARI) process and tested according to its actual working condition. A progressive damage Finite element (FE) analysis model was proposed to reveal its failure mode and ultimate load-bearing capacity. Different failure modes were distinguished in this model. The research in this paper could provide technical support for lightweight construction on ships.

2. Materials and Methods
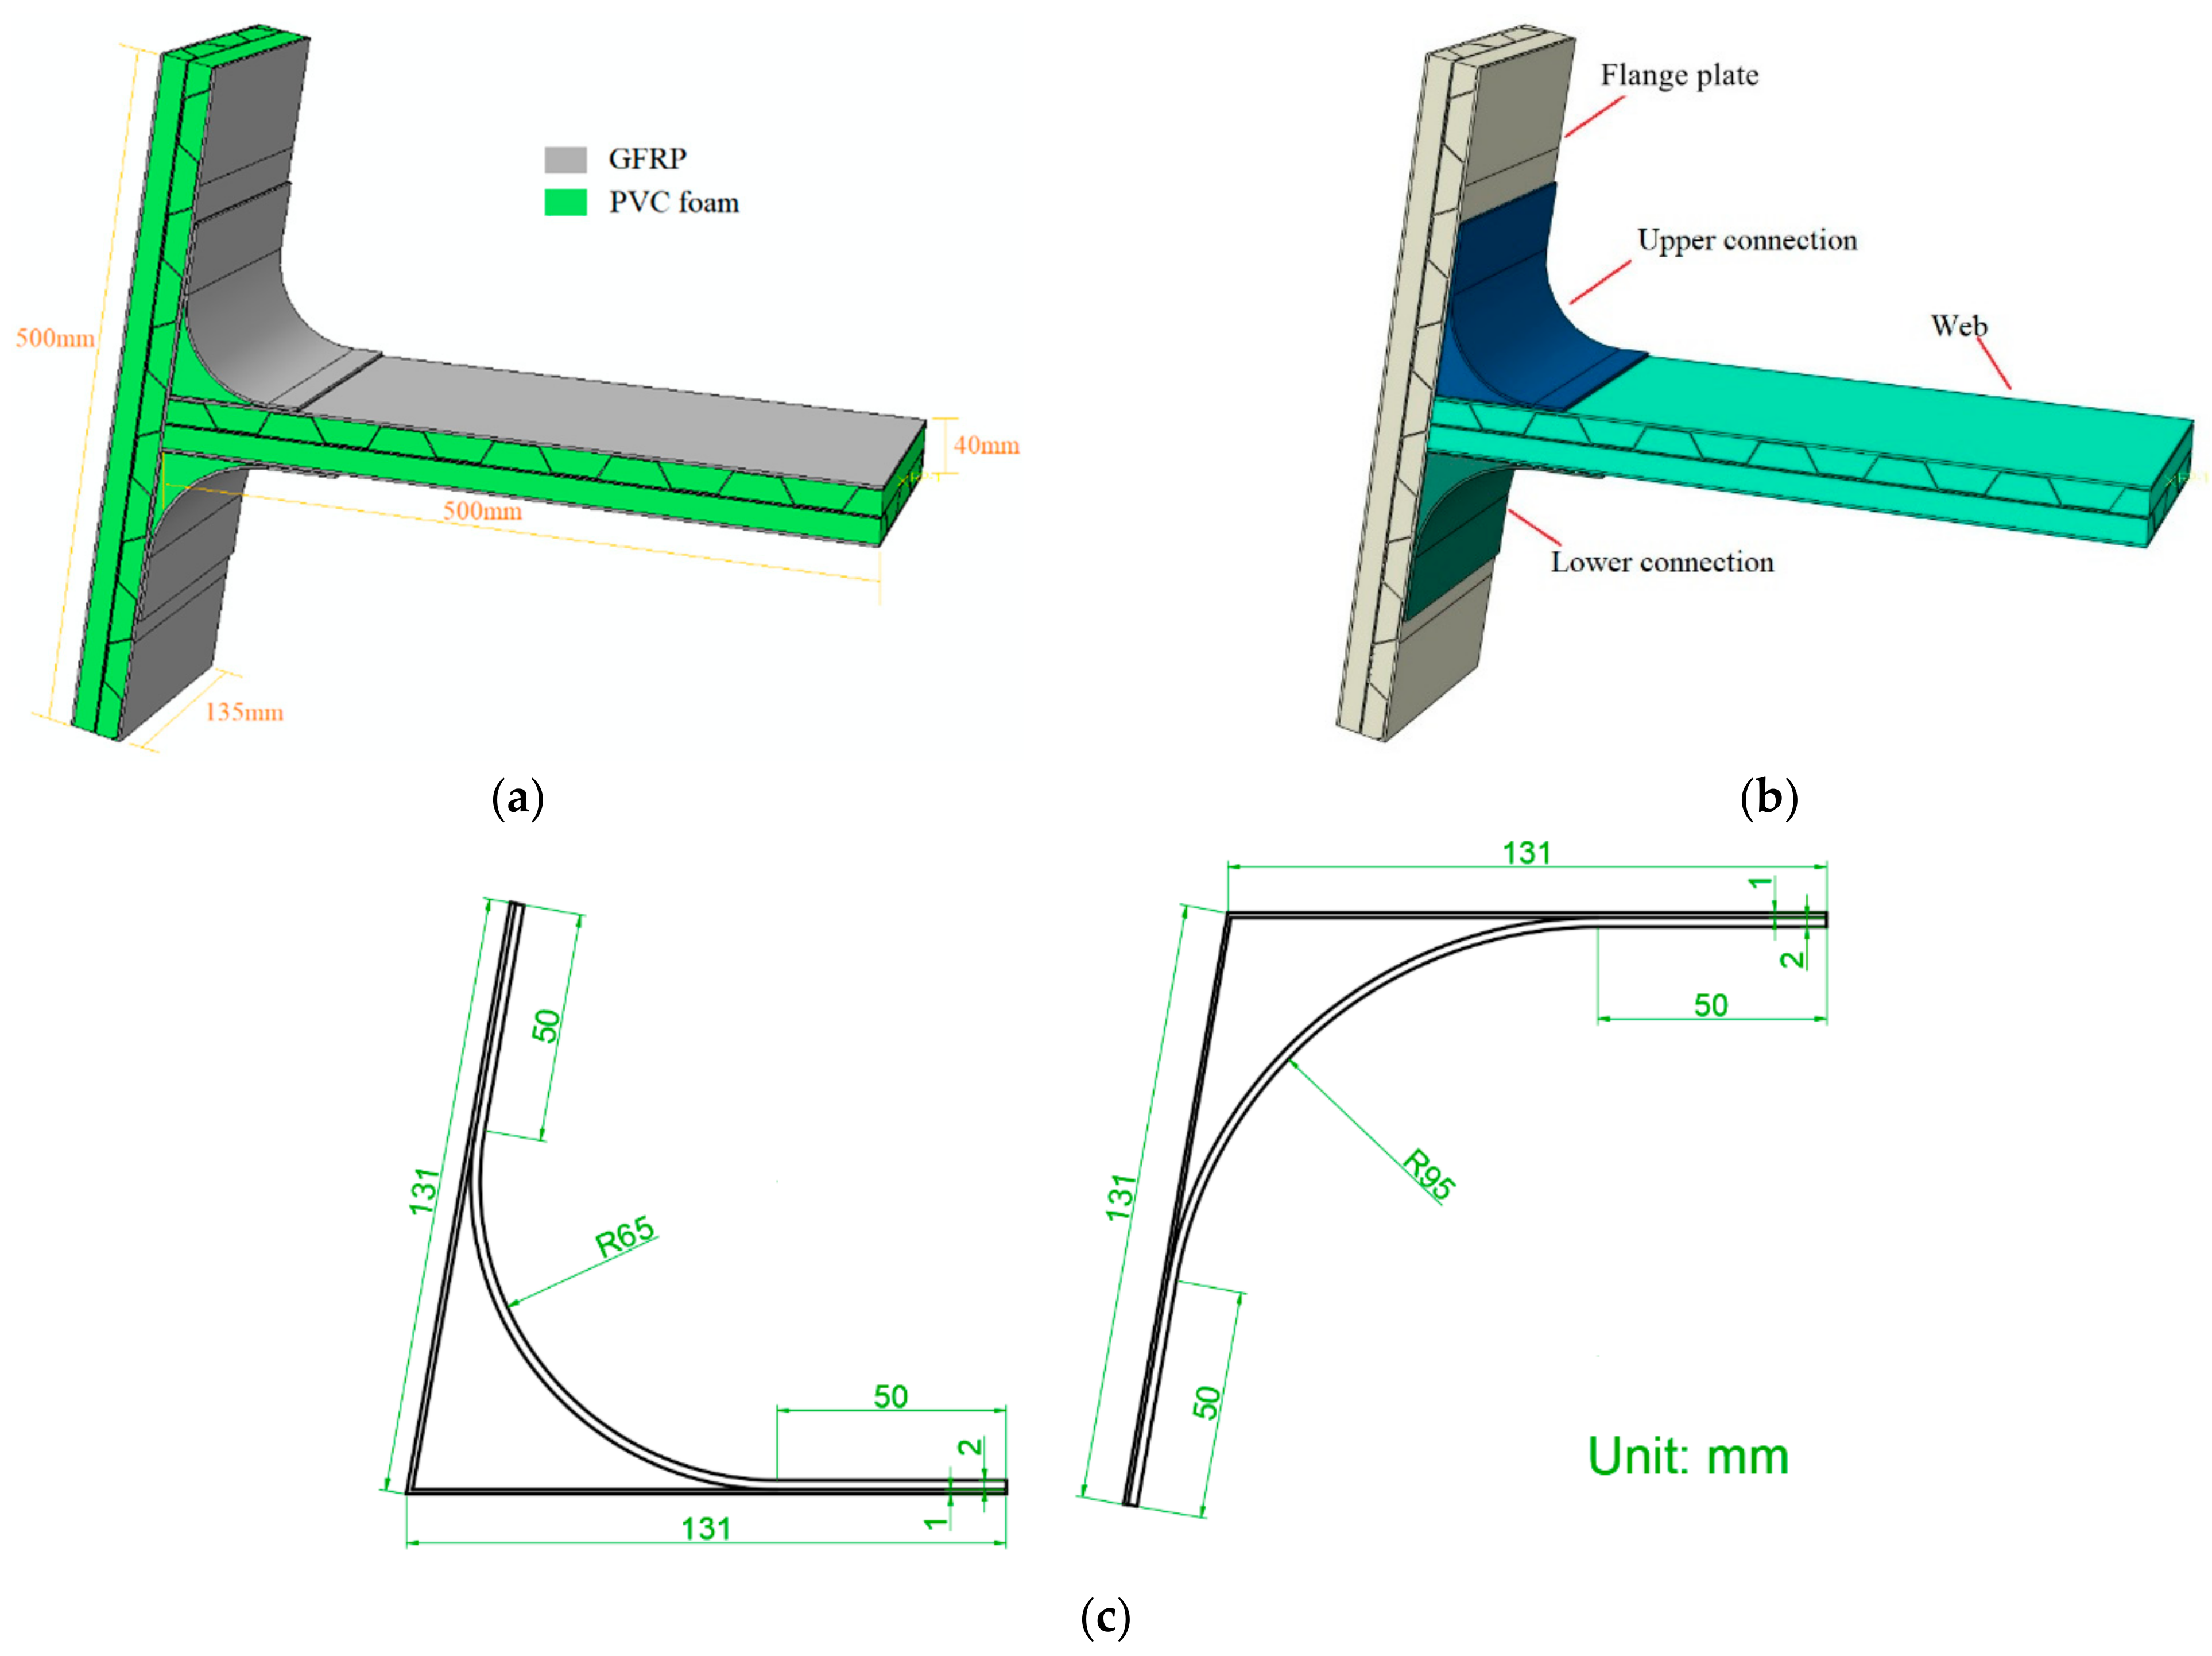
2.1. Experiment

T-joint of the composite sandwich structure consists of flange plate, web, upper and lower connectors, as shown in Figure 1. The flange plate and web are double-layer corrugated composite plates made of glass fiber reinforced polymer (GFRP) and polyvinyl chloride (PVC) foam and were prepared by vacuum assisted resin injection (VARI) process, as shown in Figure 2. In order to ensure the geometric accuracy of the upper and lower connectors, the preparation mold of the connector is designed, as shown in Figure 3a. The mold surface is wrapped with a high-temperature demolding cloth for easy demolding of connecting parts. The preparation process is shown in Figure 3b,c. The preparation process is shown in Figure 3b,c. It can be seen in Figure 3c that the connectors are made of GFRP and PVC foam. The PVC foam was cut to the needed shape and taken as the light core of the connectors. The glass fiber sheet and the resin constituted the outer and inner skin to carry the main load. Auxiliary materials were placed on the glass fiber sheets and would be removed after resin curing. The vacuum bag was sealed on the platform by sealant tape and could press all material inside with the help of a vacuum pump. The resin was injected into the bag at the same time. The T-joint was made of 200 g/m2 plain-woven glass fiber cloth and resin of Merican 30-200P. The laminate structure and material of flange plates, webs, upper and lower connectors are shown in Table 1.
The upper and lower connectors, flange plate, and web are connected by a secondary bonding process, as shown in Figure 4. The components of the T-joint were placed at the multi-function clamping platform and fixed. The structural adhesive was applied to the bonding surface and the members of the T-joint were clamped by G-shape clamps. The epoxy adhesive of Lord 320/322 was used. After curing 24 h at room temperature, the composite sandwich structure samples were prepared, as shown in Figure 5.
T-joints of composite sandwich structures are mainly used to connect sidewalks and decks. As the deck needs to carry equipment, the joint mainly bears the mass load on the deck. According to the service conditions of the T-joint, a testing platform for the bending and shearing mechanical properties of the T-joint was designed, as shown in Figure 6. The side plate of the fixture is at an angle of 80° to the bottom plate. The fixture was fixed on the platform of the MTS 311.12 testing machine (MTS System Corp., Eden Prairie, MN, USA). The end of the loading head was a cylinder with a diameter of 20 mm. The bending mechanical properties of the T-joint were tested by displacement loading with a loading speed of 2 mm/min.

2.2. Finite Element Analysis Method for T-Joint

ABAQUS (Ver 6.13, Dassault Systemes Corp., Paris, France) was used to simulate the mechanical behavior of the T-joint. As shown in Figure 7a, the simplified geometric model without the fixture was established according to the specimen. Solid support constrained the top and bottom of the flange plate, and the web was subjected to displacement load at a loading rate of 2 mm/min. 3D-Hashin failure criterion [32] and Chang-Chang damage evolution criterion [33] are adopted to composite materials. Mechanical parameters are shown in Table 2. The PVC foam adopts the Crushable Foam constitutive relation, and its material parameters are shown in Table 3. The cohesive behavior was adopted to the interface between upper and lower connectors, flange plate, and web. Its performance parameters are shown in Table 4. The finite element mesh model is shown in Figure 7b. The mesh type is C3D8R, and the element number is 218078.

2.3. Ultimate Bearing Capacity Prediction Model of the T-Joint

T-joint is one of the key joints of ship superstructure, and its bearing capacity is one of the core elements of composite superstructure design. The design of the T-joint is very complicated due to the discontinuous and heterogeneous nature of the structure, and the nonlinearity of the materials’ mechanical properties. The nonlinearity of T-joint and mechanical properties of materials lead to the complexity of the joint design. The flanges, webs, and upper and lower connectors are simplified in this paper, and the external force balance relation of each bar is established. Then, based on the artificial neural network algorithm, the strength prediction model of the simplified lower connector is established. Based on this, the ultimate bearing capacity prediction model of the T-joint is established.

2.3.1. Simplified Mechanical Model of T-Joint

When the members of the T-joint were bonded together, it was the contact area between the web and the flange plate, and the connectors’ inner skin were thin. Hence the junction area of the T-joint could not provide sufficient bending resistance, so that the junction node is assumed to be a hinge point. At the same time, in the connection area, the connector is bonded to the flange plate and web, and the connector has a certain reinforcing effect on the flange plate and web, restraining the local deformation of the flange plate and web. So it is simplified into bars, and then the simplified model of the T-joint is shown in Figure 8a. When the joint is subjected to the concentrated load F, the stress analysis of the bar No. 3 is shown in Figure 8b.
The force balance equation and moment balance equation are established, as shown in Equations (1)–(3).
F 2 × cos α + F 3 × sin γ = F 1 × cos β
F 1 × sin β + F 2 × sin α + F 3 × sin γ = F
F 1 × L 1 sin β + F 2 × L 2 × sin α = F × L 3
where F (N) is the binding force of bar No. 3. L (mm) is the distance between the operation point and the articulated point of bar No. 3. In this paper, L1, L2, and L3 are 80 mm, 72.59 mm, and 500 mm, respectively. α is the angle between bar No. 2 and bar No. 3, which is 50° in this paper. β is the angle of bar No. 1 and bar No. 3, which is 40° in this paper. γ is the angle between bar No. 3 and the fixed wall, which is 80°. By combining Equations (1)–(3), the binding force of each bar can be obtained, as shown in Equations (4)–(6).
F 1 = F L 2 × sin γ × sin α + F × ( L 3 L 2 ) × cos ( γ α ) L 2 × sin γ × sin ( α + β ) + ( L 1 L 2 ) × sin β × sin ( γ α )
F 3 = F × ( L 2 L 3 ) L 2 × sin γ ( L 2 L 1 ) L 2 × sin γ × F L 2 × sin γ × sin α + F × ( L 3 L 2 ) × cos ( γ α ) L 2 × sin γ × sin ( α + β ) + ( L 1 L 2 ) × sin β × sin ( γ α )
F 2 = F 1 × cos β F 3 × sin γ cos α

2.3.2. The Calculation Model of Bending Ultimate Bearing Capacity of Composite Laminates Based on Neural Network

The design of the T-joint is complicated, and the necessary FEM analysis is time-consuming. Therefore, a simplified model was established as a simple and efficient design aid. The model is based on 2D structure in which the flange plate forms the rigid base, and the web together with two connectors are represented as beams connected with rotary joints. The bearing capacity of this model is defined by the strength of the lower joint, which is modeled separately using FEM, and its strength is described in relation to its geometry using artificial neural network (ANN).
From the analysis above, the circular arc part was the weakness of the lower connector. The compression bending failure of bar No. 1 in the 2D simplified model is the main failure mode of the T-joint. Therefore, establishing the compressive bending strength calculation model of the laminated plate model is the key to establishing the calculation model of the ultimate bearing capacity of the T-joint. The compression bending strength of laminates in-plane is greatly affected by the geometrical parameters and the mechanical properties of materials. The damaged laminates are mostly progressive, so it is difficult to calculate the bending strength by a simple theoretical formula. In this paper, the neural network algorithm is used to establish the calculation model of laminated plates’ flexural ultimate bearing capacity.
The artificial neural network is a mathematical model which integrates computing units and computational relations. Among many neural network bolts, BP neural network algorithm has become a powerful tool to solve complex engineering and scientific problems with its excellent ability of nonlinear mapping, self-learning and adaptive ability, generalization ability, and fault tolerance ability.
Plain woven fabric has been widely used in the preparation of large composite structures because of its excellent technological properties and mechanical properties. Therefore, plain woven cloth is used as the preparation material of flange plate, web, and connector in this paper, so the laying angle of fiber cloth is not used as the input node. The sample length, l, width, w, thickness, t, composite compressive strength, XC, and interlamination shear strength, τyz, were selected as input nodes. The bending strength of the sample was taken as output nodes. Then, the number of neurons in the input layer is I = 5. The number of neurons in the output layer is O = 1. Since the sample data is characterized by significant discontinuity, the number of hidden layers is set as 3. At present, the selection of hidden layer node numbers is mainly based on empirical formulas, as shown in Equations (7)–(9).
H = I + O + N
H = log 2 I
H = i = 0 I C H i k
where H is the number of hidden layer nodes, N is the constant {1, 10}, and k is the number of training samples. According to the situation in this paper, the calculated number interval {a, b} of hidden layer nodes is {3, 13}. In order to further narrow the selection range, the golden section method is used to optimize the area, namely
c = a + 5 1 2 ( b a )
c = a + 5 1 2 ( c a )
The calculated number interval of hidden layer nodes is {7, 9}. Therefore, the number of nodes in the hidden layer H = {7,9,10,11,12,13} was selected to train the neural network model successfully. The network model was evaluated by comparing the three indexes of Mean Absolute Error (MAE), Root Mean Square Error (RMSE), and Coefficient of Determination (R2).
M A E = 1 m i = 1 m | y i y ^ i |
R M S E = 1 m i = 1 m ( y i y ^ i ) 2
R 2 = 1 i = 1 m ( y i y ^ i ) 2 i = 1 m ( y i y ^ i ) 2
In summary, the neural network topology established in this paper is shown in Figure 9. The training samples are shown in Table 5. The training samples were generated from the geometry of the connector, which was derived from the original specimen geometry by varying the dimensions, namely length, width, thickness, compressive strength, and shear strength (see Figure 9b). There were five parameters in the table, keeping everything else the same, changing only one parameter at a time. Then the training samples were obtained. The transfer function of the hidden layer is the hyperbolic tangent function. The transfer function of the output layer is a linear function. The learning function is the gradient descent momentum function.

3. Results

3.1. Results of the Experiment

Figure 10 shows the load-displacement curves of the experiment. The curves can be divided into four stages: the first stage is the linear elastic stage, with a linear relationship between load and displacement. The second stage is the pseudo-elastic stage, and the load and displacement show a nonlinear relationship. The third stage is the failure stage. With the gradual increase of displacement, the load drops sharply, indicating that the structure is damaged. The fourth stage is the platform stage. With the increase of displacement, the load presents a platform, indicating that the joint has entered a stable damage extension stage. The bending stiffness of the T-type joint is 0.113 kN/mm, 0.130 kN/mm, and 0.133 kN/mm, respectively, and the variance is 7.9287 × 10⁻⁵. The ultimate load is 4.07 kN, 4.46 kN, and 4.51 kN, respectively, and the variance is 0.0385, indicating good consistency of these three tests.
The deformation of the specimen during the loading process of the T-joint is shown in Figure 11. After the experiment’s beginning, with the gradual increase of displacement load, the flange plate of the specimen is bent and deformed, and it is separated from the fixture, as shown in Figure 11a,b. With the further increase of the displacement, the connection area between the web and the lower connector is damaged, resulting in the decrease of the stiffness of the load-displacement curve and the softening phenomenon, as shown in Figure 11c,d. When the displacement reached 45 mm, the lower face and middle layers of the web were damaged. The T-joint reached its maximum bearing capacity, as shown in Figure 11e. After continuous loading, the damage of the web expands along with the thickness of the web.
Meanwhile, the arc part of the lower connector is damaged. The T-joint enters the damage stable expansion stage. From the above, the main failure modes of T-joint are local failure of web and arc failure of the lower connector.

3.2. Simulation Results

3.2.1. Bending Simulation Result

The comparison of the load-displacement curve between the simulation and the test is shown in Figure 12. It can be seen that the simulated load-displacement curve is consistent with the trend of experiments. The simulated bending stiffness is 0.150 kN/mm. Compared to the experiments, the relative error is 16.5%. The ultimate bearing capacity in simulation is 4.537 kN, and the error is 4.4%. The relative error comes from the double-layer corrugated sandwich and the connectors’ actual preparation process and the thickness deviation between the FE model and specimens.
The damage distribution characteristics of the T-joint during the loading process are shown in Figure 13. The red color in Figure 13 indicates the damaged area, and the undamaged area shown in blue. When the downward displacement reaches 22 mm, tensile damage and tensile delaminated damage of the matrix appear in the intersection area of the flange plate, web, and connector. The damage expansion is not obvious with the gradual increase of downward displacement. Compression damage of the matrix occurred at the connection area between the lower connector and the web. The damage extended obviously with the increase of the displacement. When the displacement reaches 38 mm, the middle of the web plate is damaged. The joint reaches its maximum carrying capacity. With the continuous increase of the downward displacement, the damage of the middle plate of the web extends obviously. Damage to the lower face panel of the web extends slowly. The main damage modes of the T-joint are matrix compression failure and compression delamination of the lower panel and the middle plate of the web. The main reason is that the web face panel is thin. The connector strengthens the upper and lower panels of the web in the connection area. This makes the lower panel of the web near the connection area the main area of joint failure. In the damage process, there is a strong competitive relationship between the matrix compression failure of the lower face panel and the middle plate of the web, and the matrix tensile failure and the tensile delamination of the flange plate, the web, and the connecting area of the connector. This competition mainly depends on the thickness of the upper and lower face panels and the middle panel of the web. If the thickness is small, the web becomes the main factor affecting the mechanical properties of the T-joint. On the contrary, the thickness of the connectors becomes the main factor affecting the performance of the T-joint.

3.2.2. Ultimate Bearing Capacity of T-Joint

From the results of the tests and finite element analysis above, it can be seen that the damage of the T-joint mainly occurs in the lower face panel of the web, close to the connection area. The degree of damage to the joint is small. So the ultimate bearing capacity of the connector cannot be obtained in the test. Therefore, the finite element analysis method is applied in this section. Considering the web stiffness and the stiffness of the connector matching problem, the web is modeled as an equivalent homogeneous entity. The ultimate bearing capacity analysis model of the T-joint is established, as shown in Figure 14a. The ultimate bearing capacity analysis model of the T-joint is established, as shown in Figure 14a. The equivalent material parameters of the web are obtained by a unidirectional tensile model of the double-layer corrugated sandwich panel, as shown in Figure 14b. A reference point was coupling to the panel’s profile. Tensile loading was applied on the reference point and controlled by displacement. The material parameters of the equivalent web for double corrugated plate tensile stress-strain curve were shown in Figure 14c.
The simulated ultimate bearing capacity of the T-joint is shown in Figure 15. As can be seen from Figure 15a, when the displacement is about 62 mm, the curve reaches a peak value of 5.17 kN. As the corrugated sandwich and the connectors are pressed against each other during the loading process of the T-joint, as shown in Figure 15a, the skin of the connectors in the bonding area begins to suffer damage. The main failure mode of the connectors is fiber compression failure of the composite plate of the lower connector, as shown in Figure 15b.

3.3. Verification of Ultimate Bearing Capacity Prediction Model

The test and simulation revealed that the failure mode of the T-joint is the lower connector crack. The lower connector is the weakness of the T-joint. The arc part’s strength of the lower connector controlled the T-joint’s load-bearing capacity. So a rapid and effective strength prediction model of the arc under bending load could provide a reference easily for the overall strength of the T-joint. It will save a lot of time.
Table 6 presents the evaluation results of neuron number network models in different hidden layers. It can be seen that when the number of neurons in the hidden layer is 12, the determination coefficient reaches the maximum value of 0.99987. Therefore, the calculation model of ultimate bending bearing capacity of composite laminates trained with 12 neurons was adopted, and the predicted results are shown in Table 7. A FE model according to Figure 15b was used to verify the predicted results. The F1 value predicted by the neural network training is in good agreement with the finite element calculation results. The maximum relative error was less than 3%.

4. Conclusions

Lightweight of the superstructure could improve the navigability of the ship and save fuel. Composite sandwich panels are attractive for superstructure because of the excellent specific stiffness and specific strength. In this paper, a type of T-joint was proposed for lightweight superstructure in a ship. A bending and shearing coupling test and the FE method were used to reveal the T-joint’s failure modes. A strength prediction model is established focused on the specific damage mode.
  • A type of adhesive T-joint was manufactured by VARI method and subjected to the bending and shearing load according to the actual service condition. The main failure modes of T-joint are local failure of the web panel and arc failure of the lower connector.
  • A finite element analysis method was established based on the 3D-Hashin damage initiation criterion and Chang-Chang damage evolution criterion. The web’s failure mode was the compressive matrix failure and the damage on the lower connector was the fiber compressive failure when the joint reached its maximum load-bearing capacity.
  • The adhesive T-joint was simplified into bars, and a strength prediction model of the simplified lower connector is established based on the artificial neural network algorithm. The predicted ultimate bearing capacity of the T-joint showed a good agreement with the simulation, and the maximum relative error was less than 3%.

Author Contributions

Conceptualization, Y.L.; Methodology, Y.L.; Software, M.L.; Supervision, X.L.; Validation, M.L.; Visualization, Y.L.; Writing—original draft, Y.L.; Writing—review and editing, X.Z. All authors have read and agreed to the published version of the manuscript.

Funding

This research was funded by the National Natural Science Foundations of China (No. 11772147), National Natural Science Foundation of China (No. 12027901), Major University Science Research Project of Jiangsu Province, China (No. 20KJA460001), and Natural Science Foundation of Jiangsu Province, China (No. BK20200706).

Data Availability Statement

Data presented in this article are available at request from the corresponding author.

Conflicts of Interest

The authors declare no conflict of interest. The funders had no role in the design of the study; in the collection, analyses, or interpretation of data; in the writing of the manuscript, or in the decision to publish the results.

References

  1. Ramnath, B.V.; Alagarraja, K.; Elanchezhian, C. Review on Sandwich Composite and their Applications. Mater. Today Proc. 2019, 16, 859–864. [Google Scholar] [CrossRef]
  2. Hou, Y.; Neville, R.; Scarpa, F.; Remillat, C.; Gu, B.; Ruzzene, M. Graded conventional-auxetic Kirigami sandwich structures: Flatwise compression and edgewise loading. Compos. Part B Eng. 2014, 59, 33–42. [Google Scholar] [CrossRef]
  3. Bedon, C.; Amadio, C. Buckling analysis of simply supported flat glass panels subjected to combined in-plane uniaxial compressive and edgewise shear loads. Eng. Struct. 2014, 59, 127–140. [Google Scholar] [CrossRef]
  4. Zhao, C.-Q.; Li, D.-S.; Ge, T.-Q.; Jiang, L.; Jiang, N. Experimental study on the compression properties and failure mechanism of 3D integrated woven spacer composites. Mater. Des. 2014, 56, 50–59. [Google Scholar] [CrossRef]
  5. Fan, H.; Yang, L.; Sun, F.; Fang, D. Compression and bending performances of carbon fiber reinforced lattice-core sandwich composites. Compos. Part A Appl. Sci. Manuf. 2013, 52, 118–125. [Google Scholar] [CrossRef]
  6. Wang, L.; Liu, W.; Wan, L.; Fang, H.; Hui, D. Mechanical performance of foam-filled lattice composite panels in four-point bending: Experimental investigation and analytical modeling. Compos. Part B Eng. 2014, 67, 270–279. [Google Scholar] [CrossRef]
  7. Li, J.; Hunt, J.F.; Gong, S.; Cai, Z. Simplified analytical model and balanced design approach for light-weight wood-based structural panel in bending. Compos. Struct. 2016, 136, 16–24. [Google Scholar] [CrossRef] [Green Version]
  8. Moreno, M.S.; Gutiérrez, A.R.; Vicente, J.L.M. Different response under tension and compression of unidirectional carbon fibre laminates in a three-point bending test. Compos. Struct. 2016, 136, 706–711. [Google Scholar] [CrossRef]
  9. Liu, J.; He, Z.; Liu, J.; Huang, W. Bending response and failure mechanism of composite sandwich panel with Y-frame core. Thin-Walled Struct. 2019, 145, 106387. [Google Scholar] [CrossRef]
  10. Sun, Y.; Guo, L.-C.; Wang, T.-S.; Yao, L.-J.; Sun, X.-Y. Bending strength and failure of single-layer and double-layer sandwich structure with graded truss core. Compos. Struct. 2019, 226, 111204. [Google Scholar] [CrossRef]
  11. Mouritz, A. Review of z-pinned laminates and sandwich composites. Compos. Part A Appl. Sci. Manuf. 2020, 139, 106128. [Google Scholar] [CrossRef]
  12. Sun, C.; Jia, P.; Chen, C.; Moradi, A.; Zhou, J.; Al Teneiji, M.; Cantwell, W.; Guan, Z. The effect of carbon fibre stitching on the tensile behaviour of secondary bonded single- and double-lap composite joints. Compos. Struct. 2021, 265, 113774. [Google Scholar] [CrossRef]
  13. Aimmanee, S.; Hongpimolmas, P. Stress analysis of adhesive-bonded tubular-coupler joints with optimum variable-stiffness composite adherend under torsion. Compos. Struct. 2017, 164, 76–89. [Google Scholar] [CrossRef]
  14. Aydin, M.D.; Akpinar, S. The strength of the adhesively bonded T-joints with embedded supports. Int. J. Adhes. Adhes. 2014, 50, 142–150. [Google Scholar] [CrossRef]
  15. Hühne, C.; Zerbst, A.-K.; Kuhlmann, G.; Steenbock, C.; Rolfes, R. Progressive damage analysis of composite bolted joints with liquid shim layers using constant and continuous degradation models. Compos. Struct. 2010, 92, 189–200. [Google Scholar] [CrossRef]
  16. Koricho, E.G.; Belingardi, G. An experimental and finite element study of the transverse bending behaviour of CFRP composite T-joints in vehicle structures. Compos. Part B Eng. 2015, 79, 430–443. [Google Scholar] [CrossRef]
  17. Bigaud, J.; Aboura, Z.; Martins, A.; Verger, S. Analysis of the mechanical behavior of composite T-joints reinforced by one side stitching. Compos. Struct. 2018, 184, 249–255. [Google Scholar] [CrossRef]
  18. Thummalapalli, V.K.; Donaldson, S.L. Biomimetic composite structural T-joints. J. Bionic Eng. 2012, 9, 377–384. [Google Scholar] [CrossRef]
  19. Romanoff, J.; Remes, H.; Socha, G.; Jutila, M.; Varsta, P. The stiffness of laser stake welded T-joints in web-core sandwich structures. Thin-Walled Struct. 2007, 45, 453–462. [Google Scholar] [CrossRef]
  20. Omidali, M.; Khedmati, M.R. Numerical investigation on novel geometrical configuration for adhesively bonded T-joint between aluminum and sandwich panel. Thin-Walled Struct. 2018, 131, 122–134. [Google Scholar] [CrossRef]
  21. Khosravani, M.R.; Weinberg, K. Characterization of sandwich composite T-joints under different ageing conditions. Compos. Struct. 2018, 197, 80–88. [Google Scholar] [CrossRef]
  22. Wu, H.; Xiao, J.; Xing, S.; Wen, S.; Yang, F.; Yang, J. Numerical and experimental investigation into failure of T700/bismaleimide composite T-joints under tensile loading. Compos. Struct. 2015, 130, 63–74. [Google Scholar] [CrossRef]
  23. Burns, L.; Mouritz, A.; Pook, D.; Feih, S. Strength improvement to composite T-joints under bending through bio-inspired design. Compos. Part A Appl. Sci. Manuf. 2012, 43, 1971–1980. [Google Scholar] [CrossRef]
  24. Hisada, S.; Minakuchi, S.; Takeda, N. Cure-induced strain and failure in deltoid of composite T-joints. Compos. Part A Appl. Sci. Manuf. 2021, 141, 106210. [Google Scholar] [CrossRef]
  25. Abbasi, S.; Ladani, R.; Wang, C.; Mouritz, A. Improving the structural properties of composite T-joints by z-weaving of continuous metallic filaments. Compos. Struct. 2021, 260, 113509. [Google Scholar] [CrossRef]
  26. Barzegar, M.; Moallem, M.D.; Mokhtari, M. Progressive damage analysis of an adhesively bonded composite T-joint under bending, considering micro-scale effects of fiber volume fraction of adherends. Compos. Struct. 2021, 258, 113374. [Google Scholar] [CrossRef]
  27. Ravindran, A.R.; Ladani, R.B.; Wang, C.H.; Mouritz, A.P. Strengthening of composite T-joints using 1D and 2D carbon nanoparticles. Compos. Struct. 2021, 255, 112982. [Google Scholar] [CrossRef]
  28. Guo, S.; Li, W. Numerical analysis and experiment of sandwich T-joint structure reinforced by composite fasteners. Compos. Part B Eng. 2020, 199, 108288. [Google Scholar] [CrossRef]
  29. Bai, J.-B.; Dong, C.; Xiong, J.-J.; Luo, C.-Y.; Chen, D. Progressive damage behaviour of RTM-made composite T-joint under tensile loading. Compos. Part B Eng. 2019, 160, 488–497. [Google Scholar] [CrossRef]
  30. Khosravani, M.R.; Anders, D.; Weinberg, K. Influence of strain rate on fracture behavior of sandwich composite T-joints. Eur. J. Mech. A/Solids 2019, 78. [Google Scholar] [CrossRef]
  31. Hou, W.; Xu, X.; Han, X.; Wang, H.; Tong, L. Multi-objective and multi-constraint design optimization for hat-shaped composite T-joints in automobiles. Thin-Walled Struct. 2019, 143, 106232. [Google Scholar] [CrossRef]
  32. Hashin, Z. Fataigue failure criteria for unidirectional fiber composites. J. Appl. Mech. 1981, 48, 846–852. [Google Scholar] [CrossRef]
  33. Chang, F.-K.; Chang, K.-Y. A Progressive Damage Model for Laminated Composites Containing Stress Concentrations. J. Compos. Mater. 1987, 21, 834–855. [Google Scholar] [CrossRef]
Figure 1. T-joint of composite structure: (a) geometry; (b) components of the T-joint; (c) geometry of the connectors.
Metals 11 01197 g001
Figure 2. Preparation process of double-layer corrugated plate: (a) fiber laying; (b) auxiliary material laying; (c) resin injection.
Metals 11 01197 g002
Figure 3. Preparation of T-joint: (a) mold of T-joint; (b) resin injection; (c) stacking sequence.
Metals 11 01197 g003
Figure 4. Bonding of T-joint.
Metals 11 01197 g004
Figure 5. Specimens of T-joint.
Metals 11 01197 g005
Figure 6. Experimental set-up.
Metals 11 01197 g006
Figure 7. Finite element (a) geometric model and (b) mesh model.
Metals 11 01197 g007
Figure 8. (a) Simplified mechanical model and (b) Force analysis of bar No. 3 in the T-joint.
Metals 11 01197 g008
Figure 9. (a) Neural network topology and the (b) geometry of the FE model (lower connector’s arc part).
Metals 11 01197 g009
Figure 10. Load-displacement curves of the experiments.
Metals 11 01197 g010
Figure 11. Deformation of the specimen during the loading process: (a) before the test; (b) linear elastic stage; (c) pseudo elastic stage; (d) detail of pseudo elastic stage; (e) failure stage; (f) damage stability expansion stage.
Metals 11 01197 g011aMetals 11 01197 g011b
Figure 12. Comparison of simulation and test results.
Metals 11 01197 g012
Figure 13. Damage evolution of the T-joint in different failure modes.
Metals 11 01197 g013
Figure 14. Finite element model for ultimate bearing capacity of the connectors. (a) Geometric model of the T-joint. (b) FE model of double-layer corrugated sandwich panel. (c) Equivalent stress-strain relation of double-layer corrugated sandwich.
Metals 11 01197 g014
Figure 15. Results of ultimate bearing capacity of connectors (a) Load-displacement curve. (b) Fiber compressive failure of the lower connector.
Metals 11 01197 g015
Table 1. Layout of connectors.
No.Part NameLayerFiberResin
1Outside of upper connector10200 g/m2 plain woven clothMerican 30-200P
2Inside of upper connector5
3Outside of lower connector10
4Inside of lower connector5
5Face panel of the sandwich10
6Corrugation of the sandwich4
7Middle layer of the sandwich4
Table 2. Mechanical parameters of the glass fiber reinforced polymer (GFRP).
Elastic Modulus (GPa)Poisson’s RatioShear Modulus (GPa)
E11 = E22E33μ12μ13 = μ23G12G13 = G23
2290.30.4548
Tensile Strength (MPa)Compressive Strength (MPa)ShearStrength (MPa)
XT = YTZTXC = YCZCS12S13 = S23
35420128903820
Table 3. Mechanical parameters of the PVC foam.
Elastic Modulus (MPa)Poisson’s RatioShear Modulus (MPa)Density (kg/m3)
EcμcGcρc
800.22580
Compressive Strength (MPa)Tensile Strength (MPa)Shear Strength (MPa)
1.351.91.35
Table 4. Parameters of cohesive behavior.
Knn
MPa
Kss
MPa
Ktt
MPa
σn
MPa
σs
MPa
σt
MPa
Gnn
N/mm
Gss
N/mm
Gtt
N/mm
1586158615861515150.31.21.2
Knn, Kss, Ktt—Stiffnesses in the normal direction, the first shear direction, and the second shear direction, respectively. σn, σs, σt—Peak values of the nominal stress in the normal direction, the first shear direction, and the second shear direction, respectively. Gnn, Gss, Gtt—Separation energies in the normal direction, the first shear direction, and the second shear direction, respectively.
Table 5. Training sample.
No.L (mm)w (mm)t (mm)XC (MPa)S23 (MPa)Ultimate Load (N)
150202.6120254357
280202.6120253461
3100202.6120253440
4120202.6120253453
5150202.6120253197
6180202.6120253213
7100103140302102
8100153140303155
9100203140304202
10100303140306313
11100403140308391
121005031403010,511
13150401.6100205168
14150402100206559
15150402.6100209782
161504031002011,288
171504041002015,052
181504051002018,813
1950101.680151125
2012030280354431
21120302100354431
22120302120354476
23120302140354476
24120302160354431
25120302180354431
2680154160157973
2780154160207973
2880154160257973
2980154160307973
3080154160357973
3180154160407973
Table 6. Performance statistics of different number of neurons.
NeuronsMAE/MPaRMSE/MPaR2
70.01820.02630.99845
90.01890.02770.99826
100.01200.01650.99948
110.01970.02730.99795
120.00700.00750.99987
130.01140.01350.99949
MAE—mean absolute error, RMSE—root mean square error, R2—coefficient of determination.
Table 7. Verification of calculation model for ultimate bearing capacity of the T-joint.
No.l
mm
w
mm
t
mm
XC
MPa
τyz
MPa
F1/kNError/%
FEMANN
1218.551503.41282031.62231.4990.39
2218.551502.81282015.97015.9120.36
3167.121502.81282039.30338.1772.88
4192.841502.21282084.86683.9831.04
5167.121502.212820125.628124.8620.61
l—arc length, w—arc width, t—arc thickness, XC—compressive strength, τyz—shear strength.
Publisher’s Note: MDPI stays neutral with regard to jurisdictional claims in published maps and institutional affiliations.

