Article

A Crystal Plasticity Simulation on Strain-Induced Martensitic Transformation in Crystalline TRIP Steel by Coupling with Cellular Automata

by
Truong Duc Trinh
1 and
Takeshi Iwamoto
2,*
1
Graduate School of Engineering, Hiroshima University, 1-4-1 Kagamiyama, Higashi-Hiroshima, Hiroshima 739-8527, Japan
2
Academy of Science and Technology, Hiroshima University, 1-4-1 Kagamiyama, Higashi-Hiroshima, Hiroshima 739-8527, Japan
*
Author to whom correspondence should be addressed.
Metals 2021, 11(8), 1316; https://doi.org/10.3390/met11081316
Submission received: 21 July 2021 / Revised: 13 August 2021 / Accepted: 16 August 2021 / Published: 20 August 2021

Abstract

:
In transformation-induced plasticity (TRIP) steel, the strain-induced martensitic transformation (SIMT) has a close relationship with the shear band formation. At a small length scale such as that of a crystal, the explicit analysis of the shear band structure with the formed microstructure is quite important for an adequate understanding of the SIMT. Here, a study on the microstructures formed by SIMT, related to shear band formation in both single and polycrystal TRIP steels, is presented. The constitutive equation for single crystal TRIP steel considering the transformation strain on each variant system is derived based on a rate-dependent crystal plasticity theory. To express the martensitic transformation, the cellular automata approach, including a transformation criterion acting as a local rule, is introduced. Numerical simulation is conducted with patterning processes of the martensitic phase at an infinite medium under the plane strain tension. It is found that the similar distributions of the plastic strain and the martensitic phase are dependent on the initial crystal orientation and appear as the shear band structures. In addition, the sizes of embryo and cell strongly influence the shear band formation and the martensitic volume fraction of crystal TRIP steel.

1. Introduction

Strain-induced martensitic transformation (SIMT) plays a crucial role in the mechanical properties of transformation-induced plasticity (TRIP) steel [1]. A distinguishing feature of SIMT is a geometrical distribution of the α -martensitic phase in the microstructure, which obeys the relationship of a crystallographic orientation between γ -austenite and α -martensite as previously observed [2,3]. During the SIMT process of a γ -austenitic steel, the nucleation site for α -martensite can be observed at the intersections of shear bands [4,5]. Olson and Cohen [4] modelled the kinetics of strain-induced nucleation for α -martensite in which the formations of shear bands and their intersections are the dominant mechanism of SIMT. In TRIP steel, the shear band possibly appeared as a concentrated plastic flow due to inhomogeneous deformation. It is clear that the band structure can have scales of different lengths, such as that of the Lüders band [4], that of embryos, or that of the dislocation patterning induced by the slip mechanism [6]. The shear band is, of course, microscopic; however, the scale of the shear band structure can be much larger than the size of embryo existing in the inhomogeneous regions due to severe plastic deformation. In the past, several investigations of shear band formation in metals without phase transformation were undertaken [7,8], and various analyses on SIMT with the formation of microstructures were conducted [9,10,11]. However, in the martensitic transformation (MT) problems, the number of studies focused on SIMT in relation to the shear band formation is quite limited [12]. Therefore, it is still necessary to investigate the SIMT process in relation to the explicit formation of the shear band with the consideration of a small length scale such as that of martensitic embryo of crystalline TRIP steel.
For decades, several numerical works were introduced to describe the deformation behavior and SIMT during the MT process [13,14,15,16]. Following the great work of Olson and Cohen [4], SIMT was studied extensively under different effects using kinetic models [17,18,19,20]. A common factor in the above models for SIMT is the use of evolution functions for the α -martensite volume fraction in terms of plastic strain for macroscopic analyses. However, the use of the volume fraction as an internal variable generally eliminates the length scale effect in the martensitic phase. Hence, the kinetic models are not appropriate to investigate the SIMT related to the formation of microscopic shear bands at a crystal scale. Among the numerical methods, the crystal plasticity finite element method (CPFEM) is very powerful in dealing with mechanical problems at a crystal scale [21,22,23]. CPFEM is very flexible in term of including and extending the constitutive formulas based on various frameworks of flow theory and hardening mechanisms in plasticity and MT [24,25,26,27,28]. To investigate the deformation behavior of lath martensite as well as the inter-lath retained austenitic phase, Hatem and Zikry [29] introduced a higher-order constitutive model based on the CPFEM framework to capture the feedback of the laths. Next, Lee et al. [30] studied the evolution of nucleation sites by the shear band intersection during SIMT using the rate-dependent CPFEM framework. Additionally, to develop the numerical models, the frameworks based on CPFEM can be coupled easily with other approaches such as the self-consistent approach [31], or the phase field method [32]. Nonetheless, none of those works explicitly studied the formation of the shear band structures during the SIMT process from the viewpoint of crystalline TRIP steel of a small length scale.
Up to now, cellular automata (CA) approach has shown great advantages and has been applied widely to solve problems at the crystal scale [33,34,35,36]. Within this approach, the temporal and spatial evolution of the automata obey only the local rules, which work as the transformation criteria for the nucleation process. The state of a cell can be a function of its own previous state and the current states of the neighbors. By means of the simpler and more straightforward numerical algorithm, which only requires satisfaction of the rules, the computational cost of the CA approach can be significantly reduced. By coupling the CA approach with the framework of CPFEM for the MT problem, the discrete microstructure can be obtained. In addition, a cellular automaton can be represented by an element, and the size of embryo can be easily adjusted by modifying the size of the finite element grid. According to the above idea, Iwamoto and Tsuta [24], and Trinh and Iwamoto [27] applied the CA approach to the rate-dependent CPFEM to study SIMT in crystalline TRIP steel. However, the use of the symmetric boundary condition cannot induce a macroscopic severe plastic zone with an inhomogeneous microstructure. Additionally, the analyses on the size of embryos and cells in the infinite medium are necessary to obtain a deeper understanding of the effect of the length scale on SIMT.
The aim of this study is to investigate the microstructures related to SIMT that result from the formation of shear bands in crystalline TRIP steel under plane strain conditions. The numerical framework is extended based on rate-dependent CPFEM coupling with the CA approach, which was initiated by Iwamoto and Tsuta [24]. Firstly, the full derivation process of the rate-dependent constitutive model, within a framework of finite deformation of a single crystal TRIP steel, is provided. A two-dimensional unit cell with periodic boundary conditions (PBCs) for tension, as proposed by Smit et al. [37], is considered in both mono and polycrystal models to describe an infinite crystalline media. The computational results, taking into consideration the dependence of the initial crystal orientation, are presented and discussed. In addition, the analysis of the effects of the length scale is shown by modifying the size of a crystal lattice in a single crystal model and by comparing different numbers of grains formed by Voronoi tessellation in a polycrystal model.

2. Theoretical Model

2.1. Kinematics Model

A single crystal TRIP steel is considered to undergo an elasto-viscoplastic deformation with transformation behavior in accordance with the theory of finite deformation. The deformation gradient components are integrated in an orderly manner, as in the work of Levitas [38]:
F = F e · F t · F p ,
where F e , F t and F p are the elastic and rigid body rotation of crystal lattice, transformation of martensite on a habit plane, and slip deformation on slip planes, respectively. The configuration of deformed deformation and MT can be expressed by the deformation gradient components as follows:
s e t ( a ) = F e · F t · s ( a ) ,
m e t ( a ) = m ( a ) · F t 1 · F e 1 ,
l e ( I ) = F e · l ( I ) ,
and   n e ( I ) = n ( I ) · F e 1 ,
where s ( a ) and m ( a ) are, respectively, a unit vector in direction of slip deformation, and a unit normal vector on the slip plane of the a t h slip system. In addition, l ( I ) and n ( I ) are a unit vector in direction of deformation due to MT, and a normal vector on a habit plane and transformation strain of the I t h variant system, respectively. The total stretching tensor d and spin tensor ω can be decomposed into elastic components, plastic components, and deformation components, respectively, as a result of transformation. Here, the relation of deformation components with the shear components at the current configuration can be expressed as:
d p + ω p = a γ ˙ ( a ) s e t ( a ) m e t ( a ) ,
  and   d t + ω t = I γ ˙ t ( I ) l e ( I ) n e ( I ) ,
where γ ˙ ( a ) is the shear strain rate of the a t h slip system and γ ˙ t ( I ) is the transformation strain rate of the I t h variant system. The transformation strain γ t ( I ) can be described by the transformation gradient on the basis of parent phase, in accordance with the work of Bowles and Mackenzie [2], as follows:
F t = R · B · P = I + I γ t ( I ) l ( I ) n ( I ) .
In Equation (8), I is a unit tensor, while the other parameters, R , B and P , are tensors representing for the rigid body rotation, lattice deformation and invariant shear deformation, respectively. In addition, the evolution equation for F t in a reference configuration can be obtained in a similar manner to the methods of Asaro [21] and Peirce et al. [22] as follows:
F ˙ t · F t 1 = I γ ˙ t ( I ) l ( I ) n ( I ) .
On the other hand, at the current configuration, the stretching tensors and spin tensors for the plastic deformation and deformation caused by MT can be calculated separately as:
d p = a P ( a ) γ ˙ ( a )   and   ω p = a W ( a ) γ ˙ ( a ) ,
d t = I Q ( I ) γ ˙ t ( I )   and   ω t = I Ω ( I ) γ ˙ t ( I ) ,
where the symmetric and antisymmetric Schmid tensors in the above equations can be expressed as follows:
P ( a ) = 1 2 ( s e t ( a ) m e t ( a ) + m e t ( a ) s e t ( a ) ) , W ( a ) = 1 2 ( s e t ( a ) m e t ( a ) m e t ( a ) s e t ( a ) ) ,
Q ( I ) = 1 2 ( l e ( I ) n e ( I ) + n e ( I ) l e ( I ) ) ,   and   Ω ( I ) = 1 2 ( l e ( I ) n e ( I ) n e ( I ) l e ( I ) ) .
By applying the generalized Hooke’s law for a thermo-elastic body, the final constitutive equation for single crystalline TRIP steel can be formulated as:
S ˇ = D v : d a R ( a ) b ˙ ( a ) I R t ( I ) b ˙ t ( I ) B e T ˙ d t σ ,
D v = D e a R ( a ) C ( a ) I R t ( I ) C t ( I ) ,
R ( a ) = D e : P ( a ) + β ( a ) ,   R t ( I ) = D e : Q ( I ) + β t ( I )   and   d t = tr ( d t ) ,
where S ˇ is the Jaumann rate of Kirchhoff stress, D e is the elastic modulus tensor, and d is the stretching tensor. In addition, σ is the Cauchy stress and B e is the tensor expressing the thermal expansion. Of course, as the evolution of temperature is not considered, the term of temperature evolution can be neglected at this level. b ˙ ( a ) , C ( a ) , b ˙ t r ( I ) , and C t r ( I ) are coefficients that are solved from a procedure that involves the tangent modulus method [22].

2.2. Hardening Mechanism

To clearly understand the patterning process of MT, it is very important to accurately measure the amount of shear strain on the active slip system. Nonetheless, this procedure leads to many difficulties in conventional CPFEM since the MT occurs explosively. Here, a method to determine the transformation strain rate γ ˙ t ( I ) is described to obtain values both during MT and when MT finishes. The transformation shear strain can be expressed as follows:
γ t ( I ) = γ 0 t ( I ) H [ G ( I ) ( x i ,   t ) G 0 ] ,
where γ 0 t ( I ) is constant maximum transformation shear strain which can be determined from a crystallographic analysis of MT. In addition, H [ G ( I ) ( x i ,   t ) G 0 ] is a Heaviside step function, which takes into account the free energy based on the phase transformation conditions. G ( I ) is the transformation driving force of the I t h variant system, and G 0 is the critical driving force of the transformation. By taking a derivative with respect to time, the transformation strain rate can be obtained as:
γ ˙ t ( I ) = γ 0 t ( I ) δ [ G ( I ) ( x i ,   t ) ] G ˙ ( I ) .
Dirac’s δ function in Equation (18) can be applicable not only spatially but also temporarily. On the other hand, the transformed martensitic region only appears in a finite time period. Hence, in order to coincide with sharp interface theory and to stabilize the computational analysis, we assume that the interface thickness can be considered as a relatively smooth function θ ( I ) ( x i ,   t ) that is dependent on time and position, similarly to the work of Cherkaoui et al. [39]. θ ( I ) ( x i ,   t ) can be involved in the transformation strain rate instead of the Heaviside function in the following relation:
γ ˙ t ( I ) = γ 0 t ( I ) θ ˙ ( I ) ( x i ,   t ) ,
  and   θ ( I ) ( t ) = 1 exp { b [ 1 exp ( a [ t t t r ] ) ] r } ,
where t t t r defines the elapsed time from the start to the finish time of MT and has a sufficiently small value from the step increment. θ ( I ) ( x i ,   t ) varies from 0 to 1, which indicates the phase transition state of austenite as θ ( I ) ( x i ,   t ) = 0 , or the transformation of martensite as θ ( I ) ( x i ,   t ) > 0 . Thus, θ ( I ) ( x i ,   t ) can indicate both spatially and temporally diffused interfaces. The evolution of the θ ( I ) ( x i ,   t ) function can be satisfied with arbitrary choices of the coefficients a , b and r . Here, the coefficients a , b and r have the values of 0.05, 5.0 and 2.0, respectively. It is noticed that the concept of θ ( I ) is not related to any kinetic models that are used to determine the martensitic volume fraction. Only the time derivation of the smooth function θ ( I ) is considered to define the finish time of the transformation process.
On the other hand, it was suggested that the transformation strain depends on the rate of resolved shear stress [39], and thus also depends on the applied stress at a macroscopic scale. In addition, Cherkaoui et al. [39] concluded that it is possible to assume that the transformation strain has an eigenvalue. Generally, it is very difficult to accurately determine the amount of shear strain on the active slip system. To express the dependence of the transformation strain rate on the rate of resolved shear stress, the transformation strain rate was assumed to be calculated similarly to the shear slip rate using a power law for the rate-dependent constitutive model. The shear strain in the a t h slip system and the transformation strain in the I t h variant system can be described as follows:
γ ˙ ( a ) = a ˙ ( a ) τ ( a ) g ( a ) | τ ( a ) g ( a ) | 1 m 1 and   γ ˙ t ( I ) = γ 0 t ( I ) θ ˙ ( I ) τ t ( I ) g t ( I ) | τ t ( I ) g t ( I ) | 1 m t 1 ,
where τ ( a ) and τ t ( I ) are the resolved shear stress, which can be calculated directly by Schmid tensors P ( a ) and Q ( I ) for viscoplasticity and MT. In addition, a ˙ ( a ) is the reference strain rate, and m and m t are the strain rate sensitivity exponents for viscoplasticity and MT. g ( a ) is a coefficient that characterizes the current state of the strain effect at a material point in the crystal. g t ( I ) is the resistance against the MT. In all variants, the initial value of g t ( I ) is a constant, and its evolution equation for the entire variant system can be formulated using the analogy with slip deformation [22]:
g ˙ ( a ) = a h a b | γ ˙ ( a ) | ,   h a b = q h + ( 1 q ) h δ a b ,
g ˙ t ( I ) = I h t { γ t ( I ) , T } | γ ˙ t ( I ) |   and   h I J t = p h t + ( 1 p ) h t δ I J ,
where h a b is hardening modulus, which expresses the interactions between the slip systems. In addition, in the equation of parameter h I J t , the first term indicates the self-hardening caused by the transformation strain rate γ ˙ t ( I ) in the I t h variant system, while the second term presents the hardening caused by the interaction of the J t h variant system. The hardening parameter h t can be reformulated in a similar form to that employed by Peirce et al. [22] as follows:
h ( γ , T ) = h 0 ( T ) sec h 2 { h 0 ( T ) · γ τ s ( T ) τ 0 ( T ) }   with   γ = a | γ ( a ) |
  and   h t { γ t ( I ) , T } = h 0 t ( T ) sec h 2 { h s t ( T ) · γ t ( I ) τ s t ( T ) τ 0 t ( T ) }   with   γ t = I | γ t ( I ) | ,
where h s t is the initial hardening rate, τ s t is the saturated resolved shear stress, and τ 0 t is the critical resolved shear stress. Consequently, the transformation strain rate is calculated according to the formula in Equation (19) when not considering the rate dependence, while it is calculated according to the formula in Equation (21) in the case of rate dependence.

2.3. Transformation Criterion

Many research works successfully investigated the transformation criterion in Equation (17) by means of the Gibbs functions and other driving forces [4,39,40]. In this work, the simple transformation criterion with the Gibbs function G ( I ) ( x i ,   t ) was used based on the motivations of the work of Kitajima et al. [40]. Consequently, the active variant system that determines the occurrence of MT can easily be selected. By considering difference between the energy equations before and after MT, a simple transformation criterion in the I t h variant system can be formulated as follows:
G ( I ) ( x i ,   t ) G 0 = 0 ,
and   G ( I ) ( x i ,   t ) = G m + G c = τ t ( I ) γ * J Ω I J γ t ( I ) b M ( T T 0 ) .
Equation (26) shows the starting condition of the MT for the I t h variant when the transformation driving force G ( I ) reaches the critical driving force G 0 . Consequently, the corresponding martensitic variant is induced in the parent phase. The transformation driving force is composed of the mechanical driving force G m and the chemical driving force G c . In the mechanical driving force, γ * is the eigenvalue that denotes the shear strain on a habit plane, and this is equivalent to γ 0 t ( I ) in Equation (17). The chemical driving force is dependent only on the temperature and has an identical value for all 24 possible variants. In Equation (27), b M is the material parameter, which is normally defined from thermomechanical treatment process, and T 0 is the initial temperature. Similarly to the interaction of variant systems expressed in Equation (23), Ω I J is the coefficient of anisotropic hardening. In actual computation processes, the term of the hardening coefficient Ω I J is equivalent to the hardening parameter h I J t in Equation (23); thus, it can be eliminated in the transformation criterion in order to avoid the double count. In addition, a simple linear function, depending on the temperature, can be introduced for the chemical driving force as follows [41]:
G c = ( 1.5 T 369 ) / 12 .
On the other hand, the well-known Kurdjumov—Sachs (KS) relations provide the crystallographic orientation relationships between the γ and α phase. Bowles and Mackenzie [2] developed the phenomenological theory of martensite crystallography in which the fcc-bct lattice correspondence is defined by the Bain deformation tensor and invariant shear deformation of the lattice. In the model, the transformation strain that occurs due to the difference in crystal structure is defined by the transformation direction unit vector l e ( I ) and the habit plane unit normal vector n e ( I ) using the Bowles—Mackenzie theory. The martensitic lattice is generated by the simple shear deformation occurring in the fcc austenite parent lattice on the { 110 } γ planes along the 110 γ directions. Thus, { 110 } γ 110 γ is used as a valid system. As a result, the normal vector of the simple shear strain plane and the direction vector of the shear strain are used as (110) [ 0 1 ¯ 1 ] , (101) [ 1 ¯ 01 ] , (110) [ 1 1 ¯ 0 ] , ( 0 1 ¯ 1 ) [011], ( 1 ¯ 01 ) [101] and ( 1 1 ¯ 0 ) [110]. The total number of possible martensitic variants is defined using the 4 planes of the family { 110 } γ and the 3 directions 110 γ corresponding to each of these planes. As both sides of the 110 γ direction can be chosen, there are a total of 24 possible variants. The obtained transformation strain rate γ ˙ t ( I ) , transformation direction unit vector l ( I ) and the habit plane unit normal vector n ( I ) are projected onto the (111) plane of the austenite phase.

3. Implementation Process

Because of the stability of the computations, the constitutive Equation (14) was rewritten according to the tangent modulus method [37]. The details are presented in Appendix A.

3.1. Finite Element Model and Boundary Conditions

Figure 1 shows two-dimensional rectangular block samples of a single and a polycrystal TRIP steel undergoing plane strain tension. The finite element discretization with the crossed triangular plane strain element was applied. The quadrilateral element consisted of 4 triangular plane strain elements with 5 nodal points. The position of the central node could be automatically determined from an intersection of two diagonal lines. Each triangular element was regarded as one crystal lattice, and only 4 Gaussian integration points at the center of each triangular element were sufficient to evaluate the transformation criterion. Since only one variant system was formed in one crystal lattice, the summation on the variant systems in Equations (7)–(9), (11), (14) and (15) could be neglected.
Here, an infinite medium providing highly appropriate crystalline TRIP steel behavior in nature, including non-uniform deformation, was considered. Therefore, periodicity was important in this study. In accordance with the findings of Smit et al. [37], a general boundary condition related to the tension was adhered to on just 3 corner nodes of the finite element model, as shown in Figure 1. Next, two additional conditions, which ensured the periodicity of the velocity and stress fields, were employed. The details regarding the process of applying PBCs can be referred to in [37].
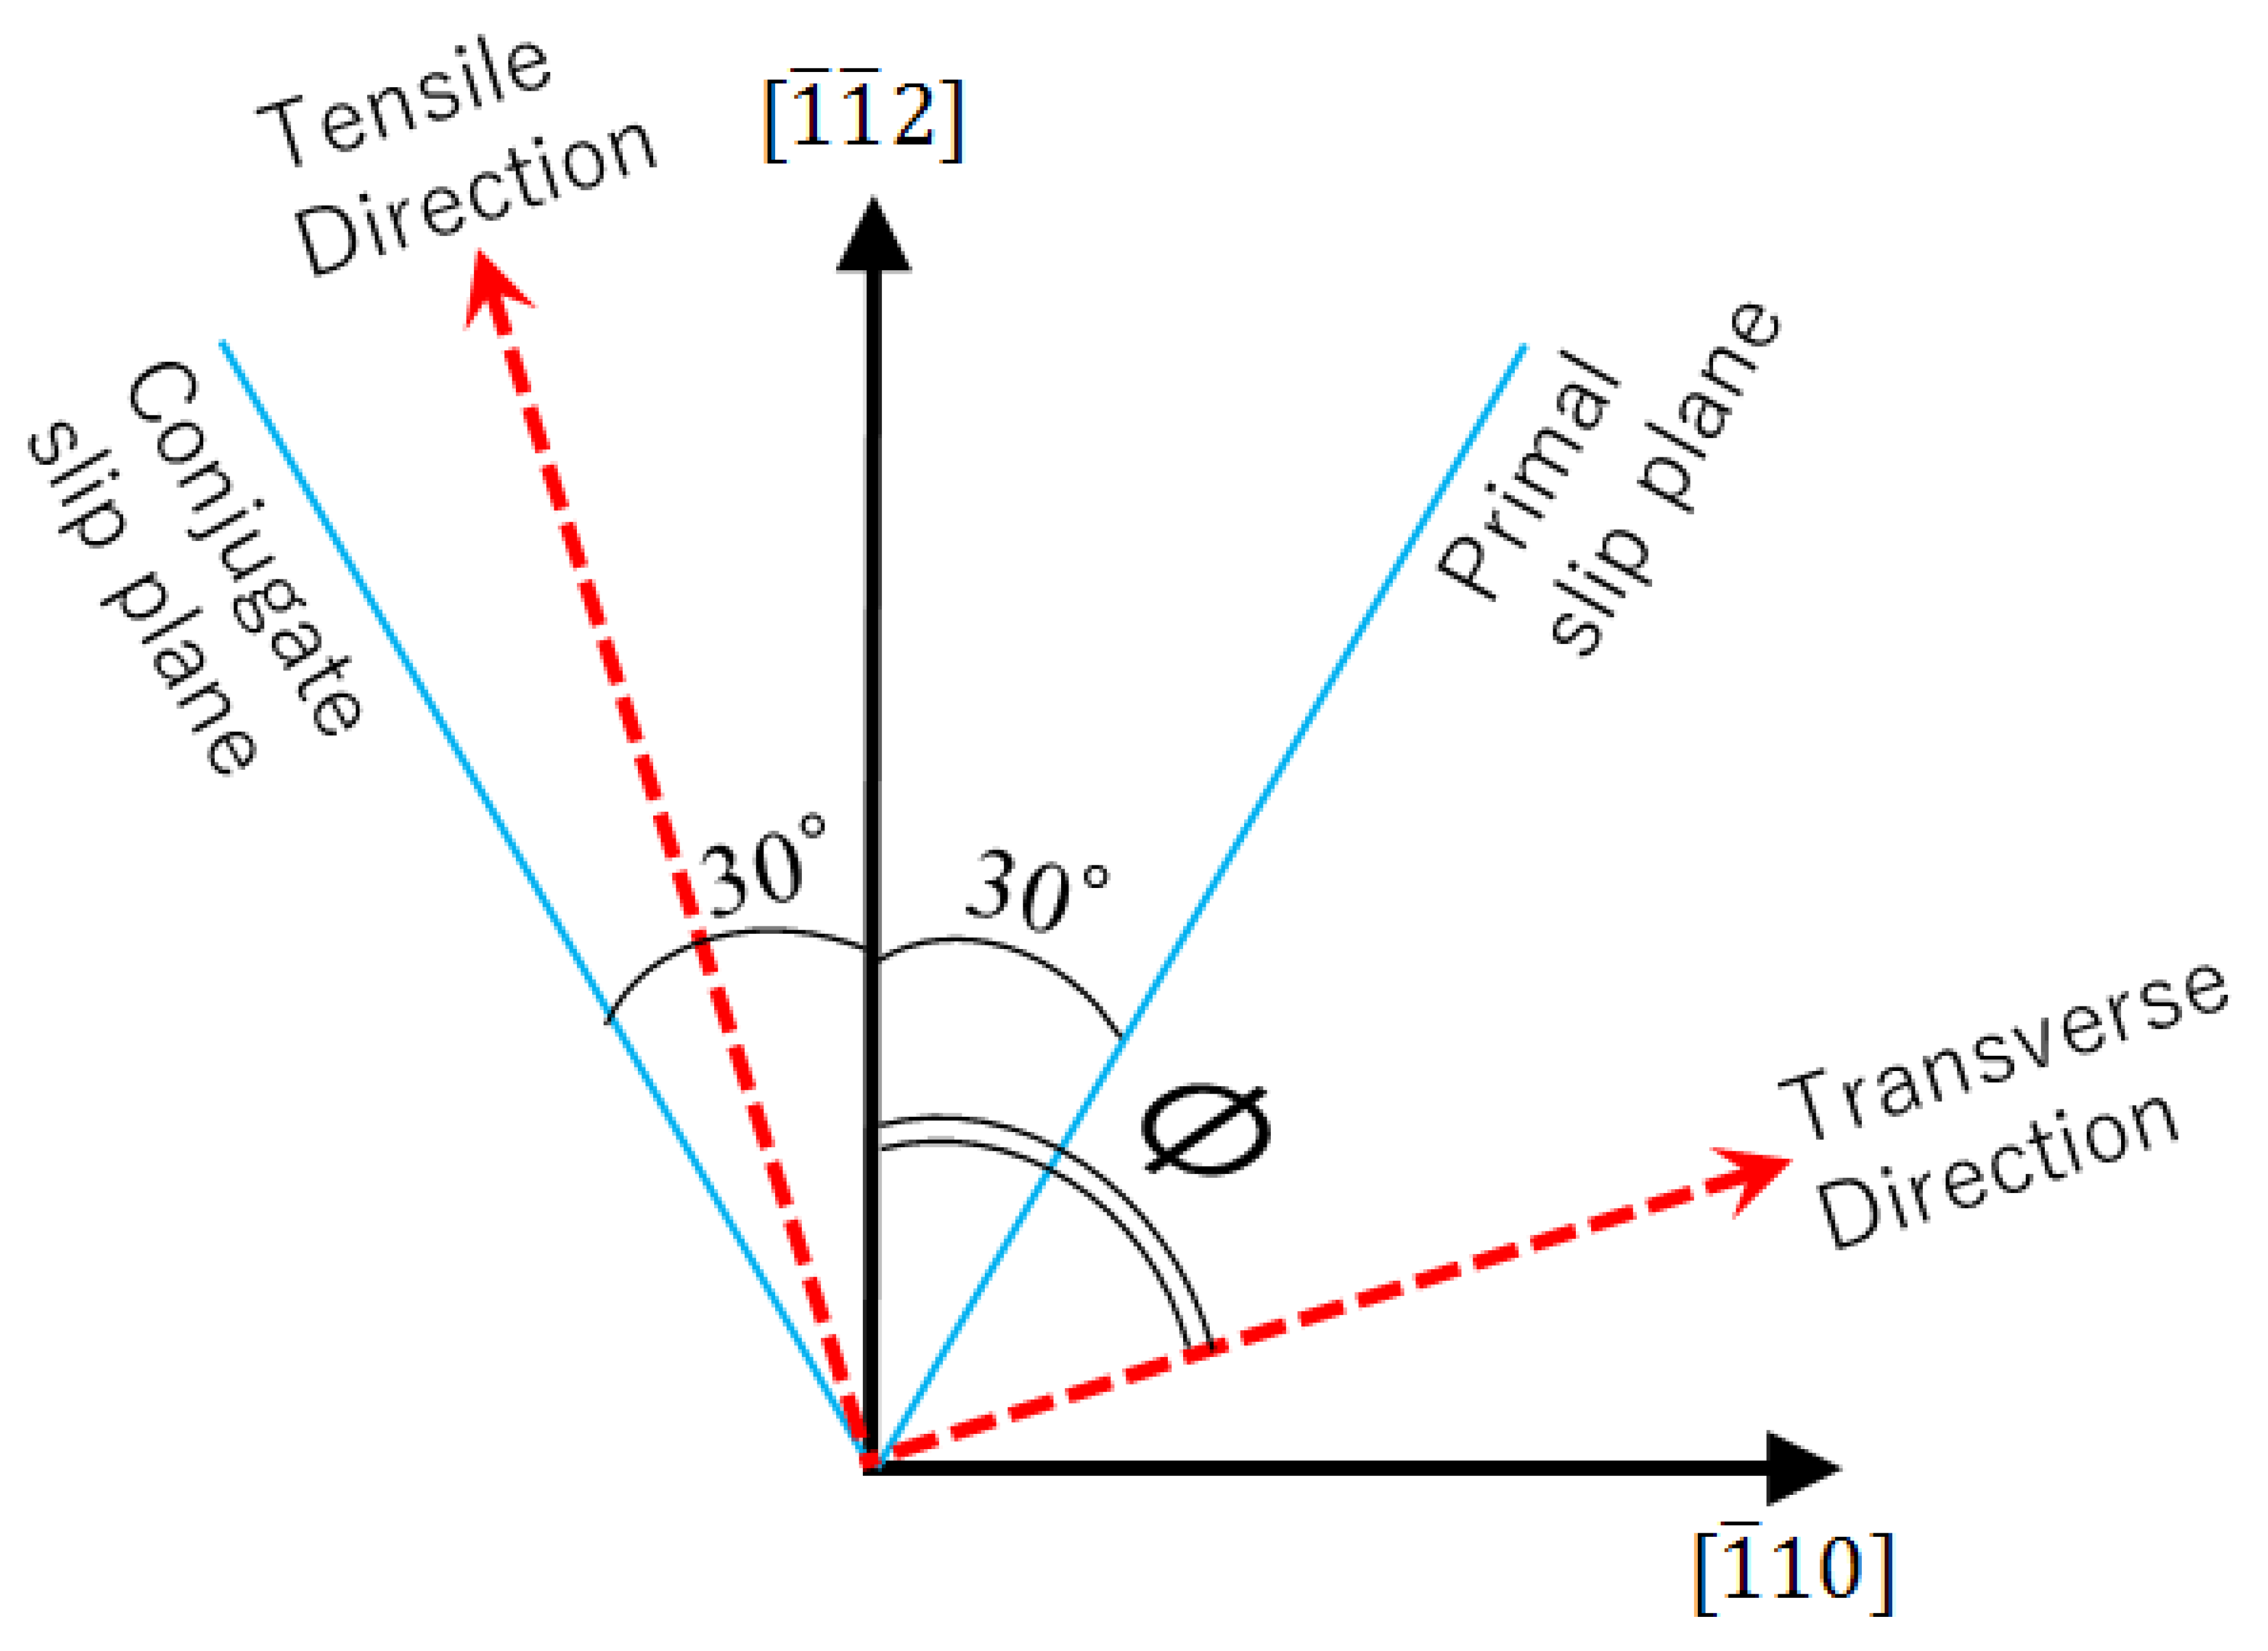
On the other hand, the two-planar slip system proposed by Asaro [21], in which the angle between two slip systems is 60 ° , was applied as shown in Figure 2. The initial crystallographic orientation was determined by the rotation angle between the x-axis and the slip plane as the median between the two slip systems. On the (111) plane for the two slip system, three different initial crystal orientations, given in terms of Euler angles, were considered as ( 30 ° , 54.4 ° , 45 ° ) , ( 60 ° , 54.4 ° , 45 ° ) , ( 90 ° , 54.4 ° , 45 ° ) . For convenience, the initial crystal orientation is denoted by = 30 ° , = 60 ° , and = 90 ° from this point onwards. In the monocrystal model, the same was set over all of the finite elements. The length and width of the block were 1.0 and 1.0 mm, respectively, and the nominal strain rate of 1.2 × 10 4   s 1 was given at the room temperature T e n v = 293   K .
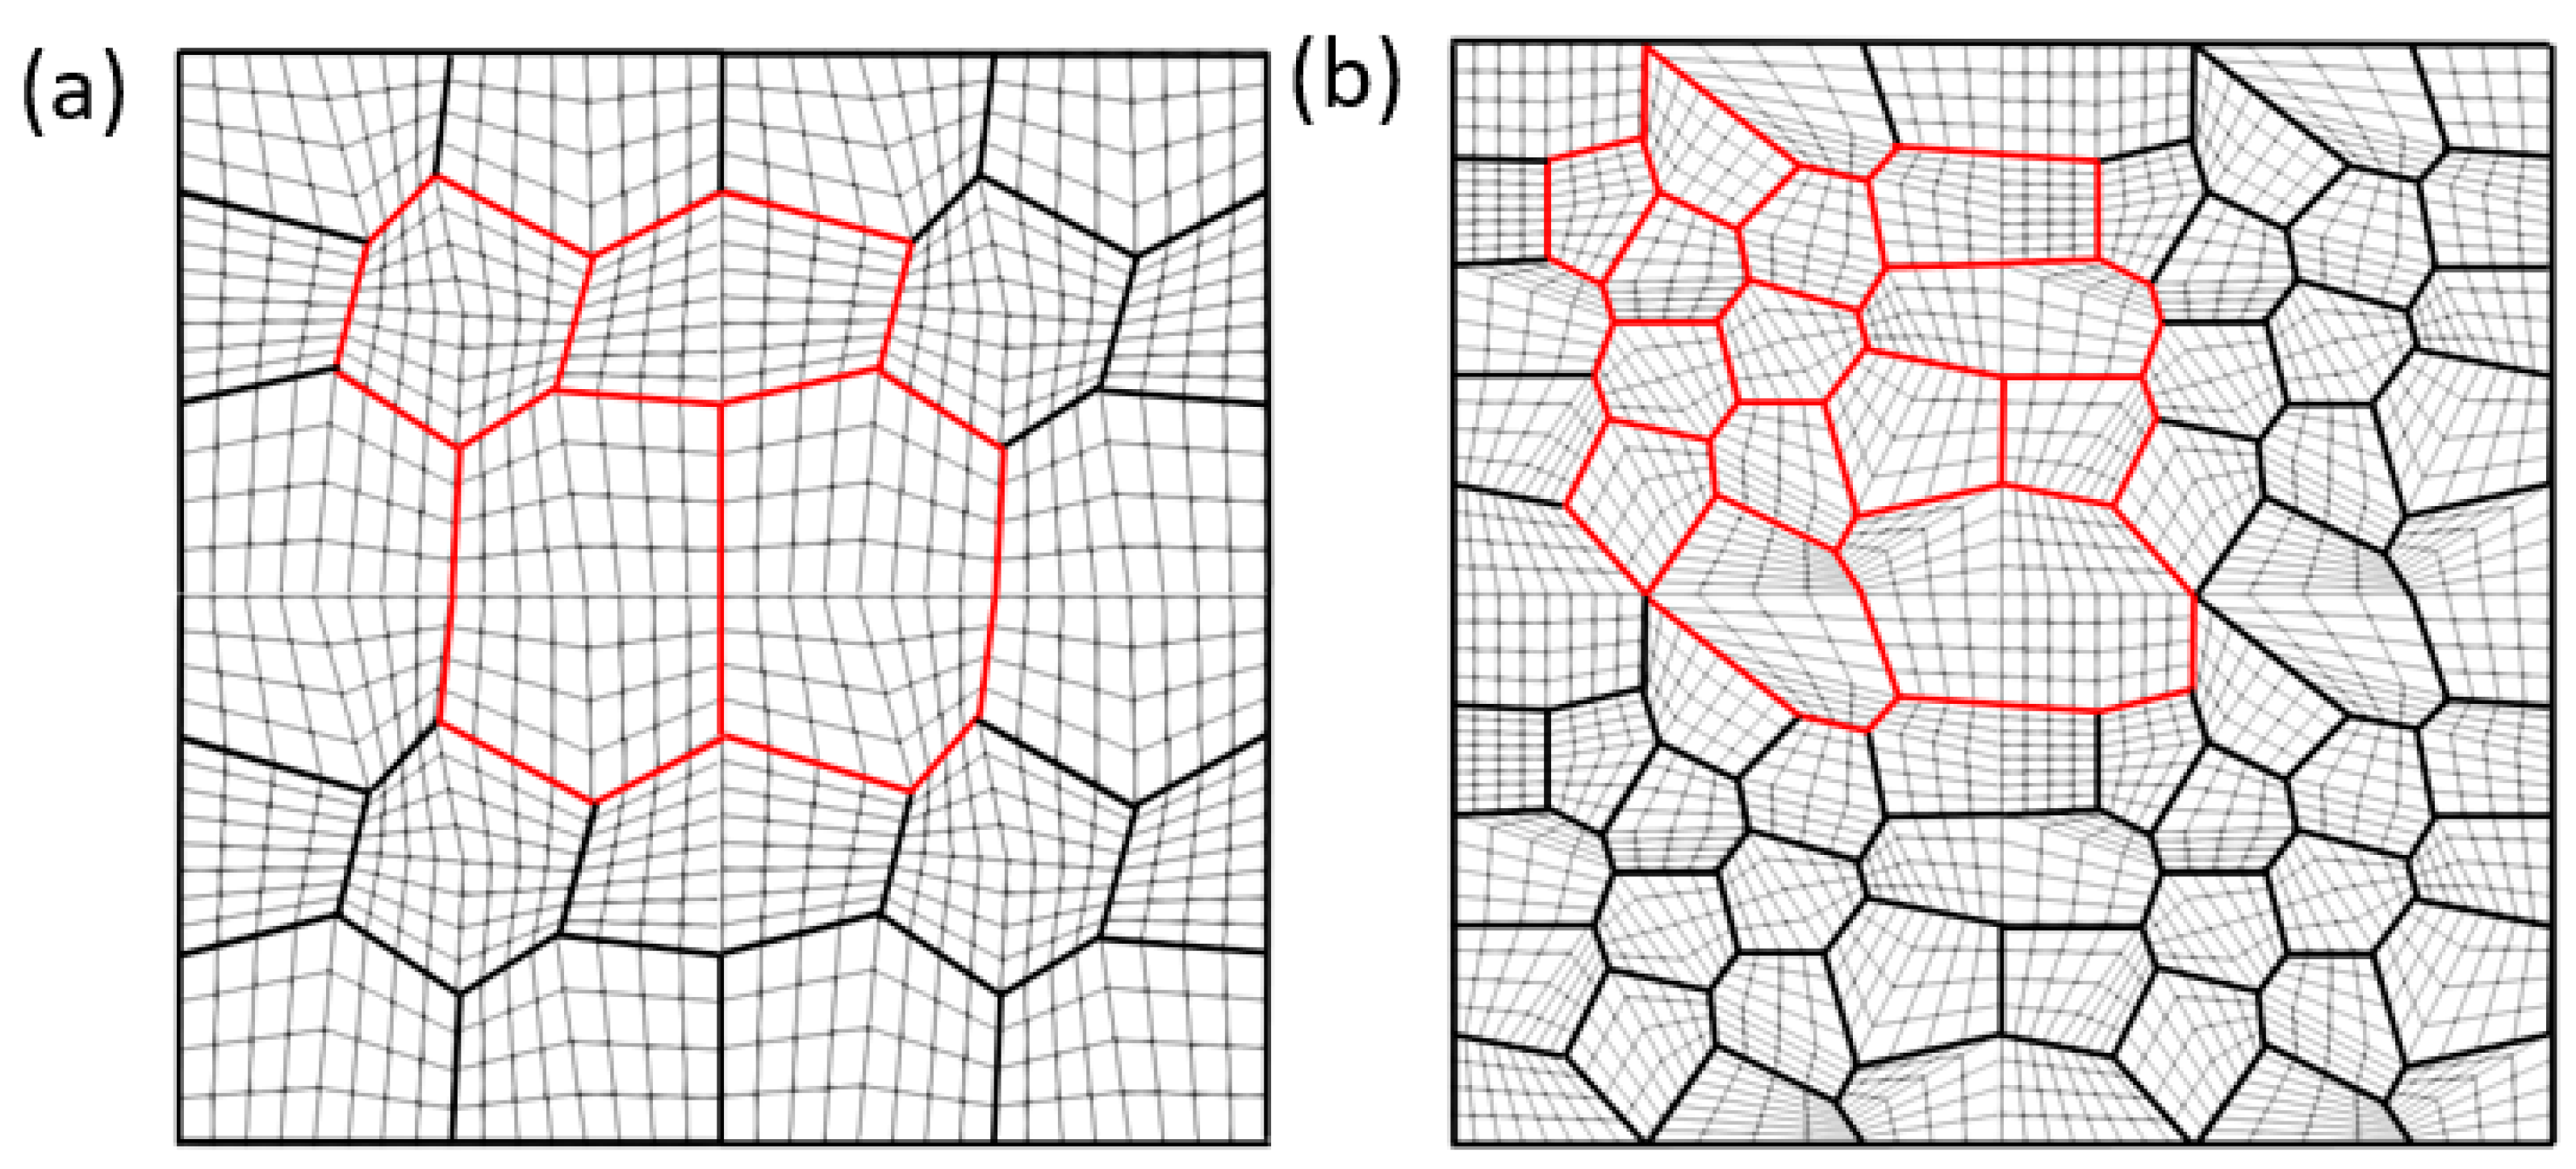
Based on the flexible approach of the Voronoi tessellation method, the polycrystal model could be formed to describe the natural morphology with any number of grains. Here, to satisfy the conditions for periodicity, the polycrystalline models were formed in such that the numbers of nodes of elements on opposite sides were equal. This condition ensured the continuity of the unit cell in the infinite medium. Next, for the purpose of establishing a clear difference in the numbers of grains, and to ensure an effective computational cost, polycrystal models with 4 and 14 grains were formed. Figure 3 presents two sets of tessellations with 4 and 14 grains included for periodicity. A crystalline grain can be considered for each Voronoi polygon. In the simulation, a unit cell was considered as a one-quarter part from the Voronoi tessellation, as shown in Figure 1b. The Voronoi polygon was discretized by quadrilaterals to indicate the mesh. It is important to mention again that there was no grain boundary effect included in the numerical framework in this study, which was based on conventional CPFEM. The different behaviors of the polycrystal model, with different numbers of grains, were induced by the CA approach.

3.2. Cellular Automata Approach

In this study, the CA approach was introduced as a local rule and applied to each lattice at every time step. The transformation criterion, which is described in Section 2.3 of Section 2, was employed as the rule. The transformation criterion was evaluated at each Gaussian integration point on each finite element. The transformation criterion and the state of the cell were clearly dependent on the local driving force, as described in Equation (27). With the updated Lagrangian integration process, the local driving force was attributed to the previous state of each cell. If the transformation condition was satisfied at a variant within the 24 total variants, the martensitic phase α would be formed with only the selected variant system, and would occupy the whole region of the element. Then, the smooth function θ ( I ) on the element was calculated according to Equation (20). After that, the neighboring lattices were continuously considered in terms of the transformation rule. Since each element that formed the α phase was toggled to a single variant, the model was thus set up as an array of cells that were switched on consecutively. From the CA scheme, the interaction term of different variant systems in Equation (23) could be automatically conducted by adjacent finite elements with different transformed variants. The rule was basically an interaction between the neighboring cells, and the interaction could be indirectly expressed though the stress between the elements. Since the amount of shear due to the slip and transformation was affected strongly by the size of cellular automaton, the physical length scale of cellular automaton could be considered simply according to different mesh sizes and unit cell model sizes. More information on the application of the CA approach can be found in reference [34].

3.3. Material Constants and Parameters

Table 1 shows the material parameters and initial values used in the numerical model. The elastic constants were obtained for single crystal stainless steel with a similar chemical composition as those in the works of Ledbetter et al. [43,44]. For the martensitic phase, the elastic constants were considered for pure iron with a bcc structure [45]. These parameters are representative of the TRIP steel analyzed in this work. In crystalline material, the critical resolved shear stress is the shear stress that activates a particular family of slip systems. Hence, it is independent of the applied stress and initial crystallographic orientation. For fcc metals such as SUS304, all slip systems initially have the same critical resolved shear stress.

4. Numerical Simulation and Discussion

4.1. Calibration and Experimental Validation of Computational Results

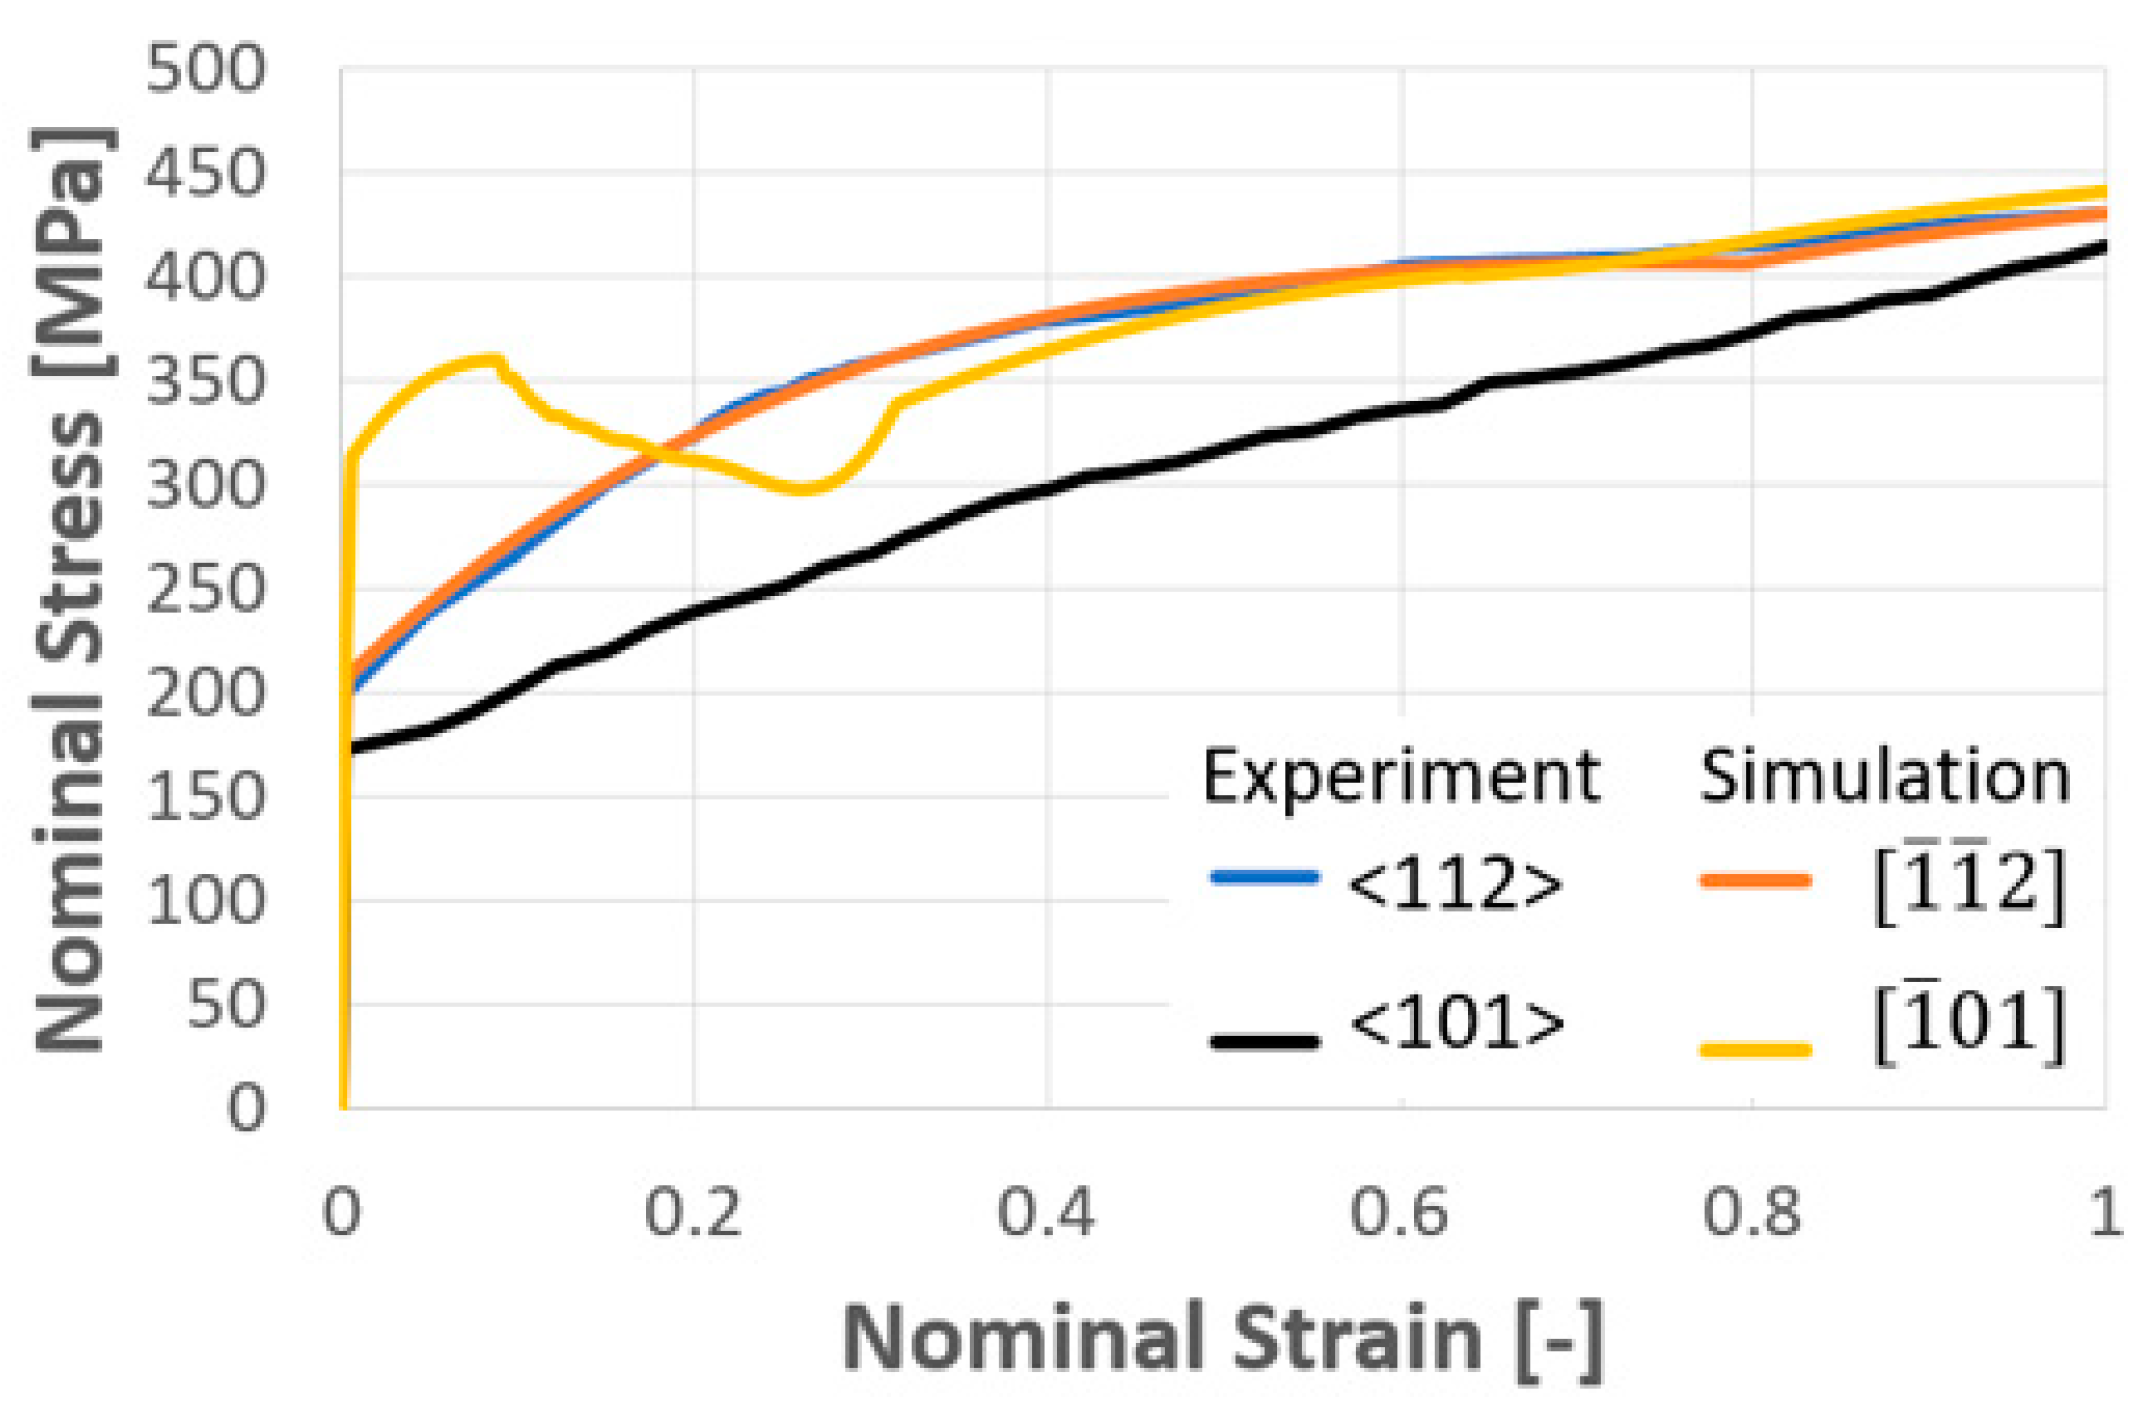
For a verification of the constitutive model within the proposed framework of CPFEM, the model was initially calibrated by experimental results. Experimental works on the single crystal SUS304 are quite rare because of the difficulties involved not only in ensuring a higher quality manufacturing process but also the tensile testing of the single crystalline samples. In this regard, only the experimental results of Tsurui et al. [46] can be found. In the work, tensile tests in the directions of <101> and <112>, which correspond to the initial crystal orientations with = 60 ° and 90 ° , were carried out, respectively. At first, the calibration of the mode was performed using the result for the direction to <112>. In the case of [ 1 ¯ 1 ¯ 2 ], two slip systems were symmetrical against the tensile direction of the model, as shown in Figure 1a. Consequently, the uniform deformation could be observed. Figure 4 shows the comparison of nominal stress and nominal strain obtained by the computation approach and the experimental data. As the result of the calibration, the nominal stress in the numerical simulation showed very good agreement with the results obtained through the experiment in the direction of <112>. Since unit cells shown in Figure 1a were considered under the infinite medium within the framework, the uniform deformation only appeared, in case of orientation, as [ 1 ¯ 1 ¯ 2 ]. However, the actual situation was different because the gripping of the sample made it quite difficult to obtain the homogeneous deformation in the sample.
The result for the direction of [ 1 ¯ 01 ] was obtained with the intention of validating the computational result. Of course, non-uniform deformation could be expected due to the different evolutions of two slip systems. Additionally, since the periodicity was ensured by the PBCs, the discontinuity coming from the strict boundary condition at the corners of the unit cell could be avoided. Due to the PBCs, a higher stress level could be expected because the uniaxial stress state could not be obtained. Consequently, the computational model could eliminate the damage, as well as the stress and strain localizations that occurred in the test around the gripping parts of the specimen. Actually, from the black and yellow curves in Figure 4, it can be seen that the nominal stress in the simulation at [ 1 ¯ 01 ] was higher than that of the experiment because of higher yield stress. However, the slope of the nominal stress in the simulation and the experiment were very similar at ε n = 0.3 ~ 1.0 . Obviously, compared to a three-dimensional model, the analysis based on the two-dimensional model was still insufficient in terms of validating the result for the reasons given above. Here, because the specific aim of the study was to capture the SIMT behavior with the shear band formation, the two-dimensional model was intentionally chosen to explain the observed behaviors.

4.2. Monocrystal TRIP Steel

Figure 5 presents the distribution of (a) equivalent stress and (b) equivalent plastic strain of single crystal unit cells in an infinite medium when six-unit cells were arranged in an orderly manner and = 60 ° at ε n = 1.0 . The color bars, which indicate the range of equivalent stress and equivalent strain, are shown at ε n = 1.0 . Here, the red and blue colors denote the higher and lower equivalent stress or equivalent plastic strain, respectively. As shown in Figure 5, the higher equivalent stress and the higher equivalent plastic strain appear as band structures. In addition, the cells can be matched well with each other, which evidences that the periodicity was applied successfully. Consequently, the band structures appeared periodically from one cell to another in the infinite medium.
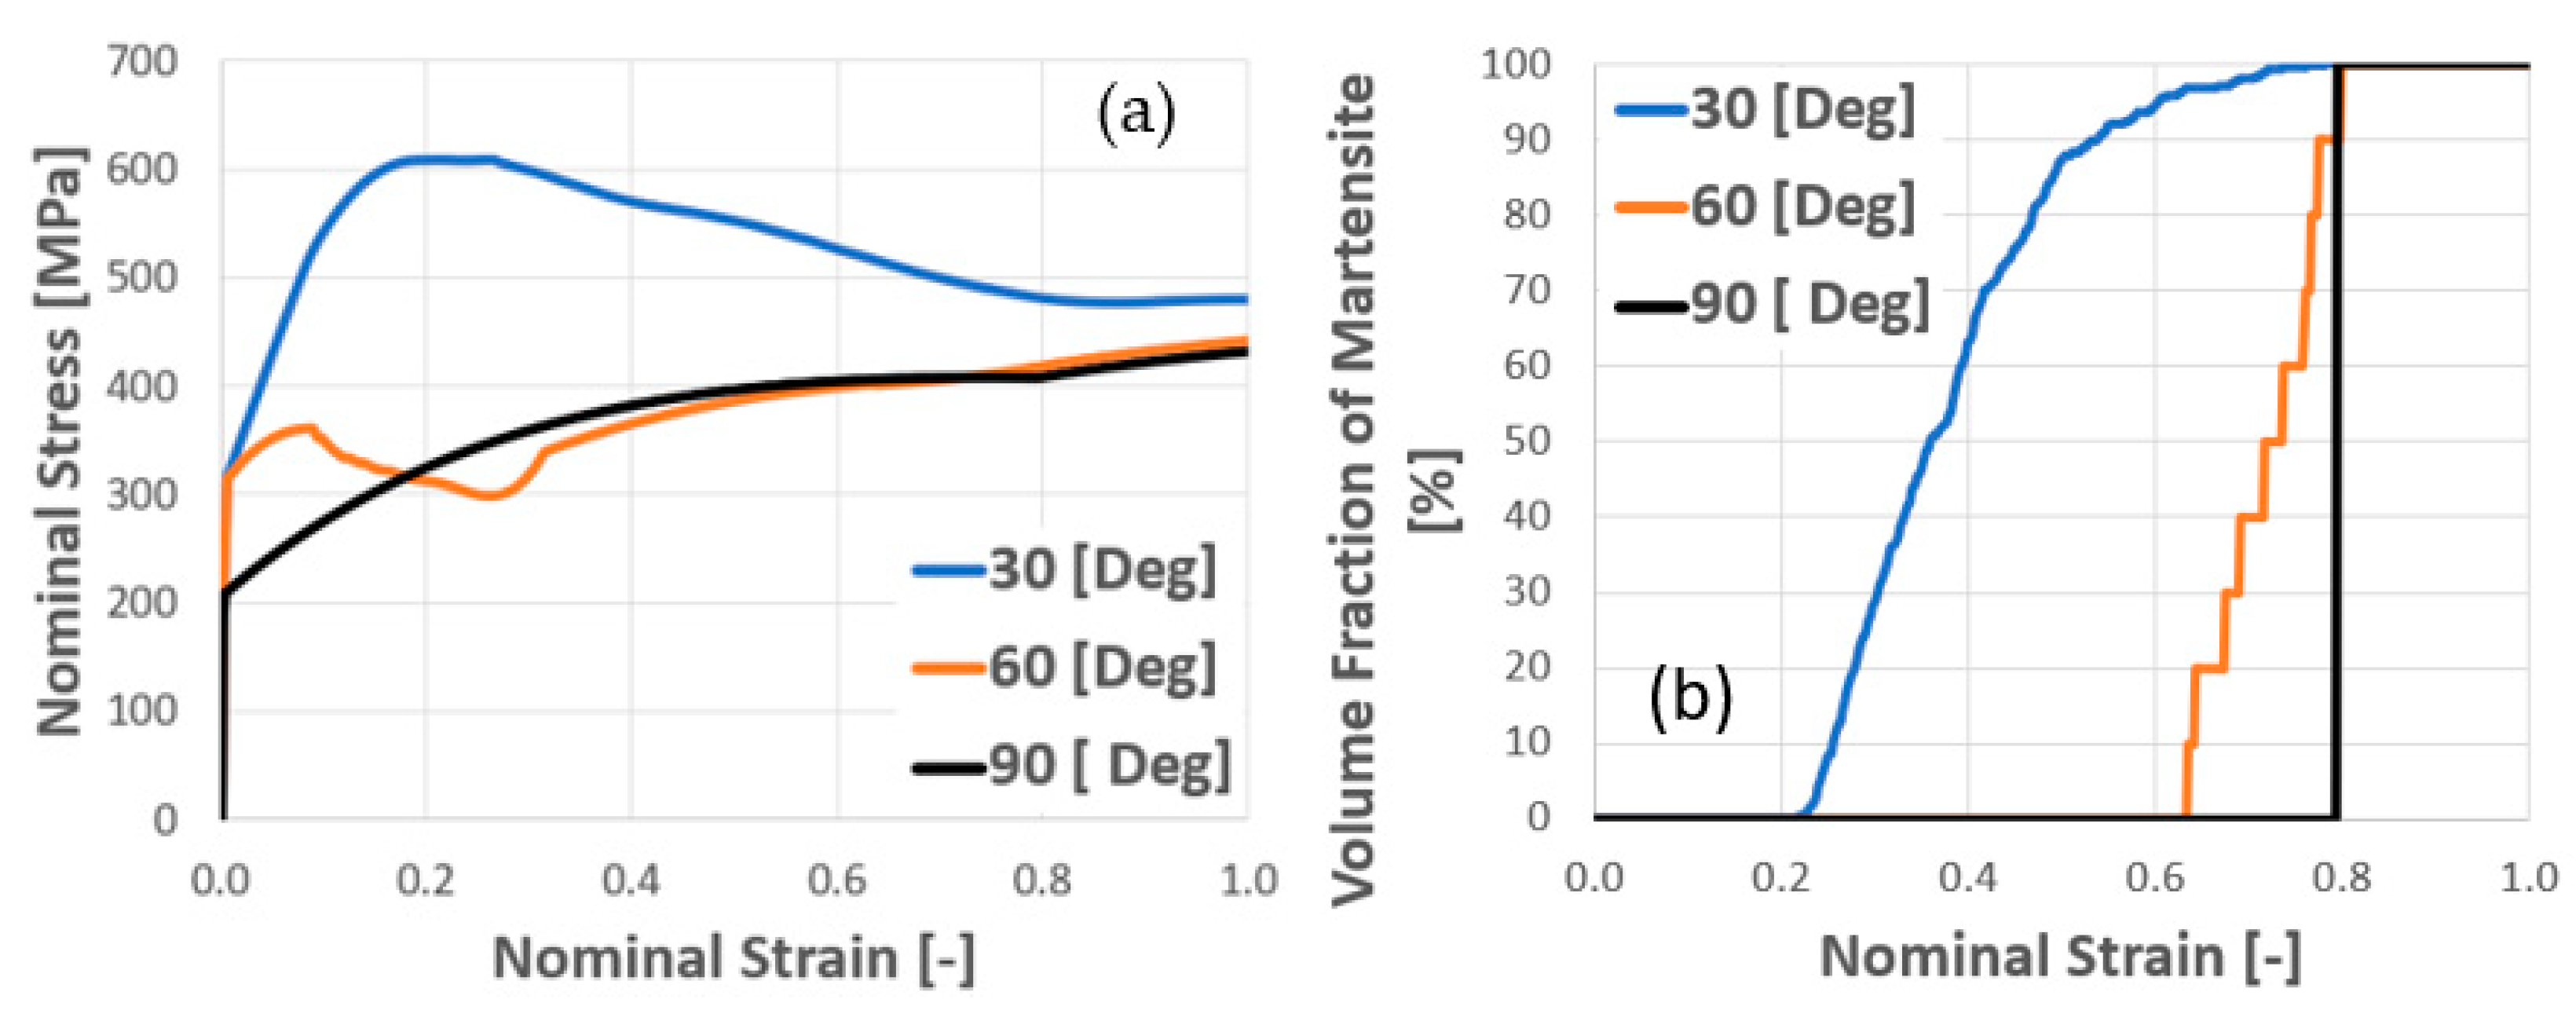
Figure 6a,b present the relationship of nominal stress and nominal strain, and the total martensitic volume fraction versus nominal strain, with different initial crystallographic orientations or parent austenitic phase. As shown in Figure 6a, the stress-strain responses depended strongly on the initial crystal orientations of the parent phase. Additionally, the nominal stresses of each case of the crystal orientation became convergencet at ε n = 1.0 . It is possible that after MT was completed, the level of stresses converged with the hardening of martensite.
On the other hand, from Figure 6b, it can be seen that the initial crystal orientation also significantly influenced the evolution of the martensitic volume fraction. The formation of martensite in the case of = 30 ° was earliest at ε n = 0.23 and increased gradually, while martensite started to form much more slowly in the case of = 90 ° at ε n = 0.8 . When = 60 ° , there were steps in the evolution of the martensitic phase. The reason might be due to the sensitivity of the mesh. Importantly, in the case of = 90 ° , the homogeneous deformation could be obtained due to the equal increases in the shear slips in two symmetrical slip systems. Consequently, the MT instantaneously occurred over the entire region at ε n = 0.8 .
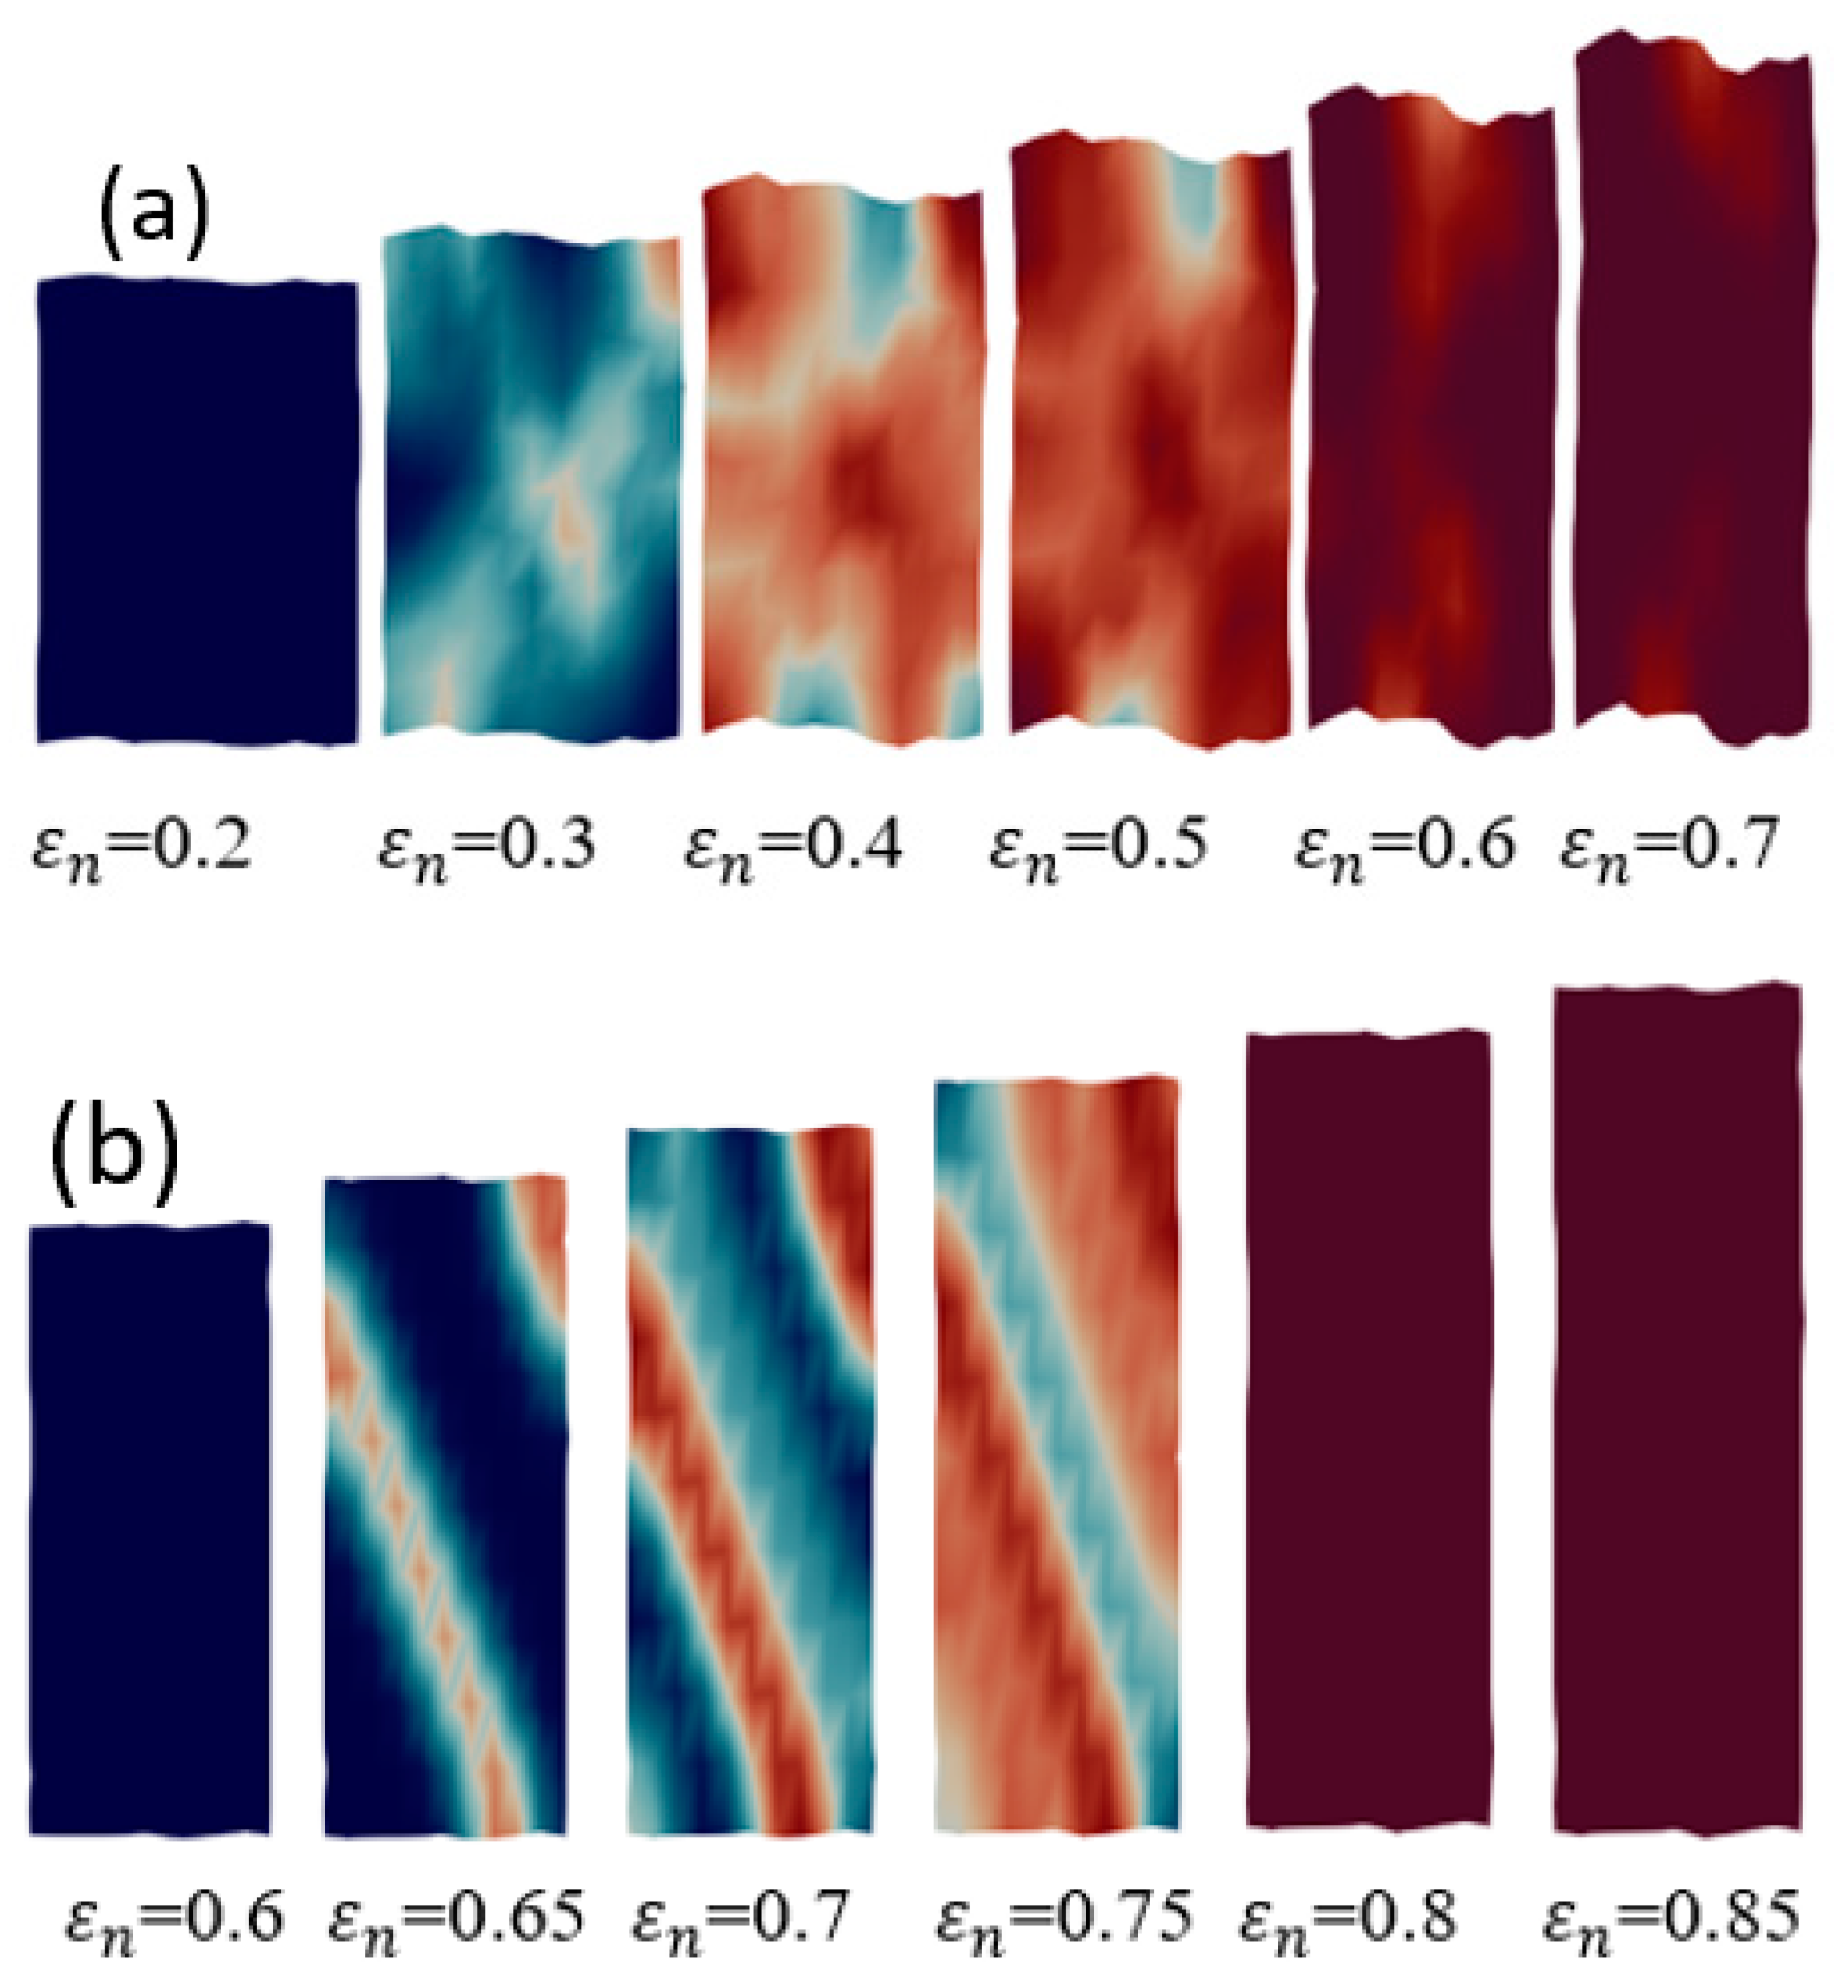
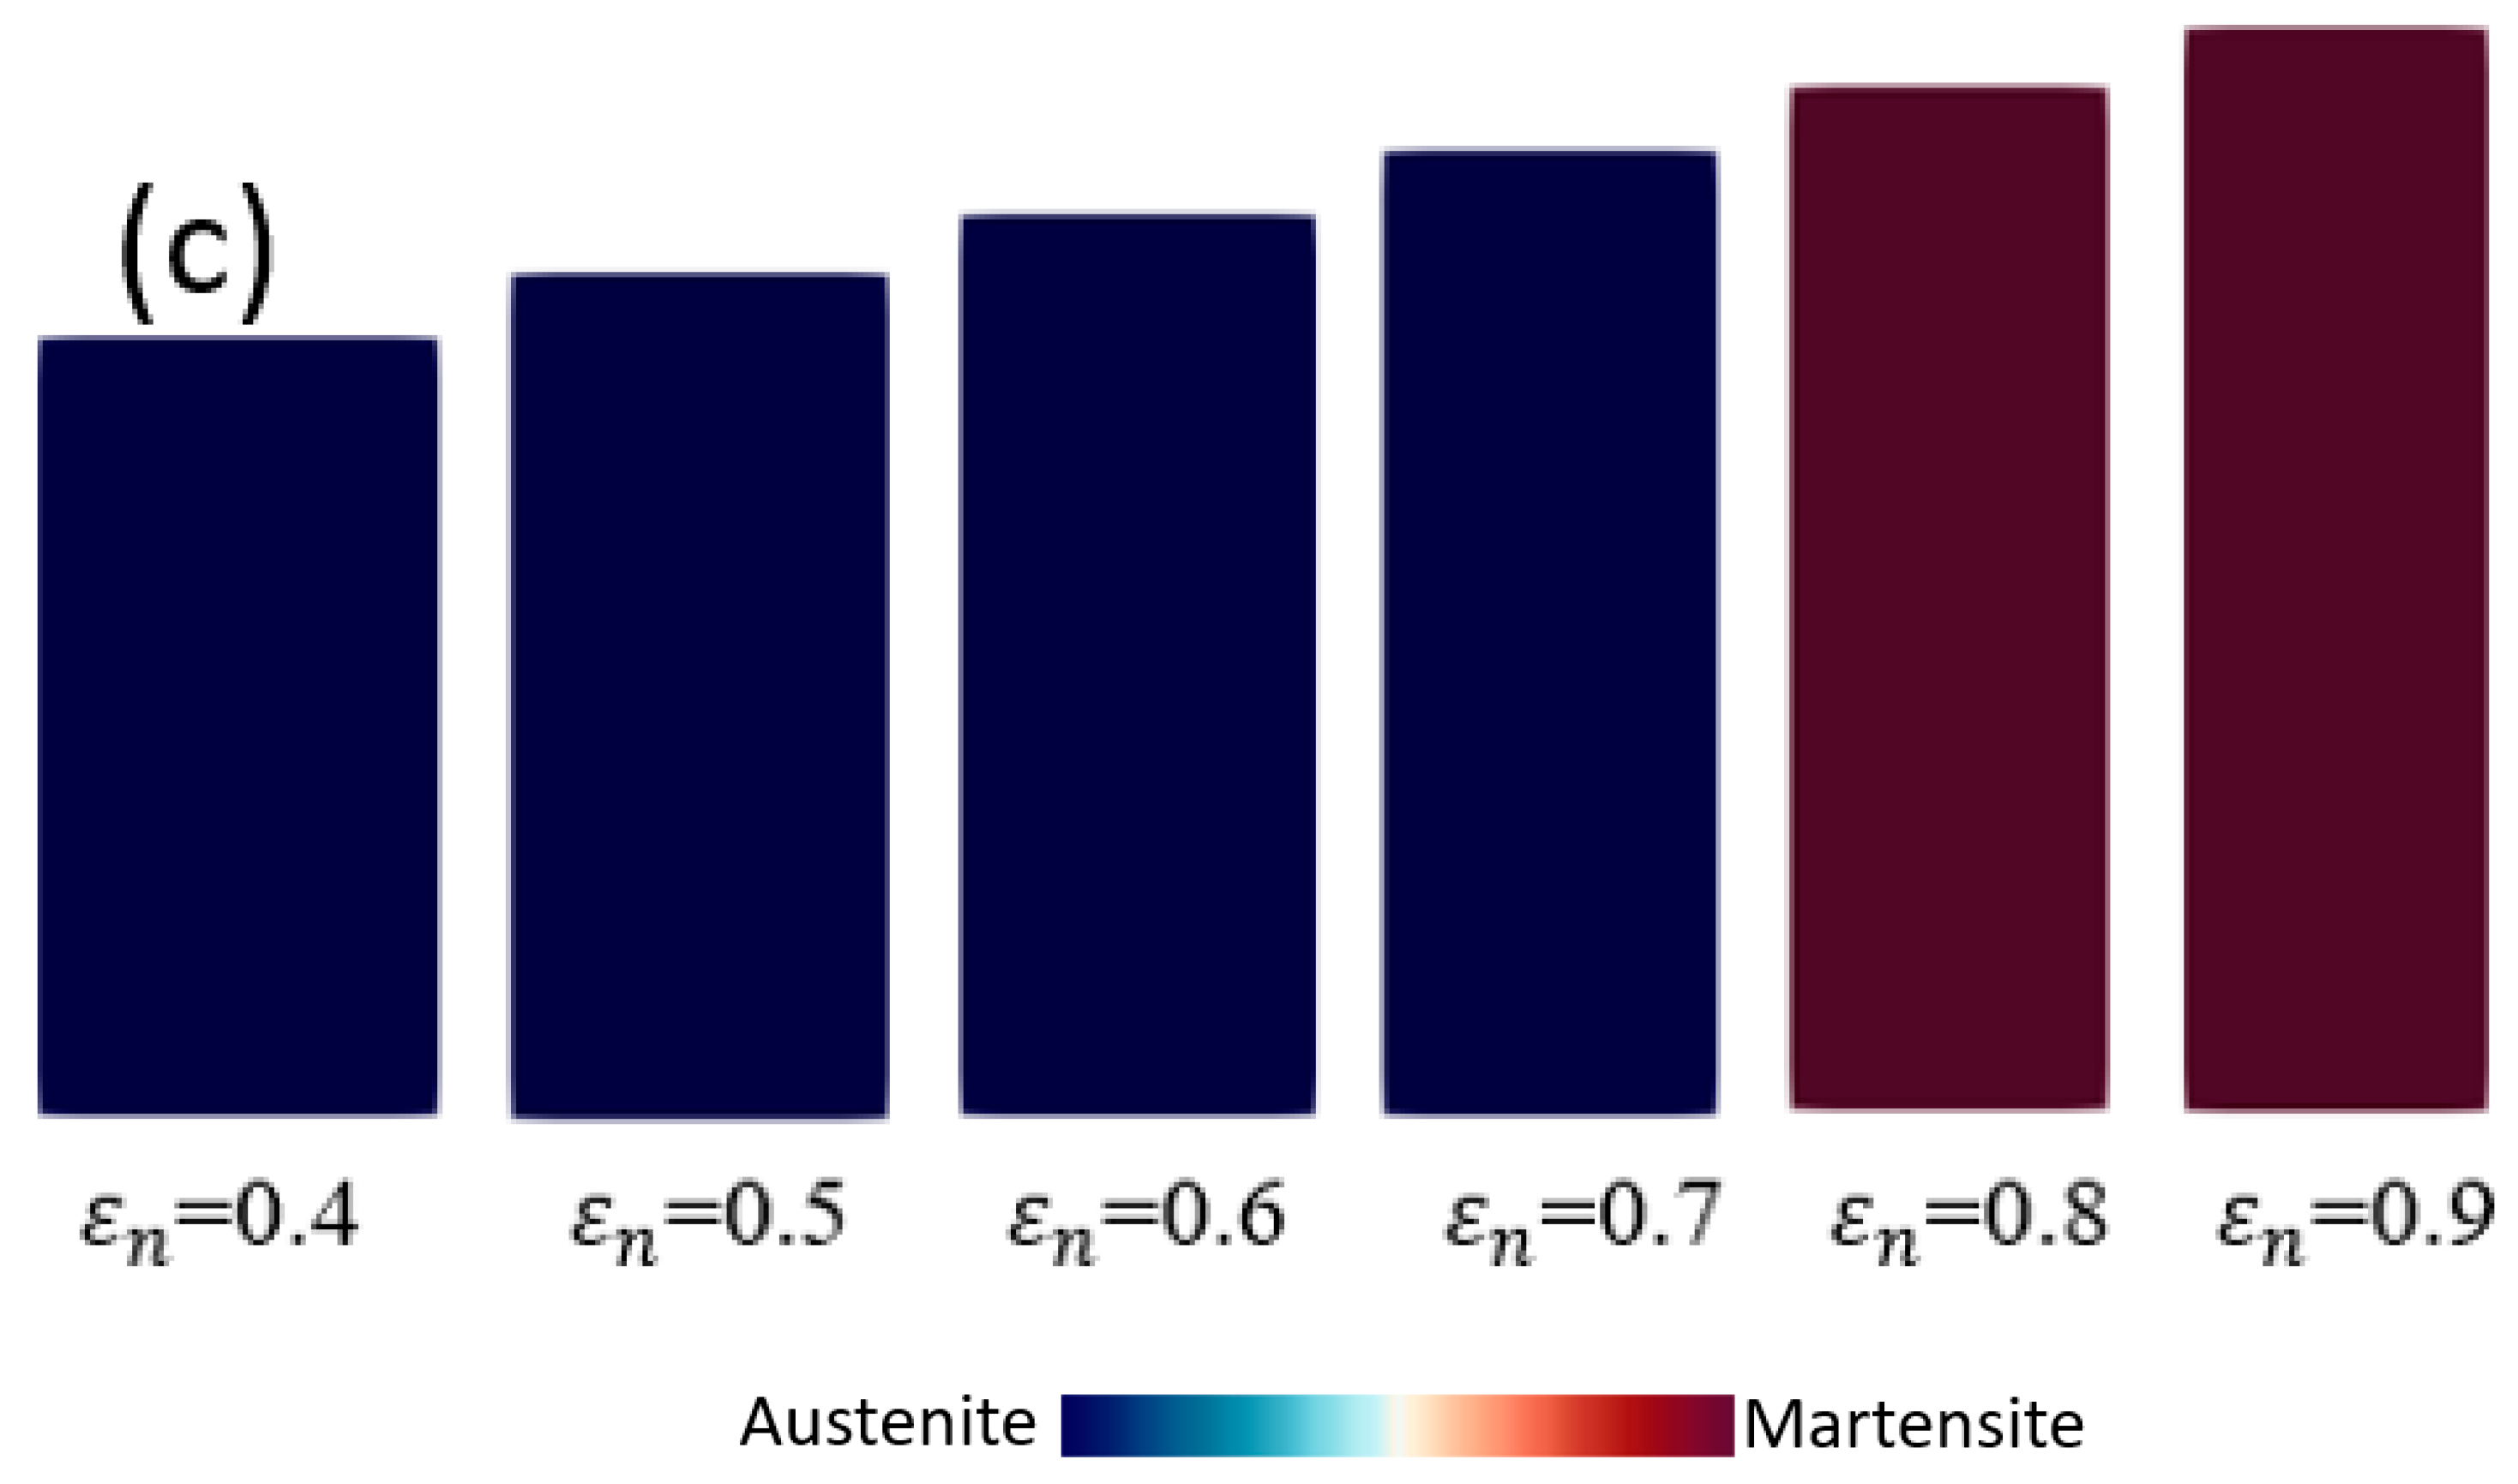
Figure 7 illustrates the distribution of martensitic phase of single crystal TRIP steel in various initial crystal orientations. In this figure, the blue and red colors indicate the pure austenite and pure martensite phases, respectively. The variations of nominal strain in each case are different due to the MT process that corresponds to Figure 6b. In Figure 7a, as = 30 ° , the martensitic phases were formed heterogeneously. On the other hand, in the case of = 60 ° , the evolution of martensite begun nucleation and expanded rapidly. In particular, the martensitic phase appeared as the band structures from ε n = 0.65 . On the other hand, when = 90 ° , the martensitic phase occurred over the entire region at ε n = 0.8 . Although both initial crystal orientations of = 30 ° and = 60 ° provide inhomogeneous deformation, the band structures could be observed in the case of = 60 ° , while the band structure could not be clearly observed in the case of = 30 ° due to the heterogeneous nucleation of the martensitic phase.
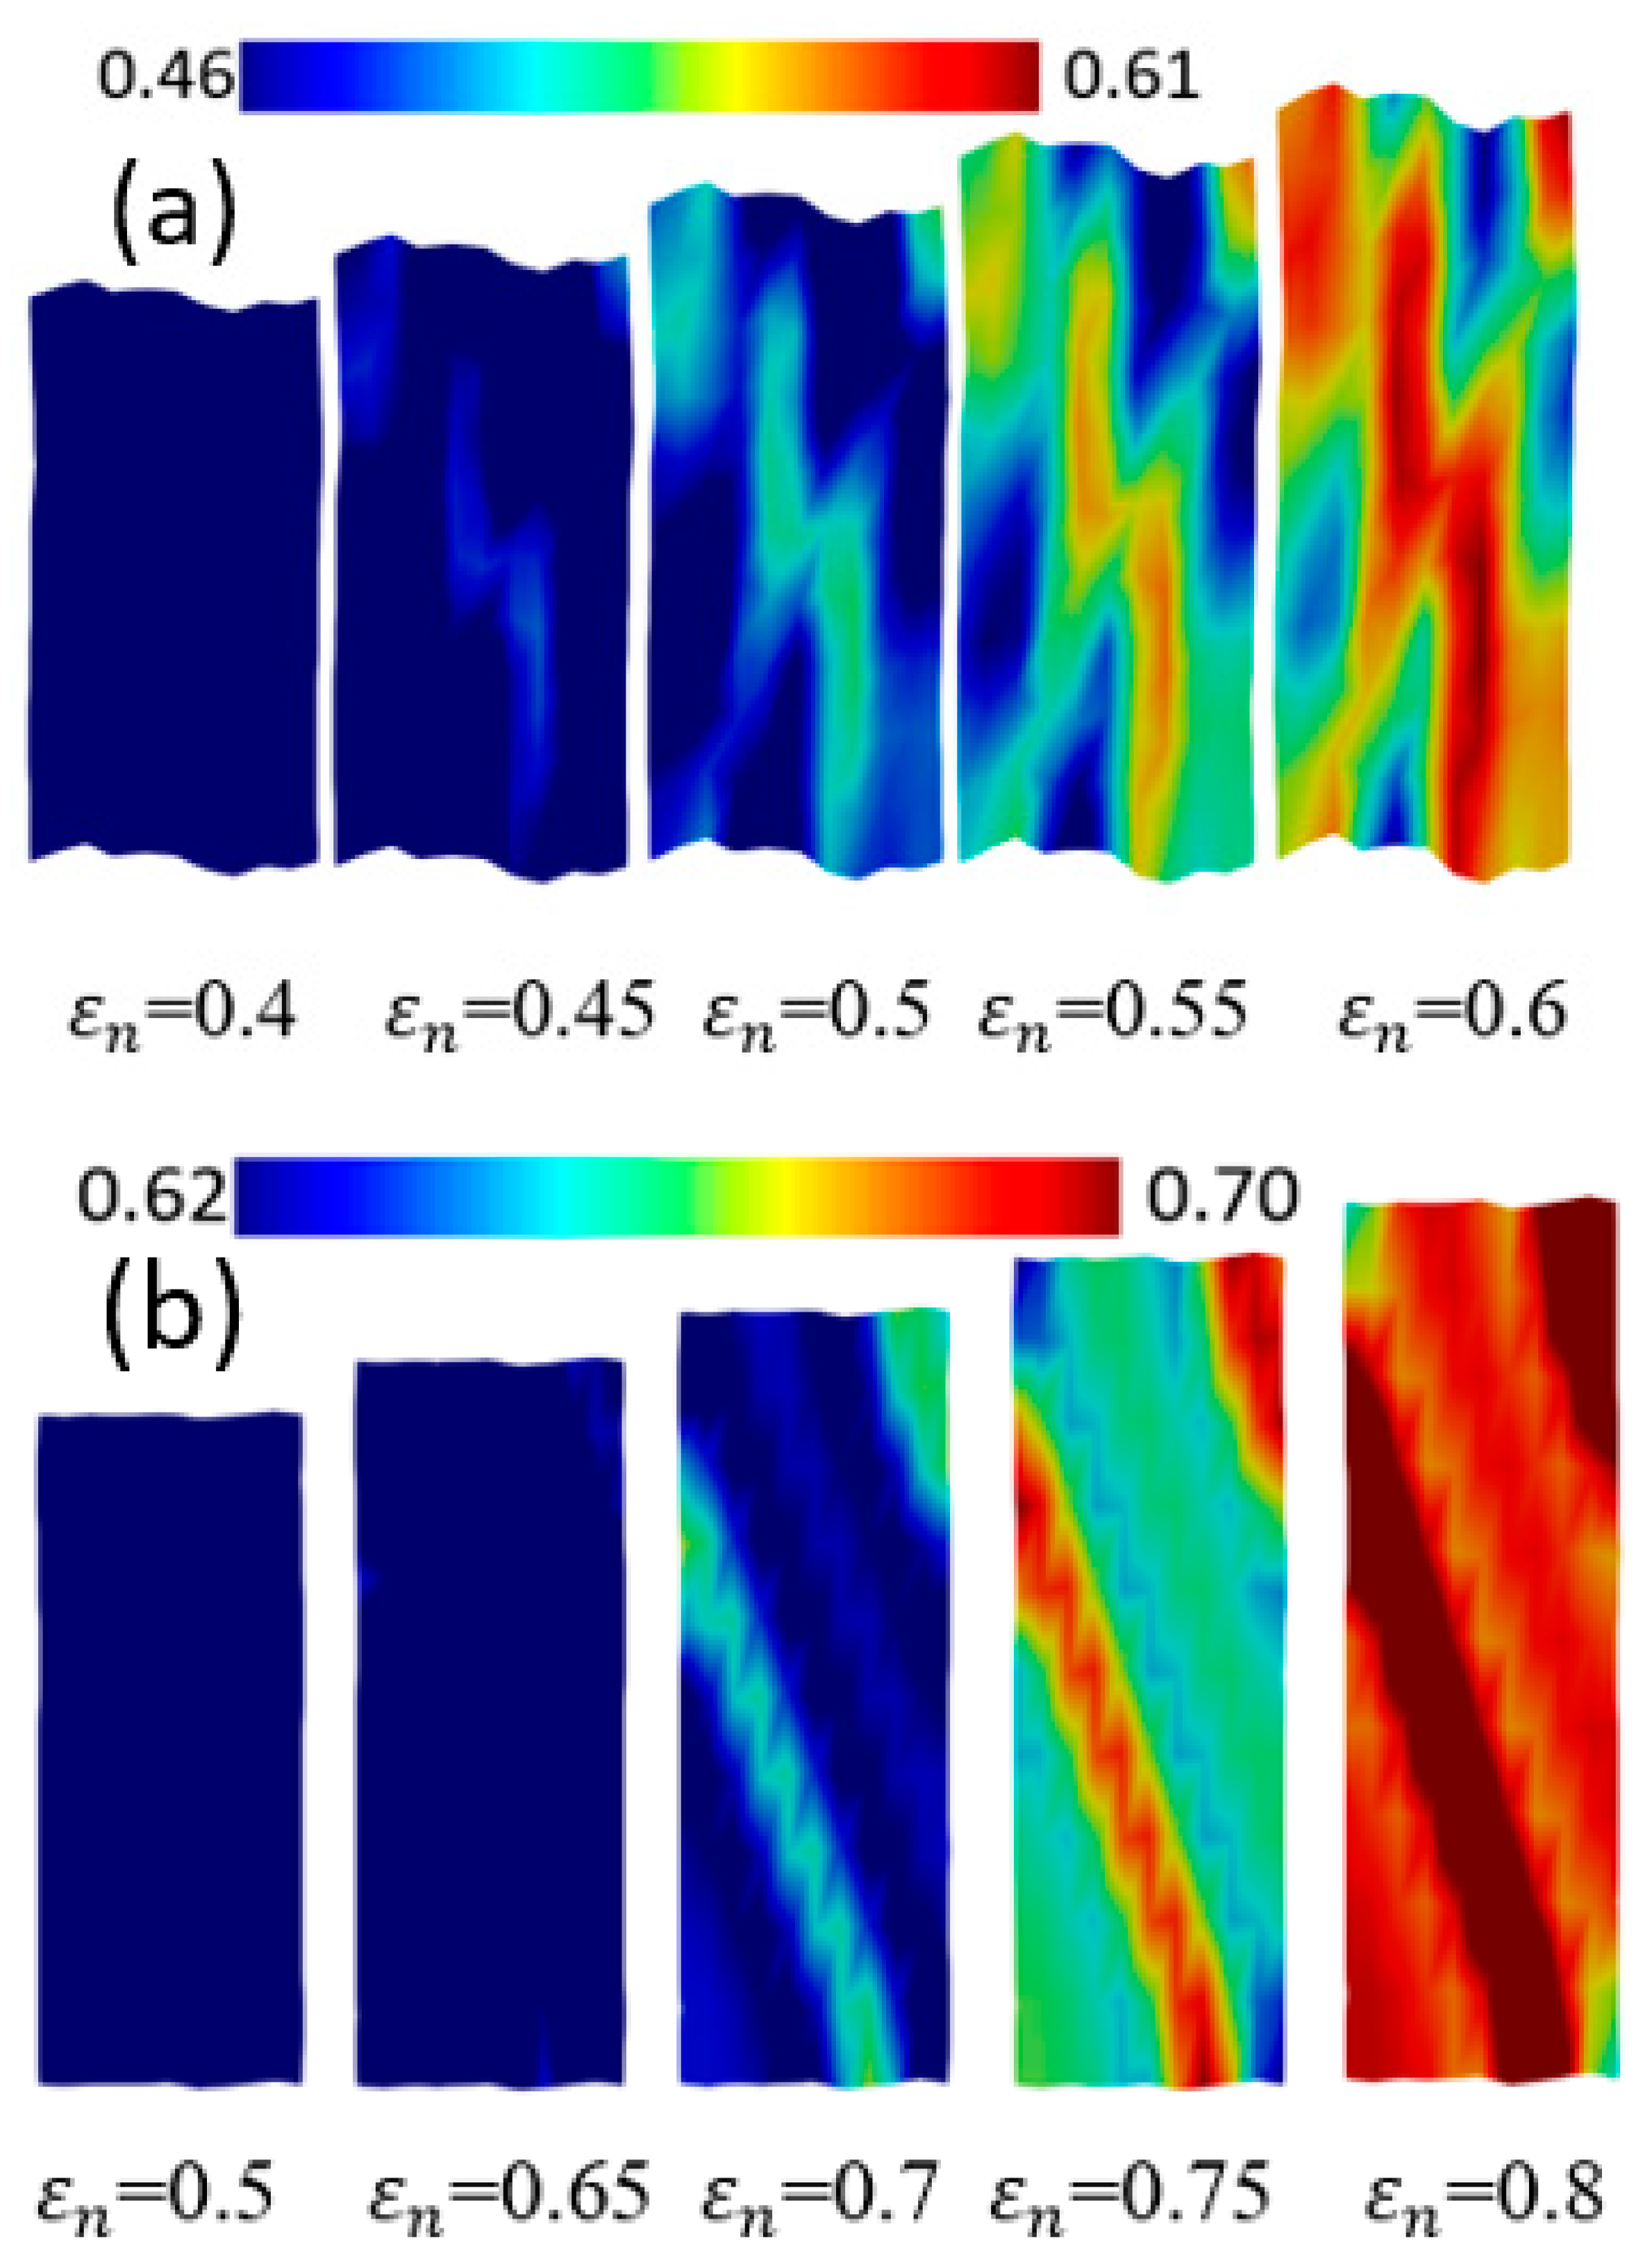
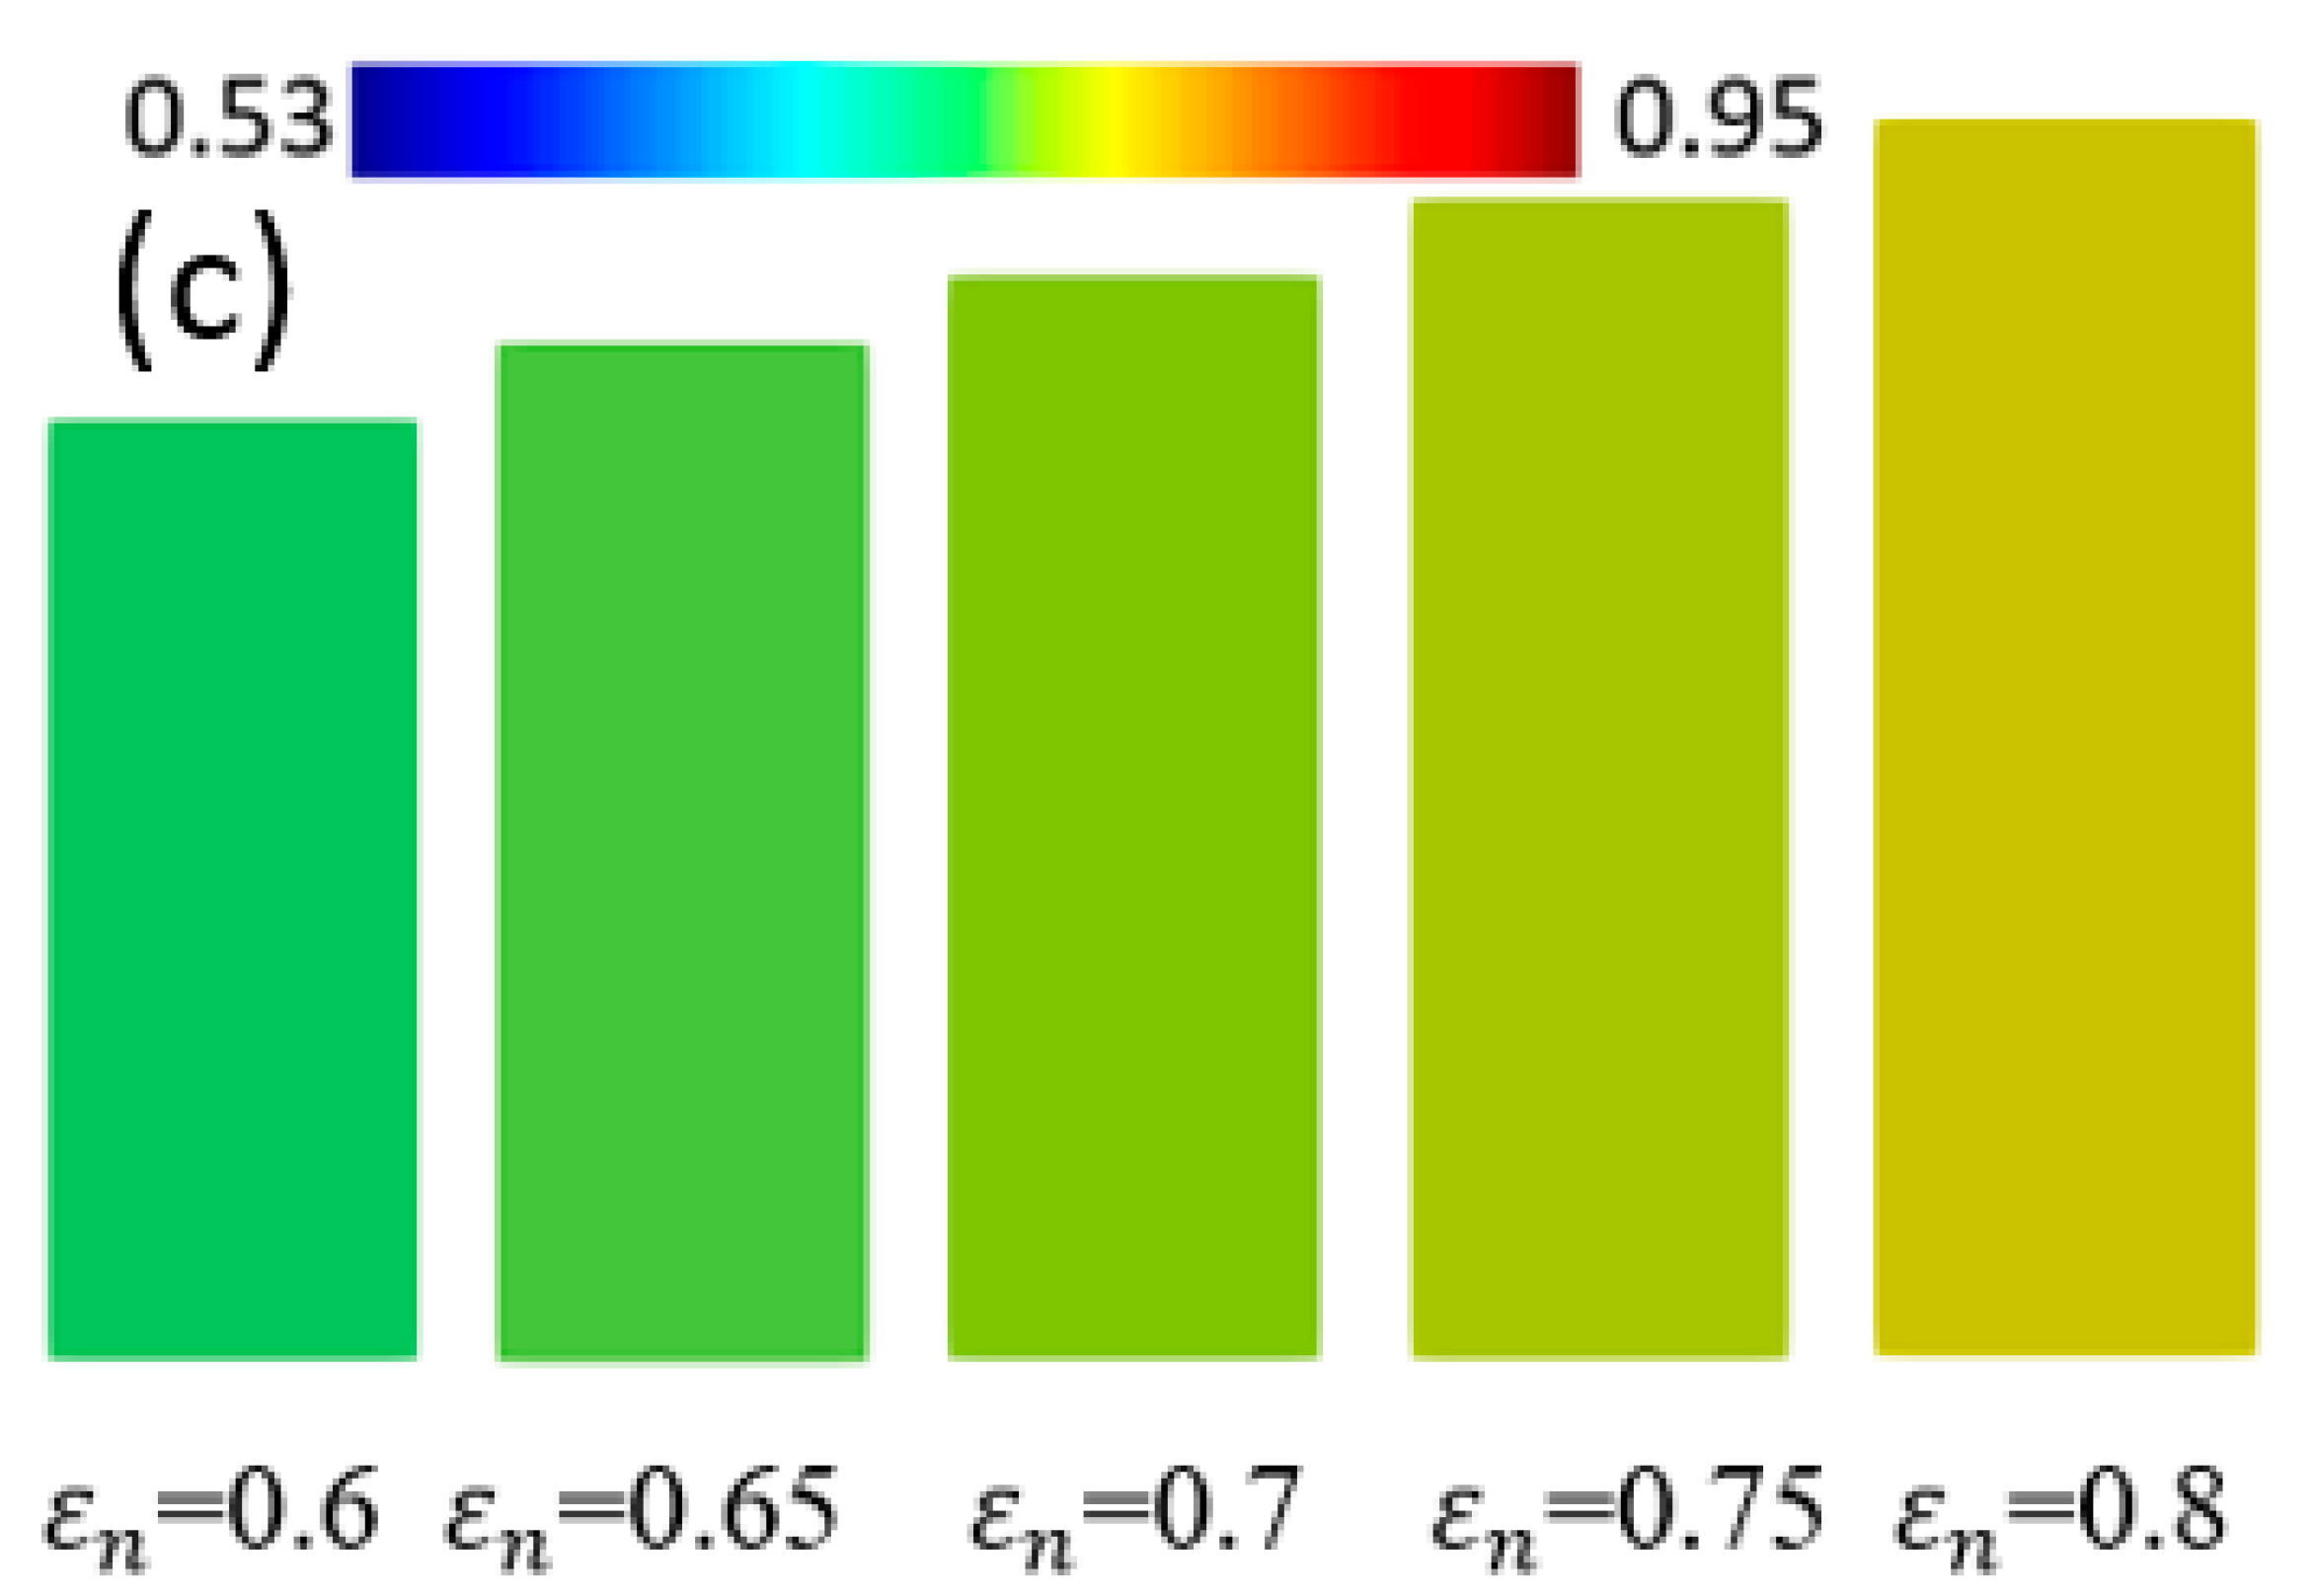
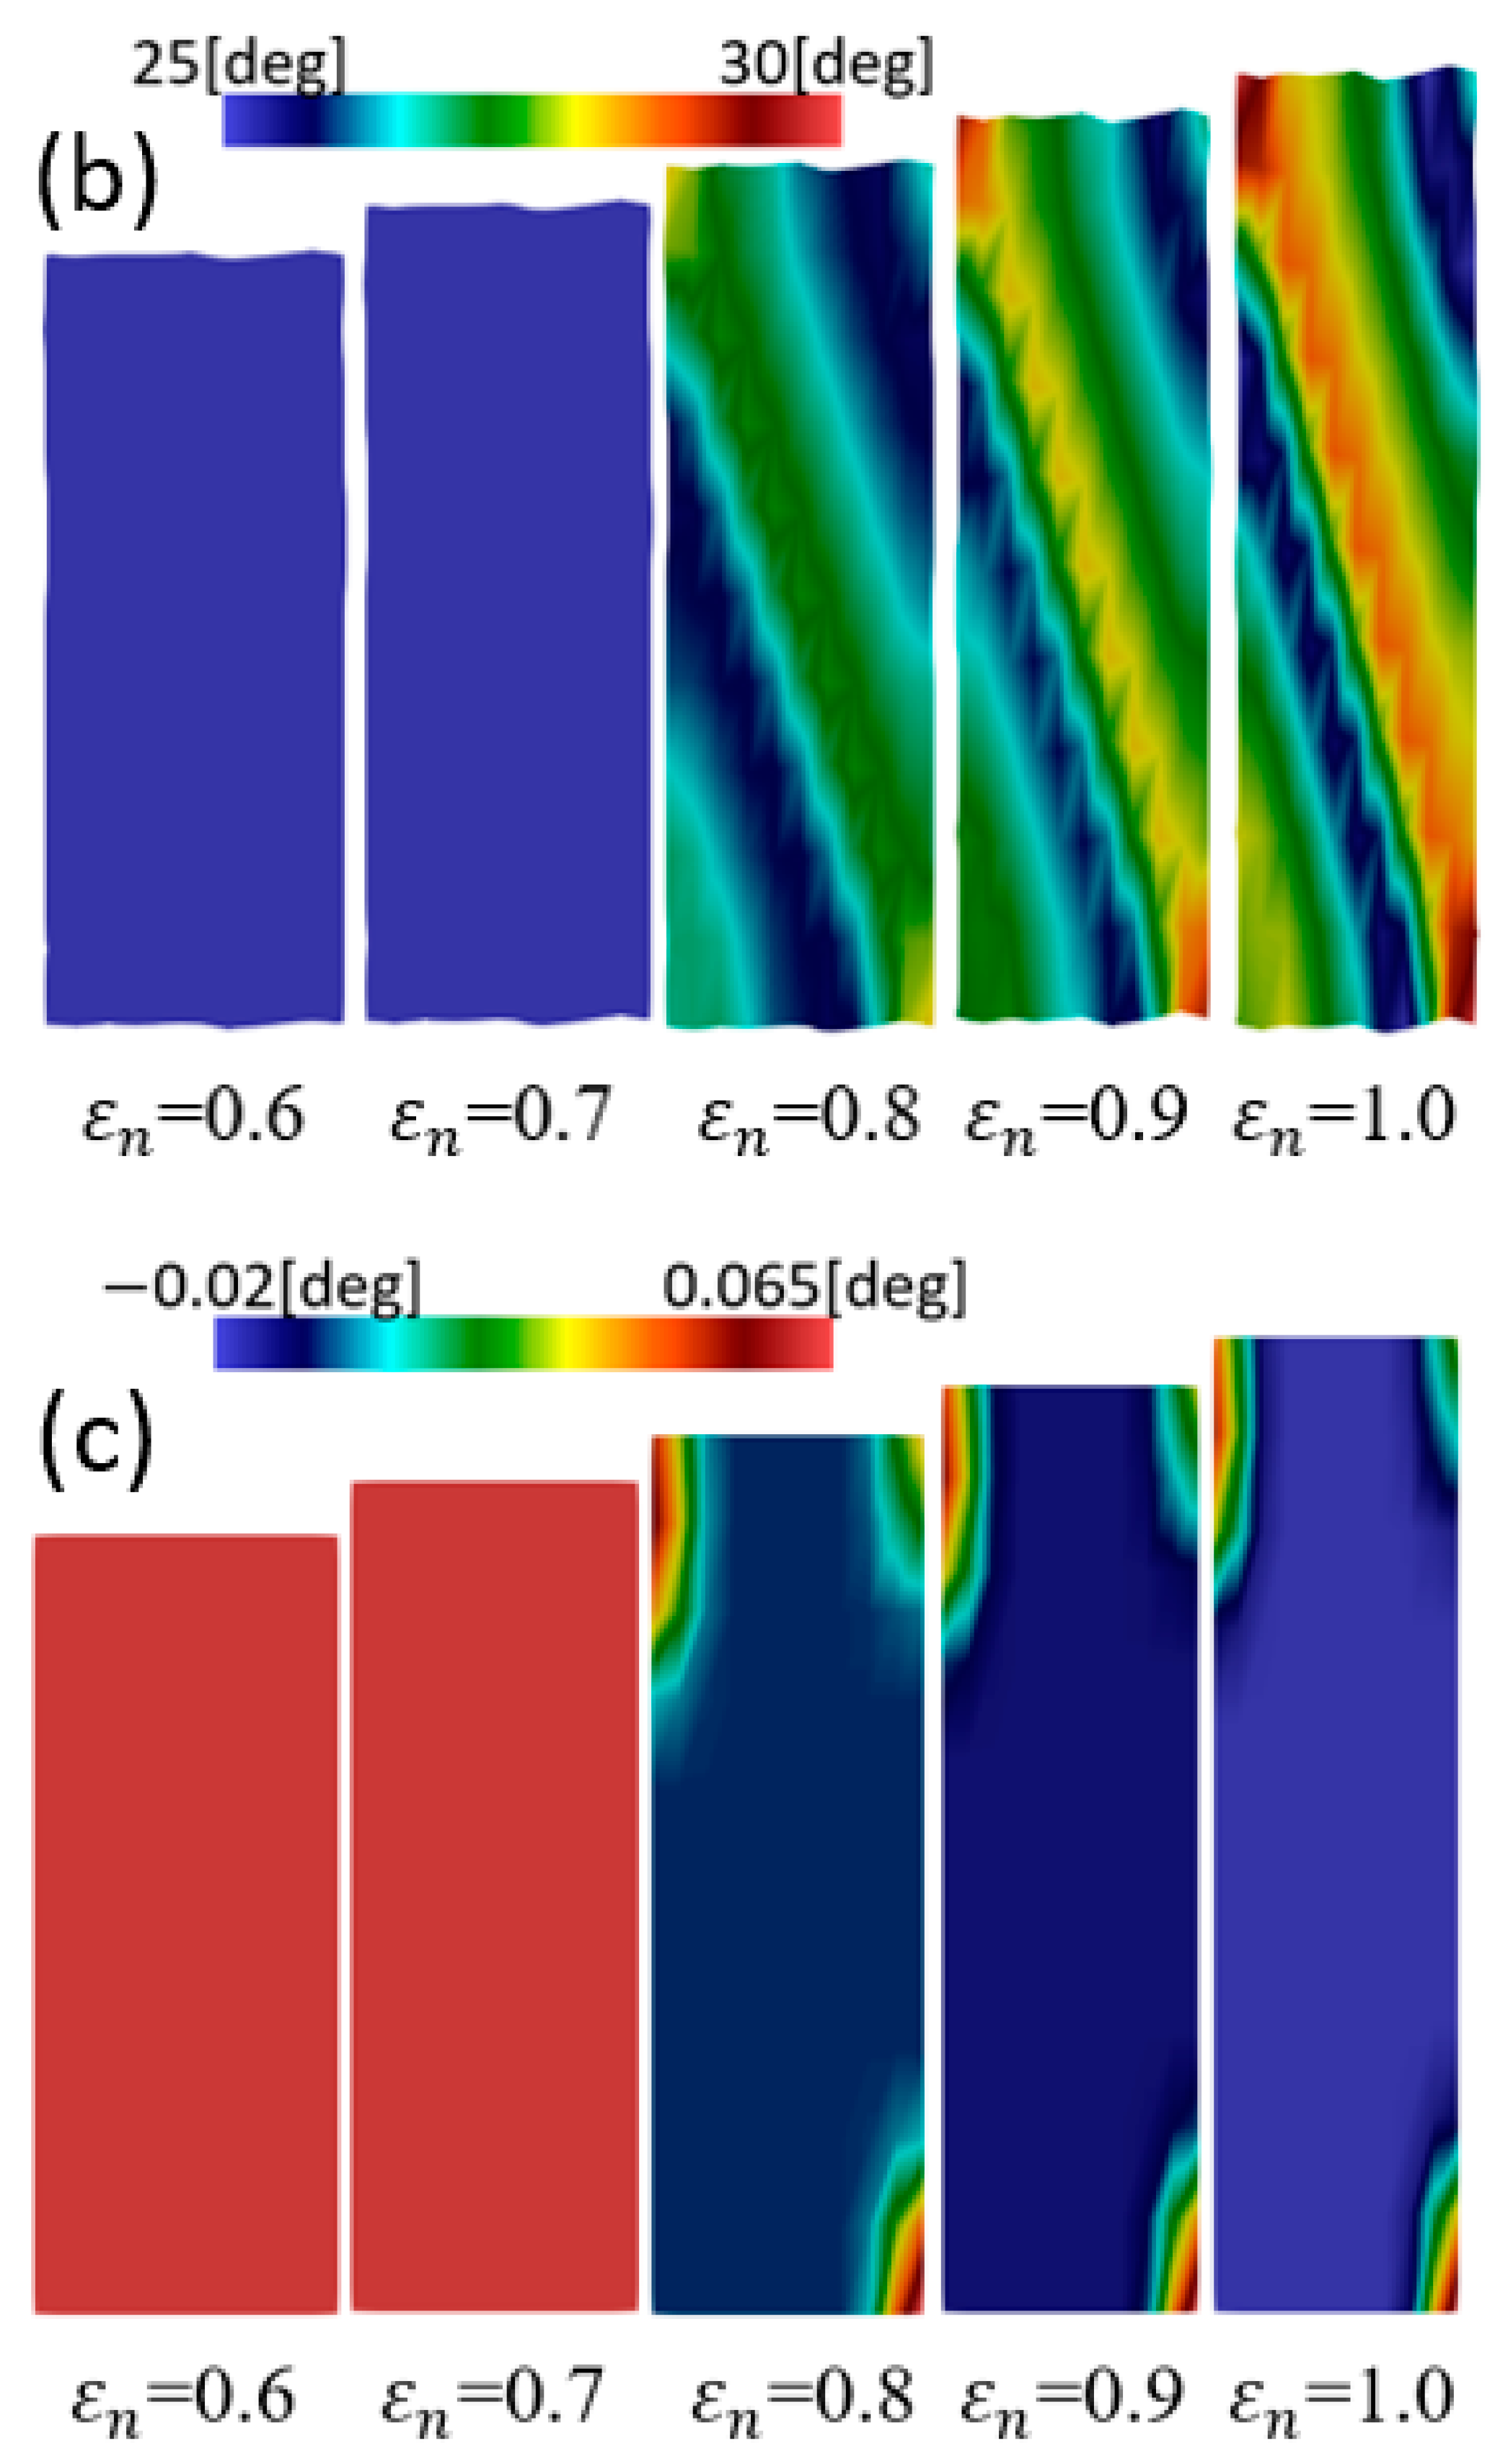
In TRIP steel, the SIMT is usually associated with plastic strain. When subjected to plastic deformation, strain accommodation occurred inside the region of severe deformation. These regions are normally preferred for the nucleation of new sites of martensitic embryos. In addition, an appropriate combination of plastic deformation with SIMT can generate inhomogeneous microstructures. Hence, an understanding of the behaviors of plastic strain during MT is indispensable. Figure 8 shows the distribution of equivalent plastic strain levels in single crystal TRIP steel at different initial crystal orientations. The variations in nominal strain, in each case, are considered within the occurrence periods of MT that correspond to Figure 6b. Here, the red and blue colors indicate higher and lower equivalent plastic strain.
When = 30 ° and = 60 ° , the regions with higher equivalent plastic strains appeared as the shear band structures and expanded to larger sizes with the promotion of deformation. Additionally, the shear band intersections could be observed in both cases. However, the number, the width, and the length of the shear band intersection in the case of = 30 ° were larger than those of the shear band intersections in the case of = 60 ° . Importantly, upon comparison with Figure 7a,b, respectively, it can be seen that the areas of the martensitic phase corresponded with the regions of higher equivalent plastic strain. It is highly possible that the austenite near regions with higher equivalent plastic strain was transformed into martensite in a further deformation process. The MT progressed in a similar manner to a chain reaction under the straining process. This result shows that the SIMT behavior is described successfully in this study.
In addition, Levitas et al. [12] qualitatively demonstrated that the regions of shear band intersections are favored for transformation works. Transformation work depended significantly on the number of active shear band intersections as the macroscopic strain increased. In the case of = 30 ° , the higher number of shear band structures led to an increase in the number of the active shear band intersections. Consequently, the necessary transformation work could be provided, and phase transformation occurred earlier compared to the process in the case of = 60 ° . In practice, during plastic deformation, ε -martensite can contain a small fraction of the total shear band structure, and α -martensite can be formed quickly at the intersections of ε -martensite where two intersecting ε -martensite laths are formed. Figure 8a,b illustrate that there was an implicit appearance of strain-induced ε -martensite inside the generation of the huge shear bands. The results are consistent with the findings in the work of Levitas et al. [12]. When = 90 ° , the distribution of equivalent plastic strain appeared uniformly. Additionally, the region with higher equivalent plastic strain could be seen when ε n = 0.9 when the phase transformation was finished.
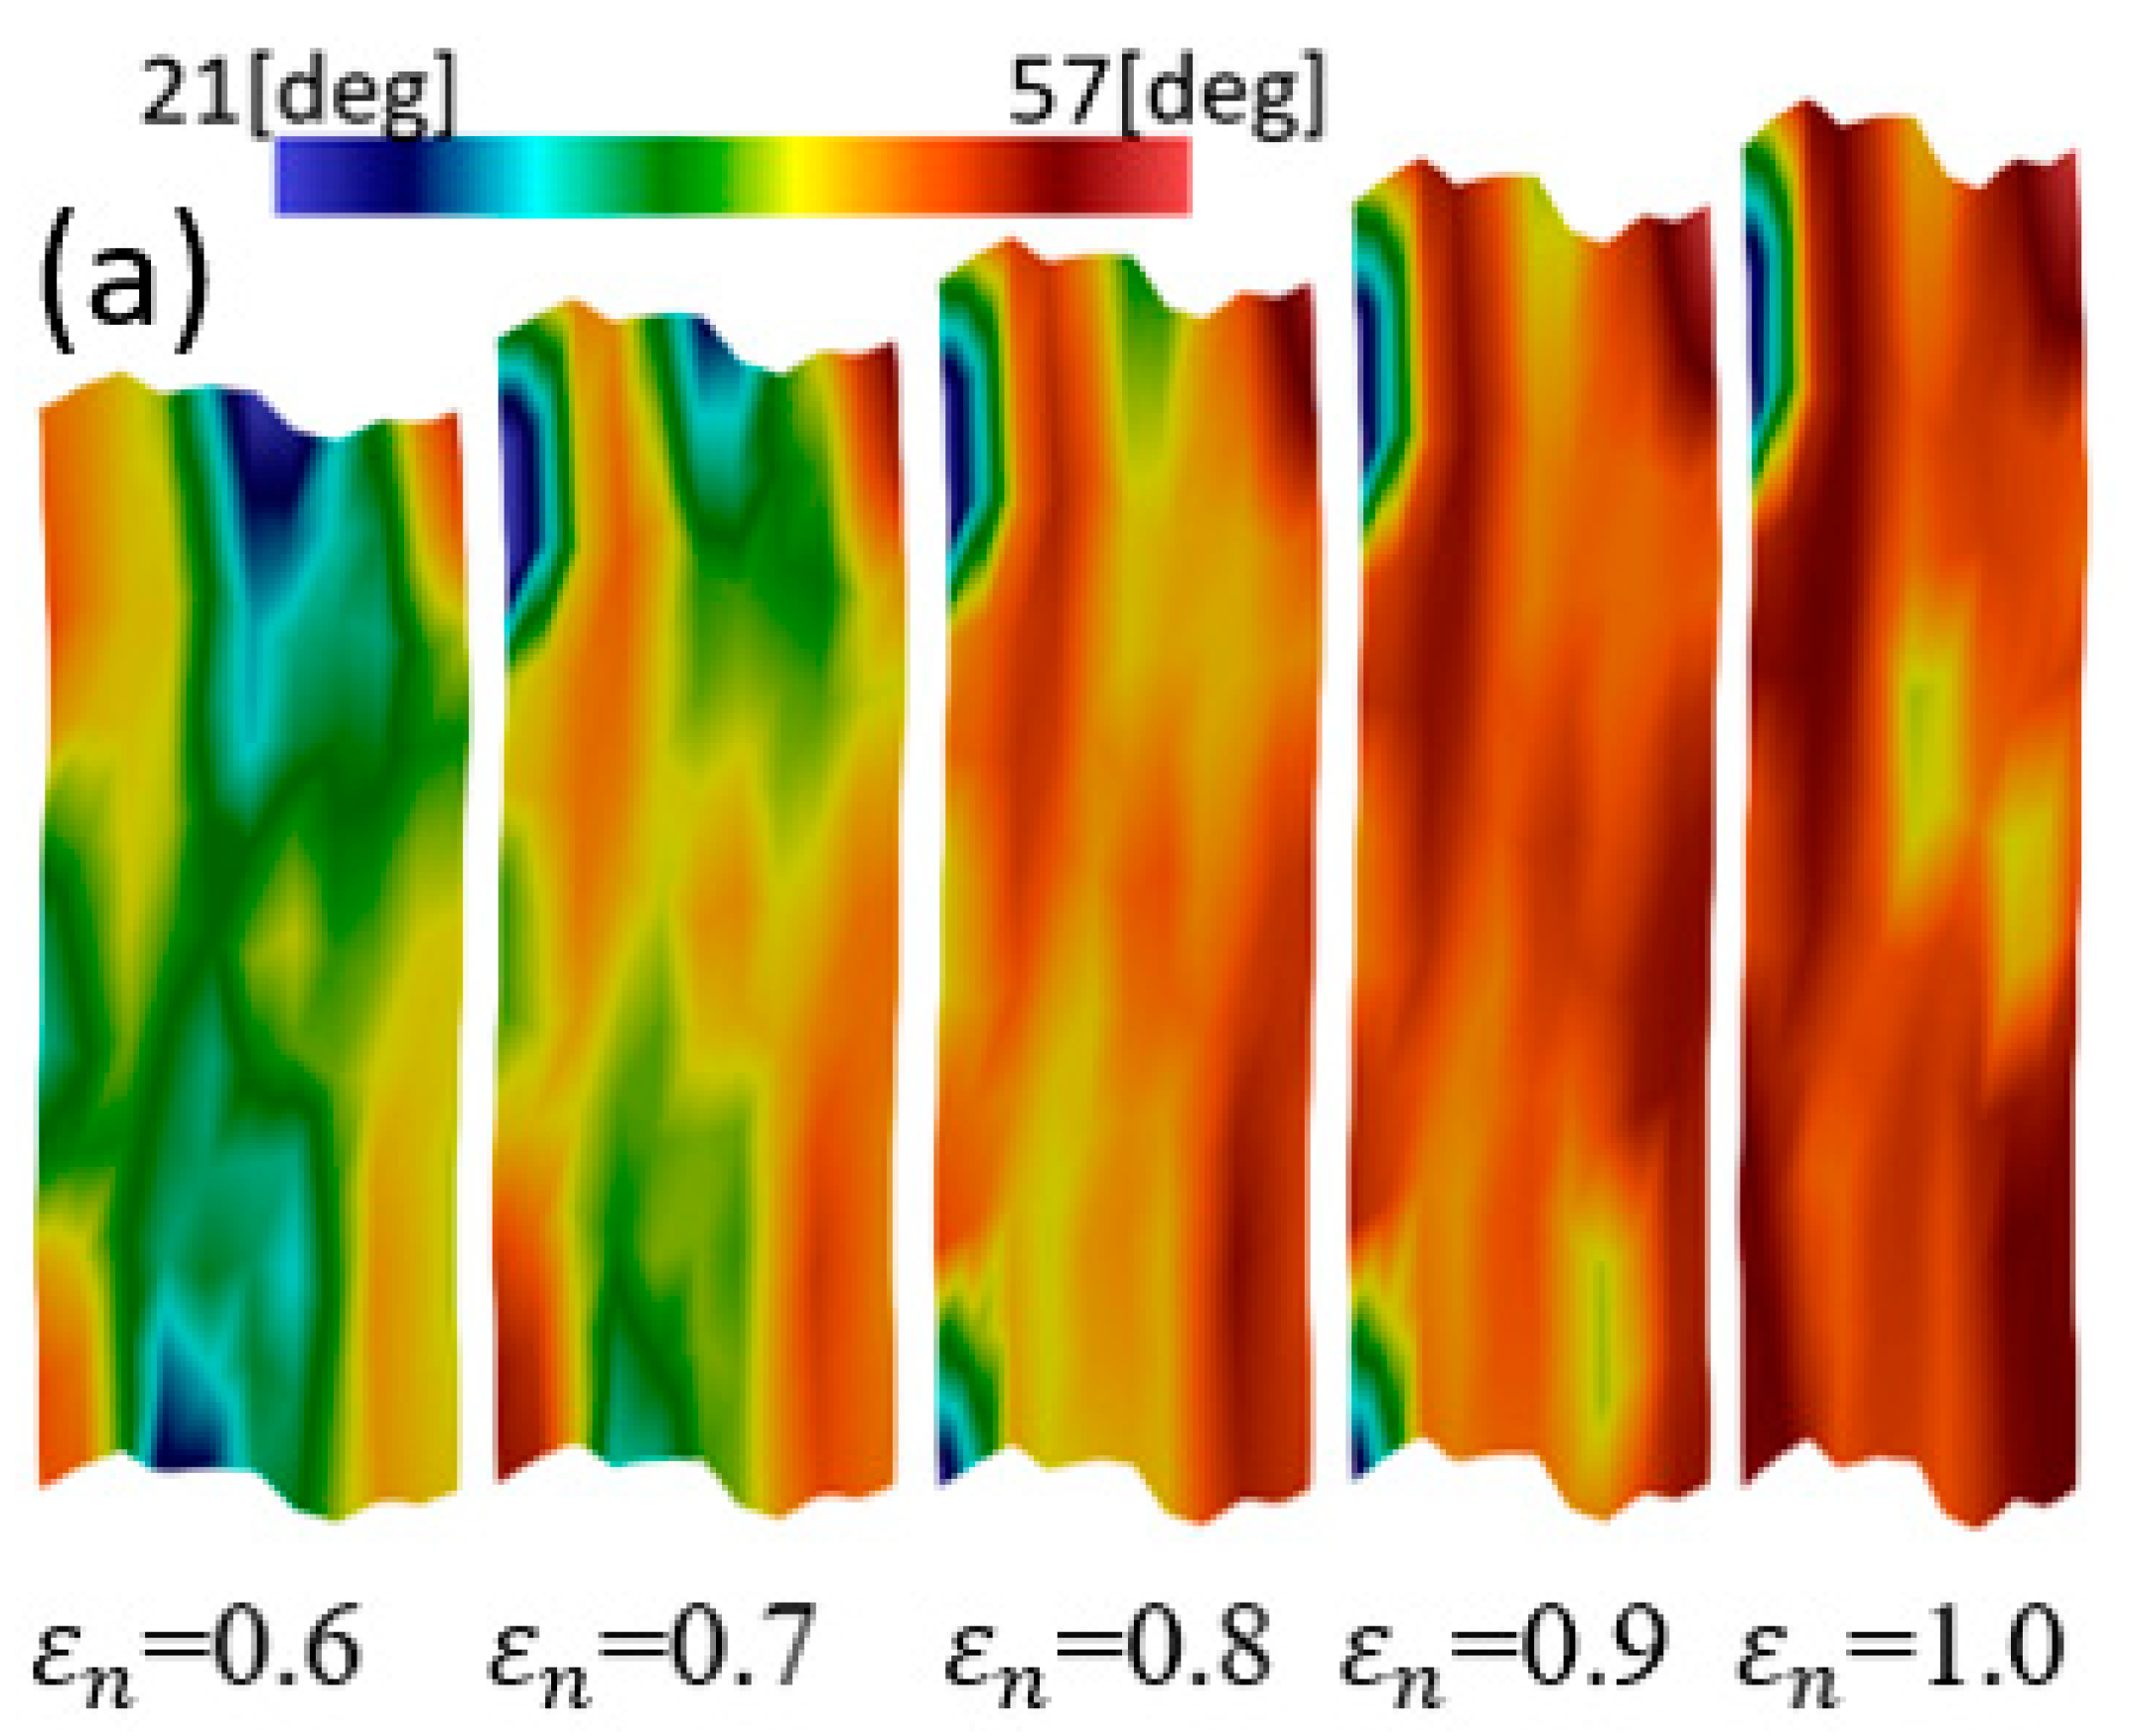
Figure 9 shows the distribution of the rotation angles of the transformation variant of single crystal TRIP steel in different initial crystallographic orientations, such as ε n = 0.6 ~ 1.0 . In this figure, the counter-clockwise direction of the rotation angle is positive. It can be seen that when = 30 ° and = 60 ° , the regions with higher rotation angles were quite heterogeneously. Compared with Figure 7, the regions with higher rotation angles correspond to the transformed regions of the martensitic phases. It is clear that the martensitic phase and the transformation strain had a significant effect on the distribution of the rotation angle of the transformation variant. In all cases of crystal orientations, the values of rotation angles were increased with the promotion of deformation. In addition, the ranges and the values of the rotation angles of the transformation variant were decreased with the increasing of the initial crystal orientations. Although the homogeneous distribution could be obtained when = 90 ° , the variation of the rotation angles appeared due to the formation of different variants.

4.3. Polycrystal TRIP Steel

Polycrystal materials are composed of many crystallites that vary in size and orientation. In this section, a numerical analysis of polycrystal TRIP steel is presented. Figure 10 presents (a) the nominal stress versus nominal strain and (b) the martensitic volume fraction and nominal strain of 4 and 14-grain polycrystal models with the initial crystal orientations are assigned randomly from 0 ° to 90 ° for each grain.
In Figure 10, it can be seen that the nominal stress of the 14-grain model, at ε n = 0 ~ 0.75 , was higher than that in the case of the 4-grain model. In addition, the martensitic volume fraction and the level of saturation were higher for the 14-grain model. Theoretically, with the same sized cells, the 14-grain unit cell could provide finer grains compared with the 4-grain unit cell. However, there was no consideration of the effect of grain size in this model. The differences shown in Figure 10 might be due to two reasons. At first, the strong effect of initial crystal orientation on each grain induced unpredictable behavior. Secondly, due to the slip mechanism, which was activated differently due to the variation of initial crystal orientations of each grain, the mismatching of the slip shear among the grains in the case of 14-grain model was greater than in the case of the 4-grain model. The increase in mismatching behavior made the slip more difficult, and then made the materials stronger. Consequently, the different martensitic variants formed caused different microstructures and macroscopic behaviors.
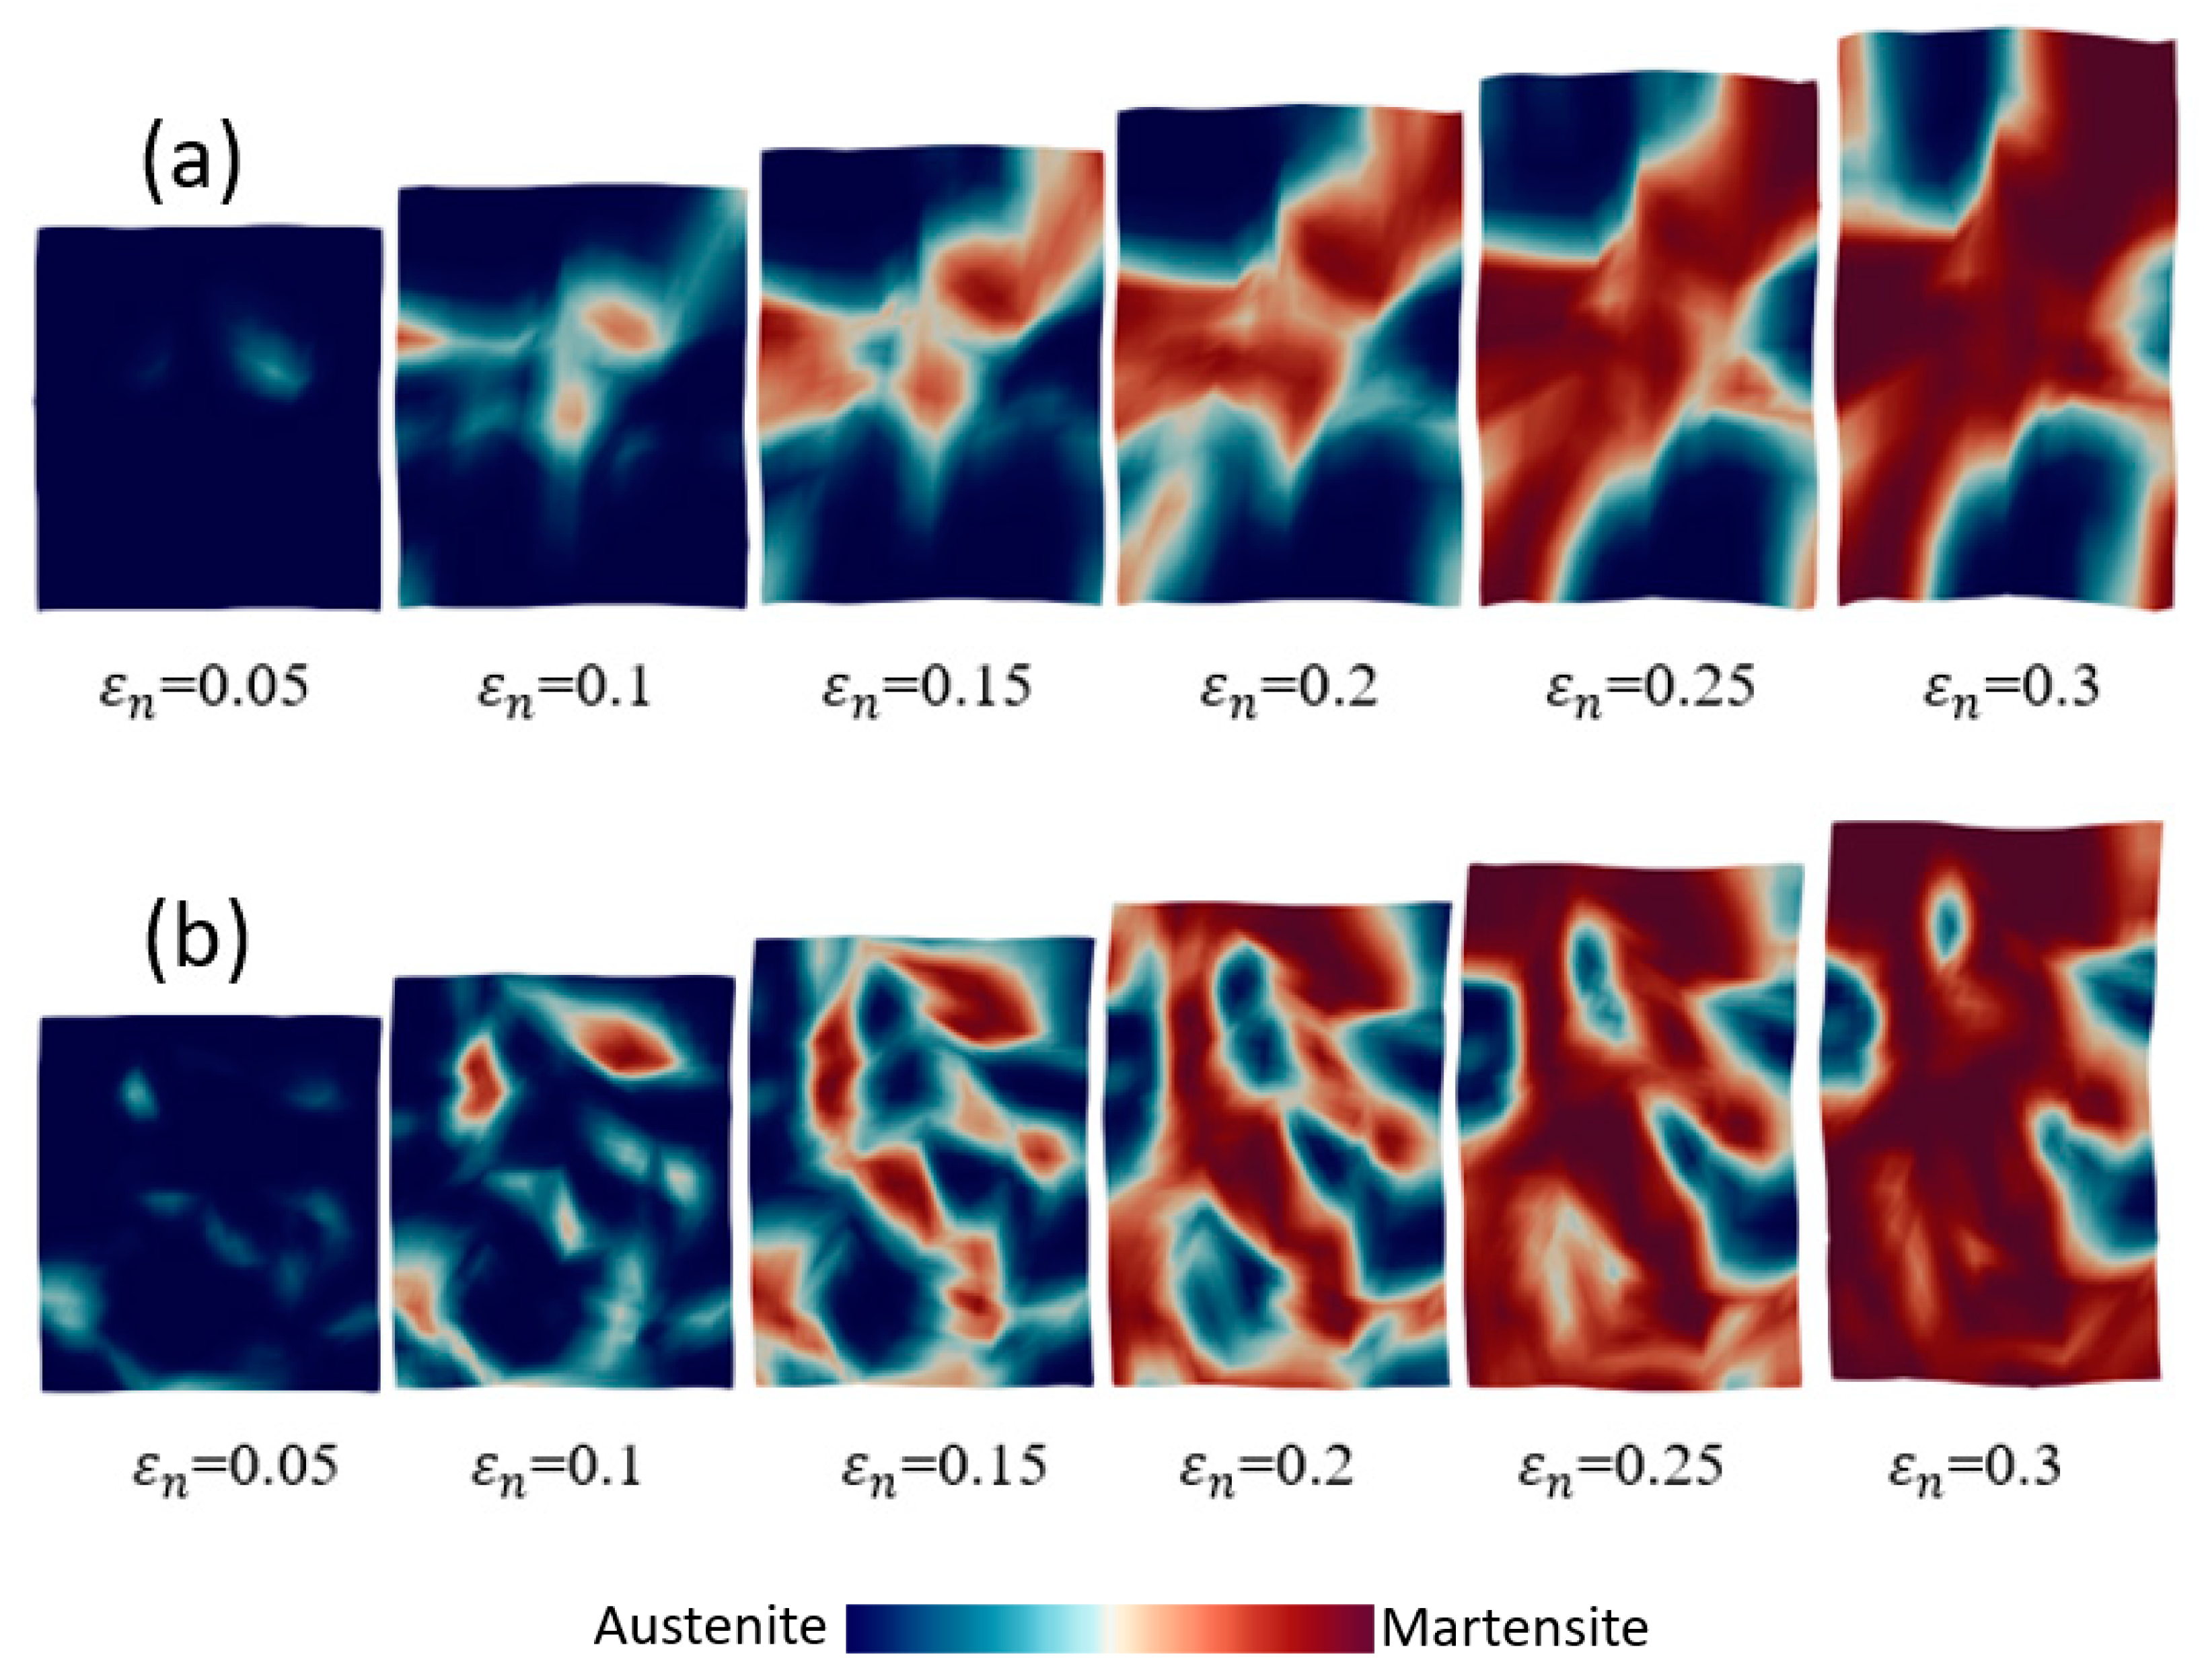
Figure 11 presents the distribution of the martensitic phase of the 4- and 14-grain models as ε n = 0.05 ~ 0.3 when the initial crystal orientation was given randomly for each grain. Due to the strong effect of the initial crystal orientation on each grain, the distributions of martensitic phase in both the 4- and 14-grain polycrystals were extremely heterogeneous. Due to the infinite medium being considered, and the size of the polycrystal cells being very small, the numbers of grains significantly influenced the mechanical properties and the behaviors of SIMT.
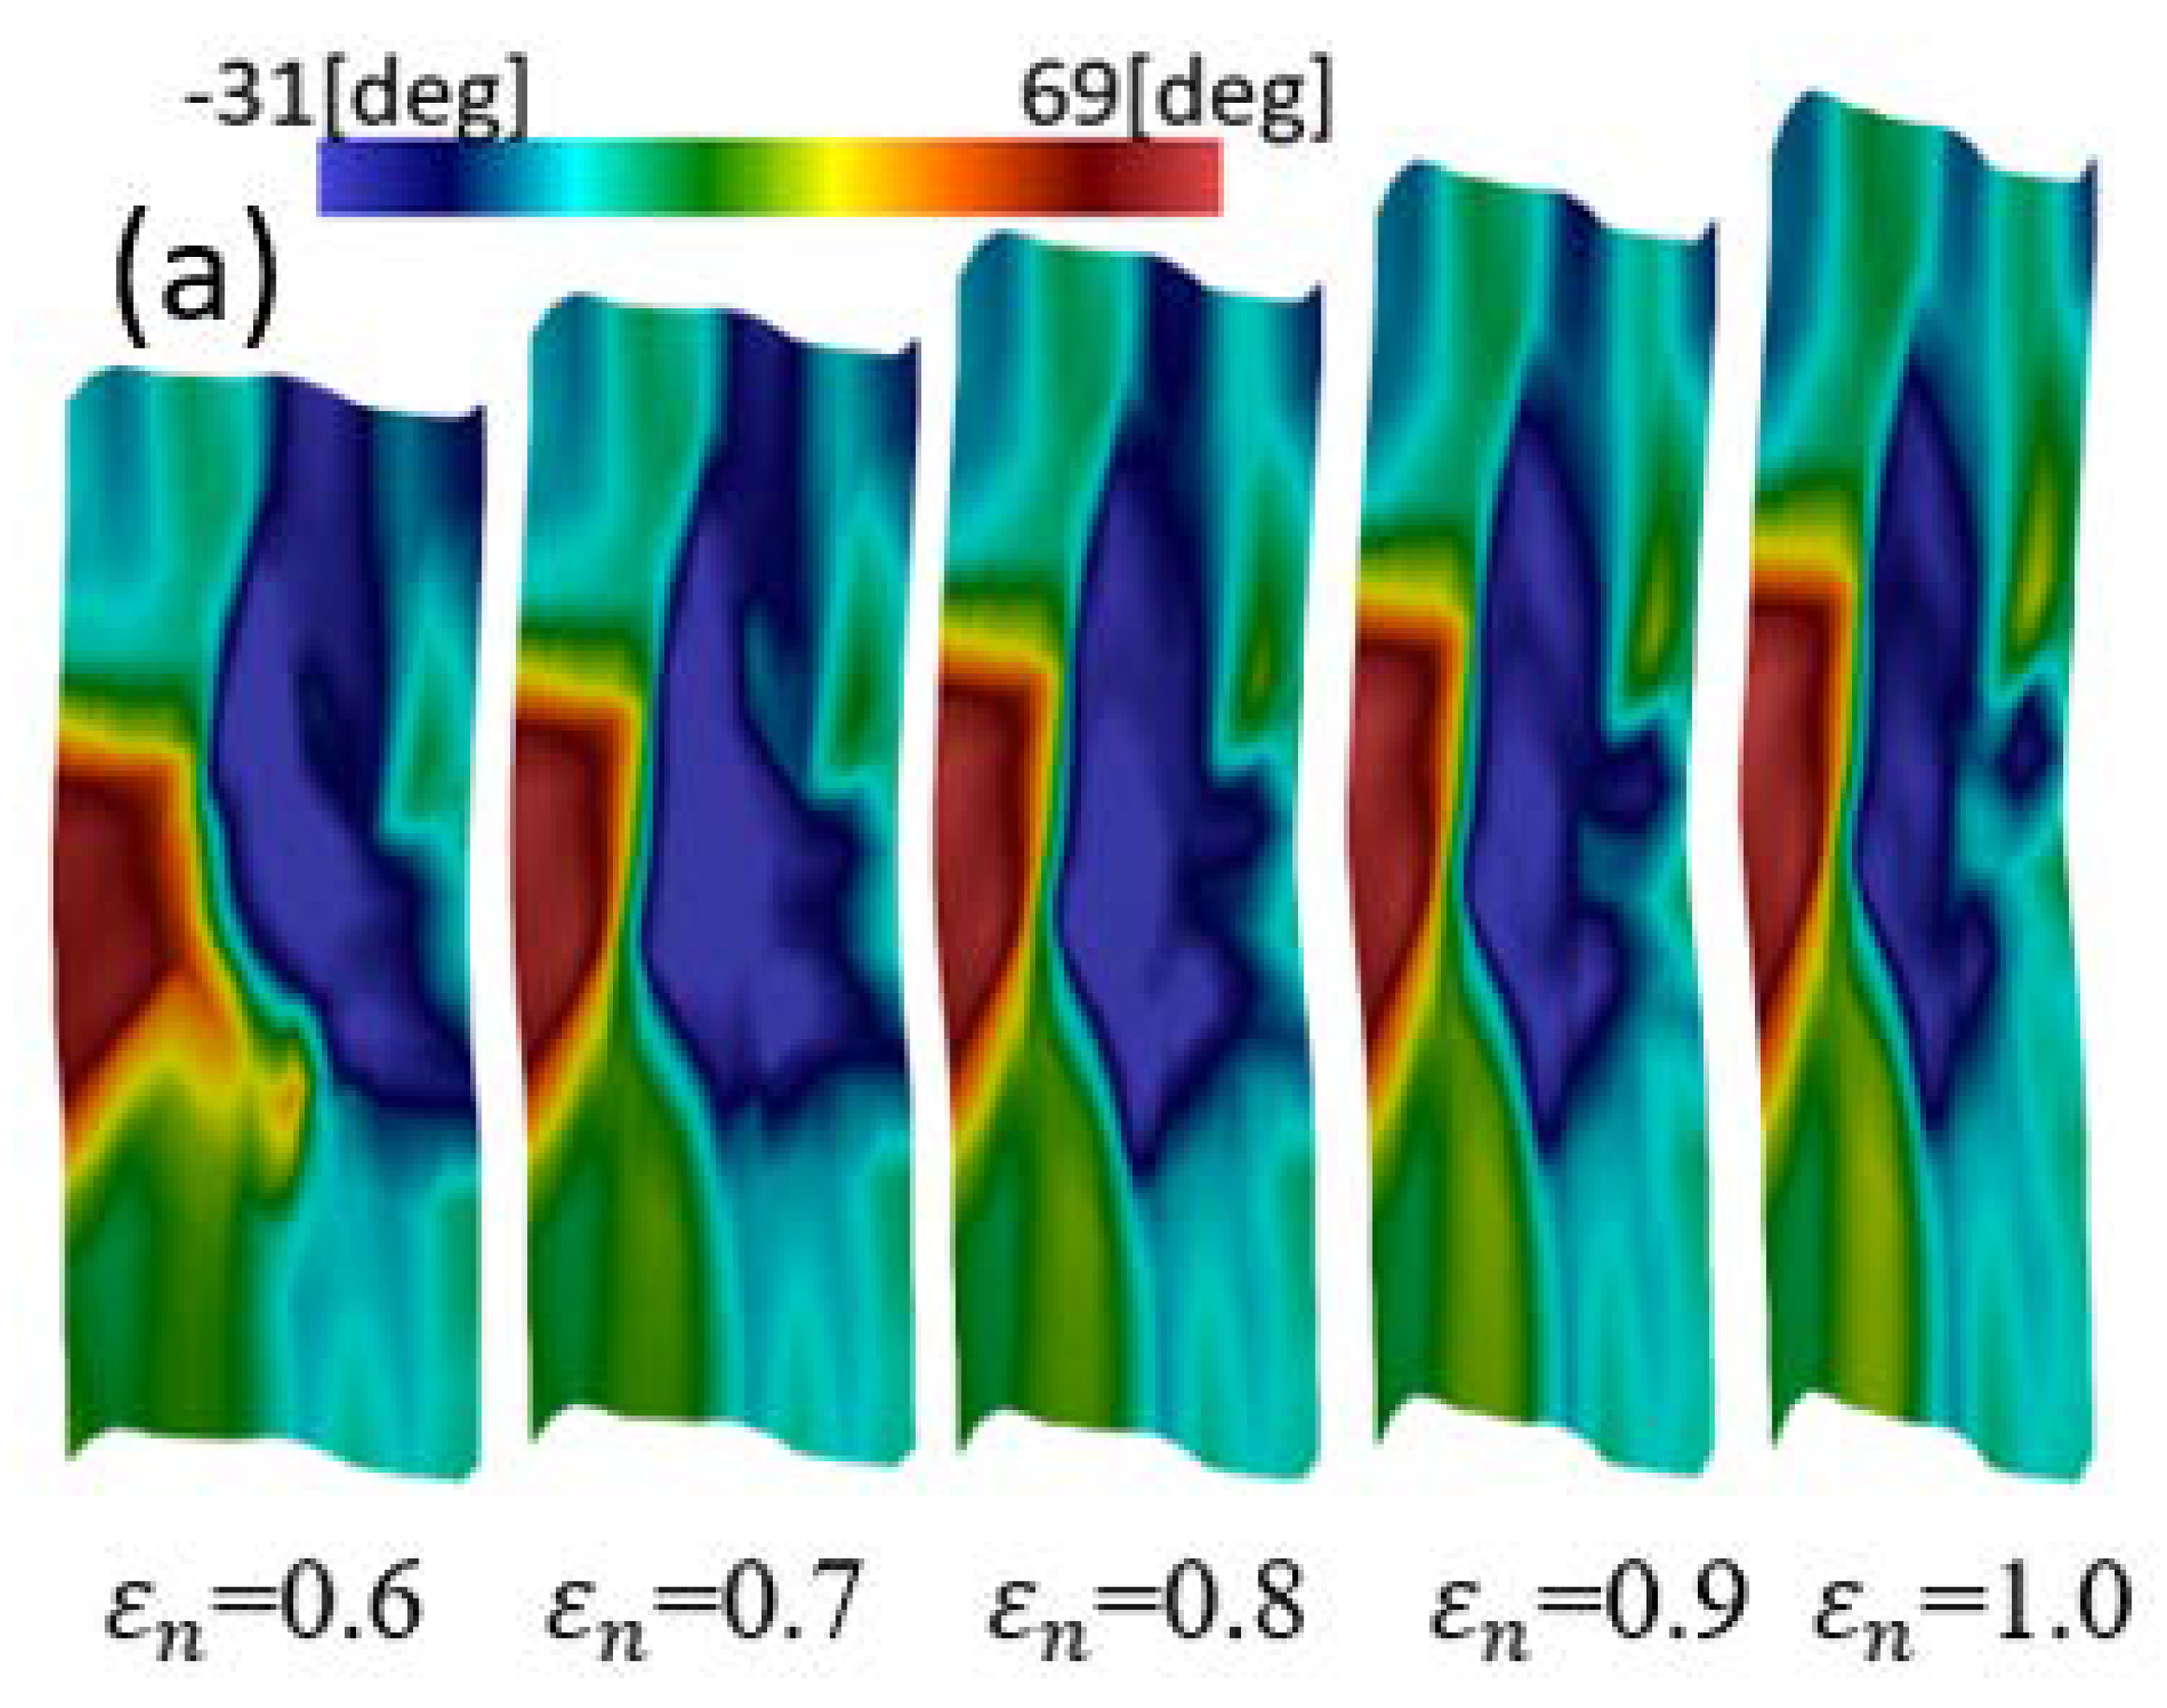
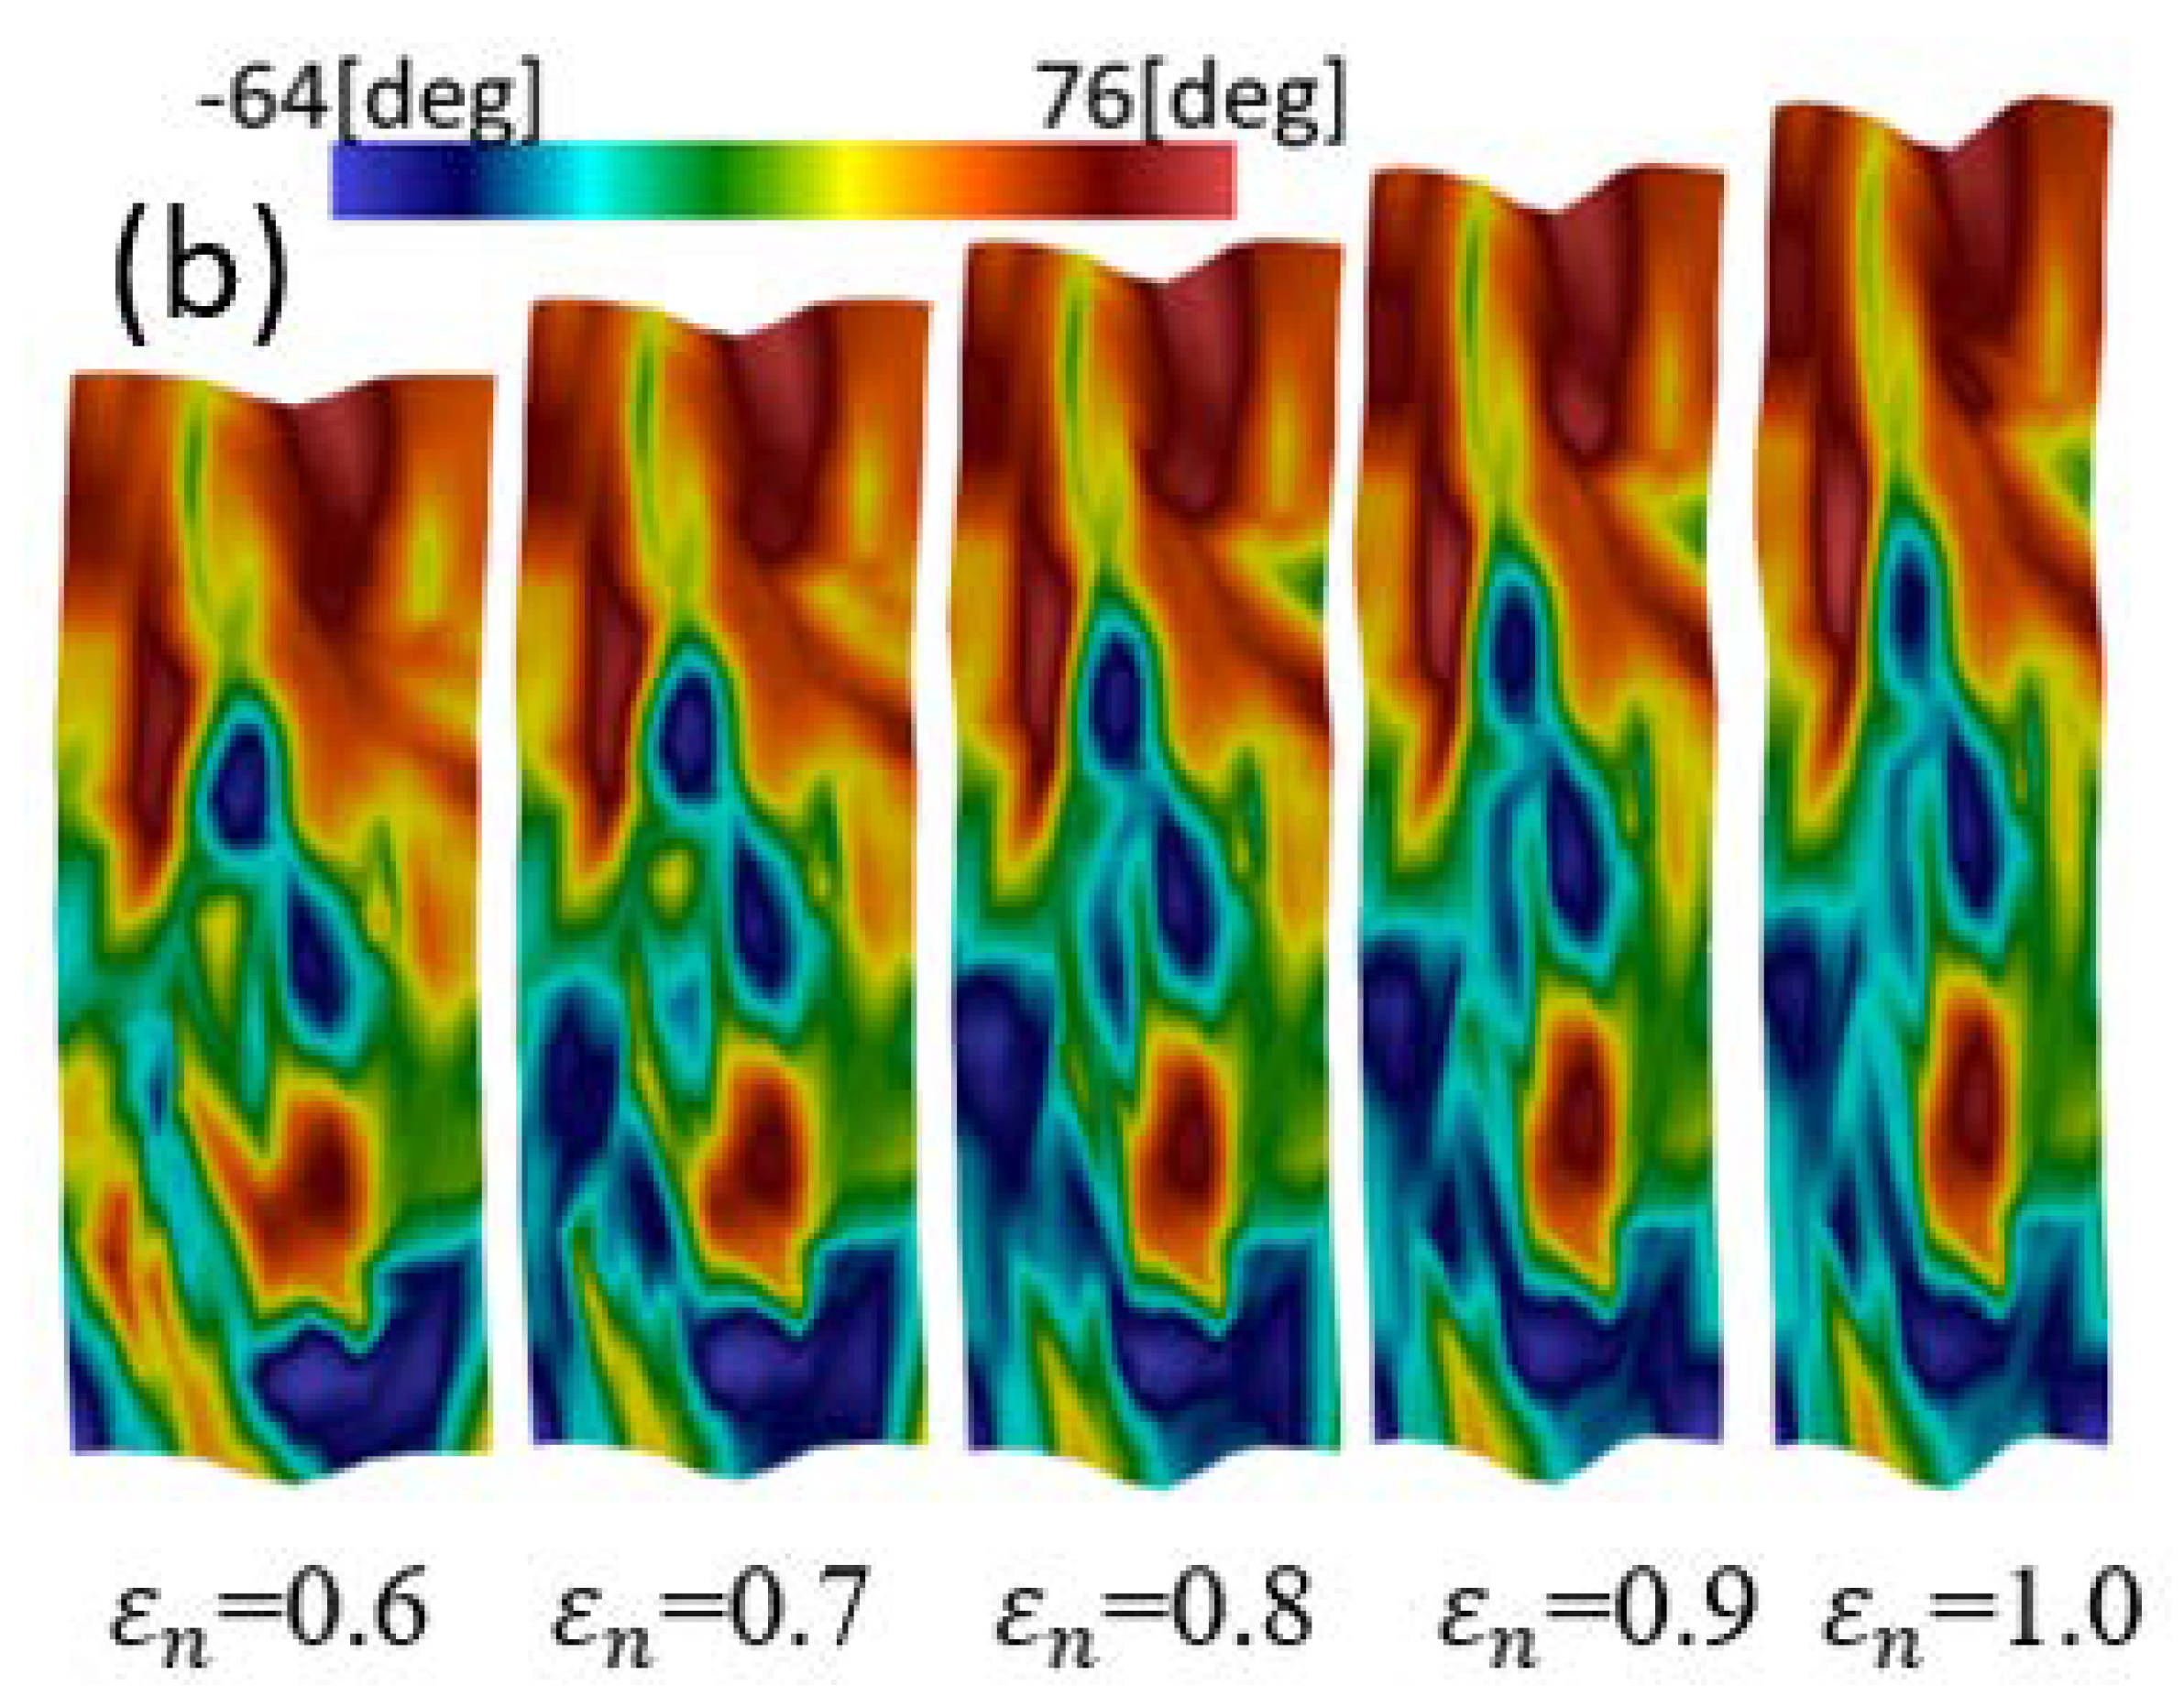
Figure 12 illustrates the distribution of the rotation angle of the transformation variant of polycrystal TRIP steel for different numbers of grains when the initial crystallographic orientations were given randomly as ε n = 0.6 ~ 1.0 . In this figure, the counter-clockwise direction indicates the positive side. As predicted, the regions with higher rotation angles were very different between the two cases. The martensitic phase and the transformation strain had a significant effect on the distribution of the rotation angle of the transformed variant. Consequently, the values of the rotation angles were increased with the promotion of distortion of the grains. In the case of the 14-grain model, the ranges of high rotation angles of the transformation variant were greater than those in the 4-grain model, and the highest rotation angle of the transformation variant in the 14-grain model was also higher than that of the 4-grain model. The clear difference between the distributions of rotation angles of the transformation variant in the two cases might have been caused by the misorientation among the grains. The mismatching effect among the grains in the case of the 14-grain model was much greater compared to that of the 4-grain model.
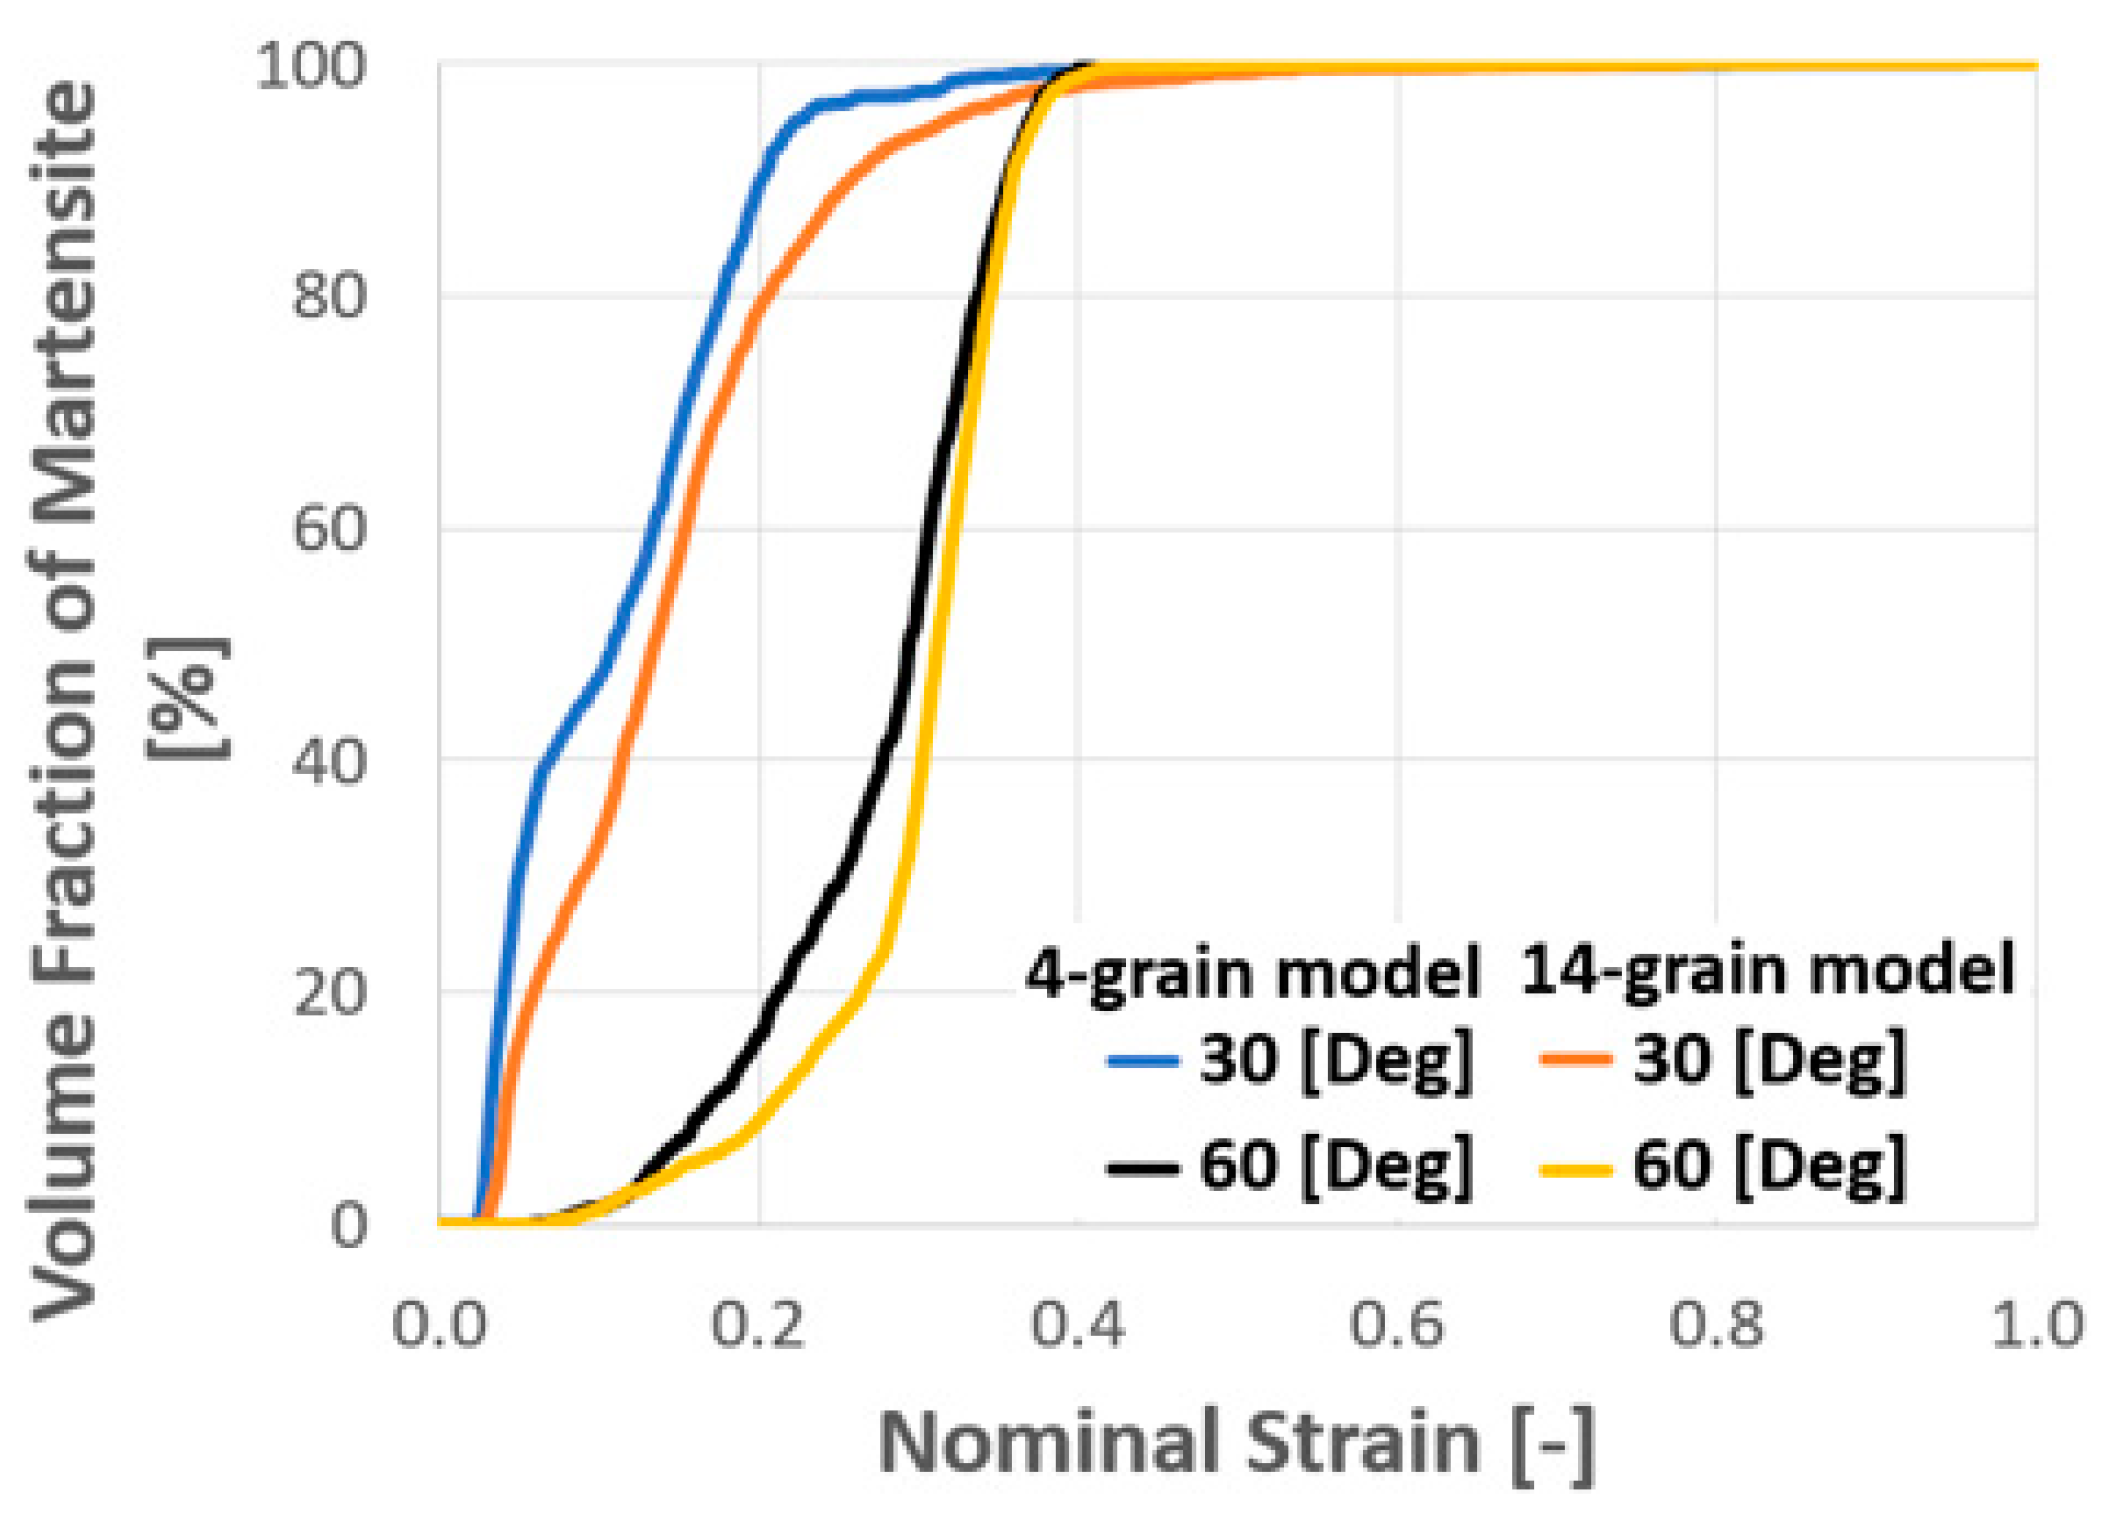
The initial crystal orientation in each grain significantly affected the formation of the shear band structure. In nature, polycrystal materials tend to form texture types due to the preferable crystallographic orientations. A polycrystalline with initial orientations that which are fully random is said to have no distinct texture. On the contrary, if the crystallographic orientations are not given randomly, but have a preferable orientation, then the polycrystal material can possess a weak, moderate or strong texture, and shows the corresponding mechanical properties. Next, an analysis on different textures formed by different preferred crystallographic orientations is presented for both polycrystal models. Figure 13 shows the comparisons of the volume fraction of martensite versus nominal strain in the 4- and 14-grain models in which the preferred crystal orientation were given as 30 ° and 60 ° .
From the macroscopic point of view, it was predictable that the results of both models coincided since the perfect textures were similar. However, from the microstructural point of view, there were clear differences in the evolution of the martensitic phase and the strain level, with saturation between the 4- and 14-grain models, as shown in Figure 13. In addition, compared with Figure 10b, the saturation process in the martensitic volume fraction of polycrystal materials with a preferred orientation is faster than the saturation process of polycrystalline as the crystal orientations are given randomly. The mismatch in orientations between the grains is one possible reason that an effect was induced that could suppress the phase transformation process.
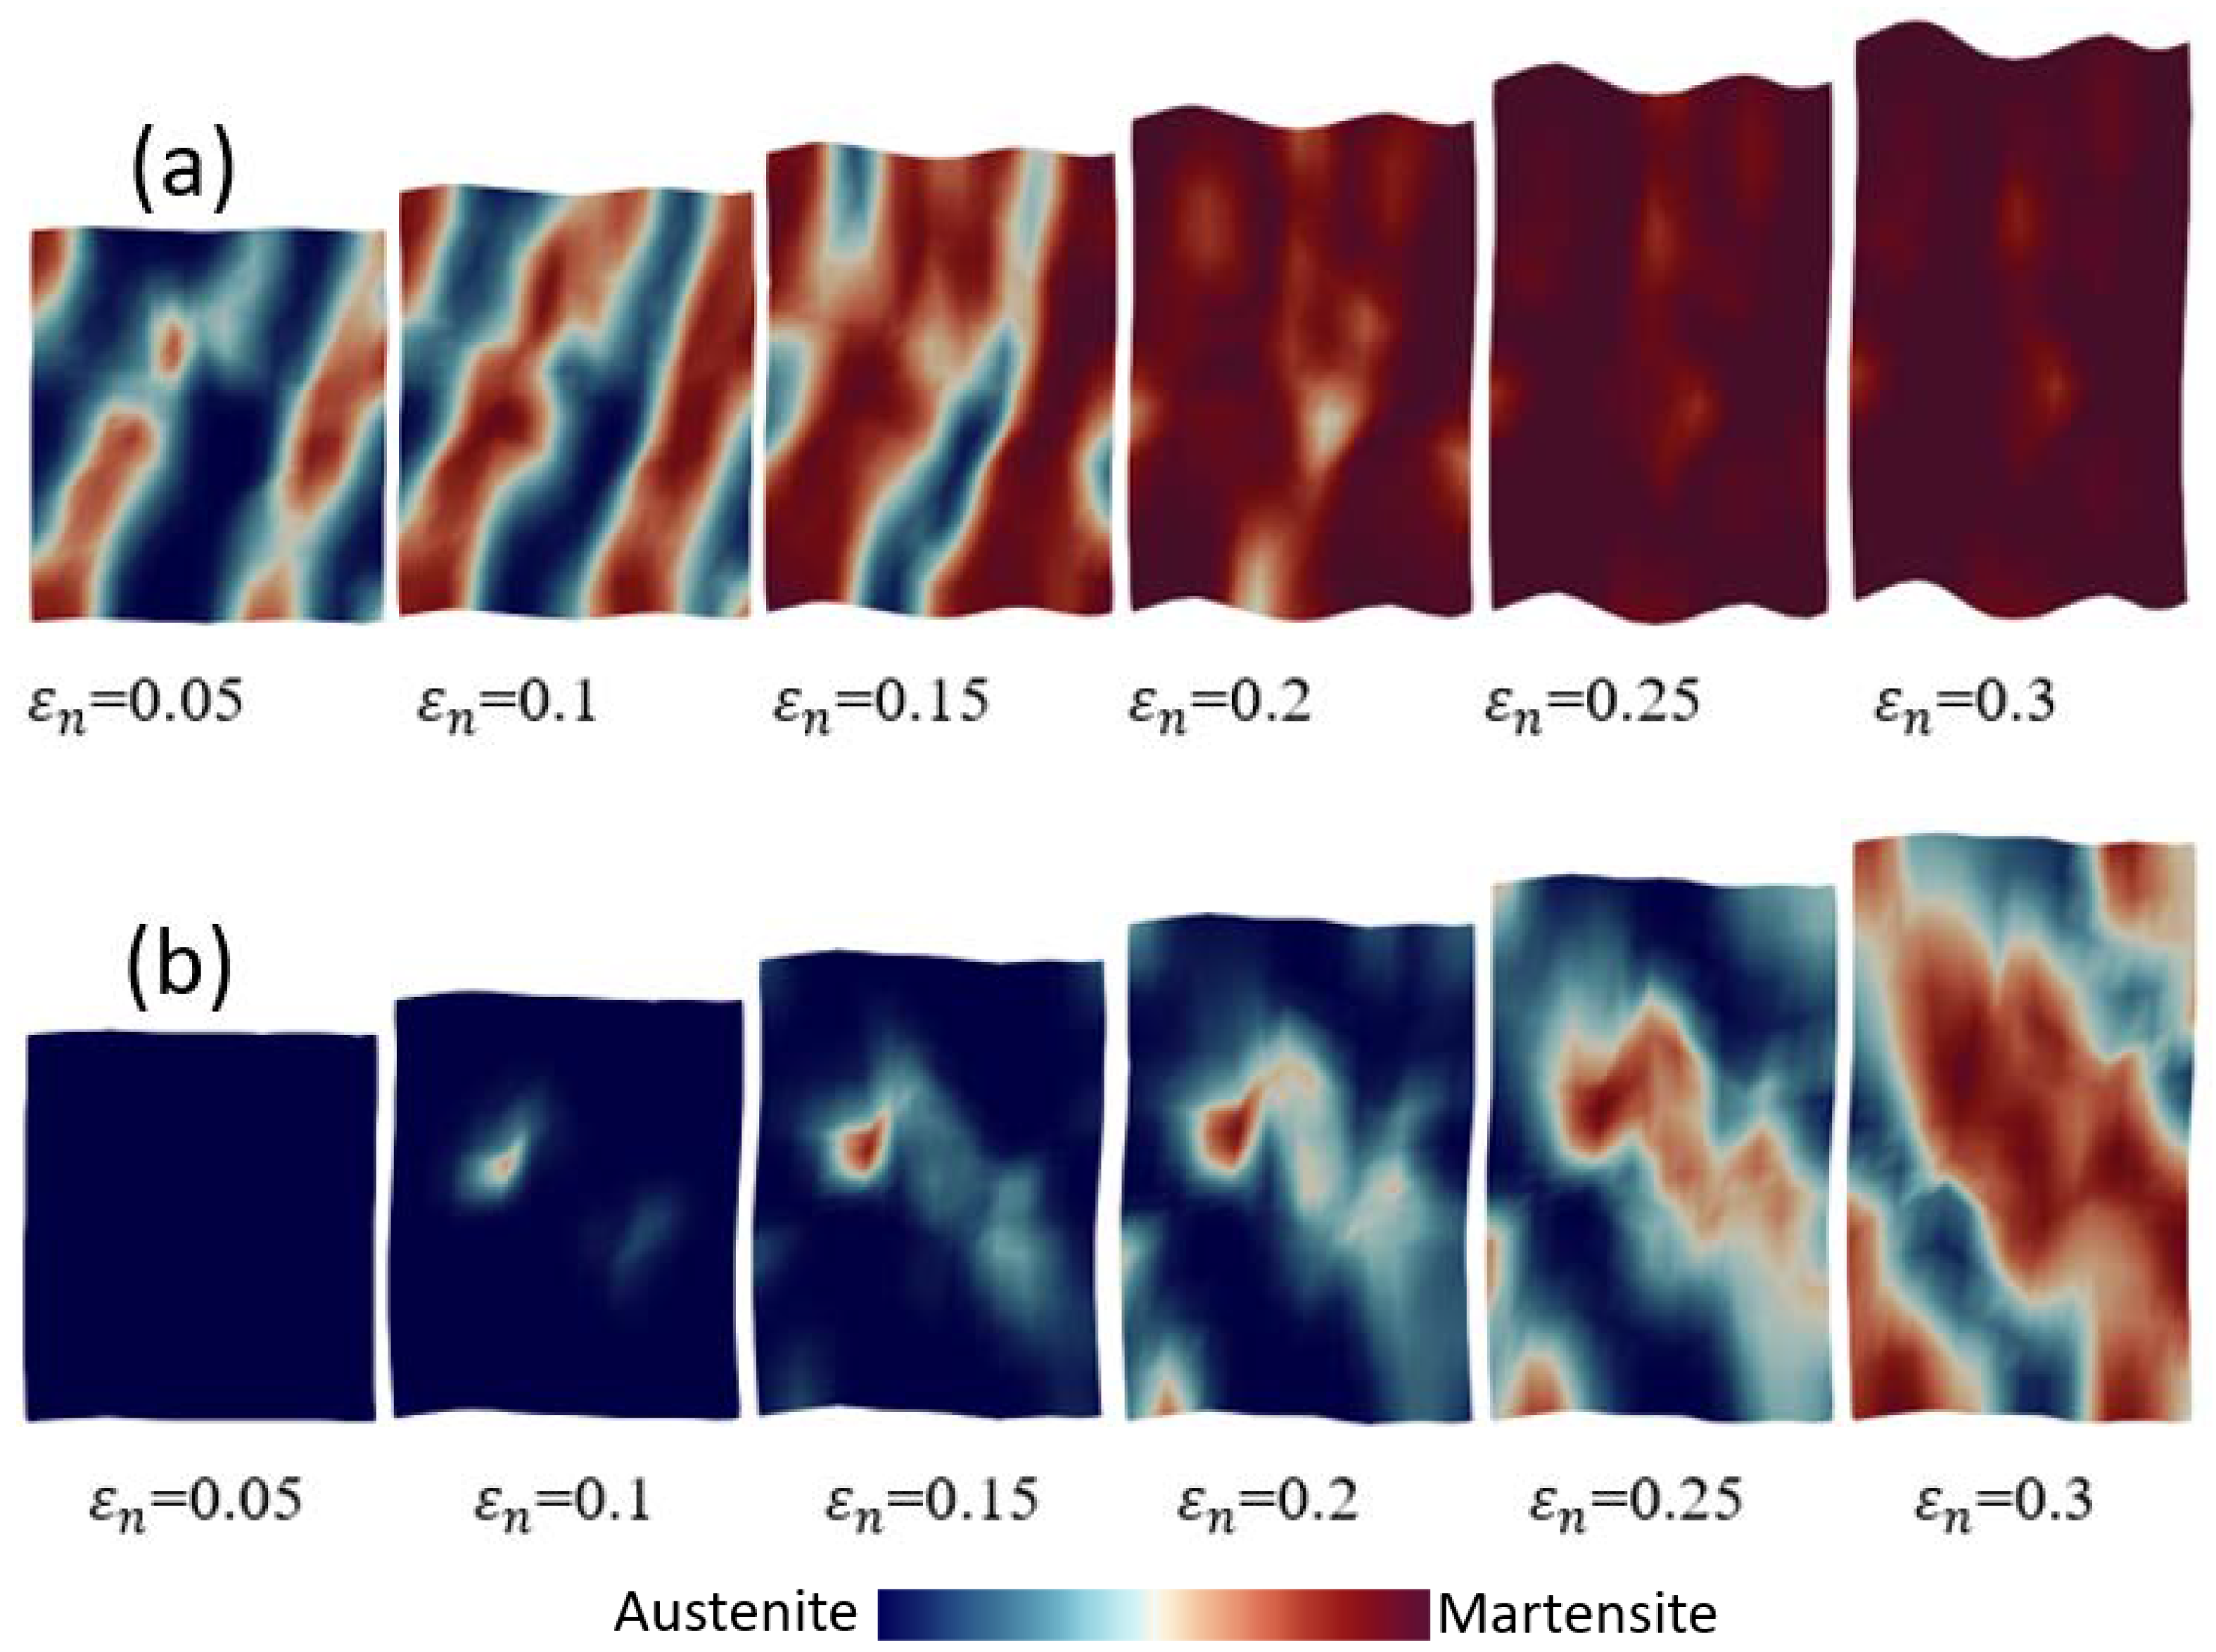
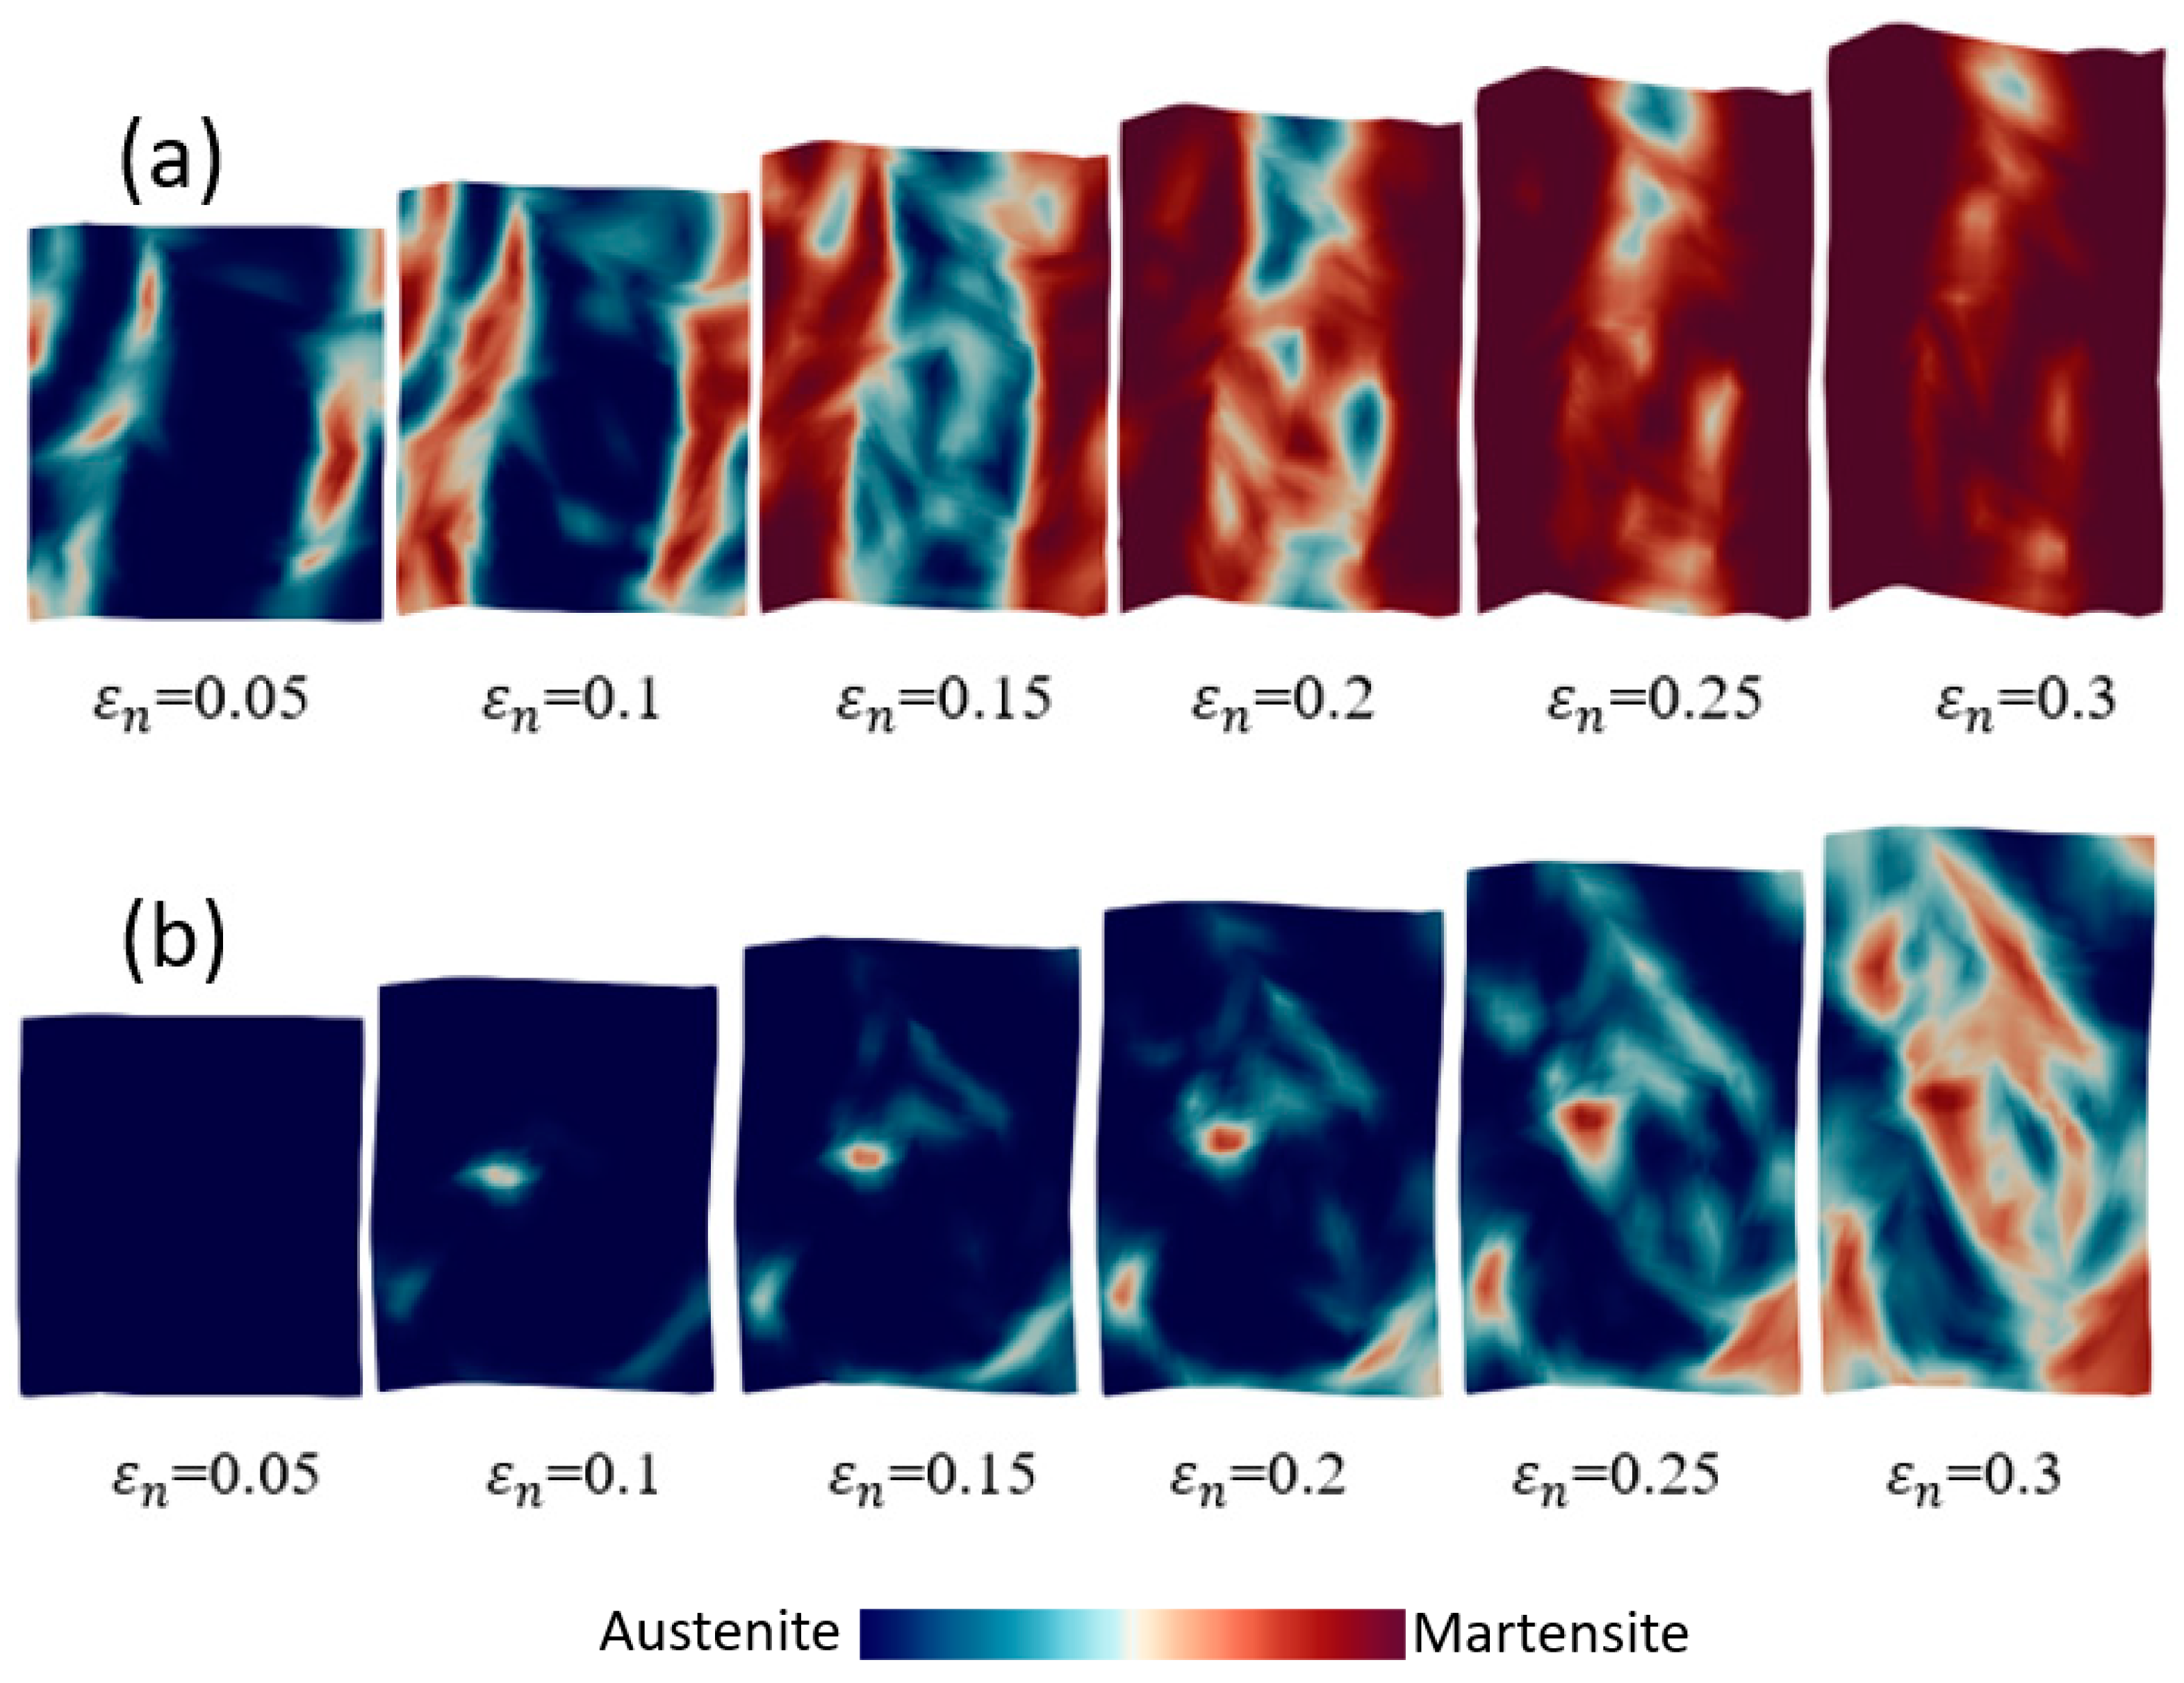
Figure 14 and Figure 15 represent the distribution of the martensitic phase of 4- and 14- grain polycrystal TRIP steel with different preferred orientations from ε n = 0.1 ~ 0.35 . In these figures, the regions with blue and red colors denote the austenitic and martensitic phases, respectively. For both preferred orientations, the formed martensitic phase could be observed as shear band structures. Of course, the direction, width, and size of the bands were highly different in each case. In both the 4- and 14-grain models, while the shear band structures could be seen at a low strain level ( ε n < 2 ) at a preferred orientation of 30 ° , the model with a preferred orientation of 60 ° provided the shear band structures at a large strain level ( ε n > 2 ). Therefore, not only the numbers of grains, but also the preferred orientations strongly affect the formation of shear band structures in polycrystalline TRIP steel.
In practice, the morphology of the martensitic phase is varied due to the contents of carbon in steels. The low carbon steel, which varied in the range 0 ~ 0.6% carbon, provided the lath martensite, while the high carbon steel provided the plate martensite as the content of carbon was greater than 1%. From the distribution of martensitic phase in different numbers of grains and the initial preferred crystal orientations shown in Figure 14 and Figure 15, it can be seen that the appearances of the shear band structures contribute significantly to the lath martensitic morphologies. With the promotion of plastic deformation, the martensitic laths might have assembled to form the block. The Kurdjumov—Sachs orientation relationship maintained during MT can cause a hierarchy of different microstructural units rather than laths or blocks such as packets. Nonetheless, this is quite difficult to distinguish because of the atomic complexity. Hence, laths are much easier to observe than blocks. When = 60 ° , as described above, the formation of martensite was much more difficult. This may be due to a misorientation between the grains, even though the same crystal orientation was considered for all of the grains. Due to the differences in the habit planes of the embryos, it was possible to partition the austenitic phase to form martensite, leading to the formation of a plate martensitic morphology. Therefore, the martensitic morphology related to the shear band formation at a small length scale should be considered further in the near future.

4.4. An Analysis of the Size of the Martensitic Embryo

4.4.1. Single Crystal TRIP Steel

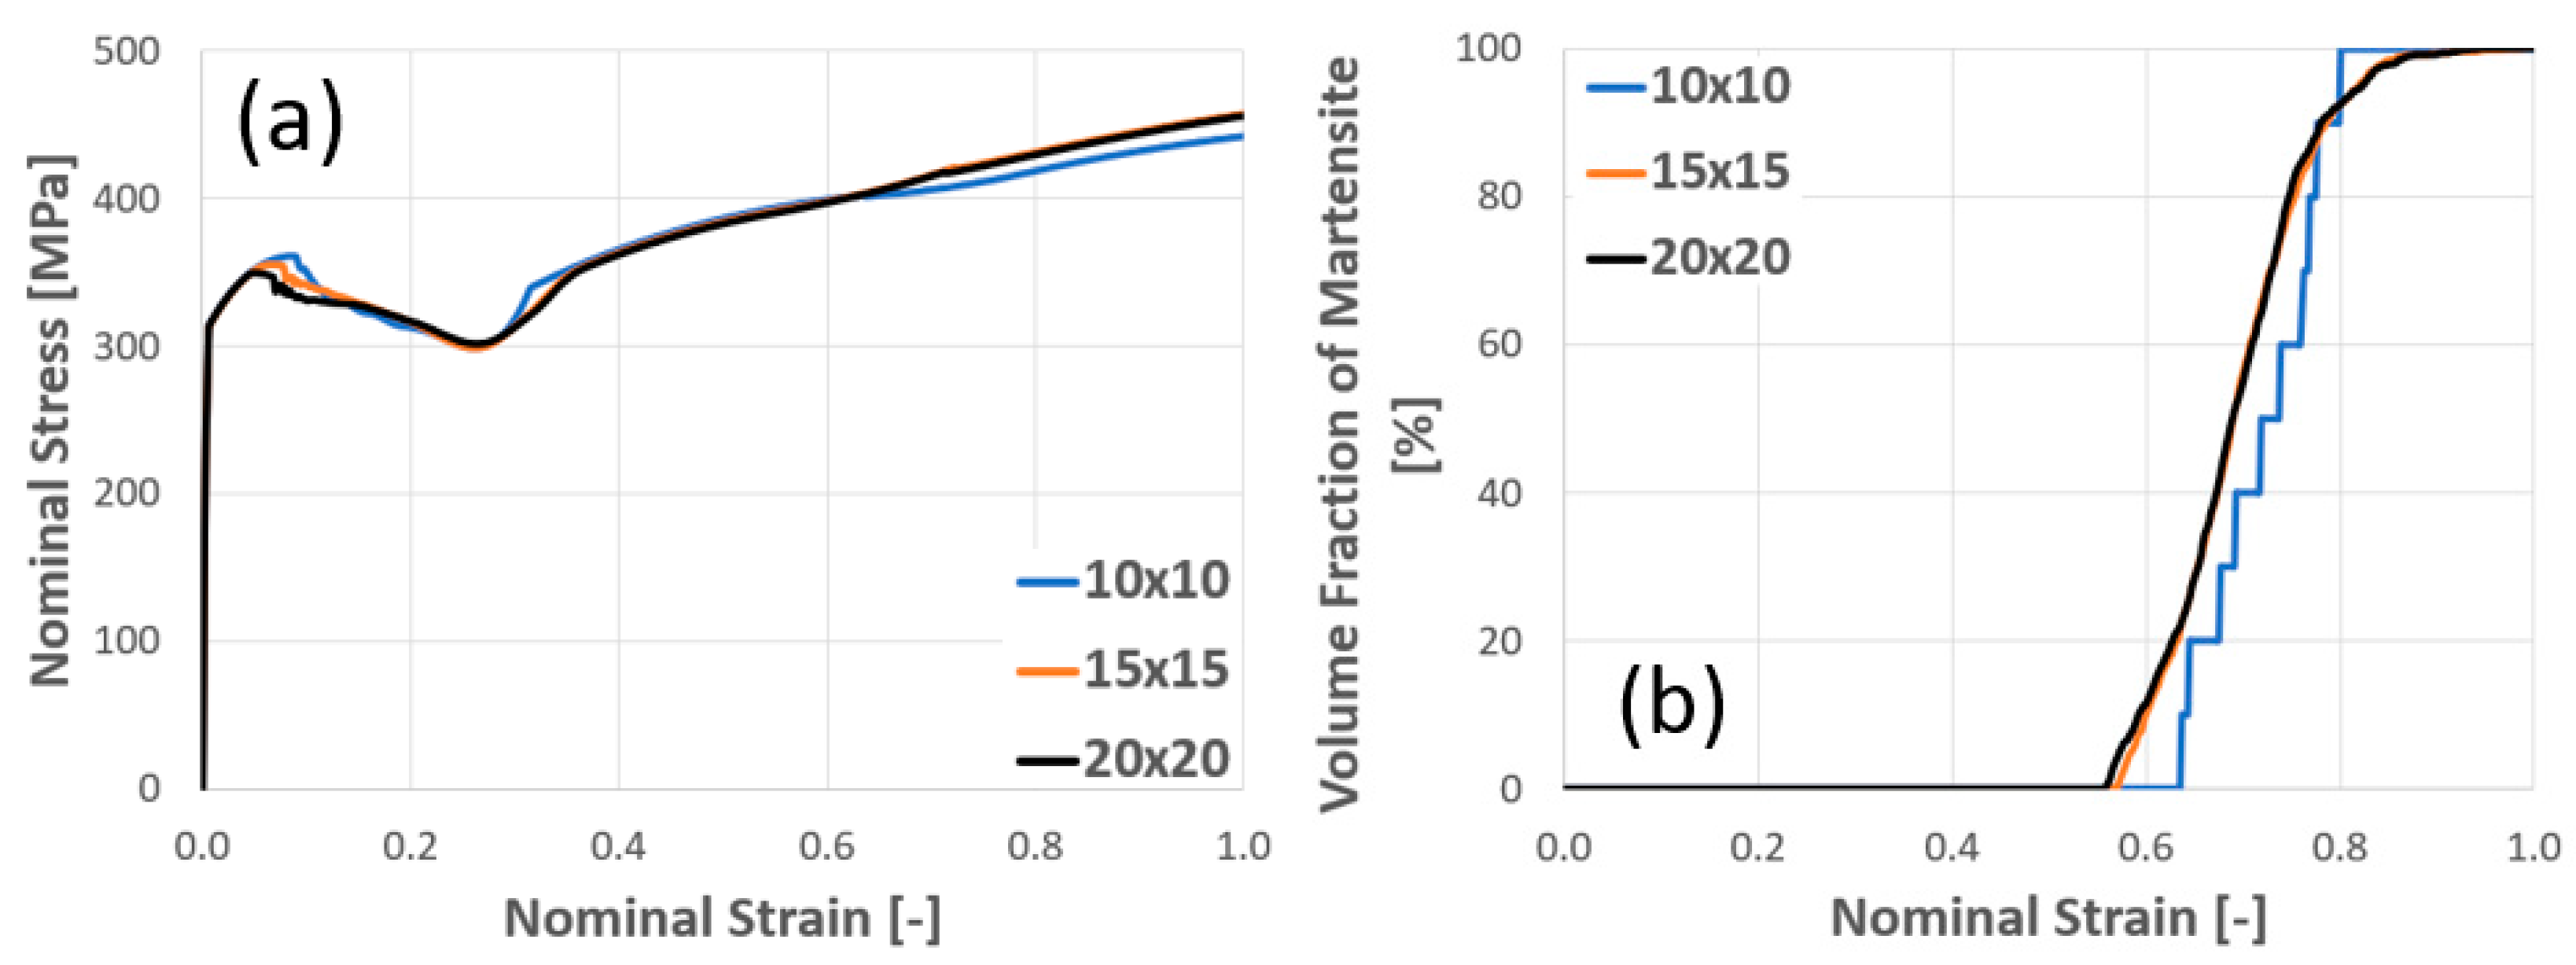
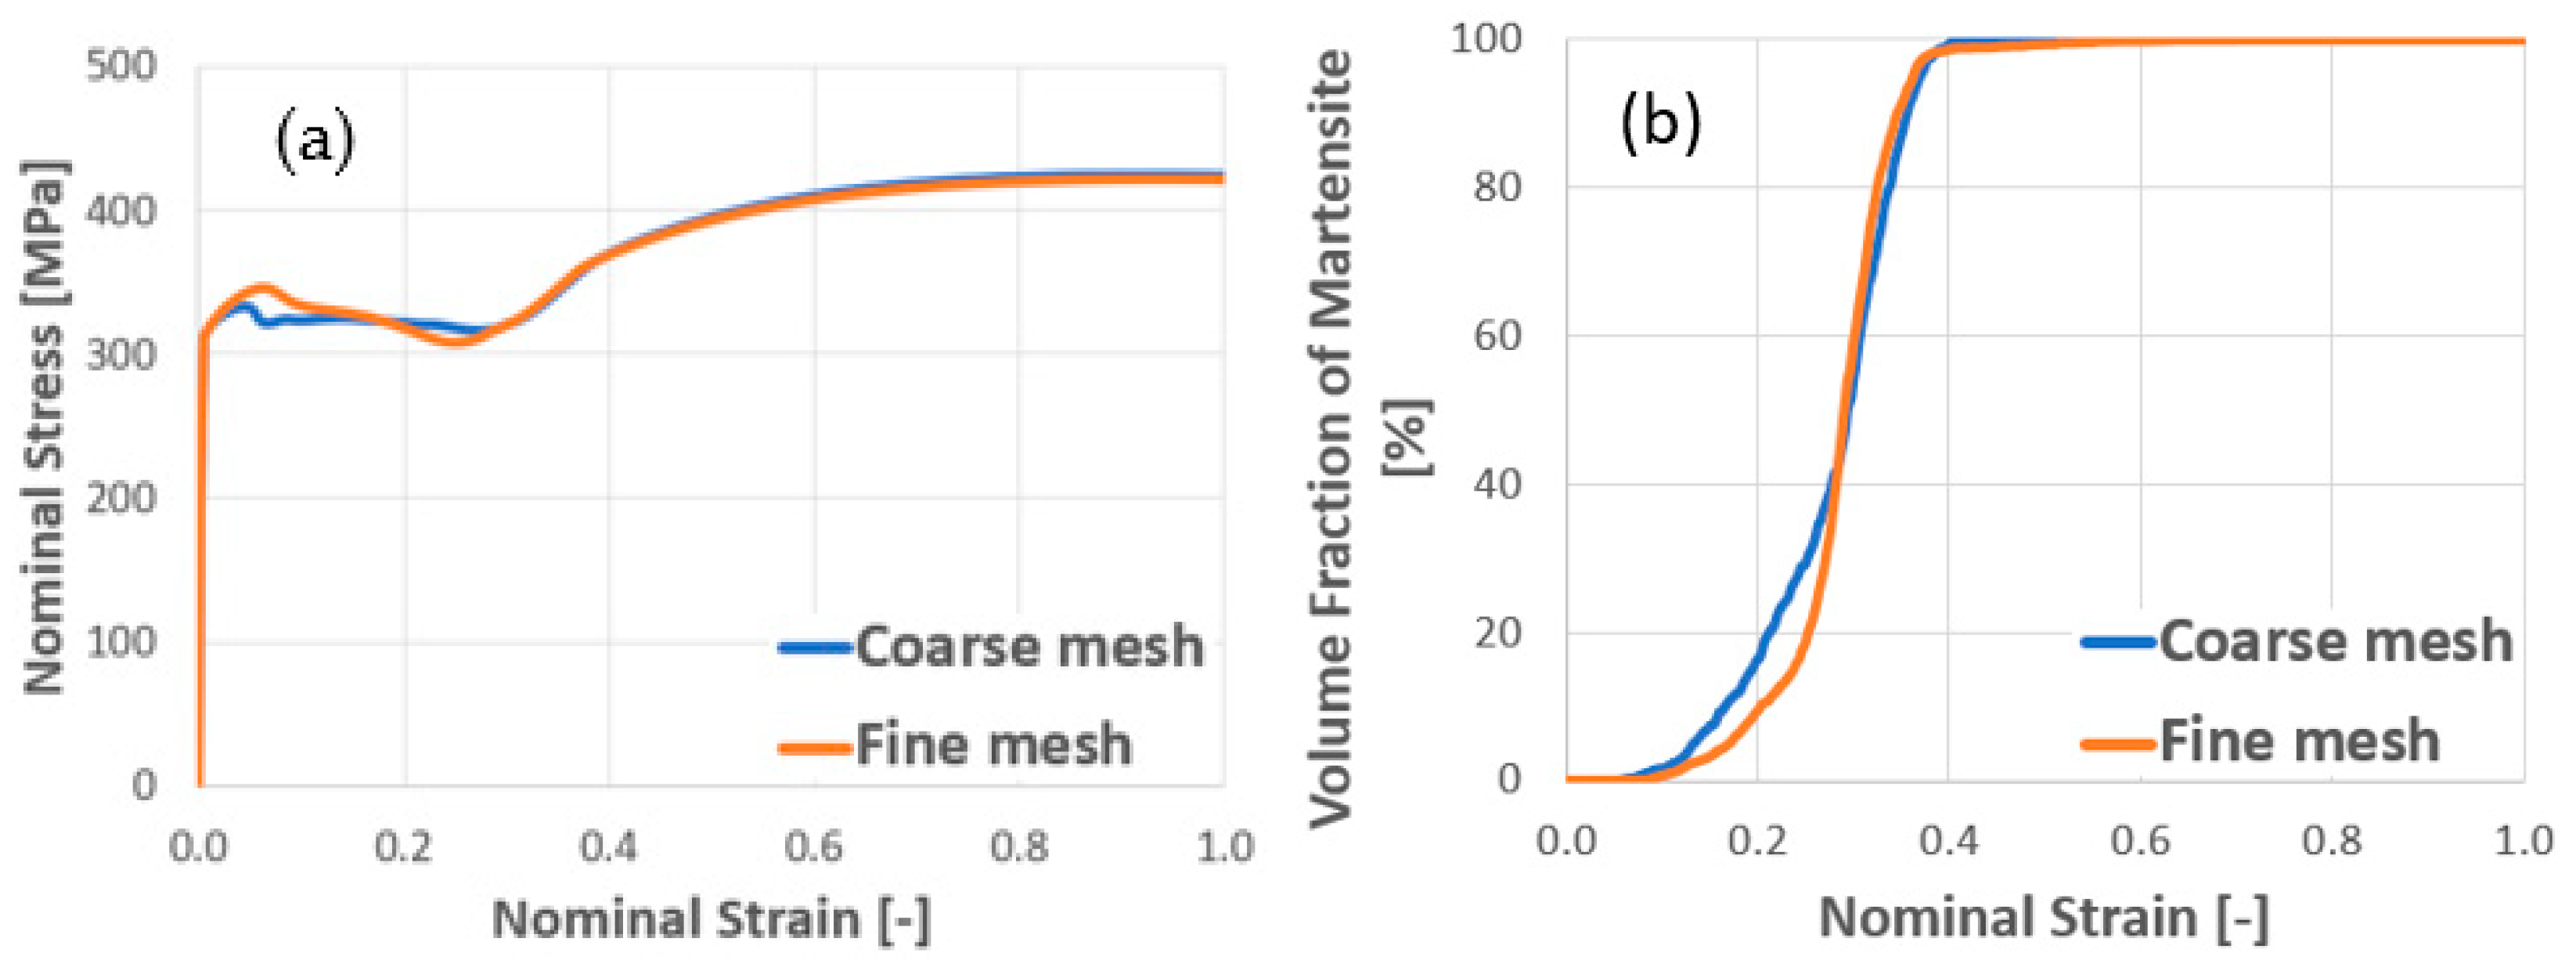
As discussed in previous parts, the initial crystallographic orientation of embryos strongly affects the transformation process. Furthermore, the potential of the embryos to nucleate also depends on their shape and size at the considered scale [47,48]. To clearly understand the effect of the size of martensitic embryo on the SIMT, analyses of the scaling lengths of the cellular automata and the sizes of cells of single crystal steel are presented. Figure 16a describes the nominal stress versus nominal strain, and (b) the volume fraction of martensite versus nominal strain, of single crystal TRIP steel when = 60 ° for three different levels of mesh sizes, in which 10 × 10, 15 × 15 and 20 × 20 indicate the coarse mesh, intermediate and fine mesh, respectively. The large, intermediate, and small embryos are considered to correspond to the sizes of the elements. As shown in Figure 16, although the nominal stresses of the monocrystal TRIP steel at all three levels of mesh were almost the same, the nominal stress in the case of coarse mesh was slightly lower than the corresponding values in other cases. Additionally, the evolution of the martensitic volume fraction appeared to occur in a stepwise manner in the case of coarse mesh, and the saturation level was also slightly slower than those of intermediate and fine meshes. It is possible that the larger embryo introduced by the coarse element was harder to nucleate, but once it nucleated, the saturation rate was faster compared to the cases of smaller embryos.
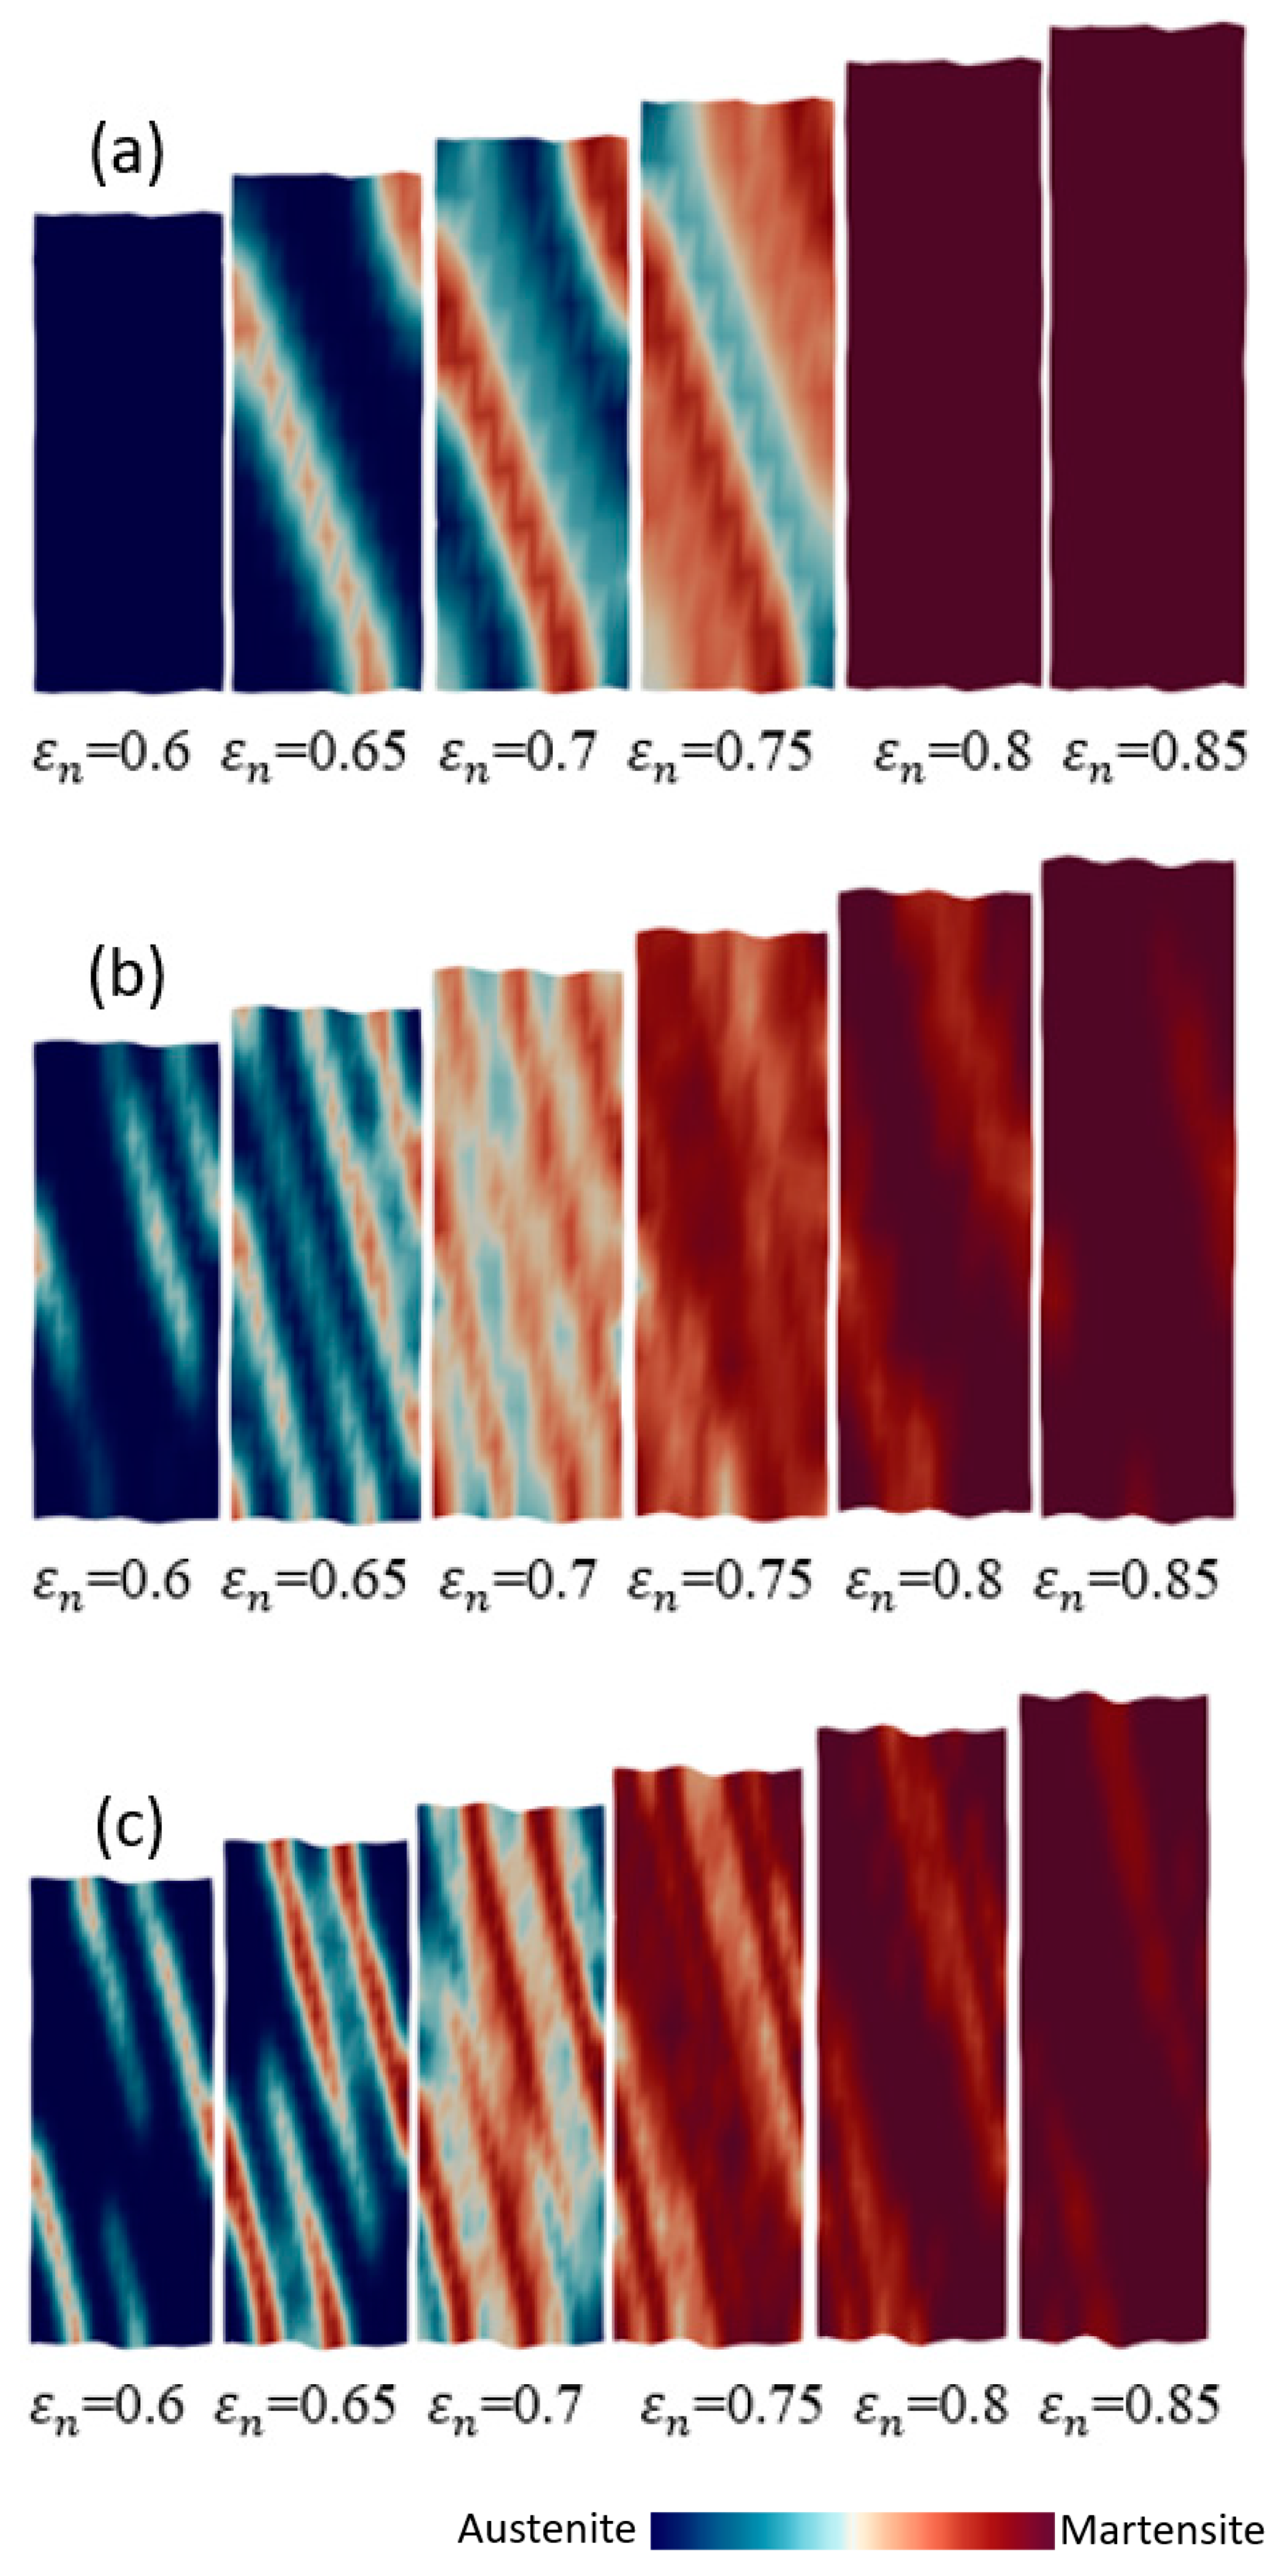
Figure 17 describes the distribution of martensitic phase in different mesh sizes when ε n = 0.6 ~ 0.85 . In this figure, the red and blue colors denote martensite and austenite, respectively. The band structure clearly expresses the evolution of martensite. Nonetheless, with the same change in nominal strain, the regions of martensitic nucleation in the cases of the coarse mesh, intermediate mesh and fine mesh were different. Importantly, as band structures were formed at ε n = 0.65 , comparing the three levels of meshes, the widths of the band structures are significantly different due to the content of martensitic phase inside the band structures. Furthermore, the spaces between the pairs of neighboring bands among the three cases were also different. Although only a small change in the sizes of martensitic embryos was caused, the shear band formation and martensitic volume fraction were strongly affected. Of course, conventional CPFEM is limited in terms of mesh sensitivity, and this sensitivity is insufficient to obtain the size dependent behavior with high accuracy. The mesh sensitivity should be eliminated in the near future. In this study, the authors only focused on the advantages of a simple and effective methodology to establish the effect of the length scale from the size of embryo by introducing the CA approach.
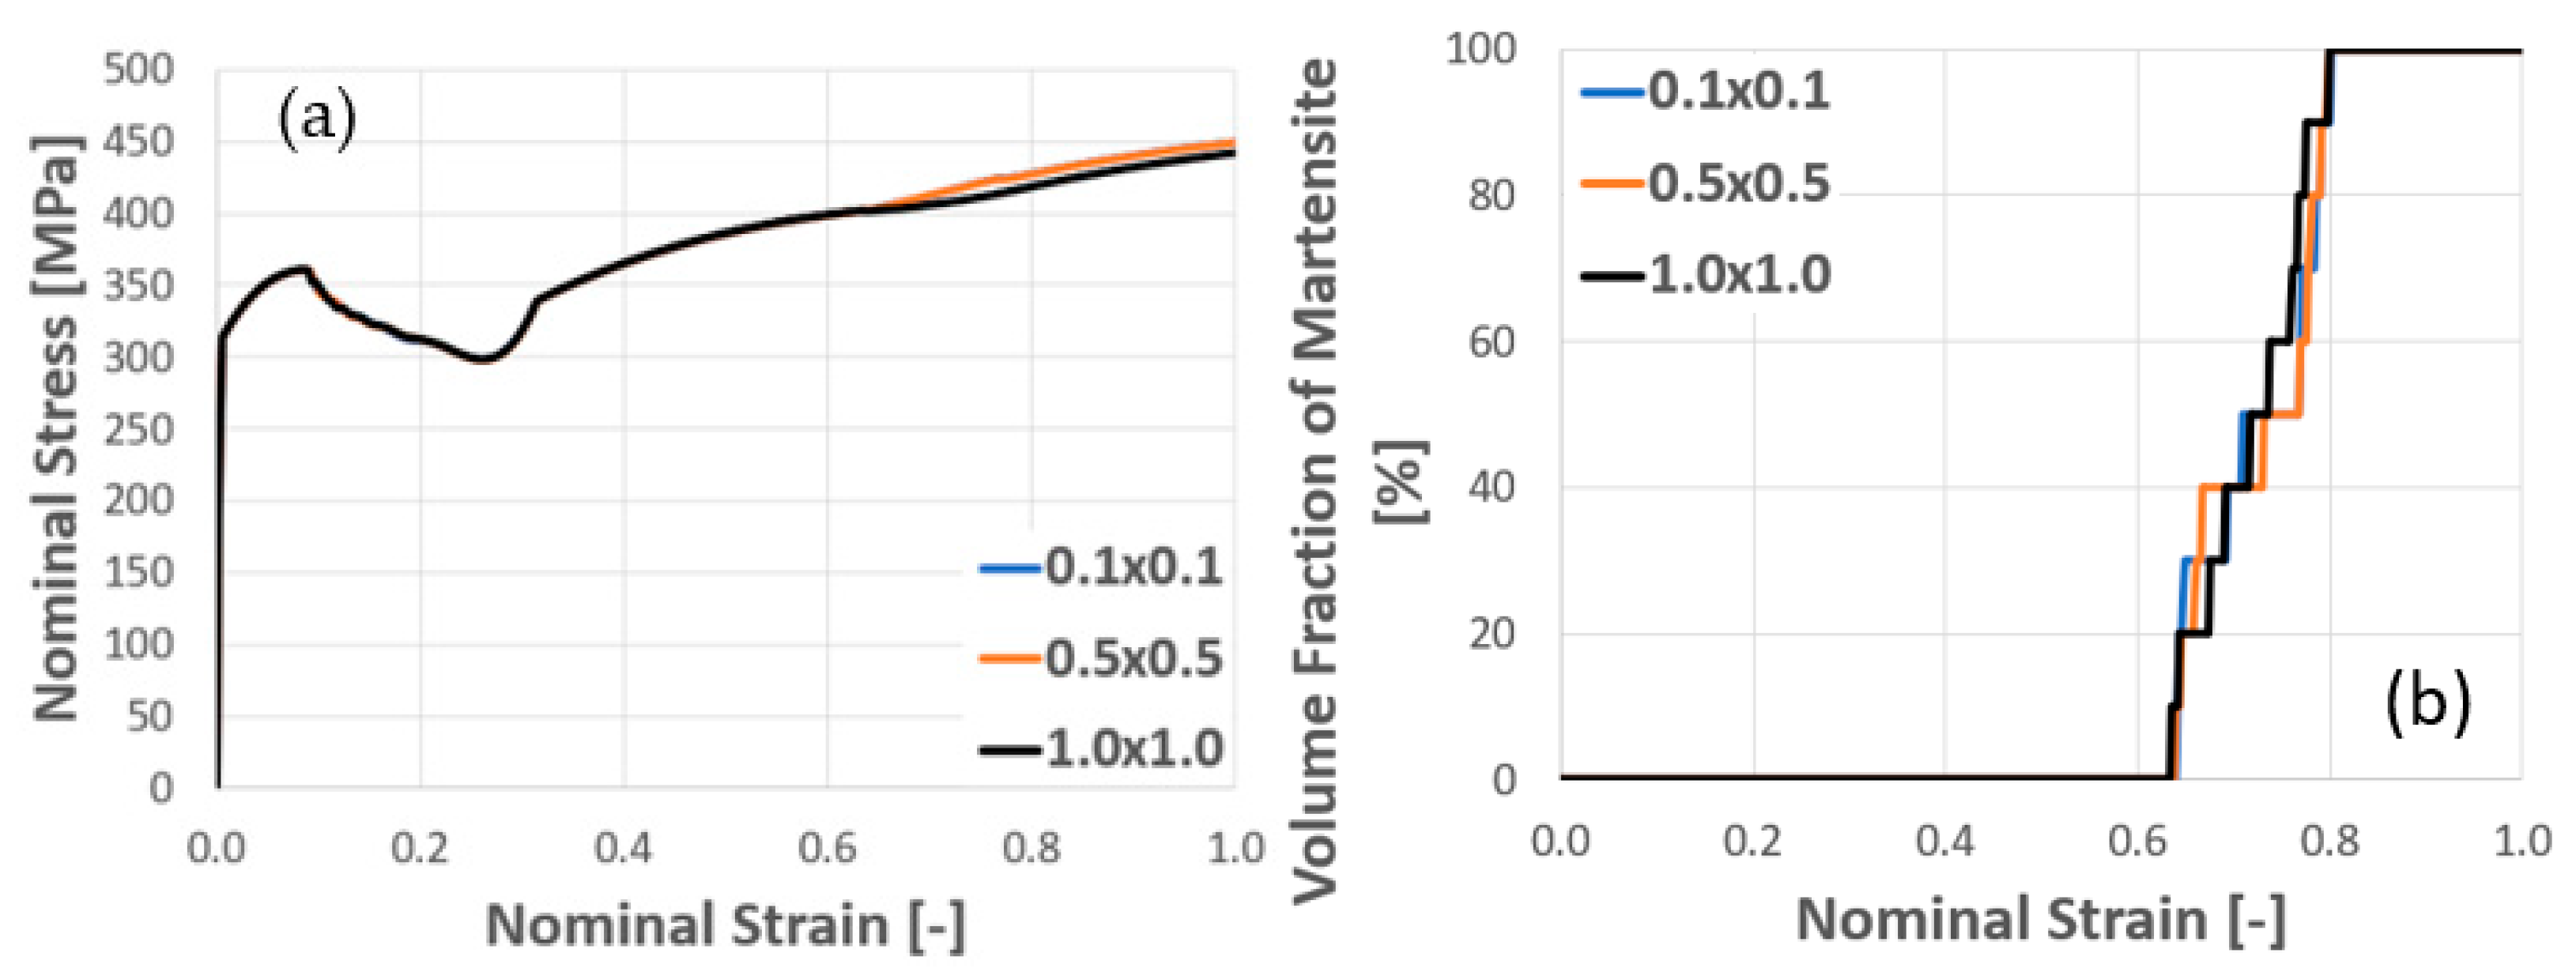
Next, a comparison of the sizes of unit cells of single crystal TRIP steel is presented in Figure 18. The sizes of the cells are considered at three level, at 0.1 × 0.1, 0.5 × 0.5 and 1.0 × 1.0 mm, with = 60 ° . From Figure 18a, it can be seen that the nominal stresses for all three cell sizes were quite similar. However, as phase transformation occurred at ε n = 0.64 , the nominal strain of the large 1.0 × 1.0 mm cell was slightly lower than those of the two other cases. Although the nominal stresses of the 0.1 × 0.1 and 0.5 × 0.5 mm cells were almost the same, the evolutions of the martensitic phase appeared to be different.
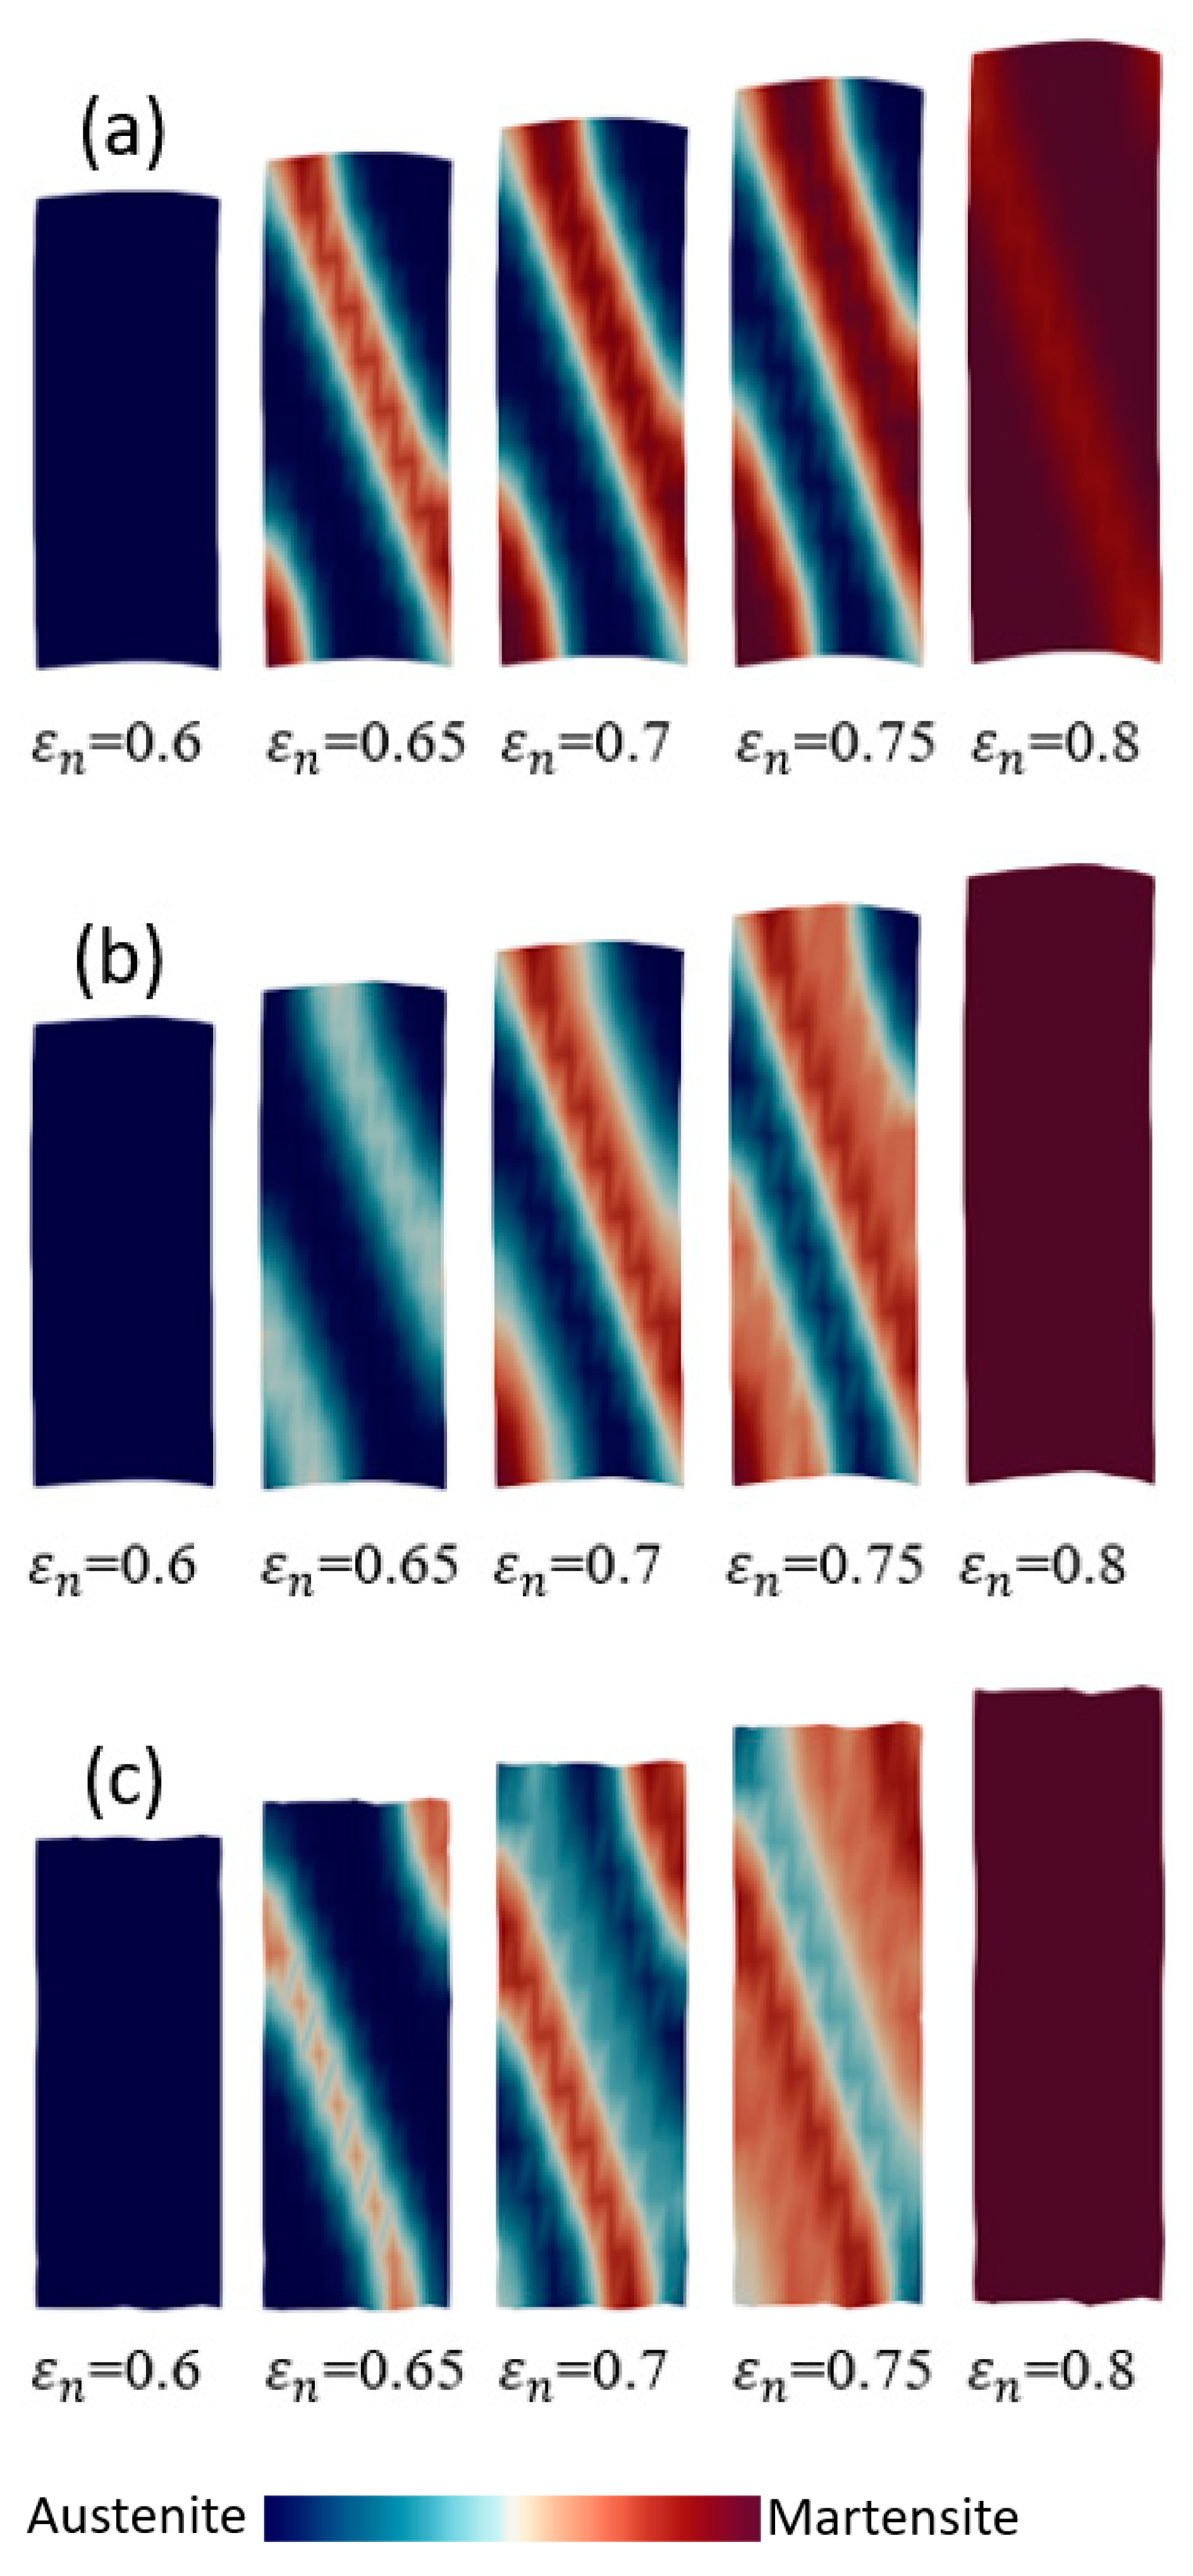
Figure 19 shows the distribution of martensitic phase for different cell sizes. For all cell sizes, the band structure corresponding to the martensitic phase can be observed. When nominal strain ε n = 0.8 , the saturation levels of martensite for the 0.5 × 0.5 and 1.0 × 1.0 mm cells were completed, but in the case of 0.1 × 0.1 mm cell, the MT was not finished. Moreover, the amounts of martensitic phase and the widths of the band structures at the same nominal strain for all three cell sizes were clearly different. This demonstrates that the cell size and the size of the embryo influence the SIMT process.

4.4.2. Polycrystal TRIP Steel

To confirm the existence of the length scale effect, the widths of the shear band structures, which are described by the density of higher equivalent plastic strains in the 4-grain polycrystal model, are discussed with different mesh sizes. A preferred orientation of = 60 ° was chosen in this analysis to remove the strong effect of initial crystal orientation on each grain. Figure 20 shows the macroscopic and microscopic comparisons between coarse and fine mesh of the 4-grain polycrystal model.
As shown in Figure 20, at ε n = 0.4 ~ 1.0 , the nominal stresses and evolutions of martensite were very similar for both mesh sizes. However, differences could be seen at ε n = 0 ~ 0.4 when phase transformation occurred. In Figure 20b, it can be seen that the saturation level of martensite in the case of the fine mesh model is slower at ε n = 0 ~ 0.25 , but it proceeds faster in the subsequent process, with a value of ε n = 0.25 ~ 0.4 .
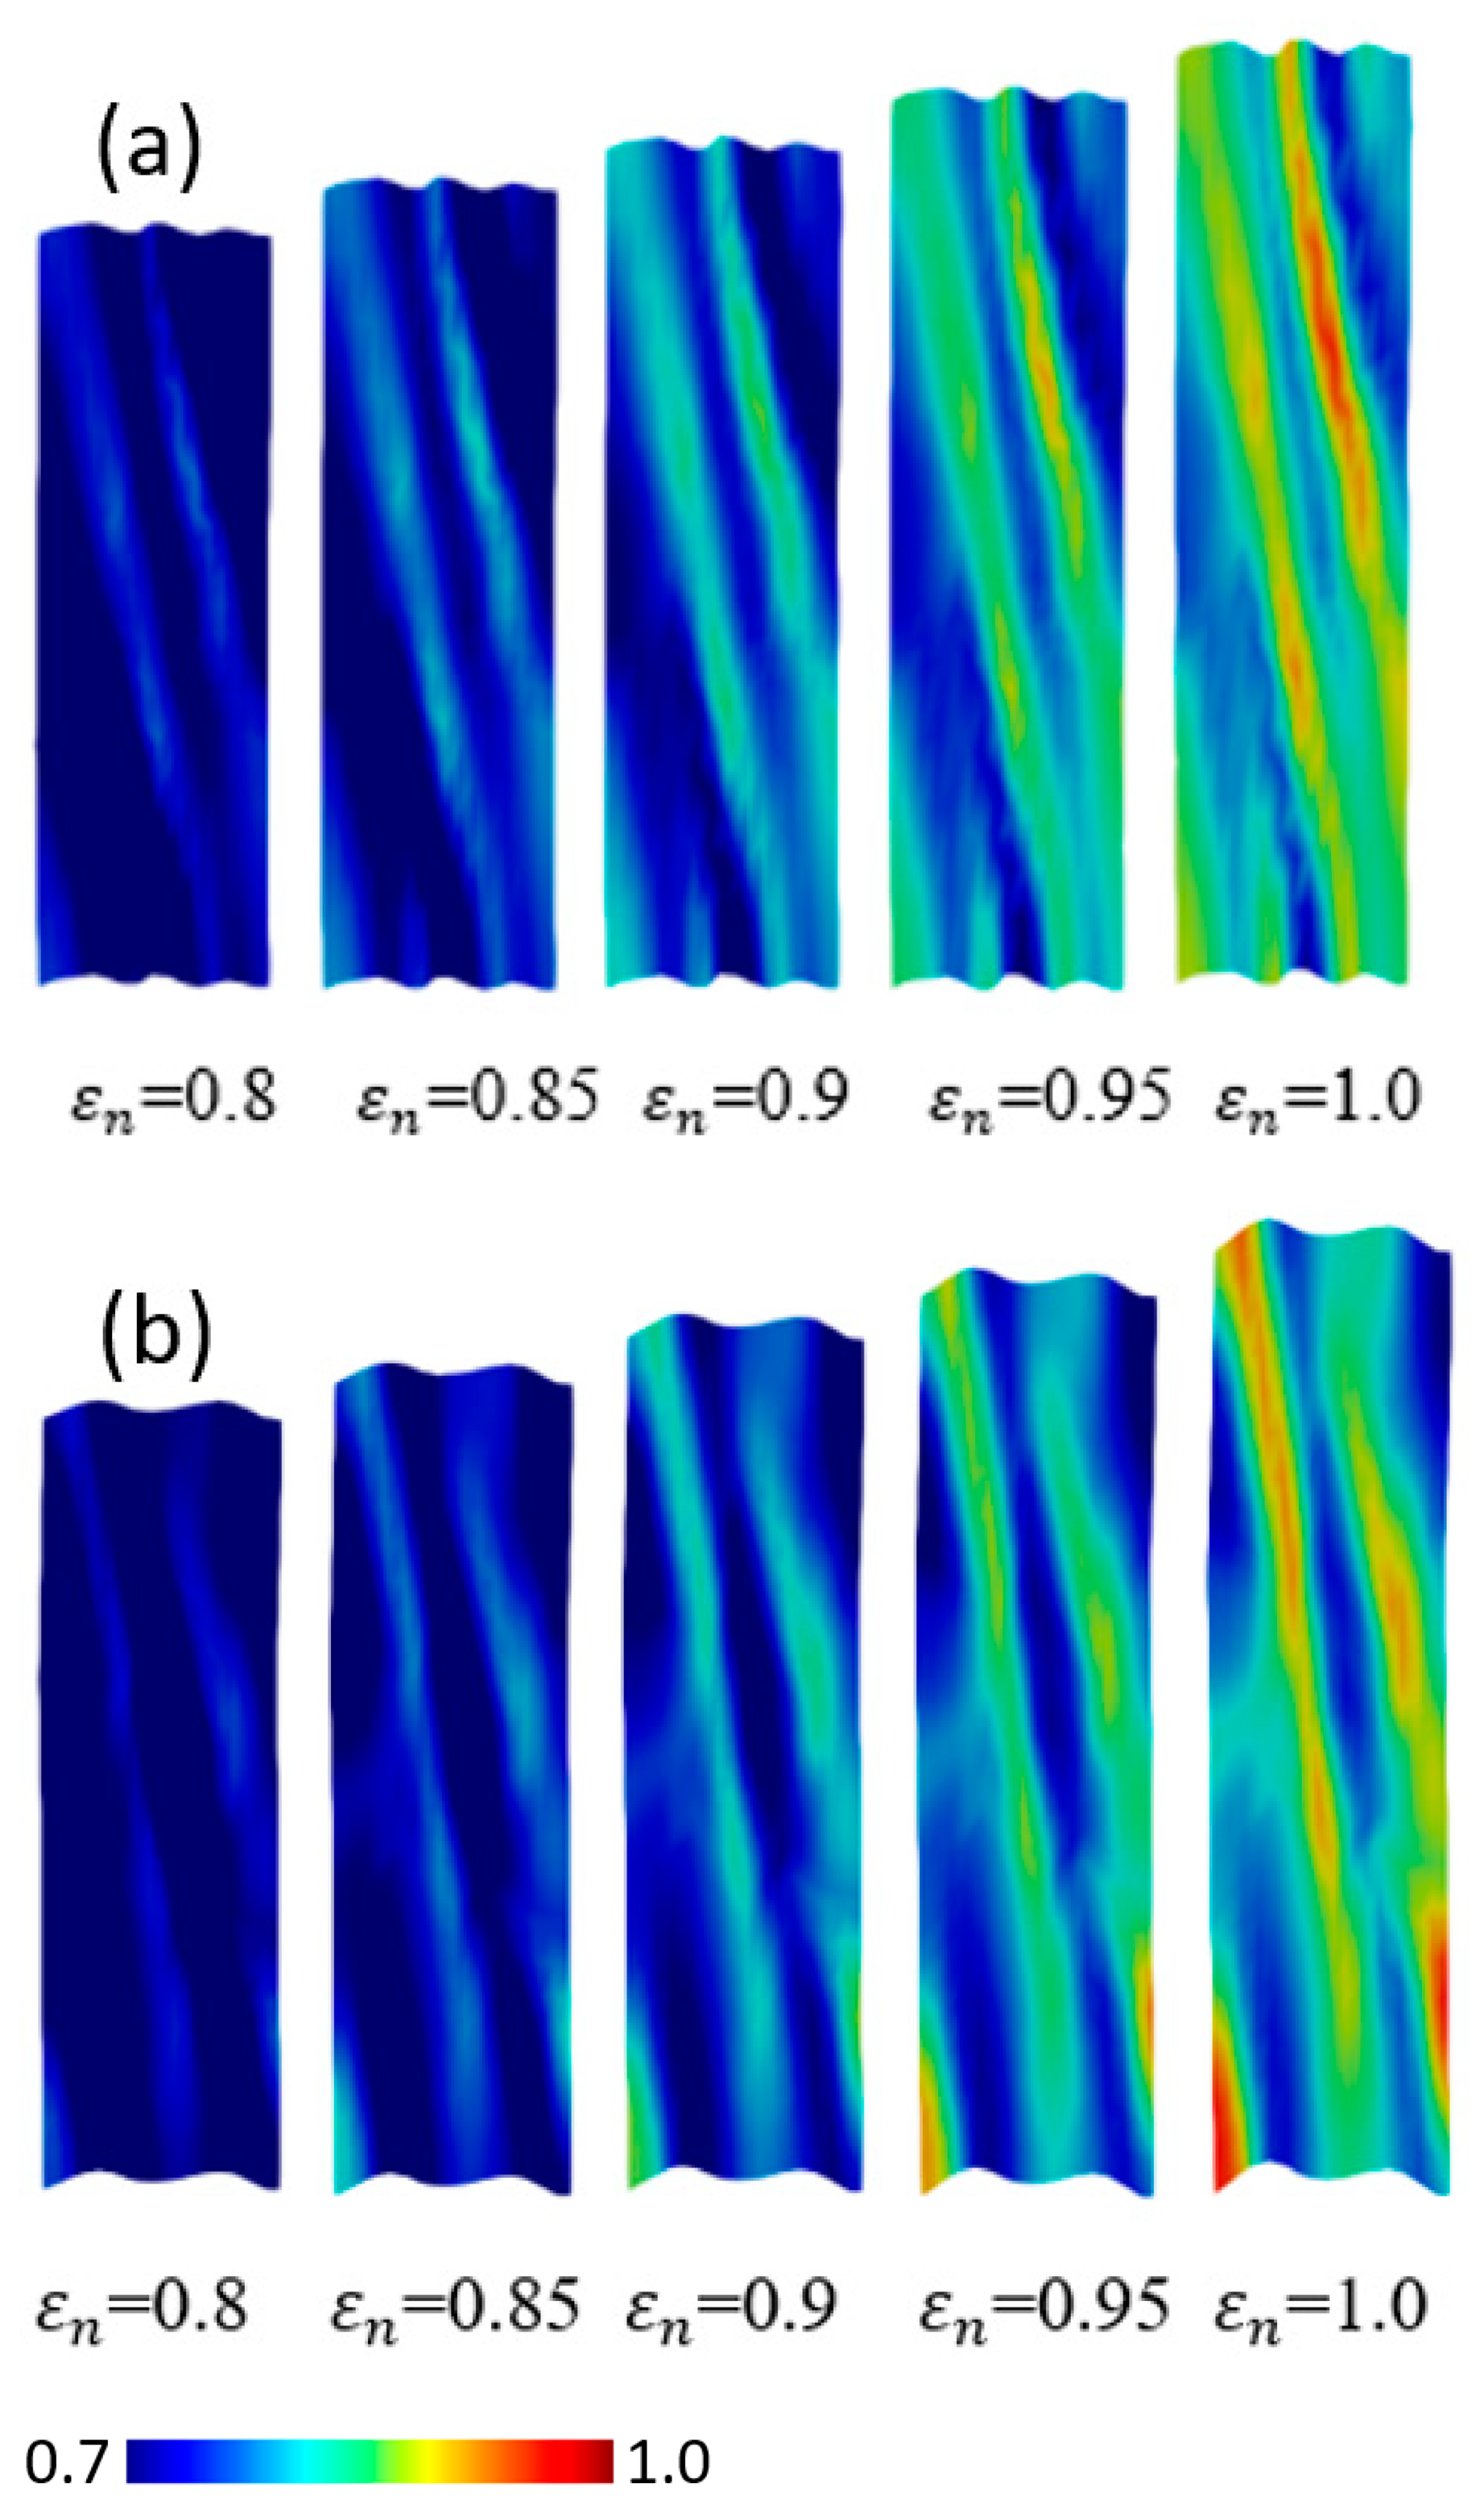
Figure 21 shows the distribution of the equivalent plastic strain of 4-grain polycrystal models in the cases of both coarse mesh and fine mesh. The color bars, which indicate the range of equivalent plastic strain, are unified for both mesh sizes. Though the shear band structures can be observed in both cases, at the same nominal strain, the widths of band structures are different, which corresponds to the regions of higher equivalent plastic strain. The phenomenon may have been caused by the size of the martensitic embryo on each grain in the polycrystal materials. It is noted that in polycrystal materials, the grain morphology is varied for each Voronoi, and thus, the size of the embryos is also different depending on each Voronoi. Therefore, the size of the martensitic embryos is a complicated issue and plays an important role in the SIMT phenomenon.

4.5. Discussion on Size Dependency

It is clear that the cell size which can be considered as a length scale [42], induces a significant effect on SIMT. In fact, during plastic deformation, different length scales can appear beside the martensitic embryo. For instance, when undergoing plasticity at a crystal scale, the dislocations can be induced by the slip, and then be distributed and piled-up within the deforming crystalline structure. This mechanism can nucleate new sites as embryos inside the resulting martensitic phase. Furthermore, the accumulation of dislocations induced by the gradient effect provides additional strain hardening including the length scale effect of Burger’s vector. On the other hand, the martensitic embryos are distributed heterogeneously at the crystal scale, and this leads to a distinctive microstructure. Some techniques, such as the strain gradient or non-local approach, can be applied to express more length scale effects.
As reviewed in Section 1, the use of constitutive models with the same martensitic volume fraction as an internal kinetic descriptor in the macroscopic investigation of plasticity theory can lead to the elimination of size-related effects. These assumptions may cause many inaccurate predictions in understanding the effect of size on SIMT in relation to shear band formation. In this work, the constitutive model is introduced without assuming small strain or using a kinetic model that uses the volume fraction as an internal variable. It is well known that the lath martensitic microstructure with shear band structures formed in individual crystals has a very high dislocation density. Obviously, the consideration of the dislocation mechanism is necessary to capture the size-dependent behavior more accurately.
One of the advantages of the numerical model is that the length scale effect, which is related to SIMT behavior and shear band formation, can be realized in the conventional CPFEM framework by applying the CA approach. In addition, the introduced model can be flexibly extended and straightforwardly implemented not only by means of an in-house code but also using a commercial finite element package. In the near future, the mechanisms of shear band structures and multiple length scale effects should be investigated more deeply by considering the dislocation motion that is associated with the effects of the strain gradient. Furthermore, in addition to nucleation, the diffusion process of embryo should be considered by coupling with a phase field approach.

5. Concluding Remarks

In this study, a numerical simulation of SIMT in relation to the shear band formation in crystalline TRIP steel has been conducted. The constitutive model is formulated based on the CPFEM theory coupled with the CA approach and is consistent within a finite deformation framework under an infinite medium. The simulation results show a significant interaction of plasticity and MT during the deformation process. The following conclusions can be drawn:
  • The numerical model, which combines the CPFEM and CA approaches in this study, is applied efficiently to describe the basic features of SIMT in crystalline TRIP steel.
  • The distributions of plastic strain and the martensitic phase are similar and explicitly formed as a shear band structure. The regions of the shear band structure, and their intersection, are thus effective sites for the nucleation of α -martensite.
  • The numbers, width, and direction of the bands, in the formation of the band structures, are significantly affected by the crystal orientations.
  • In polycrystal models, the numbers of grains can greatly influence the strength, SIMT behavior and the formed microstructures of the crystalline TRIP steel.
  • By analyzing the cell size and the mesh size in single and polycrystal models, the results show that the sizes of embryos and cells strongly influence the shear band formation and the martensitic volume fraction of crystal TRIP steel.

Author Contributions

Data curation, T.I.; Formal analysis, T.D.T. and T.I.; Funding acquisition, T.I.; Investigation, T.D.T. and T.I.; Methodology, T.I.; Project administration, T.I.; Resources, T.I.; Software, T.I.; Supervision, T.I.; Validation, T.I.; Visualization, T.D.T.; Writing—original draft, T.D.T.; Writing—review & editing, T.I. All authors have read and agreed to the published version of the manuscript.

Funding

This research received no external funding.

Institutional Review Board Statement

Not applicable.

Informed Consent Statement

Not applicable.

Conflicts of Interest

The authors declare no conflict of interest.

Appendix A. Tangent Modulus Method

In this study, the tangent modulus method proposed by Peirce et al. [22] was applied for the stability of the computational process. Firstly, during plastic deformation, the increment of shear slip on each slip system that occurred within Δt was considered by performing linear interpolation as follows:
Δ γ ( a ) = { ( 1 θ ) γ ˙ t ( a ) + θ γ ˙ t + t ( a ) } t .
Here, θ varies from 0 to 1 due to the scheme of the numerical time integration. Using Taylor expansion for two variables, the approximation of γ ˙ t + t ( a ) on the right side of the above equation can be as follows:
γ ˙ t + t ( a ) = γ ˙ t ( a ) + γ ˙ ( a ) τ ( a ) τ ( a ) + γ ˙ ( a ) g ( a ) g ( a ) .
From the power law for the rate-dependent constitutive model of shear strain rate γ ˙ ( a ) on the a t h slip system, γ ˙ t + t ( a ) can be rewritten in the following form:
γ ˙ t + t ( a ) = s g n ( τ ( a ) ) a ˙ ( a ) | τ ( a ) g ( a ) | 1 m { 1 + 1 m ( τ ( a ) τ ( a ) g ( a ) g ( a ) ) } .
Similarly, when considering MT, the increment of transformation strain on the I t h variant system can be expressed as:
Δ γ t ( I ) = { ( 1 θ ) γ ˙ t t ( I ) + θ γ ˙ t + t t ( I ) } t ,
γ ˙ t + t t ( I ) = sgn ( τ t ( I ) ) γ t ( I ) θ ˙ ( I ) | τ t ( I ) g t ( I ) | 1 m { 1 + 1 m ( τ t ( I ) τ t ( I ) g t ( I ) g t ( I ) ) } .
After substituting all the necessary components from kinematics relations and transforming the Equations (A3) and (A5), we can obtain the linear system of equations as follows:
Δ γ ( a ) + I f a I 2 Δ γ t ( I ) = ( f ˙ 1 ( a ) + F ( a ) : d ) Δ t , γ t ( I ) + a f I a 2 t γ ( a ) = ( f ˙ 1 t ( I ) + F t r ( I ) : d ) t .
By solving the simultaneously linear Equation (A6), the components to calculate the increments of shear strain and transformation strain can be obtained.

References

  1. Fischer, F.D.; Reisner, G.; Werner, E.; Tanaka, K.; Cailletaud, G.; Antretter, T. A new view on transformation induced plasticity (TRIP). Int. J. Plast. 2000, 16, 723–748. [Google Scholar] [CrossRef]
  2. Bowles, J.S.; Mackenzie, J.K. The crystallography of martensite transformations I. Acta Metal. 1954, 2, 129–137. [Google Scholar] [CrossRef]
  3. Nishiyama, Z. Martensitic Transformation; Academic Press: New York, NY, USA, 1978. [Google Scholar]
  4. Olson, G.B.; Cohen, M. Kinetics of strain-induced martensitic nucleation. Metall. Trans. A 1975, 6, 791–795. [Google Scholar] [CrossRef]
  5. Talonen, J.; Hänninen, H. Formation of shear bands and strain-induced martensite during plastic deformation of metastable austenitic stainless steels. Acta Mater. 2007, 55, 6108–6118. [Google Scholar] [CrossRef]
  6. Wu, R.; Tüzes, D.; Ispánovity, P.D.; Groma, I.; Hochrainer, T.; Zaiser, M. Instability of dislocation fluxes in a single slip: Deterministic and stochastic models of dislocation patterning. Phys. Rev. B 2018, 98, 054110. [Google Scholar] [CrossRef] [Green Version]
  7. Paul, H.; Morawiec, A.; Driver, J.H.; Bouzy, E. On twinning and shear banding in a Cu–8at.% Al alloy plane strain compressed at 77K. Int. J. Plast. 2009, 25, 1588–1608. [Google Scholar] [CrossRef]
  8. Jia, N.; Raabe, D.; Zhao, X. Texture and microstructure evolution during non-crystallographic shear banding in a plane strain compressed Cu–Ag metal matrix composite. Acta Mater. 2014, 76, 238–251. [Google Scholar] [CrossRef]
  9. Malik, A.; Amberg, G.; Borgenstam, A.; Ågren, J. Phase-field modelling of martensitic transformation: The effects of grain and twin boundaries. Model. Simul. Mater. Sci. Eng. 2013, 21, 085003. [Google Scholar] [CrossRef]
  10. Sierra, R.; Nemes, J.A. Investigation of the mechanical behavior of multi-phase TRIP steels using finite element methods. Int. J. Mech. Sci. 2008, 50, 649–665. [Google Scholar] [CrossRef]
  11. Sidhoum, Z.; Ferhoum, R.; Almansba, M.; Bensaada, R.; Habak, M.; Aberkane, M. Experimental and numerical study of the mechanical behavior and kinetics of the martensitic transformation in 304L TRIP steel: Applied to folding. Int. J. Adv. Manuf. Technol. 2018, 97, 2757–2765. [Google Scholar] [CrossRef]
  12. Levitas, V.I.; Idesman, A.V.; Olson, G.B. Continuum modeling of strain-induced martensitic transformation at shear-band intersections. Acta Mater. 1999, 47, 219–233. [Google Scholar] [CrossRef]
  13. Dan, W.J.; Li, S.H.; Zhang, W.G.; Lin, Z.Q. The effect of strain-induced martensitic transformation on mechanical properties of TRIP steel. Mater. Des. 2008, 29, 604–612. [Google Scholar] [CrossRef]
  14. Kubler, R.; Berveiller, M.; Buessler, P. Semi phenomenological modelling of the behavior of TRIP steels. Int. J. Plast. 2011, 27, 299–327. [Google Scholar] [CrossRef] [Green Version]
  15. Beese, A.M.; Mohr, D. Effect of stress triaxiality and Lode angle on the kinetics of strain-induced austenite-to-martensite transformation. Acta Mater. 2011, 59, 2589–2600. [Google Scholar] [CrossRef]
  16. Cao, J.; Jin, J.; Wang, L.; Li, S.; Zong, Y. Modeling for onset strain of deformation-induced martensite transformation in Q&P steel by a mean-field Eshelby approach. Model. Simul. Mater. Sci. Eng. 2019, 27, 085002. [Google Scholar]
  17. Stringfellow, R.; Parks, D.; Olson, G. A constitutive model for transformation plasticity accompanying strain-induced martensitic transformations in metastable austenitic steels. Acta Metall. Mater. 1992, 40, 1703–1716. [Google Scholar] [CrossRef]
  18. Iwamoto, T.; Tsuta, T.; Tomita, Y. Investigation on deformation mode dependence of strain induced martensitic transformation in TRIP steels and modeling of transformation kinetics. Int. J. Mech. Sci. 1998, 40, 173–182. [Google Scholar] [CrossRef]
  19. Turteltaub, S.; Suiker, A. A multiscale thermomechanical model for cubic to tetragonal martensitic phase transformations. Int. J. Solids Struct. 2006, 43, 4509–4545. [Google Scholar] [CrossRef] [Green Version]
  20. Lai, Q.; Brassart, L.; Bouaziz, O.; Goune, M.; Verdier, M.; Parry, G.; Perlade, A.; Brechet, Y.; Pardoen, T. Influence of martensite volume fraction and hardness on the plastic behavior of dual-phase steels: Experiments and micromechanical modeling. Int. J. Plast. 2016, 80, 187–203. [Google Scholar] [CrossRef]
  21. Asaro, R. Crystal plasticity. Trans. ASME J. Appl. Mech. 1983, 50, 921–934. [Google Scholar] [CrossRef]
  22. Peirce, D.; Asaro, R.; Needleman, A. Material rate dependence and localized deformation in crystalline solids. Acta Metal. 1983, 31, 1951–1976. [Google Scholar] [CrossRef]
  23. Roters, F.; Eisenlohr, P.; Hantcherli, L.; Tjahjanto, D.; Bieler, T.; Raabe, D. Overview of constitutive laws, kinematics, homogenization and multiscale methods in crystal plasticity finite-element modeling: Theory, experiments, applications. Acta Mater. 2010, 58, 1152–1211. [Google Scholar] [CrossRef]
  24. Iwamoto, T.; Tsuta, T. Finite element simulation of martensitic transformation in single crystal TRIP steel based on crystal plasticity theory with cellular automata approach. Key Eng. Mater. 2004, 274–276, 679–684. [Google Scholar] [CrossRef]
  25. Xiao, N.; Tong, M.; Lan, Y.; Li, D.; Li, Y. Coupled simulation of the influence of austenite deformation on the subsequent isothermal austenite–ferrite transformation. Acta Mater. 2006, 54, 1265–1278. [Google Scholar] [CrossRef]
  26. Wang, H.; Capolungo, L.; Clausen, B.; Tome, C. A crystal plasticity model based on transition state theory. Int. J. Plast. 2017, 93, 251–268. [Google Scholar] [CrossRef]
  27. Trinh, T.D.; Iwamoto, T. A computational simulation of martensitic transformation in polycrystal TRIP steel by crystal plasticity FEM with voronoi tessellation. Key Eng. Mater. 2019, 794, 71–77. [Google Scholar] [CrossRef]
  28. Tjahjanto, D.D.; Turteltaub, S.; Suiker, A.S.J.; van der Zwaag, S. Modelling of the effects of grain orientation on transformation-induced plasticity in multi-phase steels. Model. Simul. Mater. Sci. Eng. 2006, 14, 617–636. [Google Scholar] [CrossRef]
  29. Hatem, T.M.; Zikry, M.A. Dislocation density crystalline plasticity modeling of lath martensitic in steel alloys. Philos. Mag. A 2009, 89, 3087–3109. [Google Scholar] [CrossRef] [Green Version]
  30. Lee, M.G.; Kim, S.J.; Han, H.N. Crystal plasticity finite element modeling of mechanically induced martensitic transformation (MIMT) in metastable austenite. Int. J. Plast. 2010, 26, 688–710. [Google Scholar] [CrossRef]
  31. Zecevic, M.; Upadhyay, M.V.; Polatidis, E.; Panzner, T.; Van Swygenhoven, H.; Knezevic, M. A crystallographic extension to the Olson-Cohen model for predicting strain path dependence of martensitic transformation. Acta Mater. 2019, 166, 386–401. [Google Scholar] [CrossRef]
  32. Levitas, V.I.; Javanbakht, M. Interaction between phase transformations and dislocations at the nanoscale. Part1. General phase field approach. J. Mech. Phys. Solids 2015, 82, 287–319. [Google Scholar] [CrossRef]
  33. Raabe, D. Cellular Automata in Materials Science with Particular Reference to Recrystallization Simulation. Annu. Rev. Mater. Res. 2002, 32, 53–76. [Google Scholar] [CrossRef]
  34. Yang, H.; Wu, C.; Li, H.; Fan, X. Review on cellular automata simulations of microstructure evolution during metal forming process: Grain coarsening, recrystallization and phase transformation. Sci. China Technol. Sci. 2011, 54, 2107–2118. [Google Scholar] [CrossRef]
  35. Pourian, M.H.; Bridier, F.; Pilvin, P.; Bocher, P. Prediction of crack initiation sites in alpha Ti-alloys microstructures under dwell-fatigue using Cellular Automaton simulation method. Int. J. Fatigue 2016, 85, 85–97. [Google Scholar] [CrossRef]
  36. Zheng, C.; Raabe, D. Interaction between recrystallization and phase transformation during intercritical annealing in a cold rolled dual-phase steel: A cellular automaton model. Acta Mater. 2013, 61, 5504–5517. [Google Scholar] [CrossRef]
  37. Smit, R.J.M.; Brekelmans, W.A.M.; Meijer, H.E.H. Prediction of the mechanical behavior of nonlinear heterogeneous systems by multi-level finite element modeling. Comput. Methods Appl. Mech. Eng. 1998, 155, 181–192. [Google Scholar] [CrossRef]
  38. Levitas, V.I. Thermomechanical theory of martensitic phase transformations in inelastic materials. Int. J. Solids Struct. 1998, 35, 889–940. [Google Scholar] [CrossRef]
  39. Cherkaoui, M.; Berveiller, M.; Saber, H. Micromechanical modeling of martensitic transformation induced plasticity (TRIP) in austenitic single crystals. Int. J. Plast. 1998, 14, 597–626. [Google Scholar] [CrossRef]
  40. Kitajima, Y.; Sato, N.; Tanaka, K.; Nagaki, S. Crystal based simulations in transformation thermomechanics of shape memory alloys. Int. J. Plast. 2002, 18, 1527–1559. [Google Scholar] [CrossRef]
  41. Tanaka, K.; Tobushi, H.; Miyazaki, S. Mechanical Properties of Shape Memory Alloys; Yokendo Ltd.: Tokyo, Japan, 1993; pp. 7–61. [Google Scholar]
  42. Trinh, T.D.; Iwamoto, T. A Review on Numerical Analyses of Martensitic Phase Transition in Mono and Polycrystal Transformation-induced Plasticity Steel by Crystal Plasticity Finite Element Method with Length Scales. In State of the Art and Future Trends in Material Modeling; Altenbach, H., Öchsner, A., Eds.; Advanced Structured Materials; Springer: Cham, Switzerland, 2019; Volume 100, pp. 401–420. [Google Scholar]
  43. Ledbetter, H.M. Monocrystal elastic constants of 304-type stainless steel. Physica B+C 1985, 128, 1–4. [Google Scholar] [CrossRef]
  44. Ledbetter, H.M. Predicted single-crystal elastic constants of stainless steel 304. In Materials Studies for Magnetic Fusion Energy Applications at Low Temperatures-IV; Reed, R.P., Simon, N.J., Eds.; NBSIR: Boulder, CO, USA, 1981; Volume 12, pp. 227–236. [Google Scholar]
  45. Simmons, G.; Wang, H. Single Crystal Elastic Constants and Calculated Aggregate Properties: A Handbook; MIT Press: Cambridge, MA, USA, 1971. [Google Scholar]
  46. Tsurui, T.; Inoue, S.; Matsuda, K.; Ishigaki, H.; Murata, K.; Koterazawa, K. Effect of tensile axis on α′ martensitic formation of SUS304 stainless steel single crystals. J. Soc. Mater. Sci. 2001, 50, 1115–1119. [Google Scholar] [CrossRef] [Green Version]
  47. Ganghoffer, J.F.; Simonsson, K. A micromechanical model of the martensitic transformation. Mech. Mater. 1998, 27, 125–144. [Google Scholar] [CrossRef]
  48. Cohen, M. Nucleation of solid state transformations. Trans. TMS-AIME 1958, 212, 171. [Google Scholar]
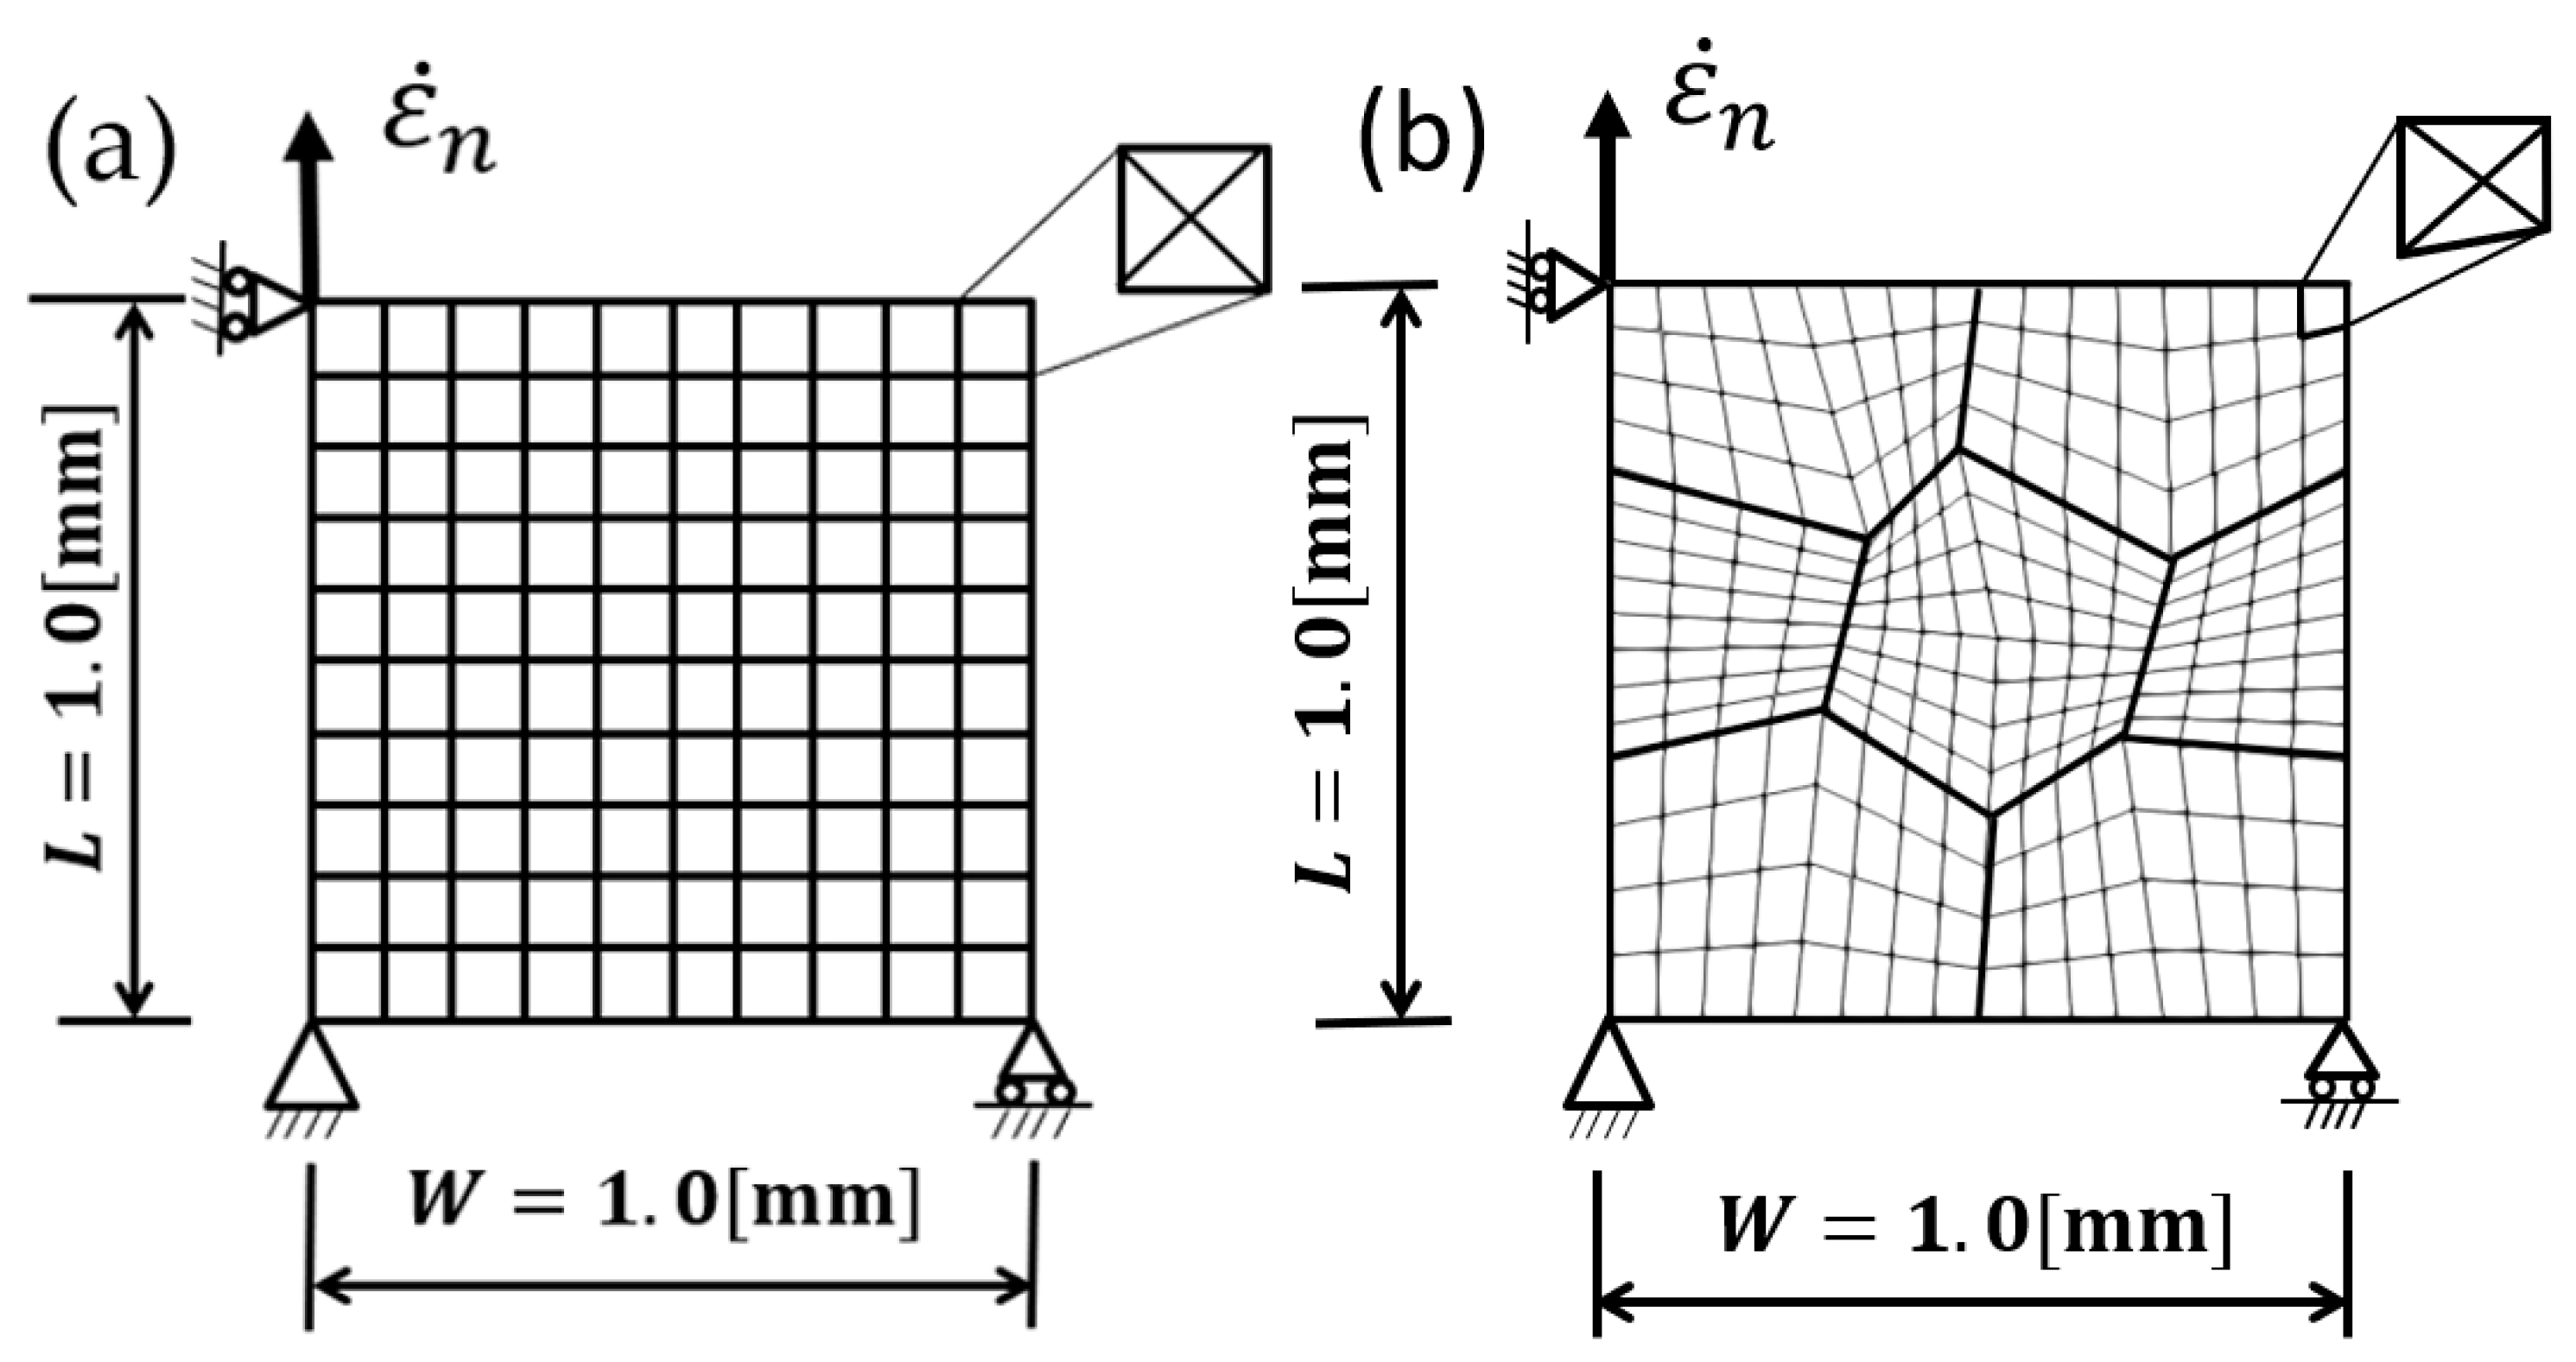
Figure 1. Finite element models of (a) monocrystal and (b) 4-grain polycrystal TRIP steel [24,27,42].
Metals 11 01316 g001
Figure 2. Two slip systems with definition of crystal orientation [21].
Metals 11 01316 g002
Figure 3. Finite element models of polycrystal TRIP steel with (a) 4-grain and (b) 14-grain in infinite medium [27,42].
Metals 11 01316 g003
Figure 4. Nominal strain and nominal stress obtained by numerical simulation and experiment. The experimental results are reproduced from Ref. [46].
Metals 11 01316 g004
Figure 5. The distribution of (a) equivalent stress and (b) equivalent plastic strain of 6 cells in the infinite medium at ε n = 1.0 when = 60 ° .
Metals 11 01316 g005
Figure 6. (a) Nominal stress versus nominal strain and (b) the volume fraction of martensite versus nominal strain under various initial crystallographic orientations.
Metals 11 01316 g006
Figure 7. The distribution of martensitic phase of single crystal TRIP steel with initial crystallographic orientations of (a)   = 30 ° , (b) = 60 ° and (c) = 90 ° .
Metals 11 01316 g007aMetals 11 01316 g007b
Figure 8. The distribution of equivalent plastic strain of single crystal TRIP steel with initial crystallographic orientations of (a)   = 30 ° , (b) = 60 ° and (c) = 90 ° .
Metals 11 01316 g008aMetals 11 01316 g008b
Figure 9. The distribution of the rotation angle of the transformation variant of single crystal TRIP steel with initial crystallographic orientations of (a)   = 30 ° , (b) = 60 ° and (c) = 90 ° .
Metals 11 01316 g009aMetals 11 01316 g009b
Figure 10. (a) Nominal stress versus nominal strain and (b) the volume fraction of martensite versus nominal strain with random initial crystallographic orientation in each grain.
Metals 11 01316 g010
Figure 11. The distribution of martensitic phase of (a) 4-grain and (b) 14-grain polycrystal TRIP steel with random initial crystal orientations.
Metals 11 01316 g011
Figure 12. The distribution of the rotation angle of the transformation variant of (a) 4-grain and (b) 14-grain polycrystal TRIP steel with crystallographic orientations given randomly.
Metals 11 01316 g012aMetals 11 01316 g012b
Figure 13. The volume fraction of martensite versus nominal strain under various initial crystallographic orientations in the parent phase.
Metals 11 01316 g013
Figure 14. The distribution of martensitic phase of 4-grain polycrystal TRIP steel with a preferred orientation of (a)   = 30 ° and (b) = 60 ° .
Metals 11 01316 g014
Figure 15. The distribution of martensitic phase of 14-grain polycrystal TRIP steel with a preferred orientation of (a)   = 30 ° and (b) = 60 ° .
Metals 11 01316 g015
Figure 16. The dependence of mesh refinement in single crystal (a) Nominal stress versus nominal strain and (b) the volume fraction of martensite versus nominal strain.
Metals 11 01316 g016
Figure 17. The distribution of the martensitic phase of single crystal TRIP steel with different mesh sizes (a) coarse mesh, (b) intermediate mesh, and (c) fine mesh.
Metals 11 01316 g017
Figure 18. The dependence of the cell size (a) nominal stress versus nominal strain and (b) the volume fraction of martensite versus nominal strain.
Metals 11 01316 g018
Figure 19. The distribution of the martensitic phase of single crystal TRIP steel with different cell sizes (a) 0.1 × 0.1 mm, (b) 0.5 × 0.5 mm, and (c) 1.0 × 1.0 mm.
Metals 11 01316 g019
Figure 20. The dependence of mesh refinement as size of embryo (a) nominal stress versus nominal strain and (b) the volume fraction of martensite versus nominal strain.
Metals 11 01316 g020
Figure 21. The distribution of the equivalent plastic strain of 4-grain polycrystal TRIP steel with different mesh sizes (a) coarse mesh, and (b) fine mesh.
Metals 11 01316 g021
Table 1. Material constants and parameters of the model.
Parameter(s)NomenclaturesAusteniteMartensite
Elastic moduli (GPa)C11
C12
C44
209.0
133.0
121.0
236.9
140.6
116.0
Slip resistance (MPa) τ y 89.71114.65
Strain rate sensitivities m 0.01
Reference strain rate ( s 1 ) a ˙ 1.2 × 10 4
Latent hardening ratio q 1.2
Critical resolved shear stress (MPa) τ 0 ( T ) τ y
Saturation resolved shear stress (MPa) τ s ( T )   and   τ s t ( T ) 5.05 τ y 4.08 τ y
Initial hardening rate in
Equations (24) and (25) (MPa)
h 0 ( T )   and   h 0 t ( T ) 1.85 τ y 1.95 τ y
Initial temperature (K) T 0 293
Publisher’s Note: MDPI stays neutral with regard to jurisdictional claims in published maps and institutional affiliations.