Article

Analysis of a New SEN Design with an Inner Flow Divider

by
Jesus Gonzalez-Trejo
1,*,
Ruslan Gabbasov
1,
Jose Raul Miranda-Tello
2,
Ignacio Carvajal-Mariscal
3,
Francisco Cervantes-de-la-Torre
1,
Florencio Sanchez-Silva
3 and
Cesar Augusto Real-Ramirez
1,*
1
Departamento de Sistemas, Universidad Autonoma Metropolitana, Mexico City 02200, Mexico
2
Departamento de Electronica, Universidad Autonoma Metropolitana, Mexico City 02200, Mexico
3
Instituto Politecnico Nacional, ESIME UPALM, Mexico City 07738, Mexico
*
Authors to whom correspondence should be addressed.
Metals 2021, 11(9), 1437; https://doi.org/10.3390/met11091437
Submission received: 14 August 2021 / Revised: 7 September 2021 / Accepted: 8 September 2021 / Published: 11 September 2021
(This article belongs to the Section Metal Casting, Forming and Heat Treatment)

Abstract

:
To minimize the product imperfections due to slag entrapment and surface defects, the fluid flow pattern inside the mold must be symmetric, commonly named double-roll flow. Thus, the liquid steel must enter into the mold evenly distributed. The submerged entry nozzle (SEN) is crucial in product quality in vertical steel slab continuous casting machines because it distributes the molten steel from the tundish into the mold. This work evaluates the performance of a novel bifurcated nozzle design named “SEN with flow divider”. The symmetry at the outlet ports is obtained by imposing symmetry inside the SEN. The flow divider is a solid barrier attached at the SEN bottom inner wall, the height of which slightly surpasses the upper edges of the outlet ports. The performance analysis is done first using numerical simulations, where the Computational Fluid Dynamics (CFD) technique and the Smoothed Particle Hydrodynamics (SPH) approach are used. Then, experimental tests on a scaled model are also used to evaluate the SEN performance. Numerical and physical simulations showed that the flow divider considerably reduces the SEN outlet jets’ broadness and misalignment, producing compact, aligned, and symmetric jets. Therefore, the SEN design analyzed in this work is a promising alternative to improve process profitability.

1. Introduction

It is well known that the quality of the steel produced in slab continuous casting machines depends on many factors. Some factors have been present since the original conception of the process, while others are much more recent, such as the injection of inert gases to reduce the blockage of the submerged entry nozzle (SEN) or the use of the electromagnetic brake. To date, understanding and quantifying how each of the equipment design aspects or operating conditions affects the quality of the steel produced in continuous slab casting machines remains a subject of research [1,2,3,4]. Despite this, there is broad agreement among specialists that the fluid flow pattern inside the mold called “double-roll” produces the least amount of defects in the product. This flow pattern is exemplified in Figure 1a and arises when each of the jets emerging from a bifurcated SEN hits the mold narrow-walls and is split into two parts. One part flows to the meniscus along the mold narrow-face and then flows towards the SEN, forming the mold upper-roll. The other part of the jet flows downwards, close to the mold narrow-face, at a higher velocity. This current promotes an ascending flow near the middle of the mold, forming the mold lower-roll.
The double-roll fluid flow pattern inside the mold can be distorted by multiple factors, such as an inappropriate combination of some design elements, poorly established operating conditions, or by the appearance of undesirable phenomena, such as clogging or erosion of the nozzle inner walls. For example, Figure 1b,c schematically show that an increasing blockage of the SEN inner volume generates significant differences between the jets that emerge from the nozzle. These differences, in turn, generate an asymmetric hydrodynamic behavior inside the mold. Recently, Vakhrushev [5] reported that growing magnitude of the applied magnetic field may cause a reversal of the flow direction at the meniscus surface, which is related to the formation of a “multi-roll” flow pattern in the mold. On the other hand, several works have reported that the sustained switching of the fluid flow pattern inside the SEN bottom zone can also produce considerable differences between the jets emerging from the nozzle [6,7].
Along with operating conditions, geometric features of the submerged nozzle mainly define the hydrodynamic behavior inside the mold. The most studied SEN features include the number of outlet ports [8], the shape of the outlet ports [9], the tilt of the outlet ports [10,11], and the shape at the nozzle bottom zone [12]. Figure 2a–c show the most common bifurcated SEN bottom designs: a well-bottom, a flat-bottom, and a mountain-bottom nozzle. The outlet ports are rectangular in the nozzles presented in these figures. Notice that the primary difference among these three designs is a solid object attached to the inner bottom wall, highlighted with red lines in these figures. In the MB-nozzle, the upper part of the solid partially occupies the volume defined by the outlet ports’ inner planes. In this design, also notice that the solid upper edge is parallel to the outlet ports. Figure 2d,e show two specialized designs, where solid barriers are also attached to the inner bottom wall [13,14]. However, in these cases, the main axis of the solids is perpendicular to the nozzle outlet ports.
Previous numerical and experimental studies have shown that initially, symmetric flow develops two similar counterrotating vortexes at the SEN’s bottom. However, depending on the presence of SEN’s well and its depth, one of the vortexes shortly becomes dominant, suppressing the other [15,16,17,18]. This behavior, in turn, leads to the change of the flow pattern and thus the jet’s characteristics. Thus, finding a method to control the flow pattern inside the nozzle and the emerging jets motivates the current study. The proposed modification on the inner SEN geometry seeks the jets emerging from the nozzle to promote a symmetric hydrodynamic behavior inside the mold of a slab continuous casting machine. The SEN outlet jets must be symmetrical about a vertical plane located in the middle of the nozzle and parallel to the mold wide-walls. As in previous designs, the modification consists of introducing into the SEN a physical barrier perpendicular to the plane of the outlet ports. This barrier, named flow divider (FD), is attached to the SEN bottom wall. At this early stage of development, the FD consists of a rectangular brick. However, unlike previous designs, the FD’s height surpasses the upper edge of the nozzle outlet ports. The FD’s width is equal to the nozzle bore diameter, and the thickness should be as small as possible. Figure 3 shows a flat-bottom and a well-bottom nozzle modified with the flow divider. As in Figure 2, the fluid divider is highlighted with red lines. It must be pointed out that optimizing the FD thickness and total length is out of the scope of this work.
The aim of this work is to evaluate the performance of the proposed SEN through numerical and experimental tests. This work is organized as follows. In the next section, the cases studied are described. Section 3 and Section 4 present the performance evaluation through numerical simulations, using first the Computational Fluid Dynamics (CFD) technique and later on, the Smooth Particle Hydrodynamics (SPH) approach. Finally, Section 5 presents the performance evaluation using experimental tests carried out in a scaled model. The performance evaluation was done by comparing the hydrodynamic behaviors of the standard nozzles and the modified nozzles.

2. Cases Specifications

Scaled models are frequently used to analyze the hydrodynamic behavior inside the continuous casting mold since it is practically impossible to do it on industrial machines. The Reynolds and Froude similarity criteria must be satisfied so that the hydrodynamic behavior in the scale model can reproduce the current system’s behavior. A ⅓-scaled water model was used to accomplish the performance evaluation of the proposed SEN design. System characteristics are similar to that reported in [19], where a ⅓-scaled water model was also employed. The characteristics are even similar to that reported in [20], where the scale of the model was ¼. Dimensions and geometric characteristics of the nozzles studied in this work are described in Figure 4. The traditional flat-bottom and well-bottom nozzle designs are shown in Figure 4a,b, whereas Figure 4c,d show these two designs modified with flow dividers. Figure 4d also shows the three Cartesian planes, XY, XZ, and YZ. The axes were assigned according the reference frame showed in Figure 1a. Notice that the flow divider is aligned with the YZ plane and, thus, perpendicular to the outlet ports planes. All the nozzles are built from a cylinder with a diameter n d = 0.050   m , with an internal circular bore with diameter b d = 0.025   m (see Figure 4a). The nozzles have two outlet ports, also circular, whose diameter is p d = 0.020   m (see Figure 4a). Both outlet ports have a downwards tilt angle α = 15 ° (see Figure 4b). The depth of the bottom well is h b w (see Figure 4b). The bottom-well depths studied in this work range from 0.002 to 0.020 m. The flow divider thickness was set as d t = 0.003   m , and its height above the upper port edge was d e h = 0.010   m (see Figure 4c). This height is half the outlet port diameter. Thus, the total length of the flow divider is d L = h b w + p d + d e h , where h b w is zero for the FB-nozzle (see Figure 4d).

3. Performance Analysis Using CFD Simulations

3.1. Numerical Model Description

The scope of the analysis presented in this section is limited to reproducing the steady-state average hydrodynamic behavior inside the nozzle. Therefore, the CFD numerical simulations presented in this section were performed using the standard κ ε turbulence model, with a steady-state solver for incompressible, turbulent flow, employing the SIMPLE (Semi-Implicit Method for Pressure Linked Equations) algorithm. The simulations were performed using the open source software OpenFOAM [21]. All the simulations were conducted under isothermal conditions. The boundary conditions for the numerical model are as follows.
The liquid, water at room temperature, enters into the nozzle through the inlet port, indicated by the blue circle in Figure 4a. In the simulations reported in this section, except for two particular systems, the fluid velocity vectors entering into the nozzle are perpendicular to the XY plane. In all the systems, the constant fluid velocity magnitude at the inlet port was V e = 1.25   m / s . The zero-pressure gradient at the inlet port was set using the zeroGradient boundary condition of the OpenFOAM configuration parameters. For the turbulent kinetic energy, κ , and the turbulent kinetic energy dissipation rate, ε , it was assumed that the liquid enters with constant values 0.0035   m 2 / s 2 and 0.025   m 2 / s 3 , respectively.
The liquid leaves the nozzle through the two outlet ports. The red circle in Figure 4a indicates the rear outlet port. The frontal outlet port is on the opposite face of the nozzle. The inletOutlet boundary condition was used at both exit ports for the fluid velocity, turbulent kinetic energy, and the turbulent kinetic energy dissipation rate respectively. This boundary condition allows reverse flow at the exit ports, a phenomenon extensively reported in the literature. It was assumed that the kinematic pressure at the outlet ports has a constant average value of p o = 0.000   m 2 / s 2 .
At the nozzle inner walls, the noSlip boundary condition was imposed for the liquid velocity, and the zeroGradient boundary condition was assumed for the pressure. The kqRWallFunction and the epsilonWallFunction boundary conditions were used for turbulent kinetic energy and the turbulent kinetic energy dissipation rate. There is no need to resolve the boundary layer when using the wall functions approach, which reduces the demand for mesh finesse near boundaries [22,23].
All the models were discretized with Gmsh software using unstructured homogeneous meshes [24].

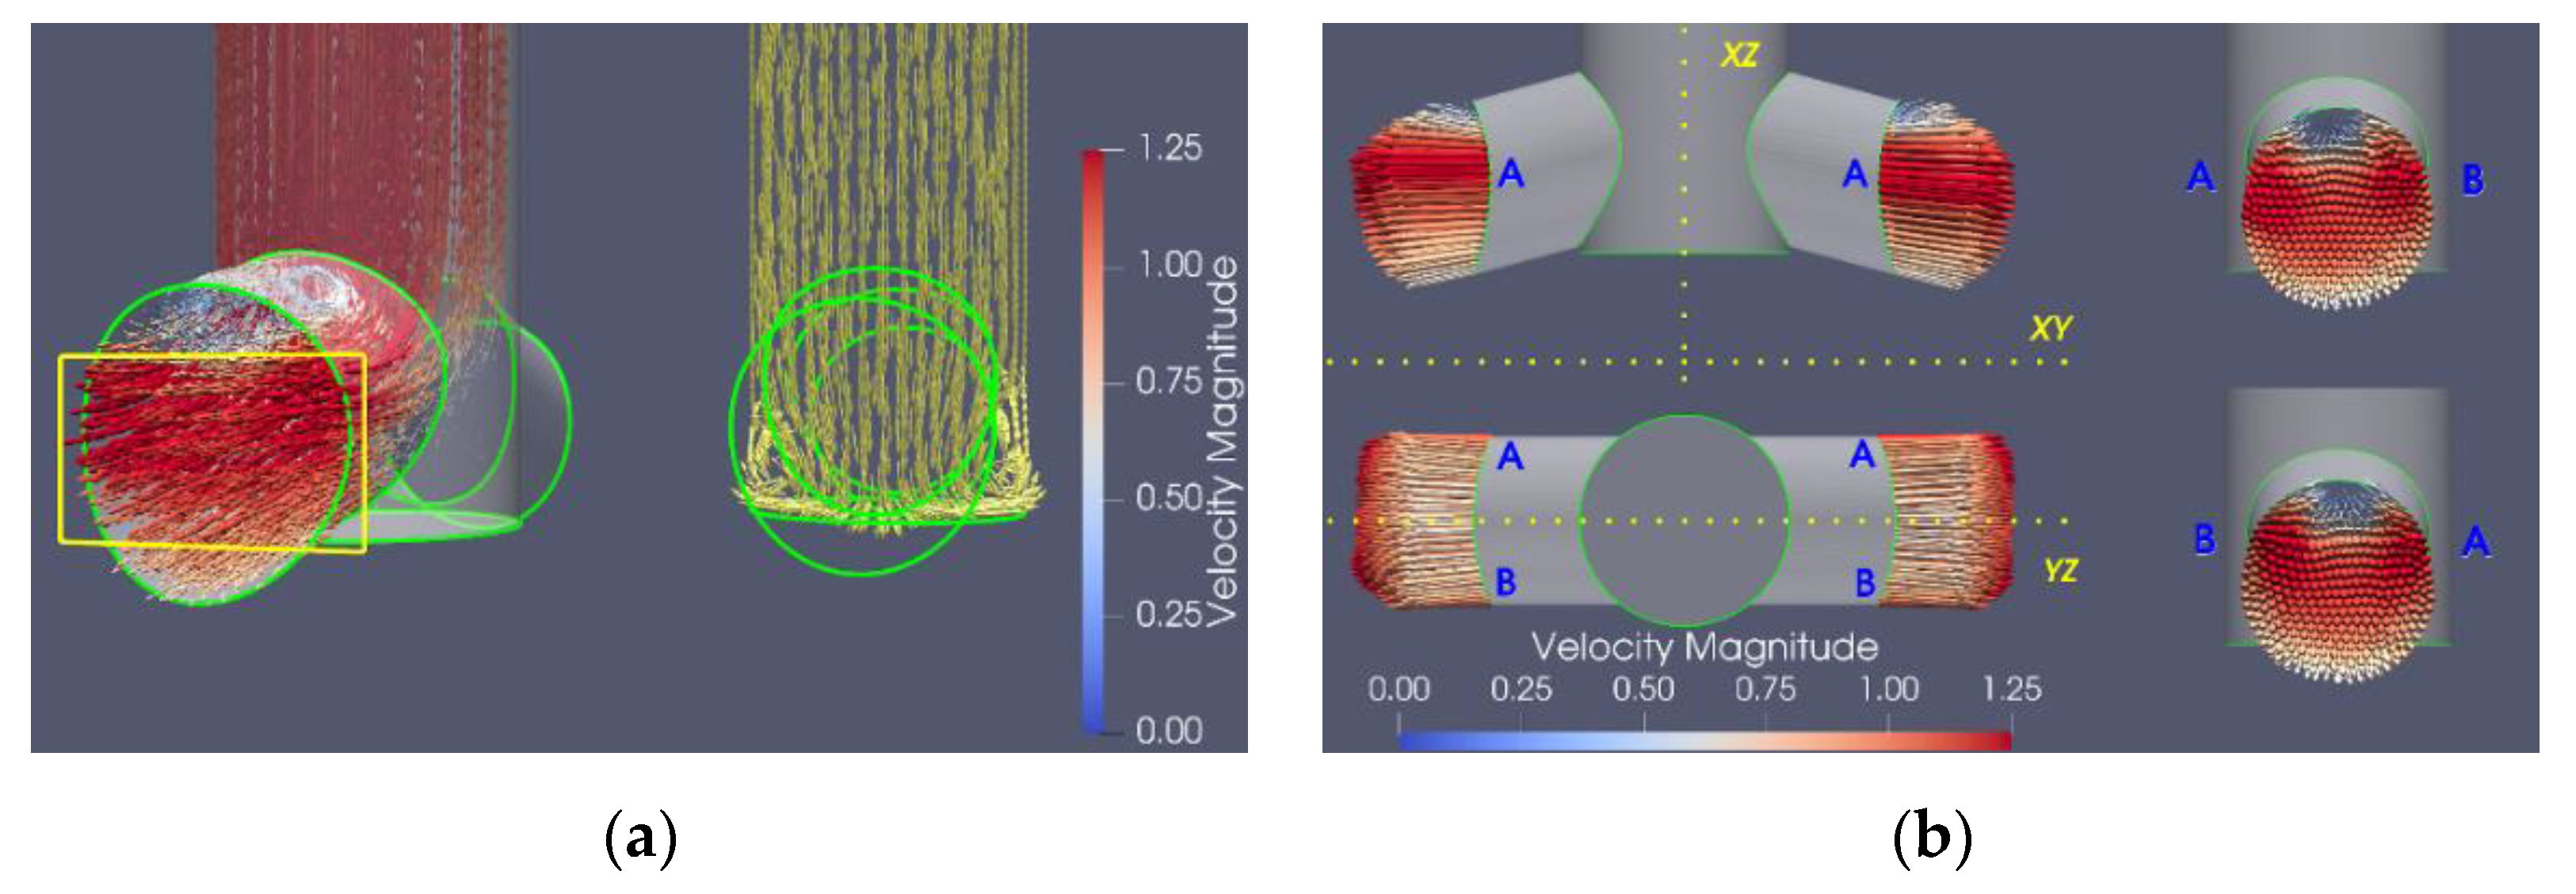
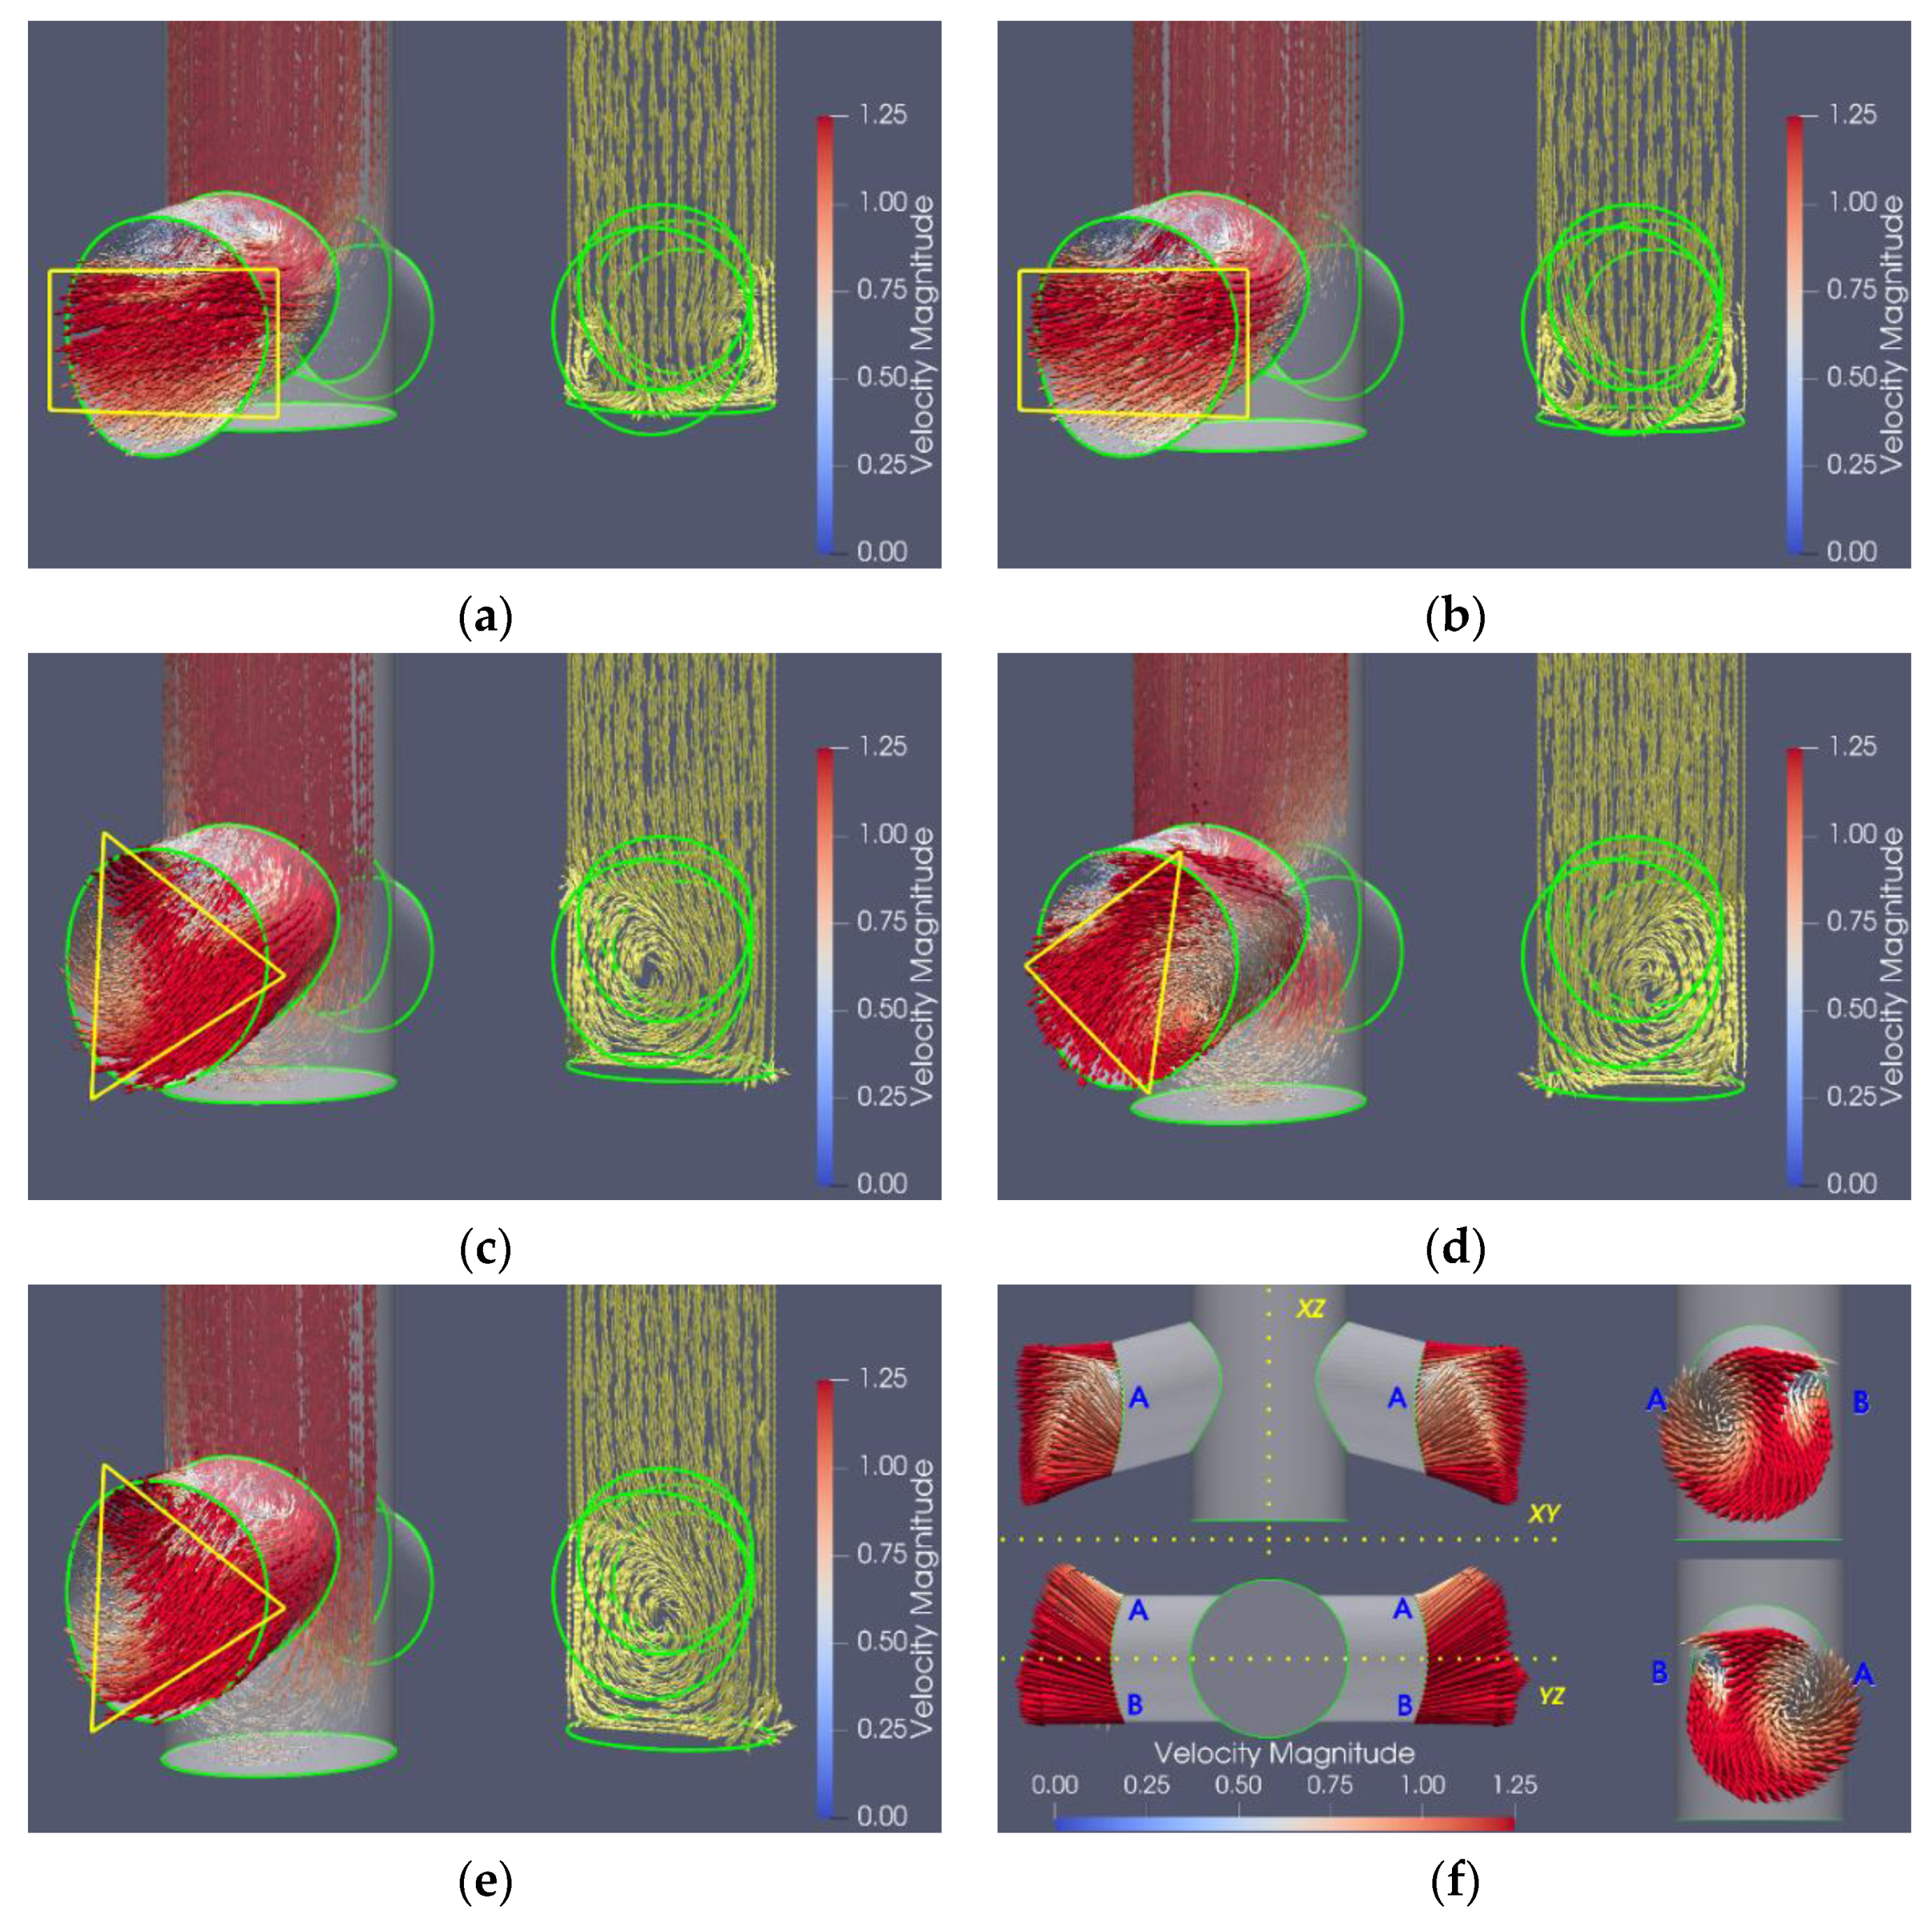
3.2. Analysis of the Hydrodynamic Behavior inside FB and WB-Nozzles

For the FB nozzle, numerous studies have reported that the hydrodynamic behavior at its bottom and that of the jets that emerge from it are both symmetric, as long as the fluid’s velocity profile reaching the lower zone of the nozzle is also symmetric [7]. Figure 5 displays the hydrodynamic behavior inside a FB nozzle.
Figure 5a reconstructs the behavior using fluid velocity vectors along the streamlines. Figure 5a shows that if the fluid flow pattern inside the nozzle is observed directly through one of the outlet ports, the behavior is almost perfectly symmetrical about the vertical axis. The image on the left side in Figure 5a shows only the hydrodynamic behavior on the frontal half of the nozzle. In this image, the vectors’ length and color are proportional to the fluid velocity magnitude. The velocity vectors clearly show that a reverse flow zone is formed at the top of the port. Note that the fluid velocity is small in this region, so it is commonly identified as a low-velocity zone. The image also shows that the fluid velocity is higher in a horizontal strip close to the central zone of the outlet port. A yellow rectangle highlights this horizontal strip. Note that the liquid velocity magnitude decreases near the port’s lower edge, but it is not as small as in the upper part of the port. The image on the right side of Figure 5a shows the fluid velocity vectors along the streamlines on a central plane, which is parallel to the nozzle exit ports planes. The purpose of this image is to delineate the fluid flow pattern in this plane. Therefore, all vectors have the same length and the same color. This image shows the formation of two vortices near the SEN inner bottom wall. Notice that the vortices have an opposite rotation direction and are symmetric about the vertical axis. We refer to this fluid flow pattern as TSV-behavior (two symmetric vortices).
Figure 6 also shows a drastic change in the hydrodynamic behavior in the lower zone of the nozzle when the well-depth surpasses a certain threshold. It is important to remark that this threshold depends on several factors, such as casting speed. Figure 6c–e show that the fluid flow pattern in the lower part of the nozzle is mainly characterized by an enormous vortex, whose core is located at a height between the middle of the ports and the lower edges of the ports. We refer to this fluid flow pattern as OAV-behavior (one asymmetric vortex). This behavior was also observed in numerous experimental tests [6,7,16,17,18,25]. We recognize that an extensive study is required to elucidate the mechanism causing the loss of symmetry of the fluid flow pattern inside the nozzle.
Notice that the rotation direction change of the dominant vortex from Figure 6c,d and later from Figure 6d,e. Furthermore, the vortex core for Figure 6c,e is in the left-hand half of the nozzle, whereas the vortex core is in the right-hand half of the nozzle for Figure 6d. Figure 6c–e reveal two low fluid velocity zones, but their locations depend on the vortex core location. These figures show that the highest fluid velocities are no longer concentrated in a horizontal strip near the middle of the port. Instead, the higher fluid velocities are distributed along an almost triangular region whose axis crosses the port center. A yellow triangle highlights this region. Notice that the triangle upper vertex deviates towards the same side as the core of the vortex. As a result, the shape of the nozzle outlet jets is asymmetric about the YZ axis. However, all the images in Figure 6f show that the patterns of the jets emerging at each of the nozzle outlet ports are vertical reflections from each other.
Figure 6c–e show that these numerical models recover a fluid flow pattern characterized by a dominant vortex, whose rotation direction remains the same as time evolves due to the properties of the turbulence model employed. Moreover, these simulations also show that the dominant vortex rotation direction is not the same in all the cases. When this fluid flow pattern occurs, experimental studies have reported that the rotation direction of the dominant vortex reverts constantly. The mechanism explaining the rotation direction reversion was provided in [26] using CFD numerical simulations employing a LES turbulence model.
Of course, the change in the flow pattern shown in Figure 6 modifies the shape and the characteristics of the jets emerging from the SEN. The image in the upper-left corner of Figure 6f shows that the vectors near the bottom edge of the port have a tilt angle slightly bigger than the tilt angle of the outlet ports. On the other hand, vectors near the port’s upper edge have a tilt angle slightly smaller than the tilt angle of the port. Therefore, the jets’ vertical inclination angle for a nozzle with the OAV-behavior is almost identical to the nozzle’s outlet ports inclination angle. Additionally, notice that most of the vectors closest to the ports’ horizontal edges labeled with the letter ‘A’ point upwards at a very steep angle. This feature implies that the jets emerging from a nozzle displaying the OAV behavior have a wider vertical opening angle than a nozzle with the TSV-behavior. The image in the lower-left corner of Figure 6f and the right-hand side images in this figure shows that most of the vectors closest to the ports’ horizontal edges labeled with the letter ‘A’ point towards the same side. Therefore, the outlet jets for a nozzle with the OAV-behavior will impact unevenly on mold wide-walls. The implications for the product quality of this undesirable behavior were already discussed in the Introduction section.
Let us make the following definitions of the “oriented” volumetric flow to quantify the effect of the transition from the TSV to OAV-behavior on the nozzle exit jets.
Q L X = S L | U ˜ L X | d S
Q L Y = S L | U ˜ L Y | d S
Q R X = S R | U ˜ R X | d S
Q R Y = S R | U ˜ R Y | d S
In the previous equations, | U ˜ L X | , | U ˜ L Y | , | U ˜ R X | , and | U ˜ R Y | are the X and Y fluid velocity components leaving the nozzle through the left and right-hand exit ports, respectively. Additionally, S L and S R are external surfaces of the left and right-hand exit ports, respectively. Notice that with this definition, reverse flow is omitted. Therefore, Q L X and Q L Y can be interpreted as the volumetric flow leaving the nozzle through the left-hand exit ports oriented towards the mold wide-walls and the mold narrow-wall, respectively. Table 1 reports the calculation of the volumetric flows defined in Equation (1) for each of the nozzles analyzed in Figure 5 and Figure 6. This table also shows the ratio between the oriented flows on each of the outlet ports. Notice that the flow towards the mold wide-walls is small compared to the flow aligned with the YZ plane for the nozzles characterized with the TSV-behavior. However, transition to the OAV-behavior increases the flow towards the mold wide-walls considerably. Thus, the ratio between the oriented flows is increased by a factor ranging from five to six times.

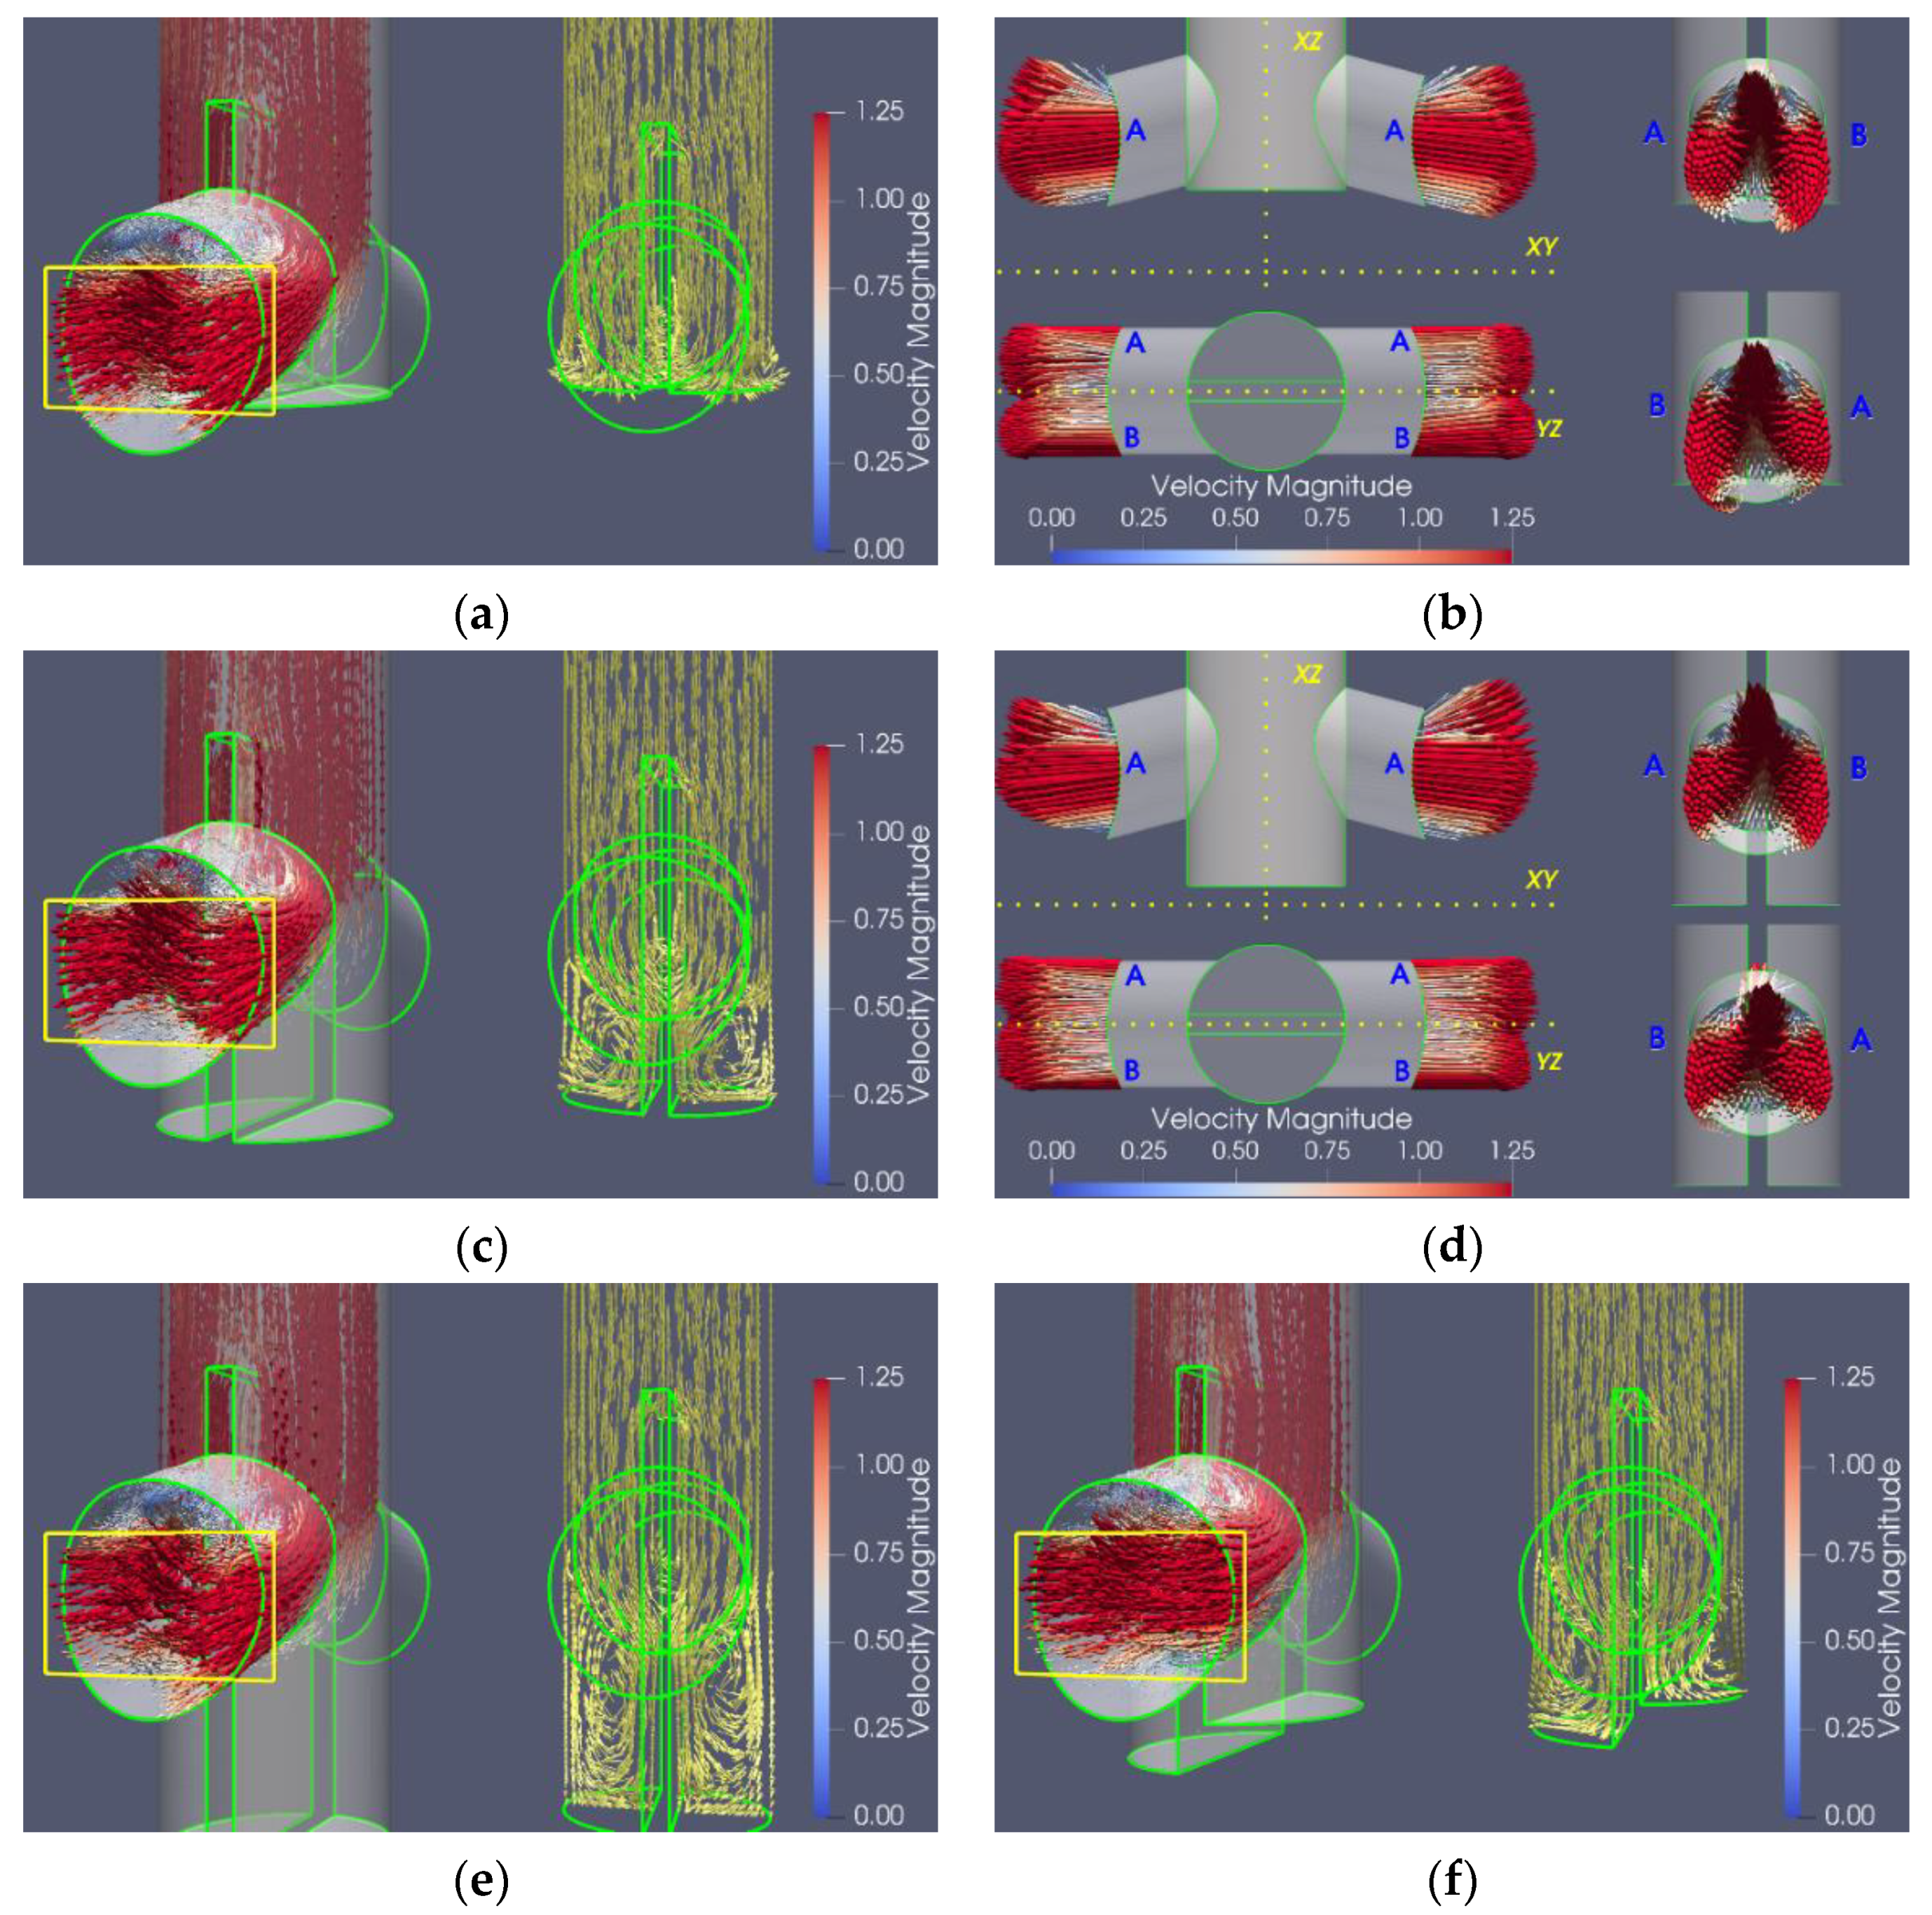
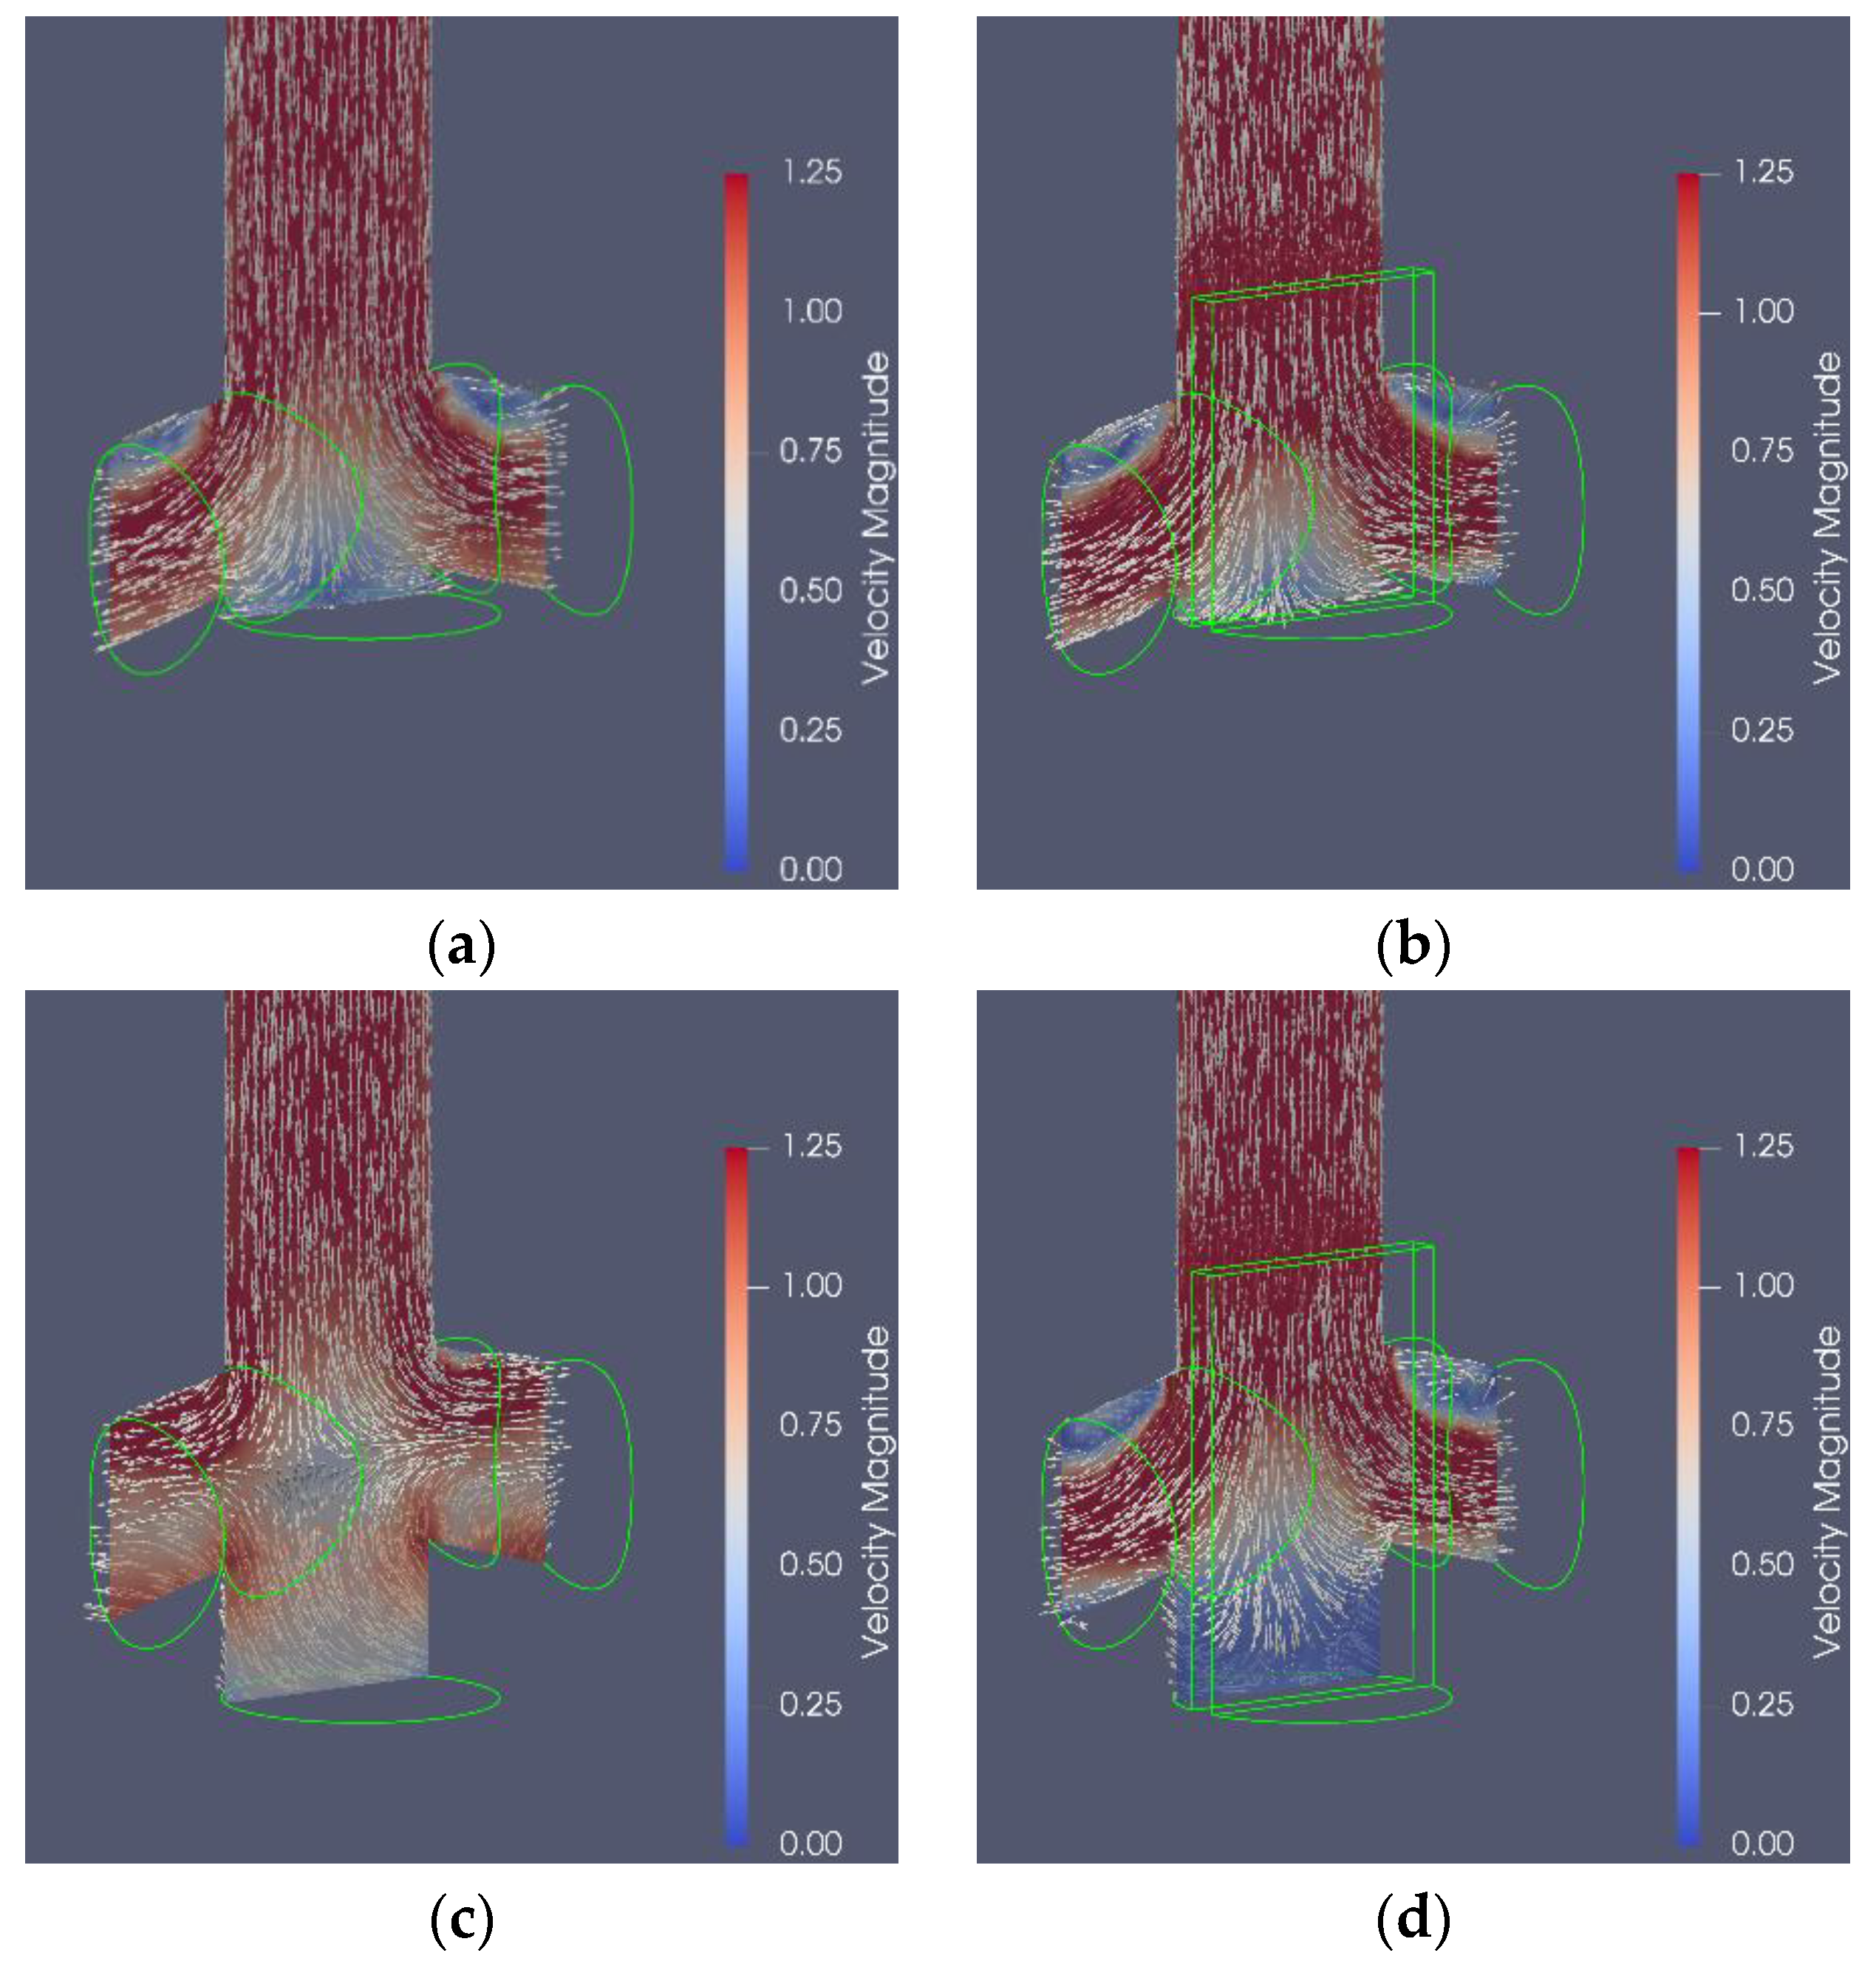
3.3. Analysis of the Hydrodynamic Behavior for Nozzles with Flow Divider

Brief performance analysis of the nozzle designs proposed in this work is presented in Figure 7, where four nozzles were evaluated. The first corresponds to a flat bottom nozzle with a flow divider, FBFD-nozzle. The rest are well bottom nozzles with a flow divider, WBFD-nozzles. In the second and third cases, the depths of the wells are 10 and 20 mm, respectively. Finally, the last nozzle is an unusual design considering the deposit of slag and impurities inside the nozzle. Therefore, the depths are not equal in each of the well-halves. In this nozzle, the depths of the well in each half are 5 and 10 mm. Figure 7a,c,e,f have the same structure as Figure 5a. Figure 7b,d have the same structure as Figure 5b.
All the images in Figure 7 confirm that the flow dividers satisfactorily accomplish their purpose. Furthermore, it can be observed in Figure 7a,c,e,f that the fluid flow pattern inside the nozzles matches the TSV-behavior in all the cases. This assertion is valid even for the nozzle with an extremely large depth-well and the nozzle with uneven well-depths. These figures also show that the addition of the flow dividers increases the extent of the reverse flow or low velocity zones already observed in the FB-nozzle. One of the zones is located near the port upper edge and the other is near the port lower edge. Thus, most of the fluid leaves the nozzle through horizontal strips close to the central zone of the outlet ports. A yellow rectangle highlights this horizontal strip. Notice that fluid velocity vectors near the middle of the upper edge of this strip point slightly upwards. Despite this, we can affirm that the vertical opening angle is minimal.
Figure 7b,d show that the velocity profiles for each jet are very similar but not identical. These figures show that all the vectors are almost parallel to the YZ plane. Thus, the horizontal spread angle is almost zero. The calculation of the directed volumetric flows allows us to support this statement quantitatively. Table 2 reports the calculation of the oriented volumetric flows and their ratios for each of the nozzles analyzed in Figure 7. The flow ratio values were already small for the FB-nozzle (5.3 and 6.3), but they are even smaller for the FBFD-nozzle (4.5 and 4.1). Notice that for the WB-10 nozzle, the flow divider decreases the ratios between the oriented flows by factors close to five times. Similarly, the oriented volumetric flow ratio values for the WBFD nozzle with 20 mm of well-depth are almost one-third of the values for a nozzle without dividers with 10 mm of well-depth. In summary, the FBFD and the WBFD designs produce jets that emerge from the nozzle collimated, with an almost zero horizontal angle and a vertical angle slightly smaller than the port’s tilt angle.
Figure 8 shows the fluid velocity maps on a slice perpendicular to the out-let ports planes. This figure also shows the fluid velocity vectors, colored in white and having the same scale. This slice is shifted 3.0 mm from the center to consider the presence of the flow divider. Figure 8a,b show that, for the flat bottom nozzle, the modification of hydrodynamic behavior inside the nozzle induced by the flow divider is negligible. On the contrary, the flow divider modifies considerably the fluid flow pattern for a nozzle with bottom well (Figure 8c,b). Specifically, there is a stagnation point at the bottom of the WBFD model and faster and narrower exit flow as compared to the WB model. Notice also the great similarity between the flow patterns of the FBFD and WBFD nozzles.
In addition, three particular systems are evaluated to complete the analysis of the performance of the flow dividers proposed in this work. The first two systems are a FB-nozzle and a FBFD-nozzle, where the flow entering into the nozzle is not fully vertical. Instead, the liquid enters into the nozzle inclined 15° about the vertical on the XZ plane. These systems will be named Case I and Case II. The Case I mesh is the same as the FB-nozzle reported in Figure 5, whereas the Case II mesh is the same as the FBFD-nozzle reported in Figure 7a,b. The motivation to study these systems is as follows. Typically, in casting machines the entering flow is symmetric when the flow control system in the tundish, sliding gate or stopper, is fully open. However, when the flow control system is partially open, the fluid flow pattern changes, modifying the flow in the mold, as already widely reported in the literature.
Figure 9a,b report the behavior of the fluid velocity vectors at the exit ports for Case I and Case II, respectively. Figure 9a shows that the inlet flow inclination produces symmetry loss, the characteristic feature of a FB-nozzle. Figure 9b shows that the flow divider acceptably fulfills its function. The flow divider does not make the outlet jets symmetrical about the YZ plane. However, it considerably reduces the vertical opening angle of the outlet jets and makes the horizontal opening angle very close to zero. This analysis is quantitatively supported by evaluating the oriented volumetric flow at each outlet port. The results of these calculations are reported in Table 3. Notice that the flow divider reduces the oriented volumetric flows ratio by a factor of three to four times.
The design evaluated in this work aims to divide the cavity at the lower part of the nozzle into two equal parts. Furthermore, it was stressed that the flow divider must be aligned with the YZ plane perpendicular to the outlet ports planes to make the outlet jets compact and symmetrical. All the systems analyzed previously confirm this hypothesis.
In order to illustrate the effect of flow divider orientation, in the last specific system analyzed in this work, Case III, the flow divider is aligned with the XZ plane, and thus, parallel to the outlet ports planes. It is important to emphasize that the flow entering into the nozzle is perpendicular to the XY plane in this system. Figure 9c,d show that the flow divider aligned this way does not produce the desired behavior. The outlet jets are far from being symmetrical about the YZ axis. There is indeed a small reduction in the vertical opening angle of the outlet jets, but the horizontal opening angle is still very large. Again, this analysis is confirmed by observing the ratios of the oriented volumetric flow at each outlet port reported in Table 3.

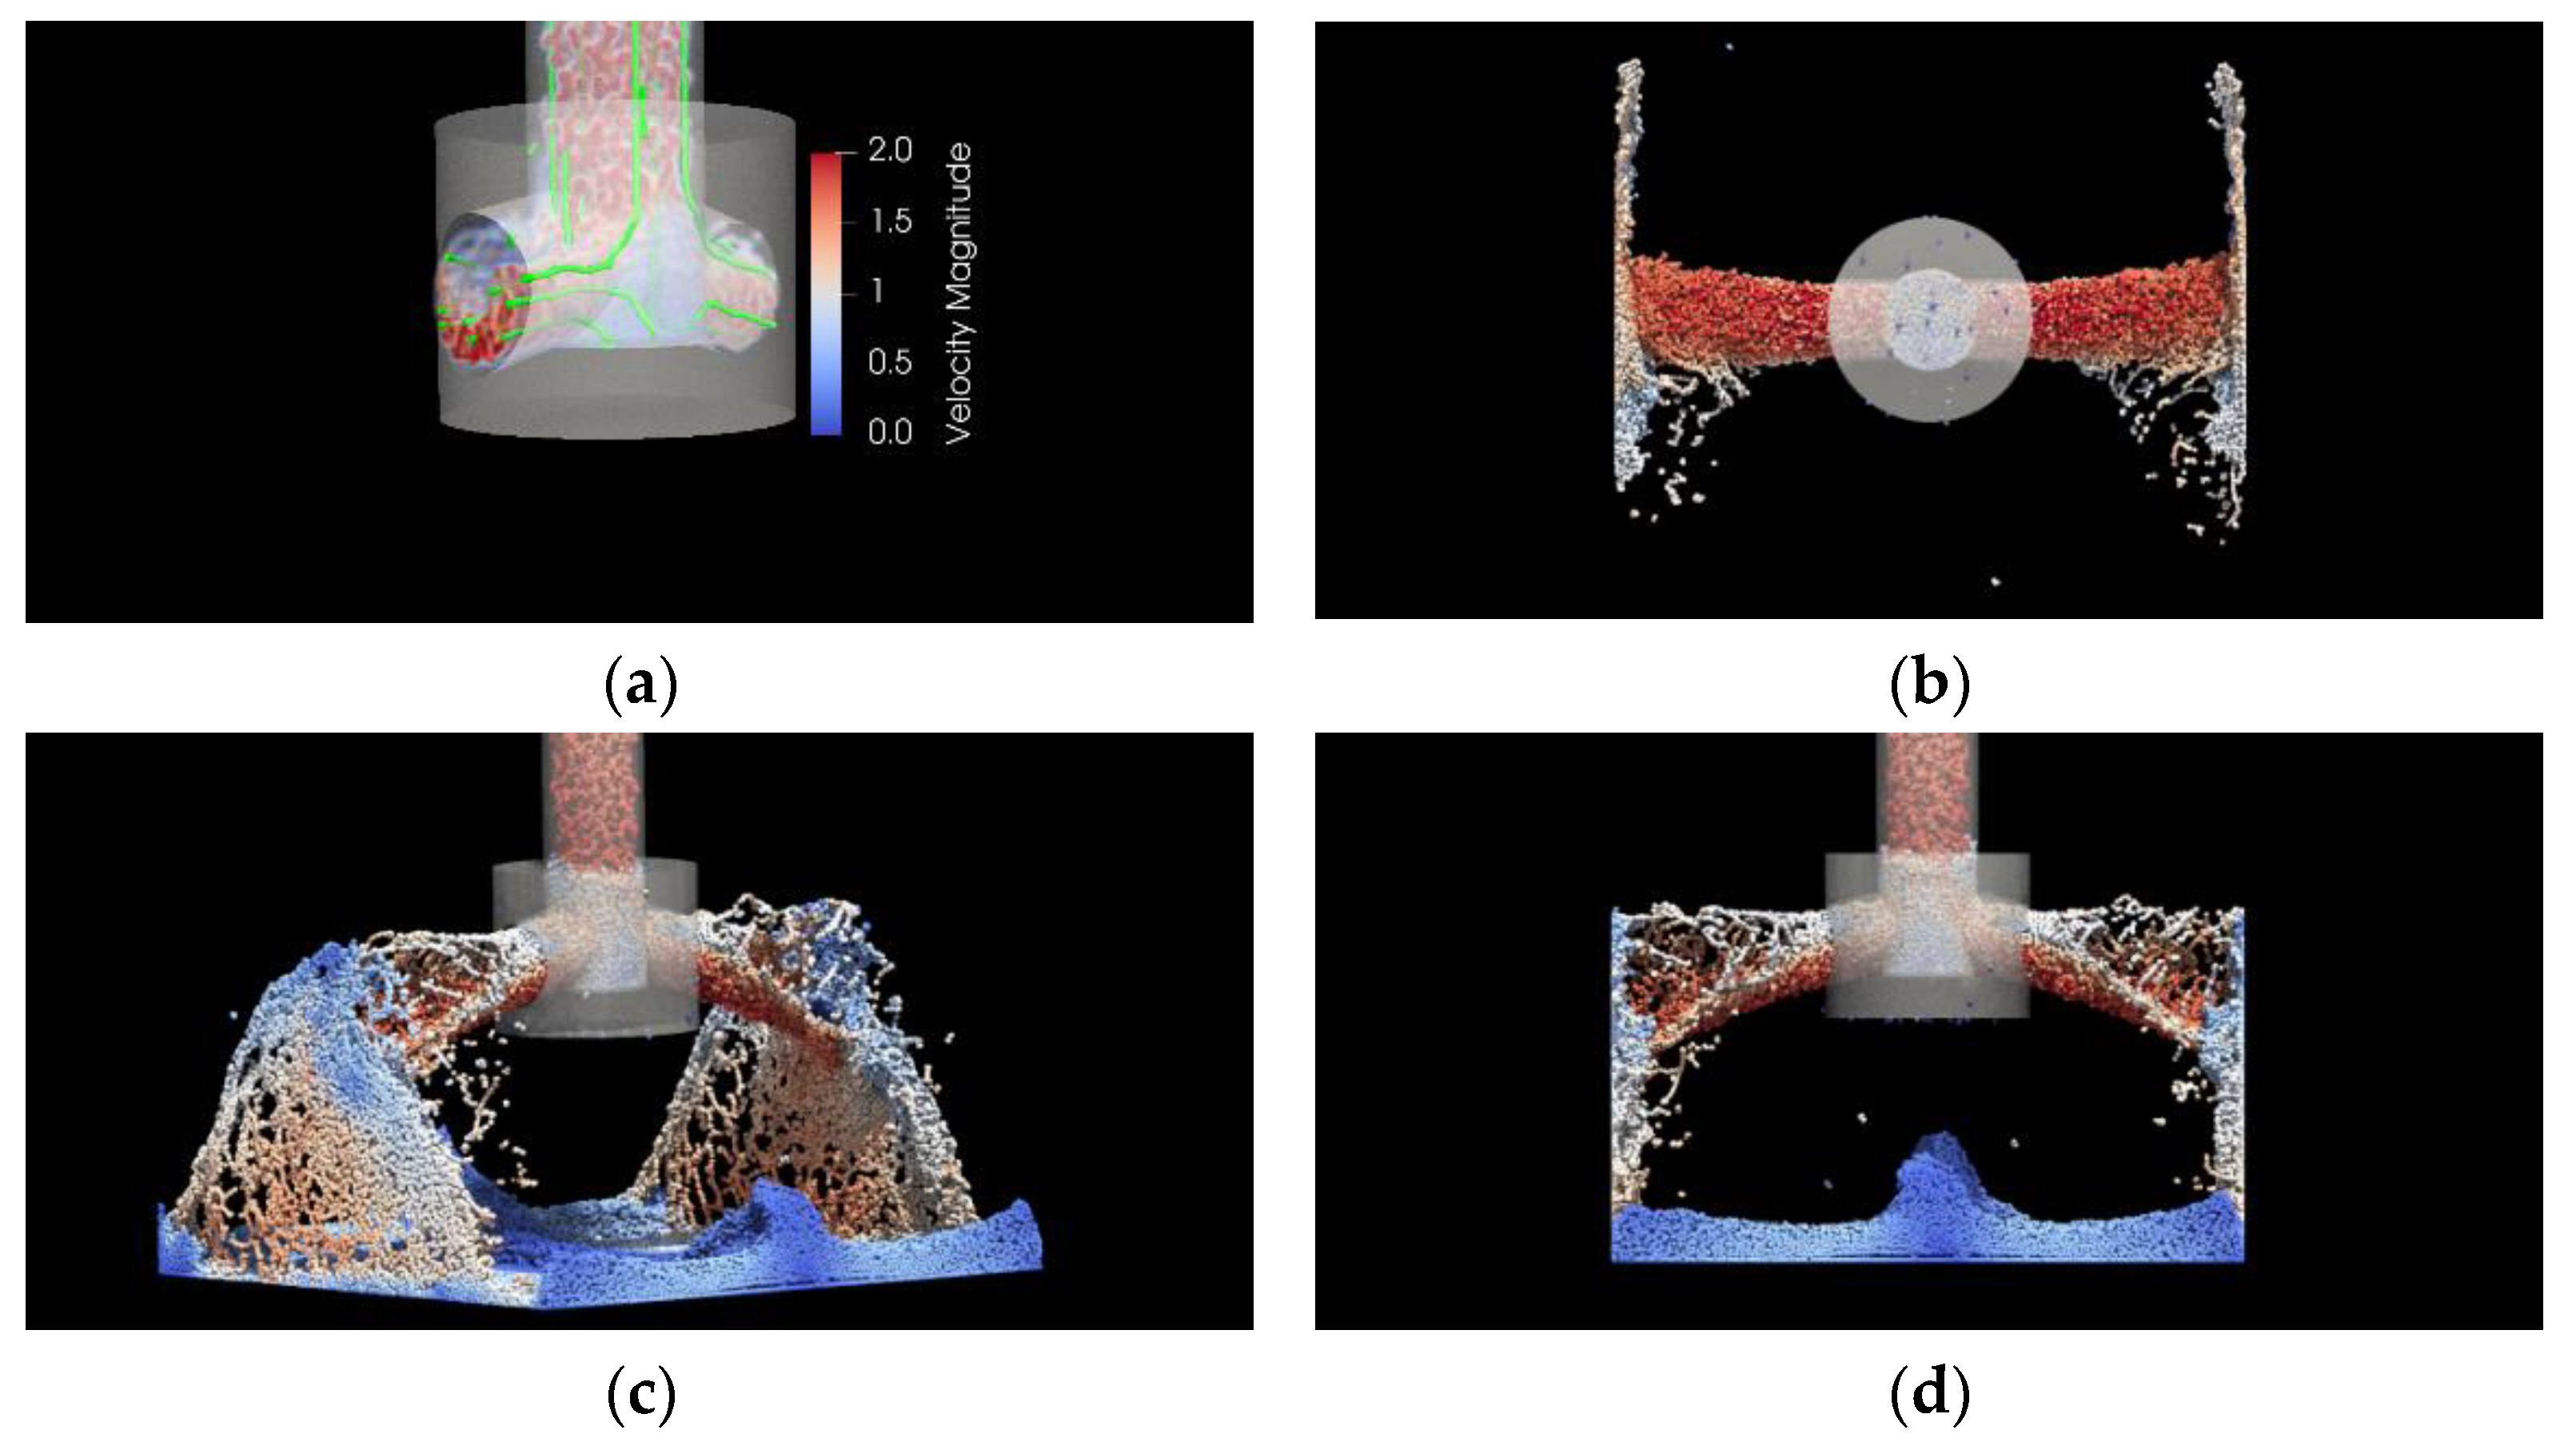
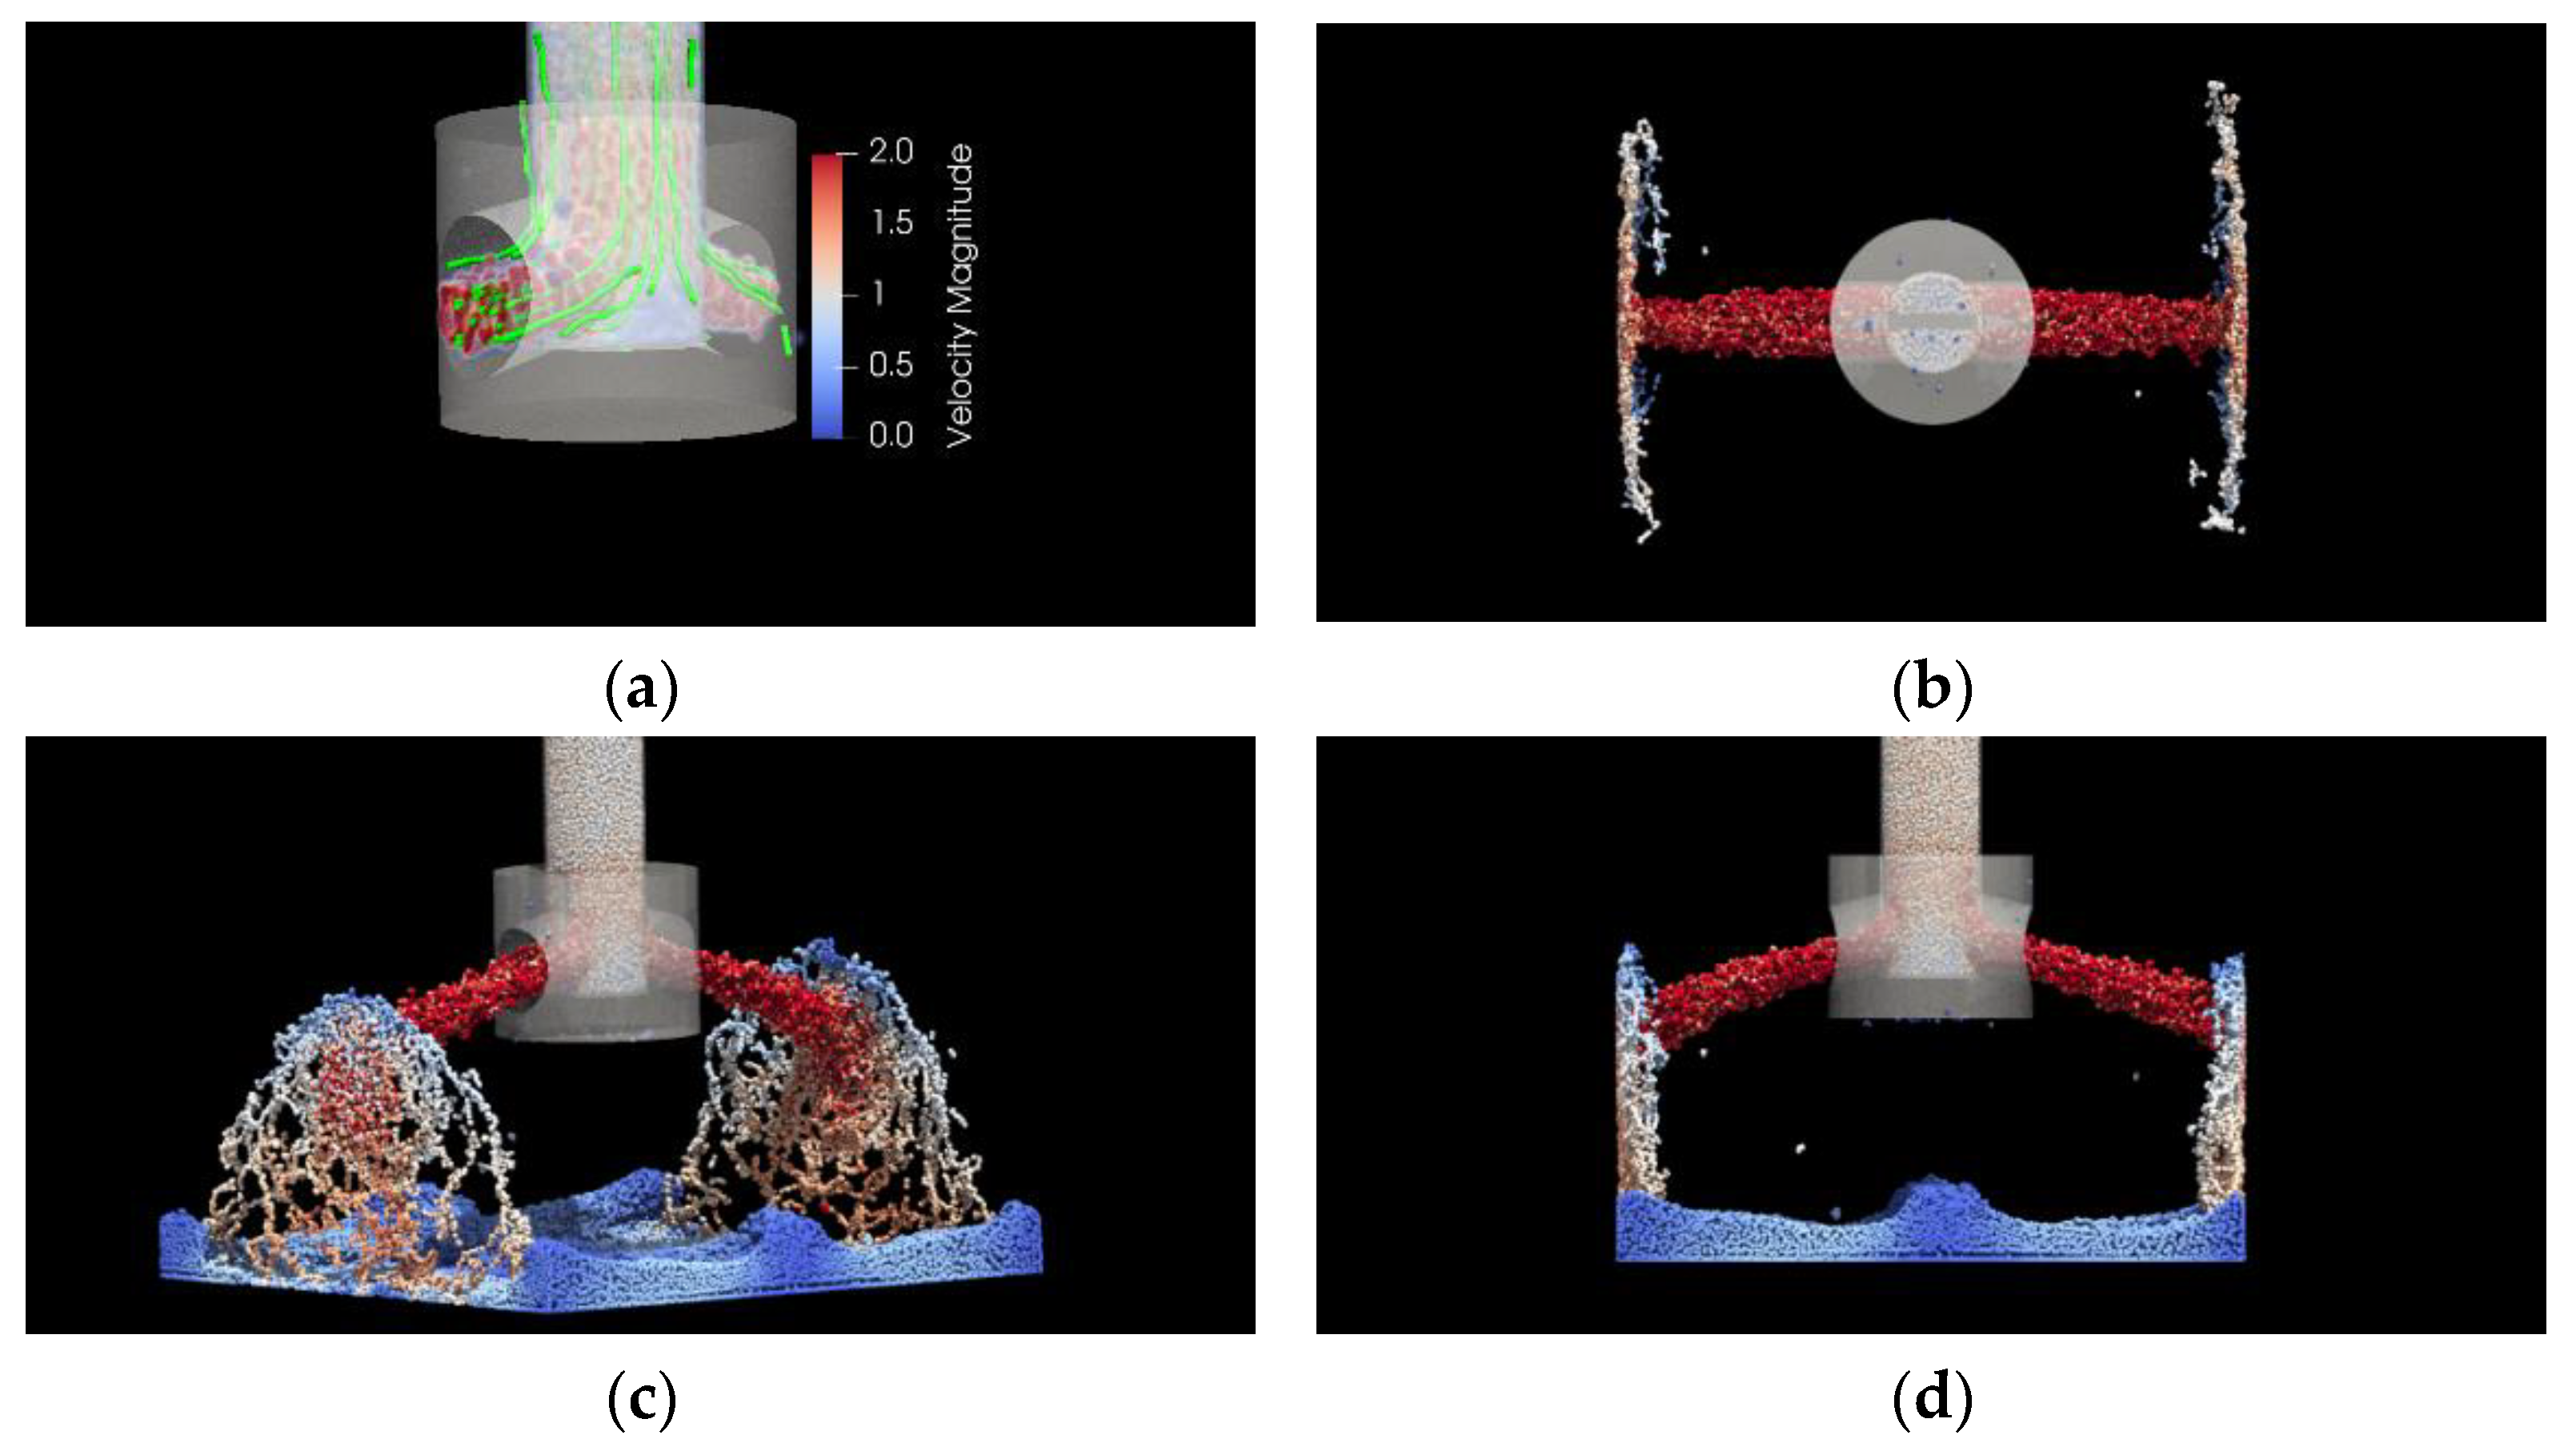
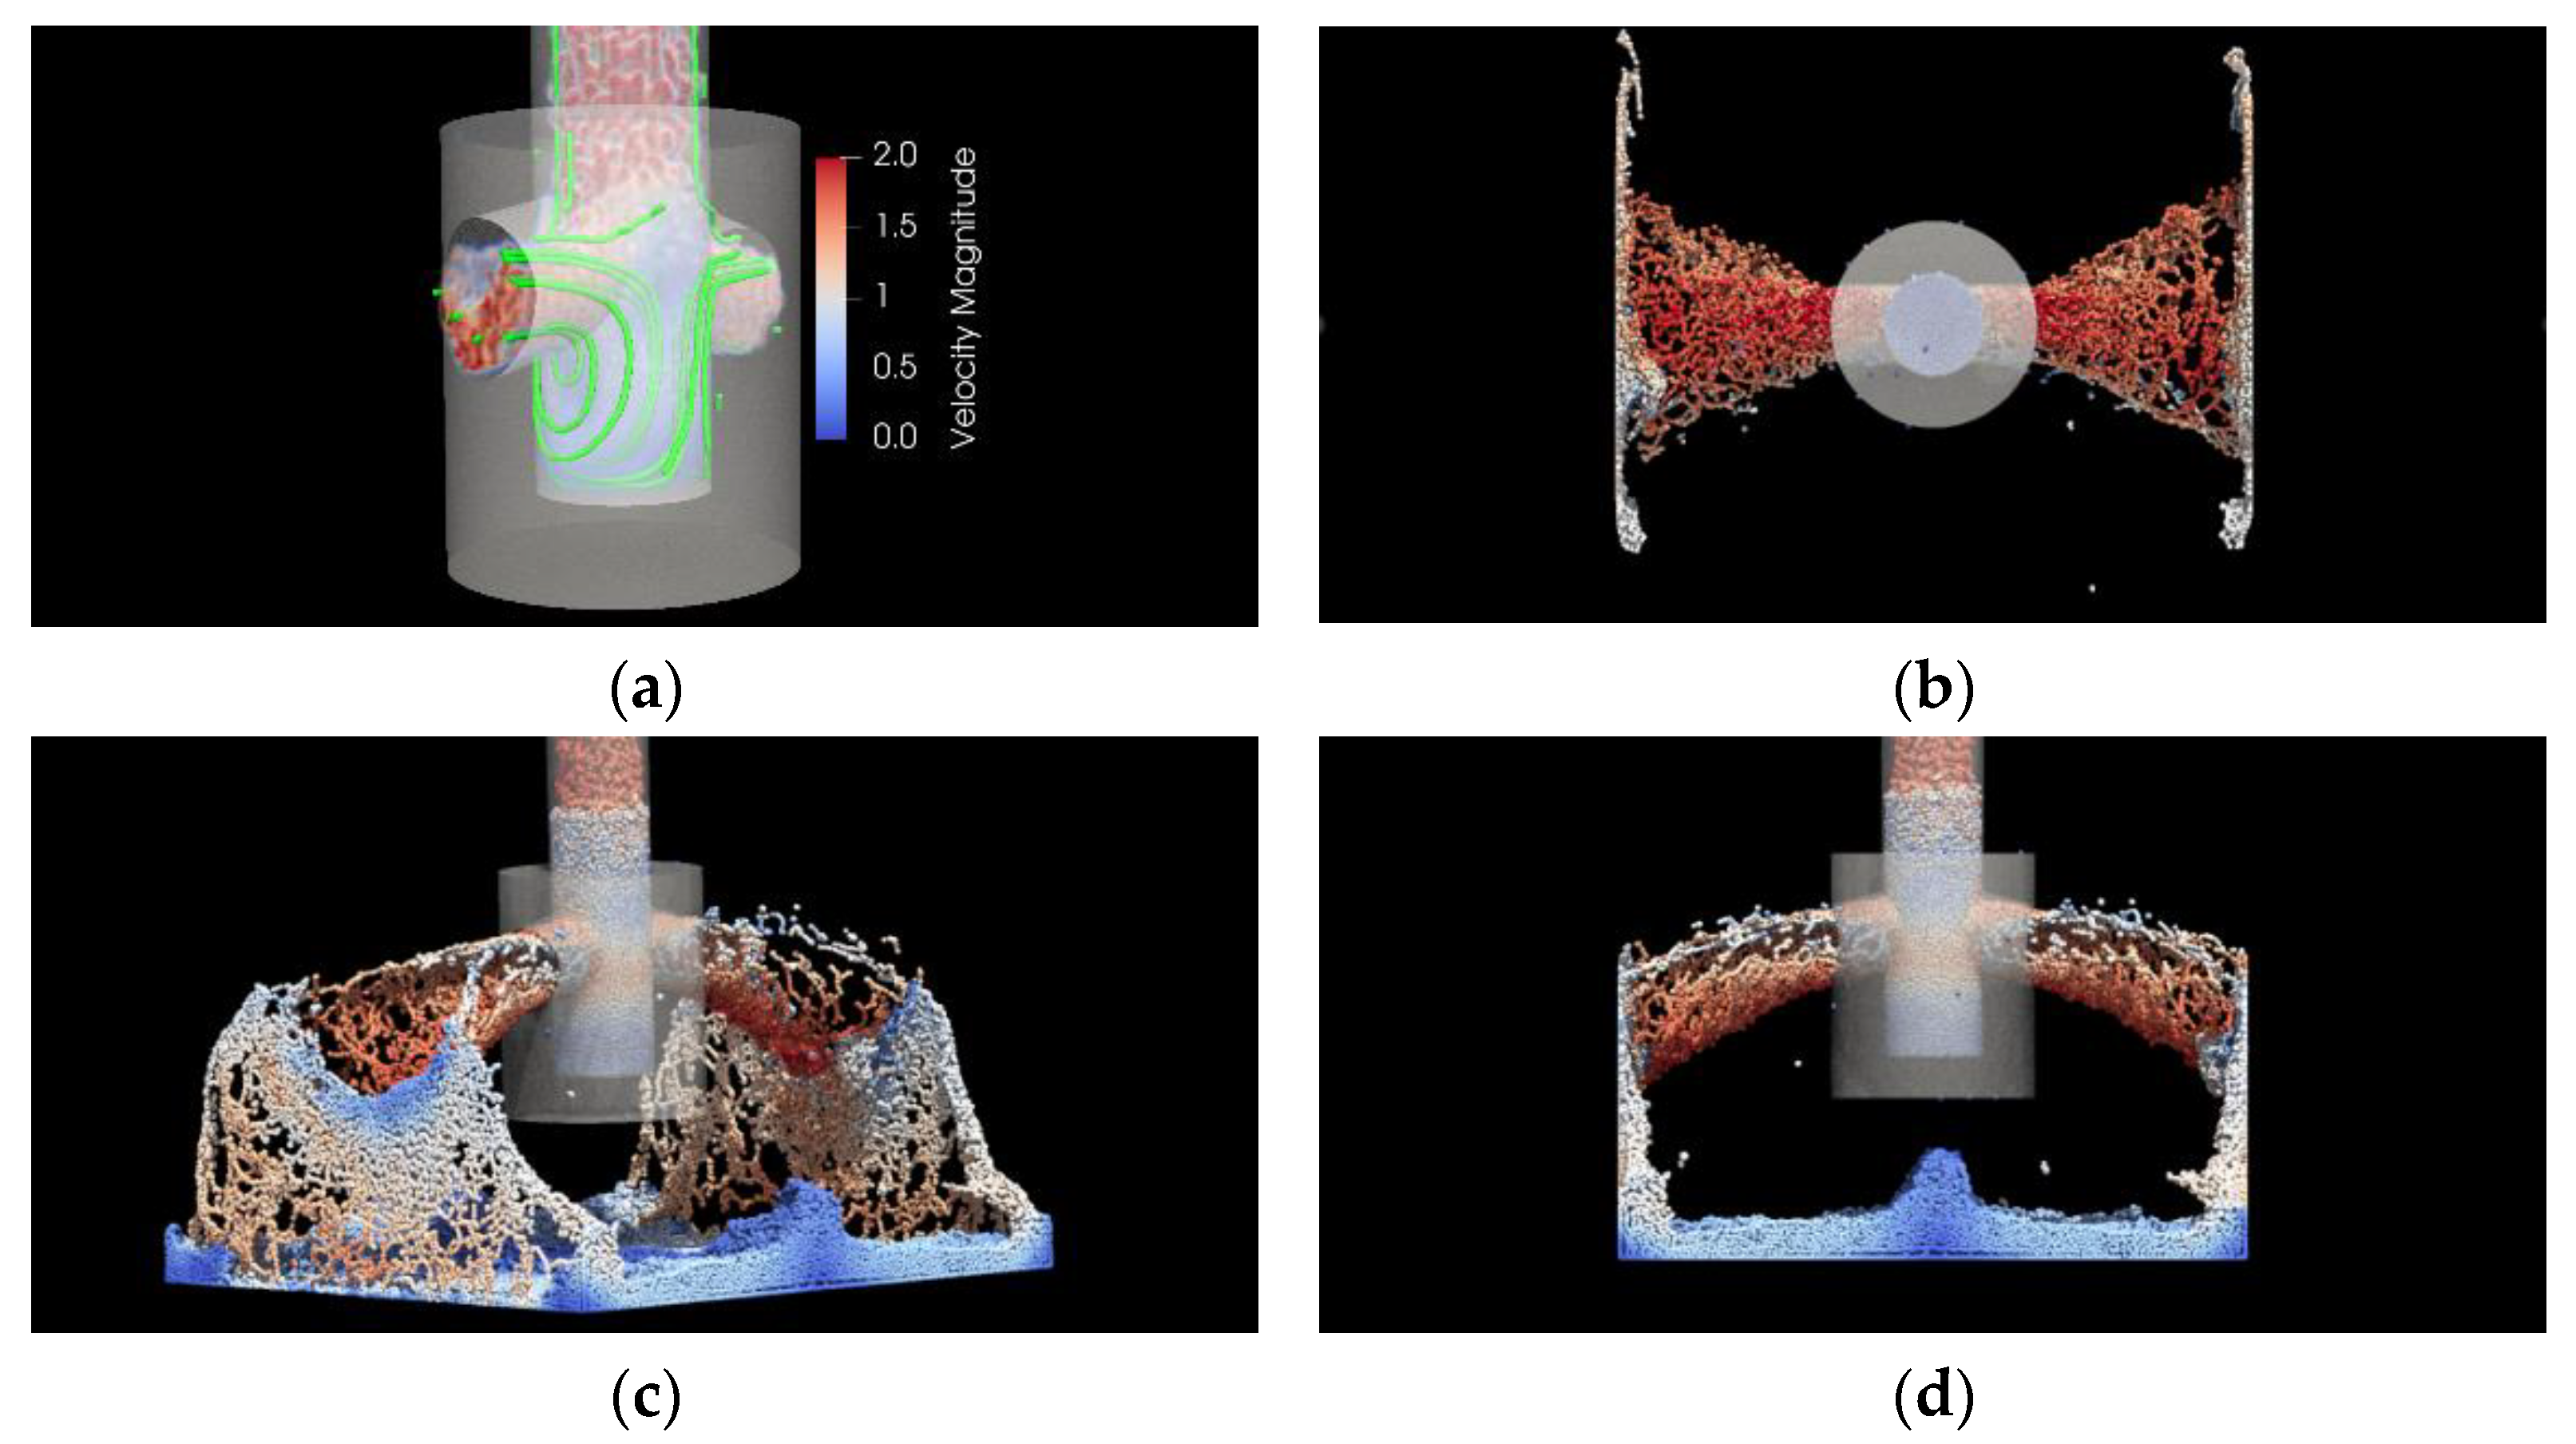
4. Performance Analysis Using SPH Simulations

The numerical simulations presented in the previous section showed that the flow detector produces smooth and symmetric patterns on both exit ports. As was determined in the previous works [16,17], the properties of the jets emerging from the ports are mainly determined by the flow pattern formed at the bottom of the SEN. The results presented in the latter section explored only the interior flow features. However, the complete flow structure simulations are necessary to fully explore the jets’ properties. Characteristics of the jets are usually studied by experiments in which these are al-lowed to exit freely into the atmosphere [6,7]. To investigate the structure and the properties of the jets discharging into the air with a mesh-based code would require multiphasic simulations that are computationally expensive. Methods such as Smoothed Particles Hydrodynamics can easily treat the open surface flows. This section presents the results of such simulations made with a GPUSPH code [27]. Details on the code application and numerical parameters are given in [17,28].
In order to prepare the SPH initial conditions, the geometries of the SEN models described in Section 2 were meshed with triangular elements and then transformed to particles with a mean separation of 1 mm. Four configurations shown in Figure 4 are studied.
A weakly compressible SPH formulation is used with the stabilization scheme proposed by Ferrari et al. [29], and the κ ε turbulence model with the same parameters as given in the Section 3. Water is used as a working fluid with kinematic viscosity at normal conditions. Water enters into the nozzle with a parabolic velocity profile with the average fluid velocity V e = 1.15   m / s . Later, the flow accelerates due to gravity in the bore. At the bottom, the fluid discharges freely from the exit ports into a rectangular cell. The cell itself has dimensions of the visualization cell described in Section 5. In order to reproduce the configurations with asymmetric inflow (labeled as Case I and Case II in previous section), we introduce flow asymmetry at the inlet for all models described below.
Qualitative analysis of the results can be made by comparing the shapes and velocities of the jets for each geometry. The following figures show different SENs viewed half a second after the beginning of simulations. Each panel of Figure 10, Figure 11, Figure 12 and Figure 13 shows the following: (a) the flow streamlines; (b) a projection onto the XY plane, viewed from the bottom of the SEN; (c) perspective view of the jets; (d) a projection onto the YZ plane.
The configuration of a standard FB-nozzle is given in Figure 10. The SEN streamlines (Figure 10a) display two main flow patterns: one goes directly into the exit ports, and the other goes to the bottom, making a swirl and then exiting. Vertical jet dispersion seen as a curtain in Figure 10d is precisely due to the latter. The jets are asymmetric hollow cones (see Figure 10b) that impact the cell walls nearly at the same angle as the exit ports (see Figure 10d), drawing a swirling pattern on the walls. This configuration can be directly compared to the Case I shown in Figure 9a where strong jet rotation can be observed.
The flow divider changes the flow dynamics and thus the jet shapes, as observed from the streamlines of Figure 11a. Almost all of the flow goes directly to the exit, except a small stagnation point at the bottom. This behavior, in turn, produces high-speed homogeneous jets. The jets themselves are symmetric, very narrow, with conical shapes, impacting the walls with their narrow end. No dispersion in the vertical direction is present, and the jets do not touch the upper and lower surfaces of the exit ports, as seen in Figure 11c,d. This model corresponds to the Case II shown in Figure 9b where despite some asymmetry the jets are non-rotating.
As was already mentioned above, the presence of a bottom-well changes the flow inside the SEN, giving rise to a single dominant vortex, i.e., OAV-behavior. Figure 12 shows such a situation for model WB-20, where the panel (a) streamlines depict the dominant vortex at the bottom-well zone, causing the majority of the flow to have a swirling motion before leaving the SEN. This vortex, in turn, produces very open hollow conical shape jets as seen in the panels (b), (c), and (d). As compared with the results shown in Figure 10, the jets, in this case, have a considerable horizontal dispersion.
Finally, the same model but with a flow deflector, WBFD-20, is displayed in Figure 13. Again, the streamlines show that most of the flow is directed to the exit ports due to fluid cushions formed in both sections of the bottom-well (see Figure 13d). Similar to the case shown in Figure 11, the flow momentum is not lost in vortex formation but is channeled through the jets. Again, the jets are very narrow and parallel to the exit ports and do not touch their upper and lower parts.
The above results show that the flow divider drastically changes the flow properties producing strong narrow jets. The simulation with the well-depth of 0.01 m (not shown here) also produces patterns as shown in Figure 11 and Figure 13, which lead us to conclude that jets are robust against the influence of the well-depth. Thus, the overall behavior of the SEN models is well in agreement with the findings described in Section 3.

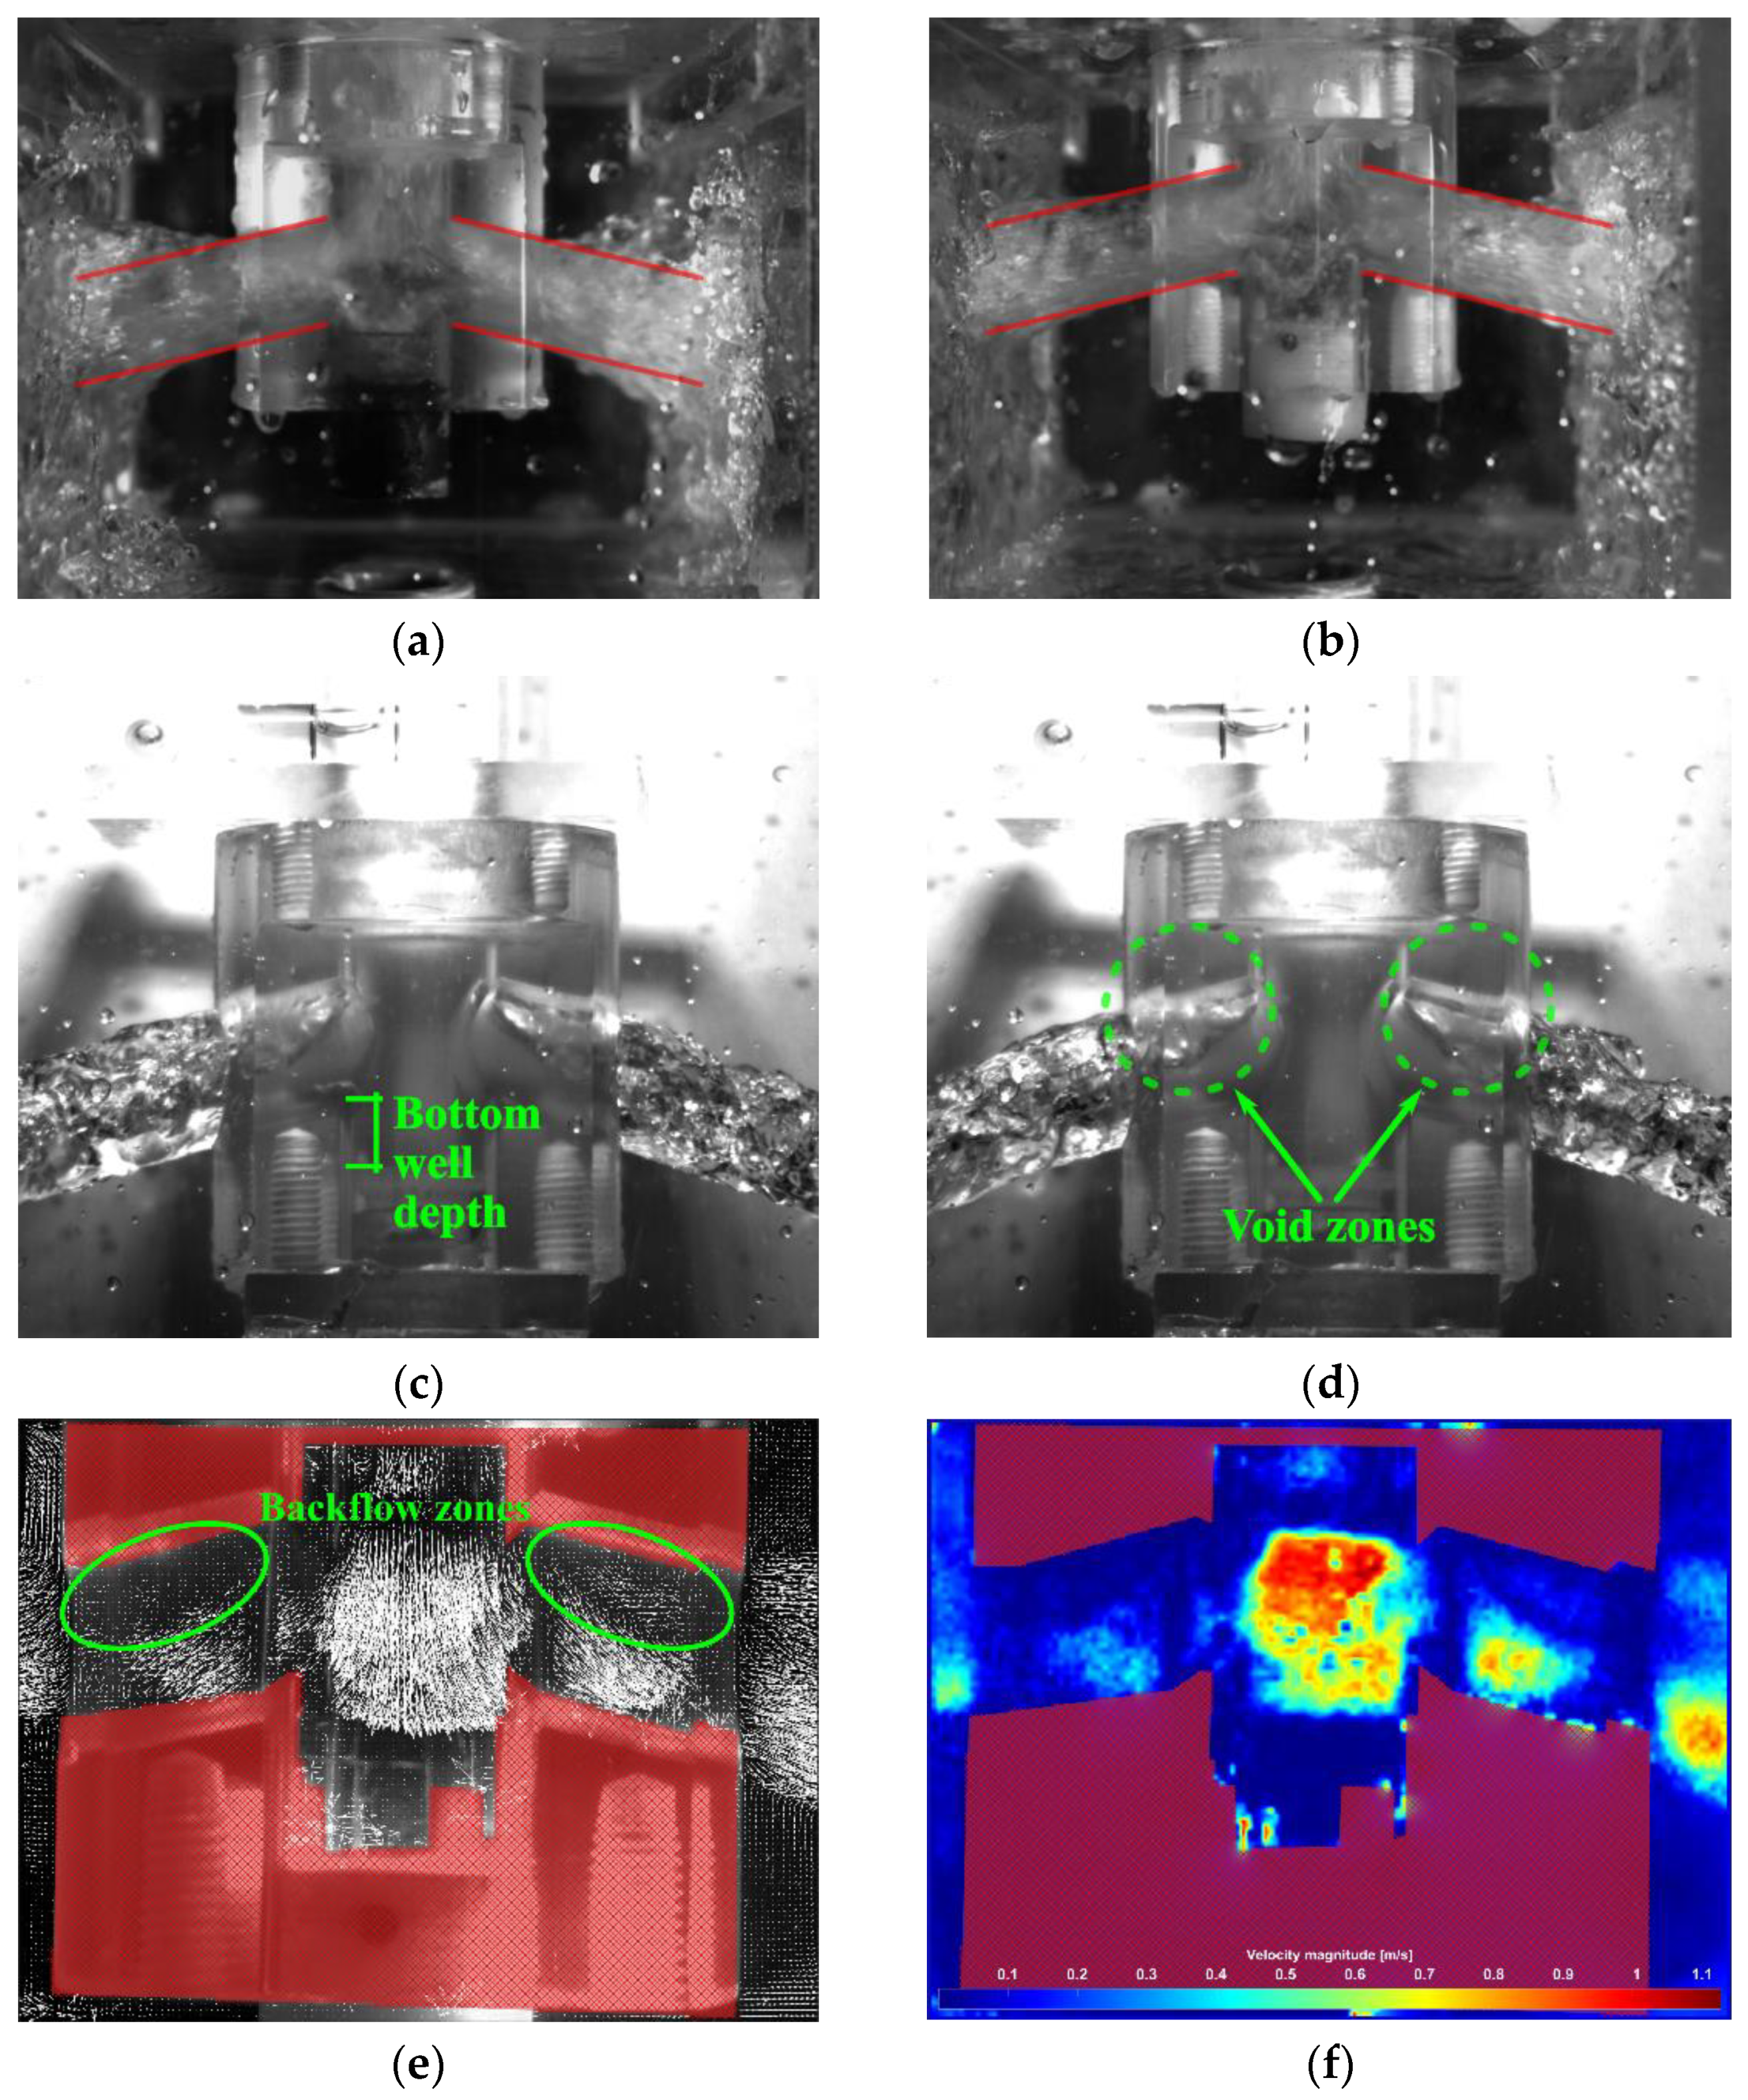
5. Performance Analysis Using Experimental Tests

The experimental tests were carried out on the same experimental rig reported in [15,17]. The experimental installation consists of a “visualization cell”, a rectangular prism made of translucent acrylic. Its square base has 0.135 m on the side and a height of 0.200 m. A closed hydraulic circuit was designed to supply the water from a tank located at the bottom of the experimental rig, and then, the liquid enters into the system from the top. The volumetric flow was measured by a calibrated flow meter. Further details about the experimental installation can be found in the works mentioned above.
A Speedsense 9040 camera was used in the visualization and PIV experiments. It was configured to capture high resolution photographs of 1600 × 1200 pixels [30]. The total number of images in each experiment was 2000, with the display refresh period of 0.100 s and the time between frames was 0.0002 s with a trigger rate of 500. A LED light source model SLXLS-FL with 0.180 m × 0.140 m × 0.100 m dimensions, 20 W of electrical power, and 120° of light aperture illuminates the visualization plane within the models. A DualPower 15-1000 laser source of 150 W was used to generate the light plane and measure the flow characteristics in the PIV tests [31].
The geometric characteristics of the nozzles used in the experimental simulations were already described in Figure 4. The experiments were divided into two: visualization and PIV. Similarity laws were applied to scale the experimental conditions to reproduce using laboratory installations. The turbulent flow conditions of the tests were obtained and reproduced based on industrial plant conditions.
The visualization results for the WB-nozzle and the WBFD-nozzle are presented in Figure 14a,b, respectively. In these experiments, the nozzle discharges the water jets freely into the atmosphere. The bottom-well depth is, in both cases, 0.010 m. After the hydraulic circuit was turned on and the liquid had filled the inner nozzle volume, 2000 images were taken along two seconds time lapse. For each case, the images were analyzed, and one representative photograph of the behavior of the jets was selected. Red-colored lines parallel to the exit ports’ direction were used to highlight the aperture angle of the water exit jets.
The internal flow was difficult to visualize because of the model’s geometry and the material from which it is made. However, the jets are clearly seen in both figures and how the SEN models form different jet exit angles. The influence of the deflector on the flow dynamics in the WBDF-nozzle shows a lower jet exit aperture angle than the one presented by the WB-nozzle. These experimental results have strong similarities with the SPH numerical simulations, besides the jet aperture angle. Figure 14c,d report two instants of the same WBFD-nozzle experimental test, where the lighting conditions were modified to enhance visualization of the fluid pattern inside the exit ports. As predicted by the SPH numerical simulations, these figures show void zones located at the ports’ upper section.
Figure 14e,f report the PIV experiments results for the WBFD-nozzle submerged in water inside the visualization cell. In order to analyze the influence that flow divider has on both exit ports, the entire span of the nozzle was studied. Particle tracers were seeded in the water. The hydraulic system was turned on, so water fills the cell. After one minute, the system reaches a stable operation. The high-speed camera also was used to record 2000 images for two seconds of the experiment. The laser sheet was shifted in front of the internal flow deflector to avoid reflections from it. The photographs were recorded and processed using the PIV infrastructure reported in [15,17]. The red-colored zone in Figure 14e,f indicates the masking region of the image, which was not processed by the PIV software. Figure 14e,f show the mean result of the processing of 116 pairs of images. In Figure 14e, the reconstructed fluid flow pattern is presented using white-colored vectors, scaled according their velocity magnitude. The velocity fields on the left and right-hand exit ports are not the same at this observation plane. This result could be explained as follows. The experimental tests shown in these figures used a laser light source directed from right to left. Therefore, the particles on the left side of the nozzle look less bright than the particles on the right side. From Figure 14e,f, it is possible to observe that the jet flow exits the nozzle using the lower half of the exit ports preferentially. Additionally, recirculation or backflow zones can be observed at the upper half of the exit ports. These results agree with the behavior obtained using CFD numerical simulations, as shown in Figure 9d.
The experimental results presented in this section confirm the findings using two numerical techniques, giving robust support for the new SEN design and fulfilling the requirements for the jet characteristics.

6. Conclusions

Producing narrow focused jets is of utmost importance in the continuous casting process. Flow that does not lose its energy in swirling motion or friction with the walls of the exit ports can fill efficiently and homogeneously wide casting slabs. Application of two different techniques on different regions of interest allowed us to explore the flow dynamics inside and outside the SEN models. The velocity fields inside the SEN and close to the exit ports, obtained with the CFD technique, showed a complex pattern and existence of inflow regions in the ports. The SPH simulations showed that proposed modification of the SEN geometry produces narrow jets that are not sensitive to the well depth and inflow asymmetry.
Optimizing flow divider length and thickness is out of the scope of this work; however, these two characteristics of the flow divider are crucial because they determine the structural stability of this element to resist the stresses generated by the flowing molten steel. Nevertheless, the flow divider height must surpass the outlet ports’ upper edges to obtain the desired behavior. This characteristic will be addressed in future work.
We have shown that placing the flow divider perpendicular to the exit ports planes helps to produce regular, symmetric jets, and the influence of the well depth on the jets’ intensity and asymmetry is diminished. The flow divider inhibits the vortexes’ interaction with each other inside the SEN, thus allowing them to develop independently. The interaction of vortexes occurs rather in the jets, as they leave the SEN through the exit ports.
The overall effect of the newly proposed SEN inner flow divider is that it produces compact outlet jets with more energy than a standard bifurcated SEN. However, this behavior could produce higher fluid velocity magnitudes near the slag-molten steel interface, increasing the severity of the meniscus fluctuations and, thus, the slag entrapment. Therefore, further analysis must be carried out to solve the trade-off between symmetry inside the mold and slag entrapment.

Author Contributions

Conceptualization, J.G.-T., C.A.R.-R. and J.R.M.-T.; methodology, J.G.-T., C.A.R.-R., J.R.M.-T. and I.C.-M.; experimental tests, C.A.R.-R., F.S.-S. and I.C.-M.; numerical simulations, J.G.-T., F.C.-d.-l.-T. and R.G.; writing—original draft preparation, J.G.-T., C.A.R.-R., J.R.M.-T., R.G. and I.C.-M.; supervision, J.G.-T., F.C.-d.-l.-T. and R.G.; funding acquisition, C.A.R.-R., I.C.-M., F.S.-S. and J.R.M.-T. All authors have read and agreed to the published version of the manuscript.

Funding

This work was partially supported by Universidad Autonoma Metropolitana, grant number 22703022, PRODEP, grant number 22711777, and Instituto Politecnico Nacional, grant number SIP-20201315.

Institutional Review Board Statement

Not applicable.

Informed Consent Statement

Not applicable.

Data Availability Statement

Data are contained within the article.

Acknowledgments

Numerical simulations were done using OpenFOAM v6 (OpenFOAM Foundation) and GPUSPH v4 software. Visualizations of numerical simulations were done using ParaView v5.6.1. The authors gratefully acknowledge the anonymous referees for their comments and suggestions.

Conflicts of Interest

The authors declare no conflict of interest.

References

  1. Liu, F.; Zhou, H.; Zhang, L.; Chen, W.; Ren, Y.; Wang, S.; Yang, W.; Zhang, X. Dependency of Flow Pattern in the Mold on the Distribution of Inclusions along the Thickness of Continuous Casting Slabs. Metall. Mater. Trans. B 2021, 52, 2536–2550. [Google Scholar] [CrossRef]
  2. Zhou, H.; Zhang, L.; Zhou, Q.; Chen, W.; Jiang, R.; Yin, K.; Yang, W. Clogging-induced asymmetrical and transient flow pattern in a steel continuous casting slab strand measured using nail boards. Steel Res. Int. 2021, 92, 2000547. [Google Scholar] [CrossRef]
  3. Hua, C.; Wang, M.; Senk, D.; Wang, H.; Zhang, Q.; Zhi, J.; Bao, Y. Cone Clogging of Submerged Entry Nozzle in Rare Earth Treated Ultra-Low Carbon Al-Killed Steel and Its Effect on the Flow Field and Vortex in the Mold. Metals 2021, 11, 662. [Google Scholar] [CrossRef]
  4. Lee, W.; Kim, J.G.; Jung, J.-I.; Huh, K.Y. Prediction of nozzle clogging through fluid–structure interaction in the continuous steel casting process. Steel Res. Int. 2021, 92, 2000549. [Google Scholar] [CrossRef]
  5. Vakhrushev, A.; Kharicha, A.; Karimi-Sibaki, E.; Wu, M.; Ludwig, A.; Nitzl, G.; Tang, Y.; Hackl, G.; Watzinger, J.; Eckert, S. Generation of Reverse Meniscus Flow by Applying An Electromagnetic Brake. Metall. Mater. Trans. B 2021. [Google Scholar] [CrossRef]
  6. Gupta, D.; Lahiri, A.K. Water modelling study of the jet characteristics in a continuous casting mould. Steel Res. Int. 1992, 63, 201–204. [Google Scholar] [CrossRef]
  7. Gupta, D.; Lahiri, A.K. A water model study of the flow asymmetry inside a continuous slab casting mold. Metall. Mater. Trans. B 1996, 27, 757–764. [Google Scholar] [CrossRef]
  8. Tsukaguchi, Y. Immersion Nozzle for Continuous Casting and Continuous Casting Method Using the Immersion Nozzle. U.S. Patent 20070158884A1, 12 July 2007. [Google Scholar]
  9. Yoshida, H.; Morishita, M. Split Nozzle with Immersion Weir. JP4686442B2, 25 May 2011. [Google Scholar]
  10. Schurmann, D.; Willers, B.; Hackl, G.; Tang, Y.; Eckert, S. Experimental Study of the Mold Flow Induced by a Swirling Flow Nozzle and Electromagnetic Stirring for Continuous Casting of Round Blooms. Metall. Mater. Trans. B 2019, 50, 716–731. [Google Scholar] [CrossRef]
  11. Gan, M.; Pan, W.; Wang, Q.; Zhang, X.; He, S. Effect of Exit Shape of Submerged Entry Nozzle on Flow Field and Slag Entrainment in Continuous Casting Mold. Metall. Mater. Trans. B 2020, 51, 2862–2870. [Google Scholar] [CrossRef]
  12. Kumar, M.; Mishra, P.; Roy, A.K. Analysis of Different Mould Section Sizes to Optimize the Submerged Entry Nozzle to Measure the Meniscus Fluctuation in a Continuous Casting Mould. Crystals 2021, 11, 564. [Google Scholar] [CrossRef]
  13. Lee, W.-H.; Yi, K.-W. Relationship between Fluid Flow Stability and Submerged Entry Nozzle Port Angle in a Conventional Slab Continuous-Casting Mold. Met. Mater. Int. 2020. [Google Scholar] [CrossRef]
  14. Deng, X.; Ji, C.; Cui, Y.; Li, L.; Yin, X.; Yang, Y.; McLean, A. Flow pattern control in continuous slab casting moulds: Physical modelling and plant trials. Ironmak. Steelmak. 2017, 44, 461–471. [Google Scholar] [CrossRef]
  15. Real-Ramirez, C.A.; Carvajal-Mariscal, I.; Sanchez-Silva, F.; Cervantes-de-la-Torre, F.; Diaz-Montes, J.; Gonzalez-Trejo, J. Three-Dimensional Flow Behavior Inside the Submerged Entry Nozzle. Metall. Mater. Trans. B 2018, 49, 1644–1657. [Google Scholar] [CrossRef]
  16. Gonzalez-Trejo, J.; Real-Ramirez, C.A.; Carvajal-Mariscal, I.; Sanchez-Silva, F.; Cervantes-De-La-Torre, F.; Miranda-Tello, R.; Gabbasov, R. Hydrodynamic Analysis of the Flow inside the Submerged Entry Nozzle. Math. Probl. Eng. 2020, 2020, 6267472. [Google Scholar] [CrossRef]
  17. Real-Ramirez, C.A.; Carvajal-Mariscal, I.; Gonzalez-Trejo, J.; Miranda-Tello, R.; Gabbasov, R.; Sanchez-Silva, F.; Cervantes-de-la-Torre, F. Visualization and measurement of turbulent flow inside a SEN and off the ports. Rev. Mex. Fis. 2021, 67, 1–10. [Google Scholar]
  18. Gonzalez-Trejo, J.; Real-Ramirez, C.A.; Miranda-Tello, J.R.; Gabbasov, R.; Carvajal-Mariscal, I.; Sanchez-Silva, F.; Cervantes-de-la-Torre, F. Influence of the Submerged Entry Nozzle’s Bottom Well on the Characteristics of Its Exit Jets. Metals 2021, 11, 398. [Google Scholar] [CrossRef]
  19. Kumar, M.; Mishra, P.; Roy, A.K. Experimental optimization of submerged entry nozzle submergence depth to reduce meniscus fluctuations: A water model study. Mater. Today Proc. 2021, 41, 426–430. [Google Scholar] [CrossRef]
  20. Wu, Y.; Liu, Z.; Wang, F.; Li, B.; Gan, Y. Experimental investigation of trajectories, velocities and size distributions of bubbles in a continuous-casting mold. Powder Technol. 2021, 387, 325–335. [Google Scholar] [CrossRef]
  21. The OpenFOAM Foundation. OpenFOAM v8 User Guide; The OpenFOAM Foundation: Bracknell, UK, 2020. [Google Scholar]
  22. Davidson, L. An Introduction to Rurbulence Models. Available online: http://www.tfd.chalmers.se/~lada/postscript_files/kompendium_turb.pdf (accessed on 15 January 2021).
  23. Liu, F. A thorough description of how wall functions are implemented in OpenFOAM. In Proceedings of CFD with OpenSource Software; OpenCFD: Bracknell, UK, 2016; pp. 1–33. [Google Scholar]
  24. Geuzaine, C.; Remacle, J.-F. Gmsh: A 3-D finite element mesh generator with built-in pre- and post-processing facilities. Int. J. Numer. Methods Eng. 2009, 79, 1309–1331. [Google Scholar] [CrossRef]
  25. Chaudhary, R.; Lee, G.-G.; Thomas, B.G.; Kim, S.-H. Transient Mold Fluid Flow with Well- and Mountain-Bottom Nozzles in Continuous Casting of Steel. Metall. Mater. Trans. B 2008, 39, 870–884. [Google Scholar] [CrossRef] [Green Version]
  26. Real, C.; Miranda, R.; Vilchis, C.; Barron, M.; Hoyos, L.; Gonzalez, J. Transient Internal Flow Characterization of a Bifurcated Submerged Entry Nozzle. ISIJ Int. 2006, 46, 1183–1191. [Google Scholar] [CrossRef]
  27. Rustico, E.; Jankowski, J.; Hérault, A.; Bilotta, G.; Del Negro, C. Multi-GPU, multi-node SPH implementation with arbitrary domain decomposition. In Proceedings of the 9th International SPHERIC Workshop, Paris, France, 3–5 June 2014. [Google Scholar]
  28. Gabbasov, R.; González-Trejo, J.; Real-Ramírez, C.A.; Molina, M.M.; la Torre, F.C. Evaluation of GPUSPH Code for Simulations of Fluid Injection Through Submerged Entry Nozzle. In Supercomputing; Springer: Cham, Switzerland, 2019; pp. 218–226. [Google Scholar]
  29. Ferrari, A.; Dumbser, M.; Toro, E.F.; Armanini, A. A new 3D parallel SPH scheme for free surface flows. Comput. Fluids 2009, 38, 1203–1217. [Google Scholar] [CrossRef]
  30. Vision Research. Phantom Camera Control Help File; Vision Research—AMETEK Material Analysis Division: Mahwah, NJ, USA, 2011. [Google Scholar]
  31. Litron Lasers Ltd. Litron Pulsed Laser Control Software; Litron Lasers: Rugby, UK, 2014. [Google Scholar]
Figure 1. Schematic description of the hydrodynamic behavior inside the mold. (a) Double-roll symmetric behavior. (b) Low asymmetric behavior with slag entrainment by shear-layer instability. (c) Severe asymmetric behavior with slag entrainment by vortex formation.
Metals 11 01437 g001
Figure 2. SEN inner geometry characteristics for the three most common designs and two specialized ones. (a) Well bottom, WB. (b) Flat bottom, FB. (c) Mountain bottom, MB. (d) WB-nozzle with a solid barrier attached at the SEN inner bottom wall [13]). (e) WB-nozzle with two separated solid barriers attached at the SEN inner bottom wall (adapted from [14]).
Metals 11 01437 g002aMetals 11 01437 g002b
Figure 3. Inner geometry characteristics for the SEN proposed in this work. (a) Flat bottom with flow divider, FBFD. (b) Well bottom with flow divider, WBFD.
Metals 11 01437 g003
Figure 4. Dimensions and geometric characteristics of the nozzles studied in this work. (a) FB-nozzle. (b) WB-nozzle. (c) FBFD-nozzle. (d) WBFD-nozzle.
Metals 11 01437 g004
Figure 5. Hydrodynamic behavior inside a FB nozzle. (a) Fluid velocity vectors inside the nozzle. (b) Fluid velocity vectors as seen from the outlet ports. The letters A and B label the exit ports’ sides.
Metals 11 01437 g005
Figure 6. Hydrodynamic behavior inside WB-nozzles with different well-depths: (a) 2 mm of well depth, WB-02, (b) 4 mm of well depth, WB-04, (c) 6 mm of well depth, WB-06, (d) 8 mm of well depth, WB-08, (e,f) 10 mm of well depth, WB-10. The letters A and B label the exit ports’ sides.
Metals 11 01437 g006
Figure 7. Hydrodynamic behavior inside nozzles with flow dividers. (a,b) Flat bottom, FBFD. (c,d) Well depth of 10 mm, WBFD-10. (e) Well depth of 20 mm, WBFD-20. (f) Well depth of 5 and 10 mm, WBFD-5-10. The letters A and B label the exit ports’ sides.
Metals 11 01437 g007
Figure 8. Fluid velocity maps on a slice. (a) FB-nozzle. (b) FBFD-nozzle. (c) WB-nozzle with 10 mm of well depth. (d) WBFD-nozzle with 10 mm of well depth.
Metals 11 01437 g008
Figure 9. Hydrodynamic behavior of three particular systems. (a) Case I, FB-nozzle with inclined inflow. (b) Case II, FBFD-nozzle with inclined inflow. (c,d) Case III, a modified WB-nozzle with 20 mm of well depth and perpendicular flow dividers. The letters A and B label the exit ports’ sides.
Metals 11 01437 g009
Figure 10. Numerical results for the flat bottom SEN model, FB. (a) the flow streamlines; (b) a projection onto the XY plane, viewed from the bottom of the SEN; (c) perspective view of the jets; (d) a projection onto the YZ plane.
Metals 11 01437 g010
Figure 11. FBFD SEN model without a pool and with a flow separator. Description of each panel in the figure is the same as in Figure 10.
Metals 11 01437 g011
Figure 12. WB-20 SEN model with a pool and without a flow separator. Description of each panel in the figure is the same as in Figure 10.
Metals 11 01437 g012
Figure 13. WBFD-20 SEN model with a pool and a flow separator. Description of each panel in the figure is the same as in Figure 10.
Metals 11 01437 g013
Figure 14. Physical simulations results. (a) Outlet jets emerging from a WB-nozzle. (b) Outlet jets emerging from a WBFD-nozzle. (c,d) Two instants of the same WBFD-nozzle test. (e) Inner fluid flow pattern reconstructed through PIV analysis. (f) Velocities map reconstructed through PIV analysis.
Metals 11 01437 g014
Table 1. Oriented volumetric flows for nozzles analyzed in Figure 5 and Figure 6.
Nozzle TypeLeft Exit PortRight Exit Port
QLX (m3/s)QLY (m3/s)QLX/QLY (%)QRX (m3/s)QRY (m3/s)QRX/QRY (%)
FB1.7 × 10−53.2 × 10−45.32.0 × 10−53.1 × 10−46.5
WB-022.2 × 10−53.2 × 10−46.92.1 × 10−53.1 × 10−46.8
WB-041.6 × 10−53.1 × 10−45.21.8 × 10−53.2 × 10−45.6
WB-069.5 × 10−53.1 × 10−430.61.0 × 10−53.2 × 10−431.3
WB-089.9 × 10−53.1 × 10−431.99.4 × 10−53.2 × 10−429.4
WB-108.9 × 10−53.2 × 10−427.89.5 × 10−53.1 × 10−430.6
Table 2. Oriented volumetric flows for nozzles analyzed in Figure 7.
Nozzle TypeLeft Exit PortRight Exit Port
QLX (m3/s)QLY (m3/s)QLX/QLY (%)QRX (m3/s)QRY (m3/s)QRX/QRY (%)
FBFD1.4 × 10−53.1 × 10−44.51.3 × 10−53.2 × 10−44.1
WBFD-101.7 × 10−53.2 × 10−45.31.5 × 10−53.2 × 10−44.7
WBFD-203.7 × 10−53.2 × 10−411.63.3 × 10−53.1 × 10−410.6
WBFD-5-101.7 × 10−53.2 × 10−45.32.6 × 10−53.2 × 10−48.1
Table 3. Oriented volumetric flows for systems analyzed in Figure 9.
SystemLeft Exit PortRight Exit Port
QLX (m3/s)QLY (m3/s)QLX/QLY (%)QRX (m3/s)QRY (m3/s)QRX/QRY (%)
Case I1.1 × 10−43.0 × 10−436.71.1 × 10−43.0 × 10−436.7
Case II3.2 × 10−53.0 × 10−410.72.6 × 10−53.1 × 10−48.4
Case III8.4 × 10−53.1 × 10−427.16.1 × 10−53.3 × 10−418.5
Publisher’s Note: MDPI stays neutral with regard to jurisdictional claims in published maps and institutional affiliations.

