Article

Crack Growth Prediction on Critical Component for Structure Life Extension of Royal Malaysian Air Force (RMAF) Sukhoi Su-30MKM

1
RMAF Centre of Aerospace Engineering Services Establishment, Subang Airbase, Shah Alam 40000, Malaysia
2
Razak Faculty of Technology and Informatics, Universiti Technology Malaysia, Jalan Sultan Yahya Petra, Kuala Lumpur 54100, Malaysia
3
Aerospace Technology Systems Corporation Sdn Bhd, ATSC Corporate Centre, PT 192, Jalan Lapangan Terbang, Subang 47200, Malaysia
4
CAIDMARK Sdn Bhd, Damansara Utama, Petaling Jaya 47400, Malaysia
5
RMAF Combat Training School, TUDM Bukit Ibam, Muadzam Shah 26700, Malaysia
*
Author to whom correspondence should be addressed.
Metals 2021, 11(9), 1453; https://doi.org/10.3390/met11091453
Submission received: 10 July 2021 / Revised: 23 August 2021 / Accepted: 10 September 2021 / Published: 14 September 2021
(This article belongs to the Special Issue Fatigue Crack Propagation Micromechanisms of Metallic Materials)

Abstract

:
The critical aircraft structure, being the load-bearing members, is a vital component for any aircraft. The effect of fatigue loading, operating conditions, and environmental degradation has caused the structural integrity of the airframe to be assessed for its airworthiness requirement. Using the fatigue design concept of Safe Life, the RMAF adopts the Aircraft Structure Integrity Program (ASIP) to monitor the structural integrity of its critical components. RMAF has produced the task card using the engineering analysis concept on the aircraft’s critical structure. Various Computer-Aided Engineering (CAE) methods were used, and for this analysis, the Crack Growth Prediction method was used to determine the crack growth behavior and its ultimate failure point in case of any crack occurrences. Although there are six critical locations, the wing root is chosen since it has the highest possibility of fatigue failure. The analytical methods which were discussed are Crack Growth Analysis and Low Cycle Fatigue. For the numerical method, NX Nastran was used for the simulation of crack growth. The result from the crack growth analysis was validated with the numerical result. The conclusion is that, based on the fatigue life cycle, the wing root structure condition is not affected by severe damage, and its failure is approximately around 30 to 100 years for both the through hole and through side crack. Thus, its structural life can be extended. The research outcome will be on the extension of the structure life of the aircraft wing.

1. Introduction

The Sukhoi Su-30MKM is a Royal Malaysian Air Force (RMAF) super maneuverability Multi-Role Fighter Aircraft. The Structure Life Extension program’s main objective is to ensure the aircraft structure’s safe life and meet its planned withdrawal date of the fleet while pushing its operational requirement. Currently, the RMAF continues to extend aircraft programs up to ten years or more, depending on the operational differences of each aircraft. While balancing the budget constraints and adhering to the strict airworthiness regulations, RMAF must embark on a new approach instead of traditional extension strategies such as reuse, reset, and reclamation for structural hardware. Extending the service life and safe life management of aircraft service life requires mandatory engineering testing, analysis, and judgment which airworthiness is the primary concern [1].
Fatigue remains a significant cause of failure in aircraft components. Current management approaches rely on various combinations of inspection and early retirement to keep the structure safe. A series of changes in the design approach has been used as the original method, beginning with the design on a static strength basis, building redundant load paths in the structure, and retiring aircraft before the risk of failure rises too far. At the same time, structural optimization and the use of high-strength materials have increased the number of parts or regions that are highly stressed, which are, therefore, intrinsically intolerant of fatigue damage. Arising from these changes, one factor, more than any other, has attracted the attention of the fatigue research community over the years–the sensitivity of fatigue life to small cracks, and, hence, to the surface condition and processing [2].
With the increasing cost of aircraft maintenance and the feasibility to integrate the existing fleet with newer technology at a comparatively lesser cost, a trend is observed the world over to extend the life of the fatigue structure critical component of the aircraft. Royal Malaysian Air Force (RMAF) is no exception to this. Since the Aircraft Life Extension Program by the Original Equipment Manufacturer (OEM) usually costs relatively much, RMAF has embarked on several life extension projects [3].
When approaching the end of the design service life, aircraft in service observes that reliability continue to dwindle, parallel with parts, equipment, and avionics deterioration. As the operational life increases, aircraft structure integrity continues to degrade; in some instances this occurs at a faster rate than the design intended life, which could impair the operational ability of the assets. This process of aircraft aging is depicted as airframe and components undergo wear and tear from operational use and environmental degradation [4].
Fatigue is an extensively researched problem in the project, and fatigue life prediction is always a research hotspot. In allusion to material’s or component’s fatigue life prediction, scholars have put forth many methods and models based on various parameters [5]. The Manson–Coffin formula establishes a connection between the elastic–plastic strain amplitude and fatigue life. The Paris formula, that is widely used in fatigue crack growth, describes the connection between the stress amplitude and the fatigue life [6]. The Forman formula considers the impact of average stress on fatigue crack life based on the Paris formula; moreover, the formula considers the impact of the peak stress through the stress ratio. Wang Hong established a model of the total course’s crack growth through many experiments, and the model described the collectivity law of crack growth life. The model can be used to describe and predict the holistic fatigue crack growth life of various materials with different peculiarities, and the validity of the model was proved through the experiments. At present, the fatigue crack growth life prediction is mainly used through the above formulas or models, and the fatigue life is obtained through the integral count to fatigue crack growth rate. As the law of fatigue damage accumulation is not clear under the mutative stress amplitude loading, the prediction of fatigue crack growth life is often inconsistent with the real fatigue life in the project. Therefore, many scholars are researching the more effective model to predict fatigue life under the mutative stress amplitude loading condition [7].
Different types of analysis are available for fatigue life evaluations. They are classified either through the crack initiation or crack propagation approach. However, in recent years, it has been revealed that fatigue failure involves three processes: initiation, propagation, and, finally, the failure process. This study aims to define a complete fatigue life prediction of the aircraft’s critical structure up to crack failure. The procedure of fatigue life estimation is based on combining a computation stress analysis with strain–life methods. The methods which were implemented here were the analytical and FE methods. The analytical method is much easier, while the FEM is more favorable for critical locations. The FEM analysis is more reliable for the stress analysis, for both the linear and elastic–plastic domain.

1.1. Fatigue Life Evaluation

Fatigue modeling may be performed based on alternative approaches such as the global S–N approaches, the local strain–life or stress–life approaches, and the fracture mechanics-based approaches. The global S–N approaches relate directly to a global definition of a stress range with the total number of cycles to failure [8].
The local approaches are usually associated with local failure modes, such as the macroscopic crack initiation. However, the definition of the macroscopic crack initiation is neither easy nor consensual and, usually, crack initiation criteria are postulated, such as a crack of 0.25 mm depth.
Fracture mechanics-based fatigue approaches may be used to model fatigue crack propagation from an initial size to final dimensions responsible for the fracture of the component. This approach may be used to complement the local strain–life approaches, modeling the crack propagation from the initial crack to the critical dimensions leading to component collapse. Fracture mechanics-based fatigue approaches may be further extended to simulate the global fatigue life of components, using the Equivalent Initial Flaw Size (EIFS) concept [9] based on the cyclic J-integral. The material is assumed to include defects acting similar to initial flaws. Therefore, the component’s fatigue life is assumed as the number of cycles required to propagate these initial defects until critical dimensions.
Material crack propagation laws support the fatigue life evaluation based on fracture mechanics for notched details. The cyclic J-integral can be used to consider the elastic–plastic deformations in the crack-tip area within the calculation:
d a d N = f ( Δ J )
where da/dN is the fatigue crack growth rate, ΔJ is the range of the cyclic J-integral, and f is a function of the J-integral.

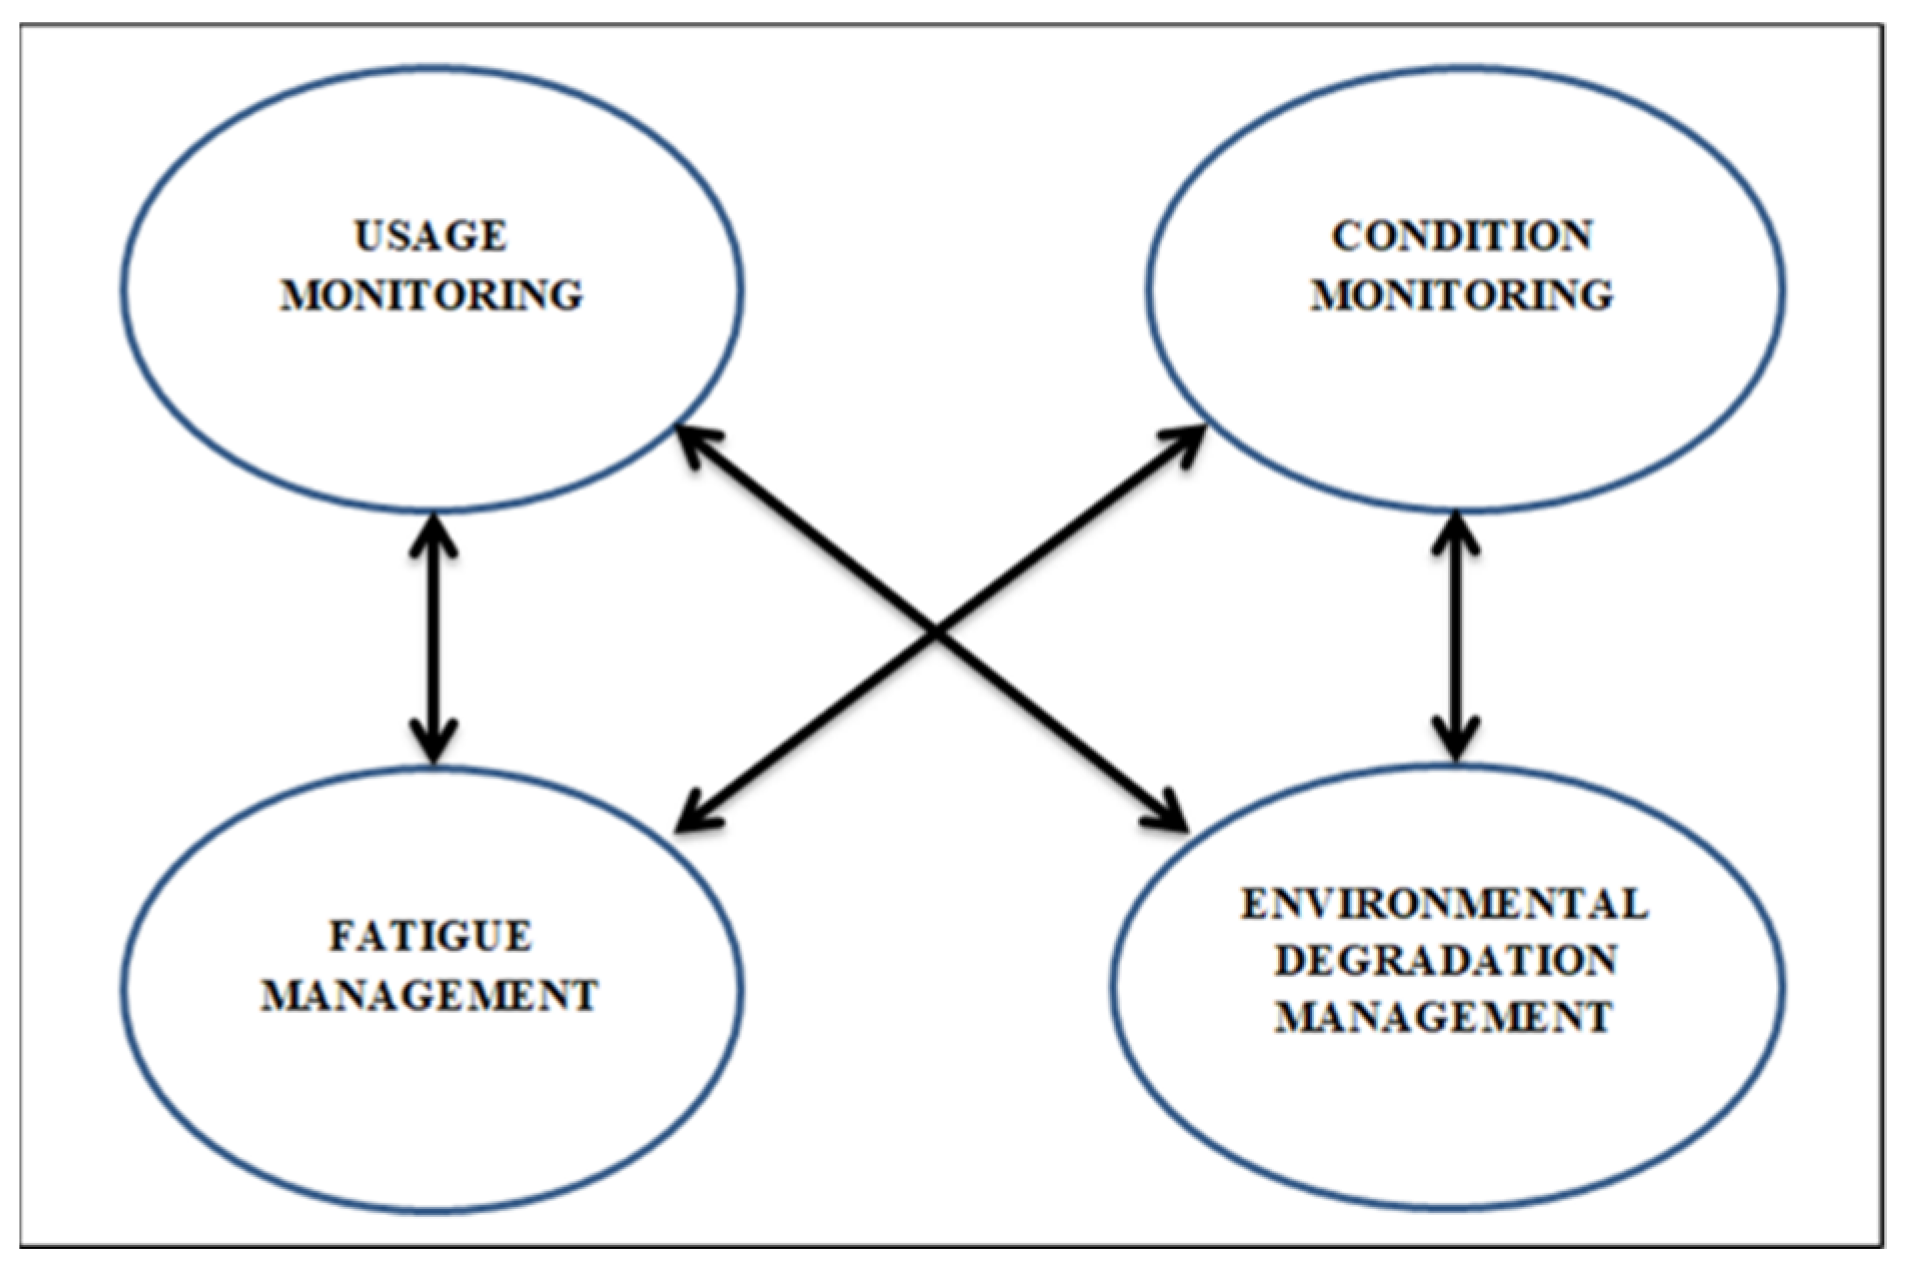
1.2. Structural Integrity

Aircraft are designed to approved airworthiness standards. However, aircraft structure deteriorates throughout its service life. The causes of structural deterioration must be closely managed to constrain the risk of failure and the cost of continuing operations to acceptable levels. Thus, Aircraft Structural Integrity (ASI) is essential to ensure structural airworthiness from the acquisition stage through fleet retirement.
The current concept of ASIP implemented in the RMAF has four main areas that monitor the structural integrity. They are usage monitoring, condition monitoring, fatigue monitoring, and environmental degradation management as mentioned in Figure 1 [10].
The nature of ASIP is very conservative, and the principle considers that all critical components will or may have a defect size that considers the damage that could originate from manufacturing or during maintenance. In the case of Su-30MKM, the Progressive Restoration Work (PRW) project for Aircraft Structural Integrity (ASI) mainly evaluates the aircraft structure usage and condition monitoring of Su-30MKM for ten years. The tasks were conducted by re-analysis and re-processing all flight data parameters and maintenance data from day 1 up to 10 years, which correlates with the missing loading factor. The scope which was covered in the ASIP was:
(a)
Su-30MKM Usage Monitoring.
(b)
Su-30MKM Condition Monitoring.
The aircraft structure usage and condition monitoring data were collected from various sources: the Flight Data Recorder (FDR), express analysis sheets, aircraft logbook, certificate of equipment installed on aircraft, aircraft state, and SPKB records. Usage monitoring data consisted of the total sortie, total flight hours, and total loading factor for each aircraft. Condition monitoring data consisted of data from the Aircraft Structure Defect Report. An overall program was introduced to provide aircraft structural characteristics referred to as the Aircraft Structural Integrity Program to maintain the structural integrity database management.
Predicting the crack growth behavior is vital in the structural integrity management of the aircraft fleet. Usually, fleetwide management implements software packages such as ZENCRACK for crack growth prediction. The loading spectrum utilizes the loading profile of g-acceleration data and stress contour data from the FEA analysis above. The loading spectrum employed had to be verified correctly to minimize the deviation of results that would be implemented in the structural integrity management. The primary purpose of this paper is to describe the work carried out on the Su-30MKM Preventive and Restoration (PRW) project based on a CAE analysis and fatigue analysis. The fatigue analysis produced life and damage values results to be used to determine the maintenance task card interval and task.

1.3. Crack Growth Prediction

There is more than twenty-year worth of extensive research and effort toward developing the fatigue life prediction. However, as the knowledge on this field continues to multiply, it is proven that fatigue can be treated in some instances from a crack propagation point of view. There are five primary considerations in terms of material selection and structural design in response to loading. Specifically:
  • Ultimate static strength and stiffness of defect-free material.
  • Material behavior under the rate of change (time-dependent) such as stress rupture, thermal fatigue, creep, and corrosion stress.
  • Damage tolerance or fail-safe approach of damaged material for residual static strength and stiffness.
  • Safe-life approach of defect-free and undamaged material fatigue.
  • Repair procedures, inspection, and maintenance intervals of damaged and flawed material. (Material life.)
As denoted in the fourth element above, the material safe-life approach assumes that the material is defect-free or the stress level is neglectable to propagate any cracks. Conversely, safe-life means in the initial design service life, catastrophic failure or replacement of a part will not occur. Safe life often associates with infinite life, which is inaccurate. The safe-life approach requires the design to undergo vigorous testing and analysis to verify that the design’s probability is improbable [11].
Material, when subject to cyclic loading in a specific time frame, will result in crack nucleation. When the loading is applied continuously, the crack on the materiel will propagate to the point that the material fails and no longer can bear the load and fractures [12]. This is known as fatigue which is the main culprit for material and component failures [13]. Therefore, the engineer must approximate the material life to ensure the safety of the component. The crack initiation, by definition, is the number of loading cycles required for the crack to start to propagate, also called the fatigue life [14].
Based on Yatika et al. [15], the fatigue cracks enhancement rate of aluminum alloys experimentally and the plastic zone were determined at the crack tip when the crack advanced using FEA. Fatigue crack growth tests were performed to record the ‘No. of cycles’ and ‘Stress intensity factor’ as the crack advanced. The crack growth rate in the steady-state regime was determined and analyzed. The crack advancement was also analyzed in the simulation, and ‘No. of cycles’ and ‘Stress intensity factor’ were determined analytically. A comparison of experimental data and simulation data was performed to check the suitability of the simulation software application in the fatigue crack increase evaluation of aluminum alloys.
Non-destructive testing is also a method widely used in most industries to evaluate the crack detection and monitoring of a structure without any additional damage. Among the various NDT types, the direct current and alternating current potential difference methods were used [16]. Besides that, fatigue crack propagation behavior is also dependent on certain factors such as mechanical properties, microstructure, specimen size, environmental condition, and the cyclic stress and strains acting on the crack tip area [17]. Aircraft structures use the concept of mechanical joints with regard to bolted joints. Used widely and due to its nature of geometry change and for load transfer, these bolted areas are a potential area of fatigue crack initiation (FCI). However, numerical and experimental results show an improvement in fatigue life due to the clamping force, but it is more beneficial in low-amplitude cyclic loading [18].

1.4. Fatigue Crack Growth Equation under Cyclic Loading

Several load interaction models were developed to predict the fatigue crack growth on the material. These models have been used extensively to predict the crack propagation rate when subjected to different load spectra and generally agree well and correlate with research findings. The crack growth rates are generally expressed in SIF with the range Δ K while depending on the value of the R ratio. These parameters were the main driving factor for the crack prediction model. The SIF range equivalent in [19,20,21], which boils down to the data that predicts the model of crack growth under variation of R-ratios, was suggested in the previous work [22]. The consideration of material under different loading blocks is a must. The relationship of d a d N vs. Δ K is shown in previous work [22,23]. The crack growth model of stage I and II can be expressed as:
d a d N = C [ ( Δ K e q ) m ( Δ K t h 0 ) m ]
Δ K e q 0   = M R M p Δ K
M R   = { ( 1 R ) β 1                             ( 5 R < 0 ) ( 1 R ) β                               ( 0 R < 0.5 ) ( 1.05 1.4 R + 0.6 R 2 ) β   ( 0.5 R < 1 )
The retardation depending on the overload ratio (OLR) greater than two would cause the crack to occur. Previous work on retardation was studied in relation to the overload over cracks zone correction [24,25]. Such models are represented in the following Equations that describe the growth rate reduction for fatigue cracks that propagate through the plastic zone, which cause the overload. The effect of retardation is the model through parameter C p that replaces into the equation to calculate the crack growth rate under pre-overloading in the plastic zone:
d a d N = C P ( C Δ K m )
C P = { ( r y a O L + r O L a ) n 1   a + r y   < r O L   1   a + r y a O L   + r O L
r y = ( K m a x σ y ) 2
  r O L = ( K m a x O L σ y ) 2

1.5. Fatigue Durability Analysis

The durability analysis of the aircraft’s critical structure could either be performed through a simulation or full-scale fatigue setup tests. The Sukhoi aircraft is relatively new, having no retired parts to perform the actual fatigue test. The closest comparison was by comparing experimental data from the literature, and the fatigue test carried out on a similar aircraft critical component to evaluate its fatigue life as shown in Figure 2 [26]. The fatigue test that was performed had a similar loading spectrum, utilizing the same crack model. This example was used as a validation procedure for the accuracy of K’s values (fracture toughness), which were obtained in the following cases using crack front meshes implemented with Zencrack. The fatigue test was a mixed mode from the experimental measurement from the literature. This fatigue test was designed to test out the wing root joint and to promote crack initiation. The analysis was performed on the blend out to expose the damaged area. The modified test coupon was tested under the fatigue load of the loading spectrum to determine the structure’s fatigue life against its loading cycle [27]. The fatigue test generally contains three parts, namely:
  • Part 1: Fatigue cycles that generate cracks almost identical to cracks found in service.
  • Part 2: The test specimen undergoes loading cycles that represent the aircraft loading profile to generate cracks.
  • Part 3: The residual strength that failed post-mortem. The damaged surface is then used for qualitative fractography (Q.F.) to generate growth data.
Besides that, based on Siegl, Nedbal, and Kunz [28], the fatigue cracks growth determination has various types such as striation spacing measurements, beach mark spacing measurements, and fracture marking.

1.6. Problem Statement

With its fighter aircraft fleet operating for over ten years, the RMAF is facing challenges in ensuring the structural integrity of its fleet is still airworthy. Since its formation, the most advanced fighter jet in its fleet has been the Sukhoi Su-30MKM, a supermaneuverable fighter with advanced technology comprising its onboard avionics with missiles and bombs. Operating this aircraft for nearly 12 years, and with a fleet of 18 aircraft, the Sukhoi’s structural integrity is at stake. Just imagine the number of high-speed maneuvers reaching almost 13G. Therefore, the remaining fatigue life of the structure was analyzed and ensured that it is still airworthy to be flown.
The Sukhoi aircraft service life to the first overhaul assigned by the OEM is ten years or 1500 flying hours, whichever comes first. Currently, the aircraft calendar life is due for its structural overhaul. The overhaul works equivalent to the Structure Life Extension (SLE) involving the inspecting aircraft structure or critical components through a physical inspection, NDT method, and engineering analysis (crack growth prediction). The RMAF fleet is better managed and ensures enough Su-30MKM aircraft for the daily operation by having the SLE and overhaul works carried out simultaneously.

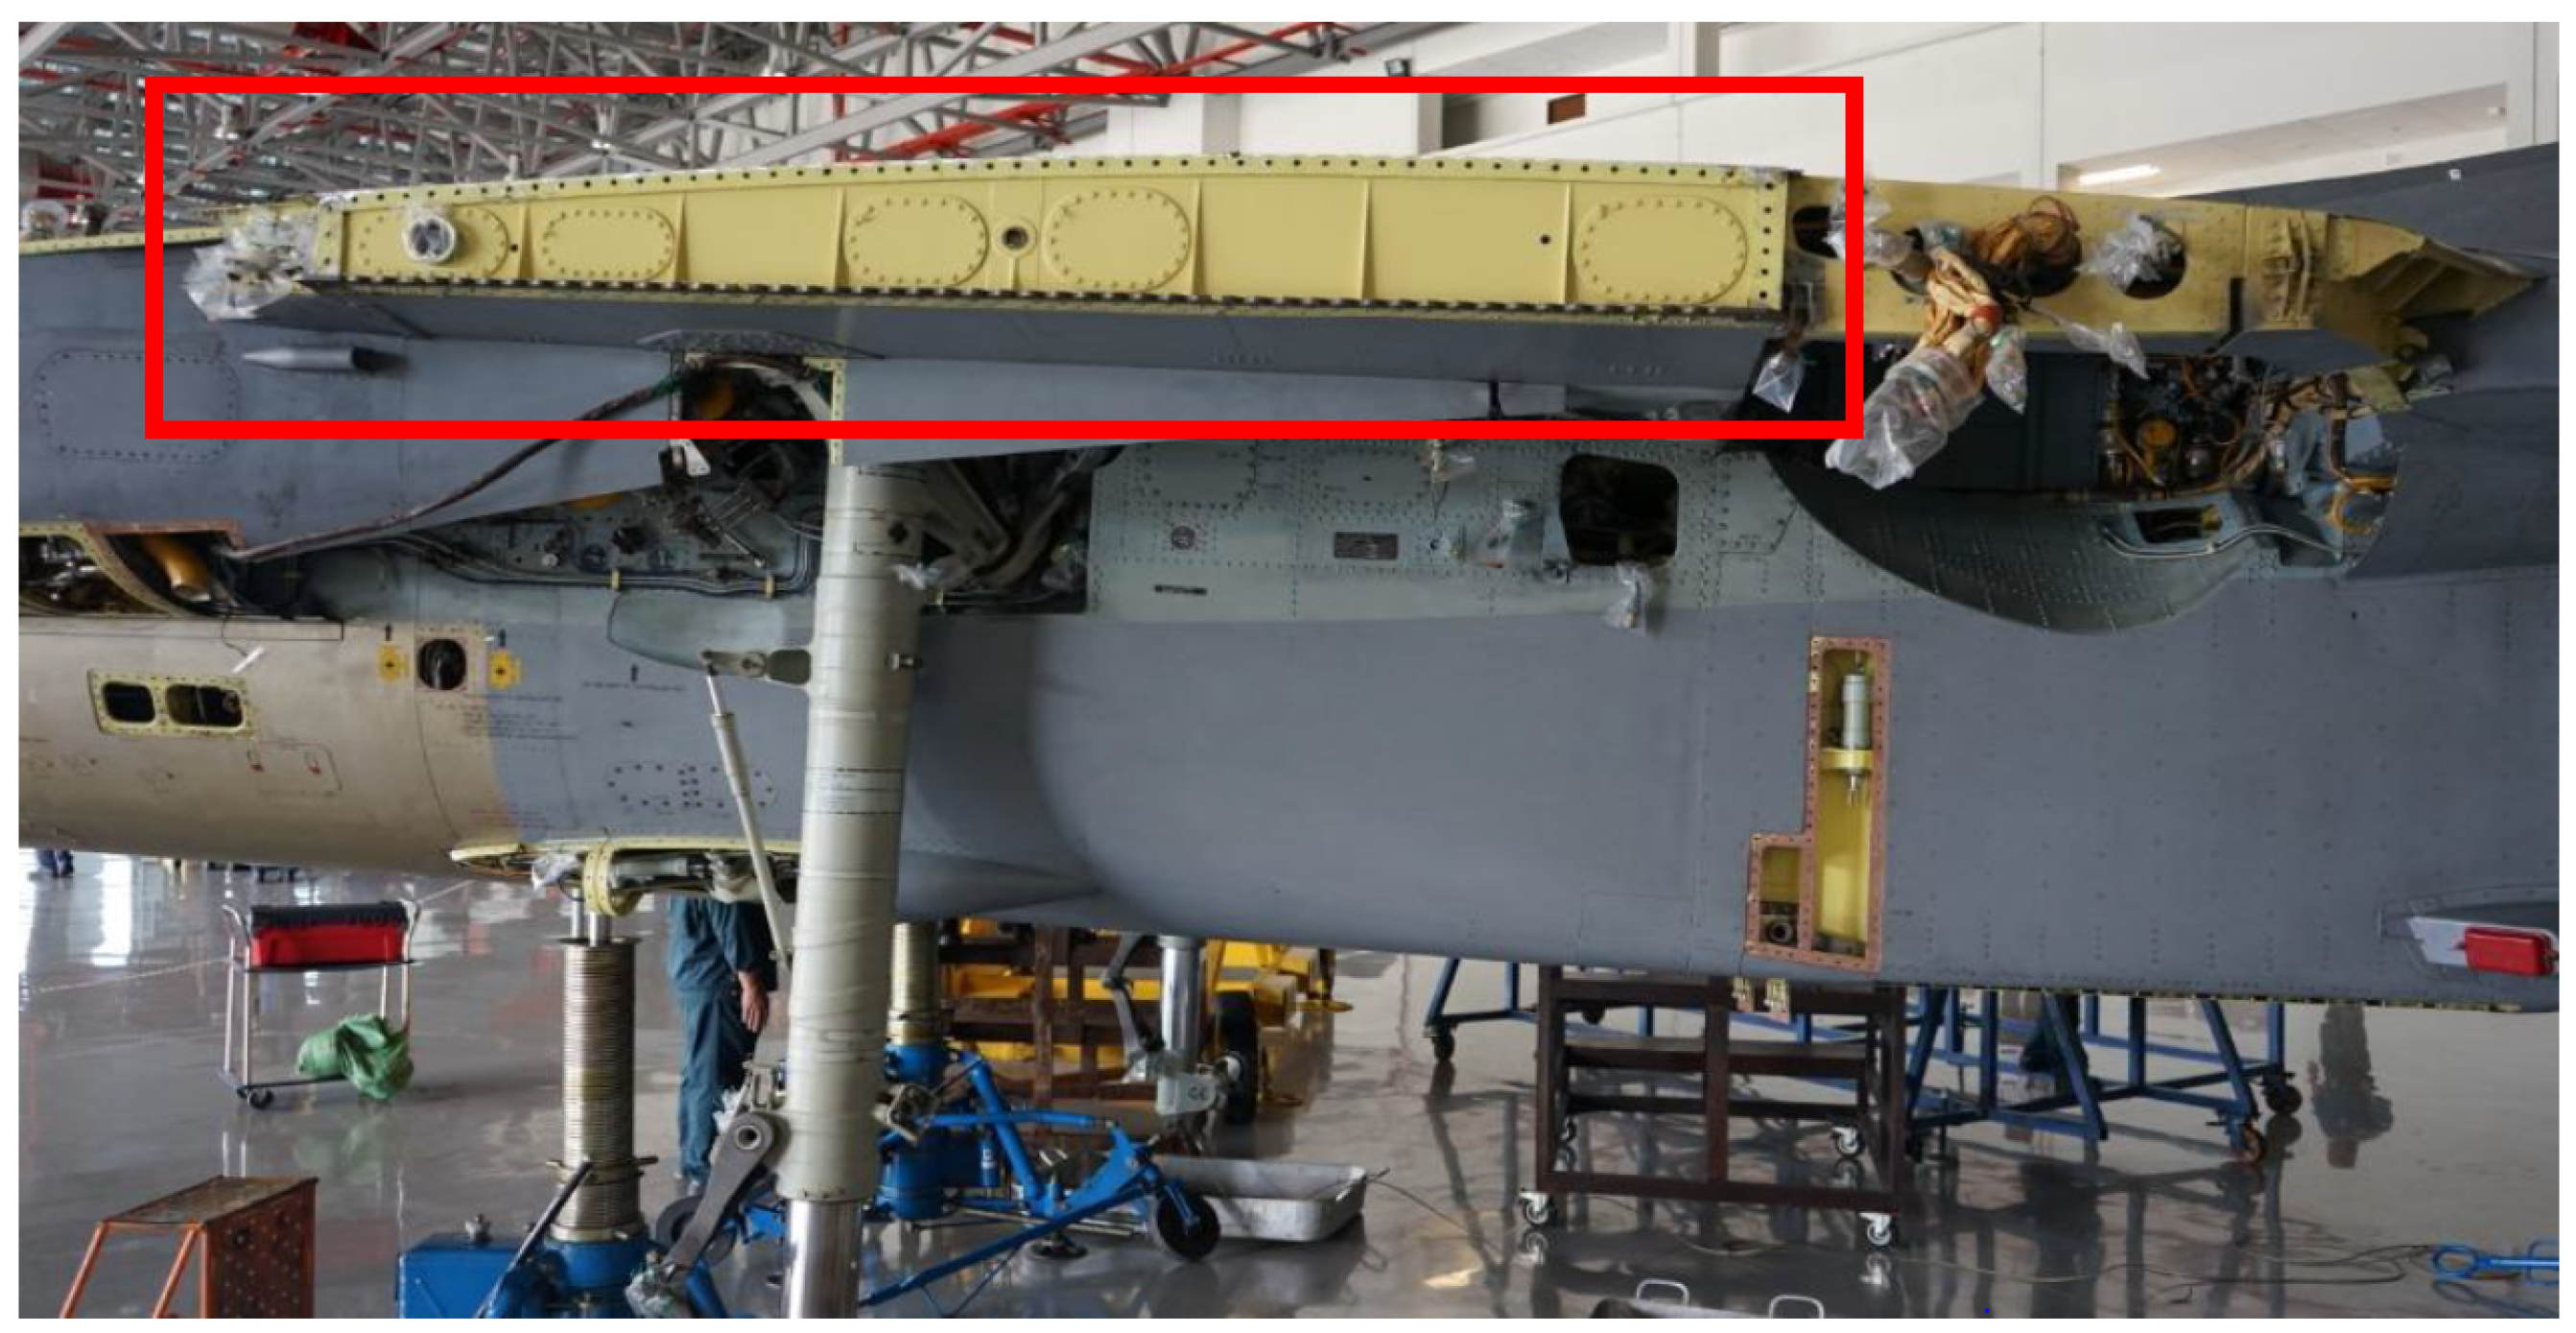
2. Fighter Aircraft Structural Critical Component

Fighter aircraft are designed using the safe life fatigue design spectrum with its ultimate life based on either the loading factor or its flying hours. The critical locations on the aircraft structure were identified based on its load-bearing members. The critical location is defined by the part of an aircraft that is prohibited from the defect. Any defects would be highly susceptible to catastrophic failure and life-threatening.
The fuselage consists of the front fuselage and the rear fuselage divided by the center wing. The front fuselage has a radome that opens upwards, two pilot cockpits, an N.L.G. bay, and equipment compartments. The rear fuselage has engine compartments, air ducts, and fuel tanks No. 4 and 5. There are air intakes in front of the air ducts. The front fuselage is an all-metal semi-monocoque structure. The front fuselage structure is formed by the transverse load-bearing framing (frames), longitudinal load-bearing framing (longerons and stringers), and skins. Two longitudinal beams for each side (L.H. and R.H.) are located inside the engine compartments between frames No. 38 and 42. The beams carry the load from the engine mounts [29]. The critical locations are as below:
  • Wing root L.H. and R.H.
  • Vertical Stabilizer L.H. and R.H. attachment.
  • Horizontal Stabilizer L.H. and R.H. attachment.
  • Engine Mounting L.H. and R.H.
  • Canard L.H. and R.H. attachment.
  • Upper Longeron at Frame No. 18.
The Sukhoi Structural Repair Manual (S.R.M.) mentioned that one of its critical fatigue locations is the center wing-fuselage area. Besides being a part of the Sukhoi Su-30MKM 10 Years Servicing Project, this analysis aimed to determine the crack behavior, critical crack length, and cracked lifespan of the cracked aircraft’s components (Wing Root) to support the development of the ten years servicing maintenance task card. The wing root is attached directly to the airframe of the center wing.

Aircraft Wing Critical Location

The wing root is attached directly to the airframe of the center wing [30]. The lower part of the wing root was chosen to be the crack initiation location. The wing root structure was chosen because of the critical locations function as an attachment between the outer and center wing [31]. Figure 3 shows the general wing root, and Figure 4 shows the specific area of the crack propagation analysis.

3. Methodology

3.1. Low Cycle Fatigue Analysis

The loading profile generally contains two blocks, and one block is equivalent to one year of flying. Each block (even number) assumes that the aircraft wing tip is fitted with the missile. The other configuration block (odd number) is to assume the wing is clean without the missile. Each mission sortie was smoothed out in both profiles by omitting the smallest end loads to 15% of total damage. In post modification profiles, the peak and valley loads were lowered by 8%, with the number of cycles being shortened. As obtained from the aircraft technical manual, the load ratio was approximately around R = −0.8. The cycles number was modified so that the minimum and maximum profiles did not fluctuate too high or too low. The fatigue life calculation of Su-30MKM was performed on the wing–fuselage lug joint structure [30]. The wing root joint was comprised of two components, which were created by using the material of Al7075-T6 (aluminum alloy) and VT20-TI (titanium alloy). The fatigue life calculation used in Unigraphics (N.X.) required:
  • The spectrum loading (g-loading).
  • Material properties, with fatigue characteristics, either S–N or E–N formulation.
  • The component to be analyzed. The component should have actual physical geometry and the component was analyzed to obtain its displacement, stress, and strain result. This is usually performed using a static linear analysis, but other solutions can be used if needed.
A safe life approach or crack initiation method was assumed, which uses E–N (strain life) formulation. Furthermore, the Low Cycle Fatigue (L.C.F.) approach was adopted because the Loading profile was the g-acceleration data. Ten years of history (2008–2017) of flight obtained from the ARM-TSV [31] was used to represent future usage analysis. The g-history is an example of a compiled 2008 flight history obtained from the ARM-TSV workstation. These data were obtained from FDR (Flight Data Recorder) and compiled manually for each year. Original data were per flight mission and typically lasted up to 3 h, and the “Rainflow cycle” counting procedure was then applied automatically on the g-loading profile spectrum. The missions were compiled accordingly for each year (from the year 2008 to 2017). The missions were added one after another according to the date the mission was flown.
Furthermore, a visual inspection, fractography analysis, and finite element analysis could also be conducted for a failure analysis due to L.C.F. This is because cyclic stress and excessive mechanical constraints can contribute to fatigue cracks at the wing root.
Over the past few years, many types of research have been performed on low cycle analysis on wing structure to understand the problem’s behavior. For example, Kuntjoro et al. [32] performed the development of a fatigue life prediction software for the wing lug. Using the L.C.F concept, the stress spectra of the wing–fuselage lug joint was derived through g-history. Based on the sample lug material, laboratory testing was conducted to determine its fatigue characteristic. The software developed was capable of being used for most fighter aircrafts. Besides that, based on Yanping et al. [33], a stiffness reliability analysis was conducted on the wing-fuselage attachment. It was performed using the implicit state equation. The F.E program was combined with Advanced Mean Value First Order (AMVFO) method for the analysis. The calculation result from the Response Surface Method (RSM) and AMVFO was in agreement.
Furthermore, according to Saravanan et al. [26], the aircraft wing joints were analyzed for stress. The wing box comprised of spar beams, ribs, and stiffeners, and was analyzed using F.E analysis. Comparing with the S–N curve method, the wing maximum fatigue life was determined. By using the related software, it revealed that the rivet hole regions experienced the maximum stress.

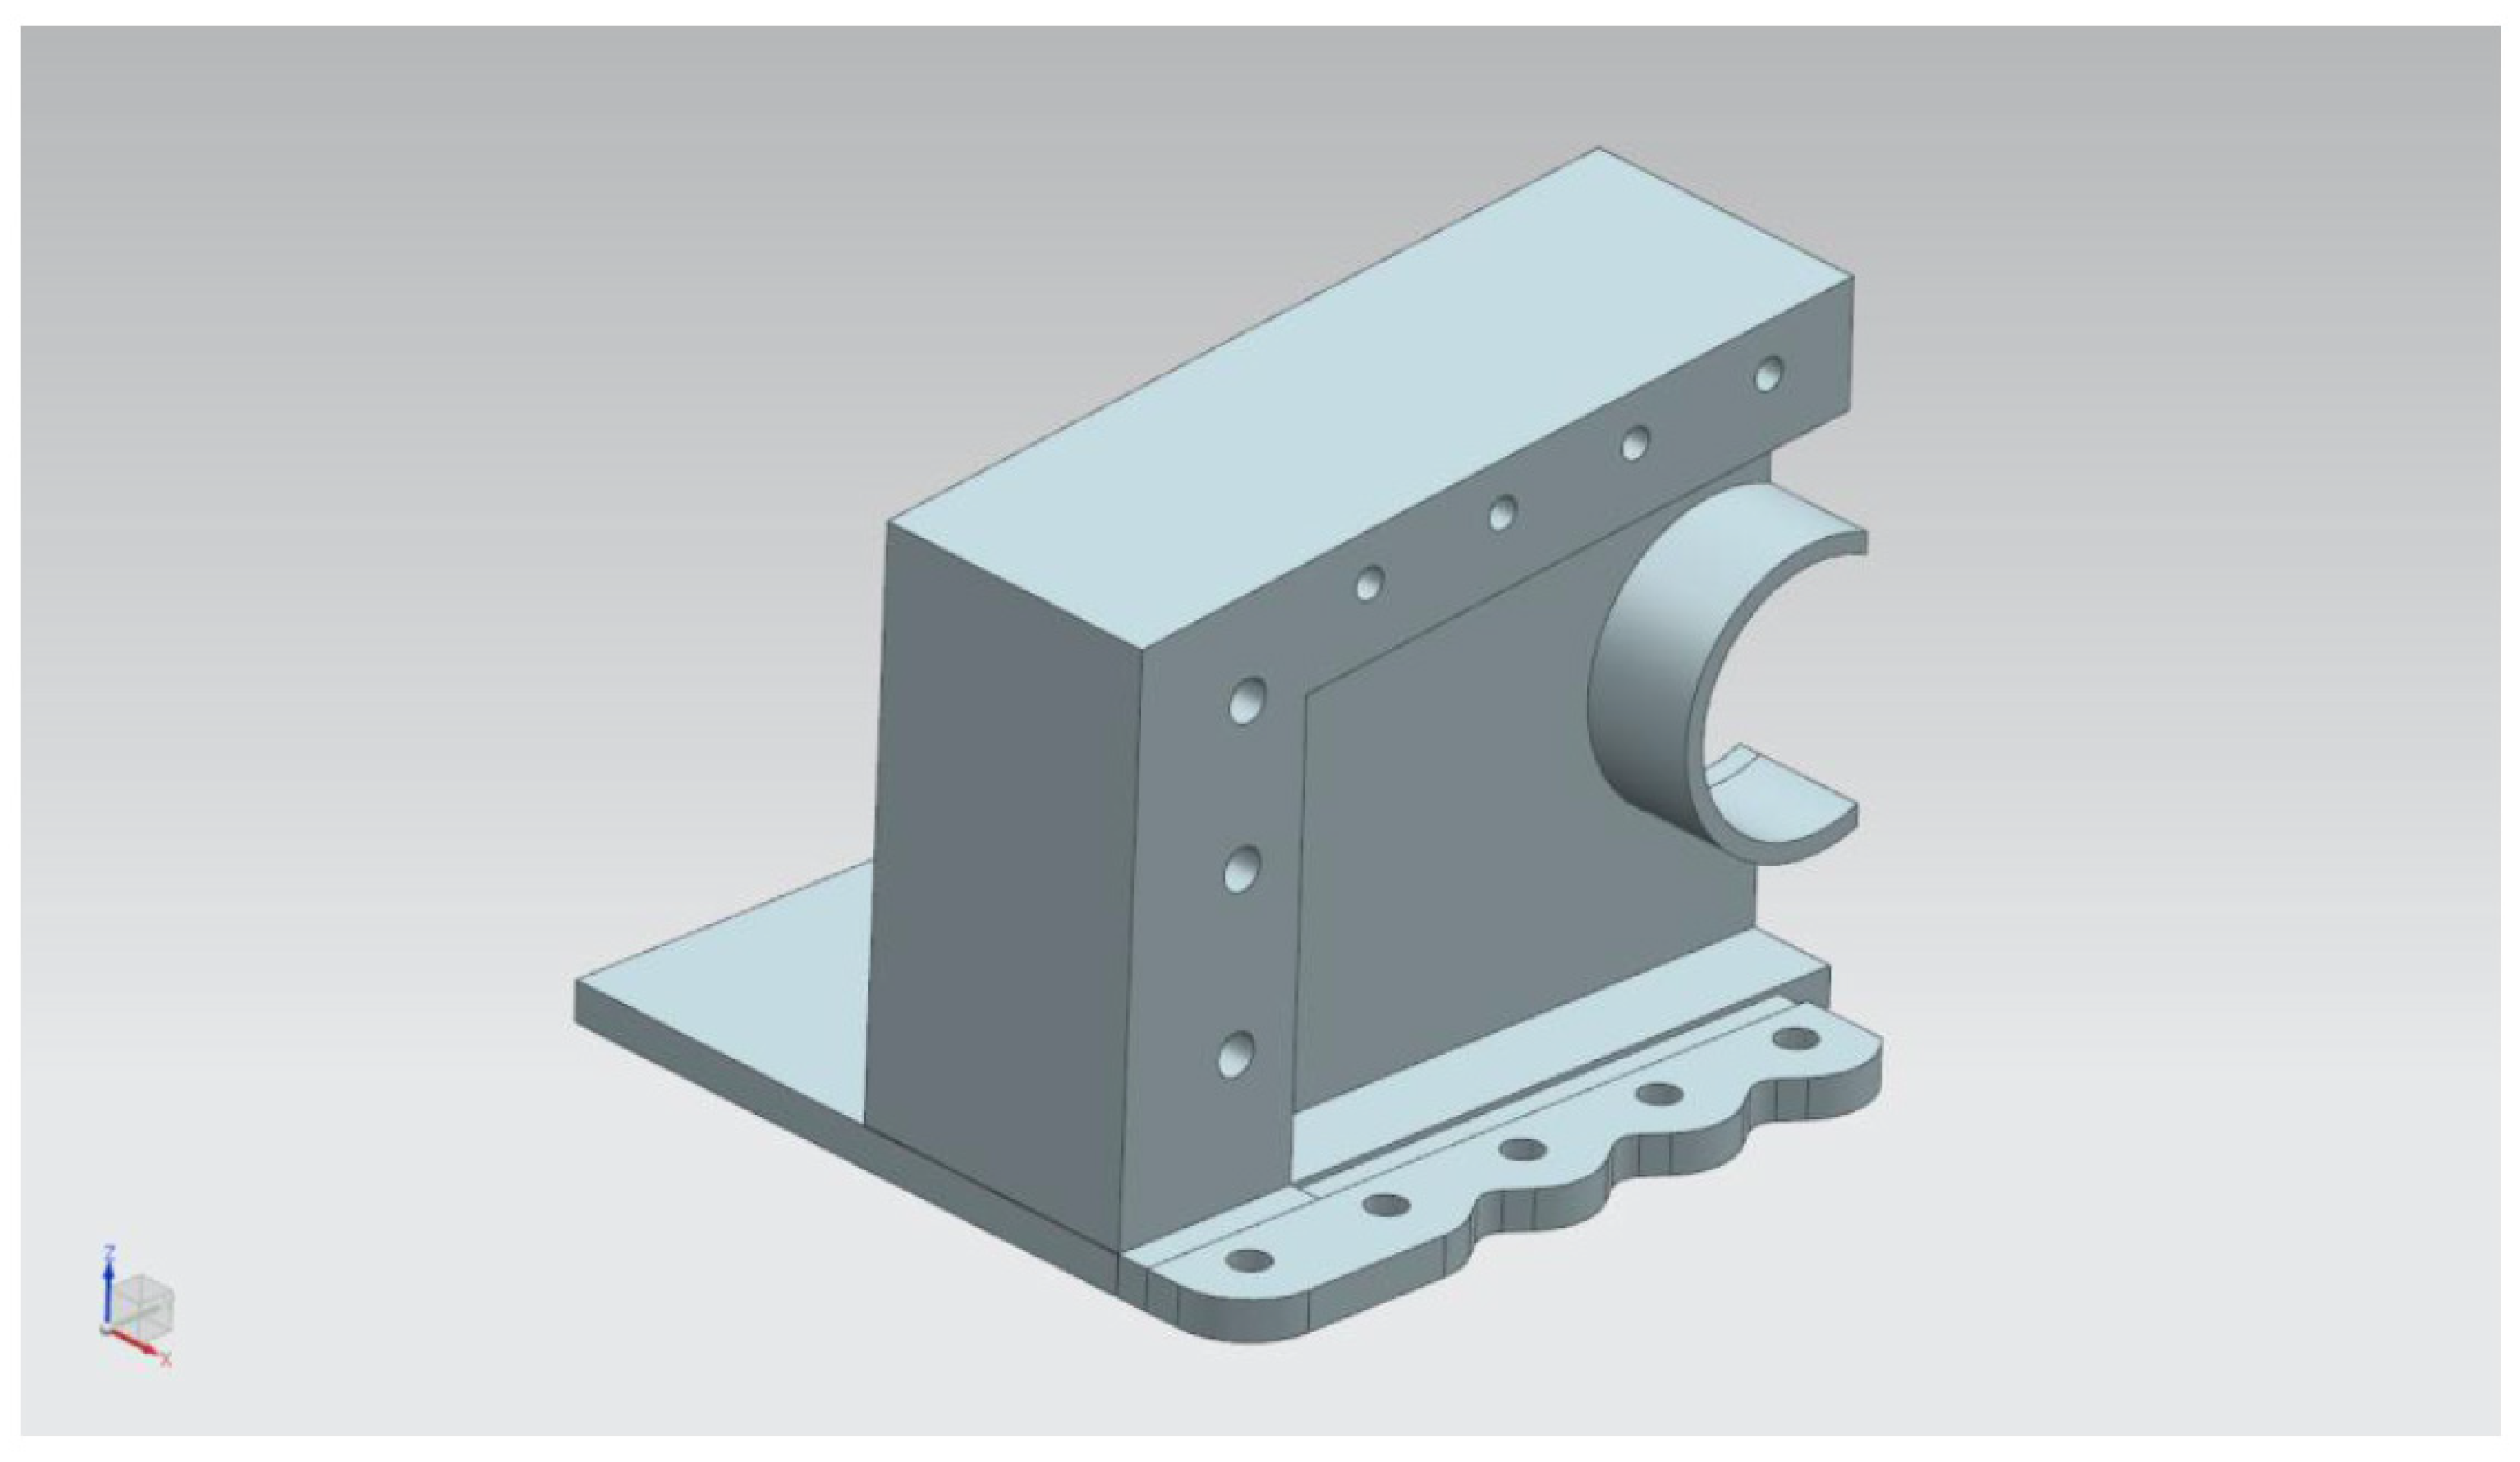
3.2. Computer-Aided Design (CAD) on Aerodynamic Model

The wing root joint is complex in geometry, with multiple components and different material parameters. A paper by Chengwei Fei [34] says that a single simplified model can be derived from representing a complete model without sacrificing the accuracy of the FE simulation. The method in this paper proposed that breaking down the complex component of CAD Modeling into a simplified model. This simplified model however still considered the parameters of sub models analytically to achieve the design of a complete complex model. The method is also known as the model updating procedure, which significantly improves F.E computational efficiency. This method can potentially solve the experimental validation of complex and large-scale models. The topic of interest was Hierarchical Model Updating Strategy (HMUS) in which the concept was to iterate the complex F.E model into series of substructures. The model with parameters such as non-asymmetric, joints, and coupling was broken down into a simplified model to improve the accuracy of the modeling. The correlation between the simulation model and experimental data were significant. Thus, this paper proposed the Correlated Mode Pairs (CMP) of Modelling to address the correlated and uncorrelated parameters.
The CAD development started by working on the wing root CAD model. The dimension and design of the model were obtained using the 3D scanning method. The original 3D CAD model was produced from the 3D scanning process. The scanned 3D CAD model went through a cleaning process and surfaces representing spars, longerons, frames, and bulkheads was added before it could be suitably used for the CAE analysis.
The CAD data initially did not have internal structures. Unfortunately, the process of scanning the whole aircraft (not detailed here) did not produce the internal structures, just the overall external structure. Another problem was that the dimensions for most of the internal structures were not known. The dimension’s procurement activity aided the addition of surfaces in N.X. Nastran. This dimension’s procurement activity involved manual dimension taking from an actual aircraft and comparison activity with maintenance manual diagram. The wing root CAD model is depicted in Figure 5.
After obtaining the CAD model, remodeling a portion of the wing root as depicted in Figure 6 was performed to accommodate the design requirement of N.X. and Zencrack software (Zentech International Limited, Cardiff, London, UK).

Analysis of Aircraft Weight Check

Nastran weight check analysis was the first indicator of the quality of mesh post-Nastran solved. Pre-Nastran solved quality check (geometry, mesh shape) would usually have passed before this stage. Nastran weight check is the CAE designer’s tool to calculate the mass of the mesh versus the actual mass. The parameter GRDPNT output was compared with the actual mass of the aircraft minus fuel. GRDPNT generates a lot of information about the mass and mass matrix as per Nastran requirement. The result needed was as highlighted in Table 1. The manufacturer’s empty weight (MEW) of the Sukhoi SU-30MKM was 18,400 kg. MEW was the mass of weight of the structure, power plant, furnishings, installations, systems, and other equipment. It was gathered from the manufacturer’s manual for the mass of other components other than the internal structures.
Based on Table 1, total mass from Ground Point weight Generator (GRDPNT) + Manufacturer’s Data = 9376 kg + 8510 kg = 17,886 kg. Comparing this with the MEW number of 18,400 kg, it was calculated to have a 97.2% match or 2.8% discrepancy. Therefore, it was concluded that the mesh integrity was good. GRDPNT also outputs C.O.G (center of gravity) data and Inertia data. It was recommended to compare these outputs with data from Sukhoi Design Bureau. For our purpose, this was performed as data were not readily available at the time of analysis. Comparison would give more insight at the level of the F.E.M. mesh integrity.

3.3. Structure Material Properties

Initial material identification was conducted by RMAF using the Science and Technology Research Institute for Defence (STRIDE) material scanning capability, and additional material properties were obtained from the Metallic Materials Properties Development and Standardization (MMPDS) handbook [35] and the Titanium Alloy Russian Aircraft and Aerospace Application [36]. The material identified by RMAF and STRIDE was the VT20 titanium alloy, and the properties were referred from S. Ya. Yarema [37]. The primary material properties used are depicted in Table 2.
Crack material properties to be used were based on the Paris Law theory, as per Table 3.

3.4. Crack Growth Analysis Model

Two types of input data were used for the analysis: the material data and the loading data. The material data were used for finite element and the crack growth analysis, while the loading data were used during fatigue crack growth analysis.
The semicircular surface edge was based on the model used to study the crack growth of the wing root joint. The model thickness was measured to be about 10.0 mm from the fracture structure. The width was assumed to be approximately 203 mm, around ten times the fracture structure’s thickness. This was based on the assumption that the crack would slow down when it propagated near the main body of the wing joint. This assumption was observed in the fractography study in the literature [38].
Conservatively, a single crack model was to simulate the co-planar multi-faced surface crack growth. The model is shown in Figure 7. The model depth was the maximum depth of the cracks, and the length was the total length between the most prolonged crack. It was proven that the adjacent minor crack could be neglected until a single crack was formed [39]. However, this assumption’s applicability depended on the gap between cracks, stress level, crack geometry, and material property.

Crack Initiation

The crack model for the crack growth analysis was a basic straight crack with 2 mm depth. A simple crack was initiated on the wing root. Figure 8 (through hole crack) and Figure 9 (through side crack) showed the two different crack locations initiated on the wing root structure. Based on the design structure, these two cracks were chosen to determine which crack locations would reach critical crack length sooner.

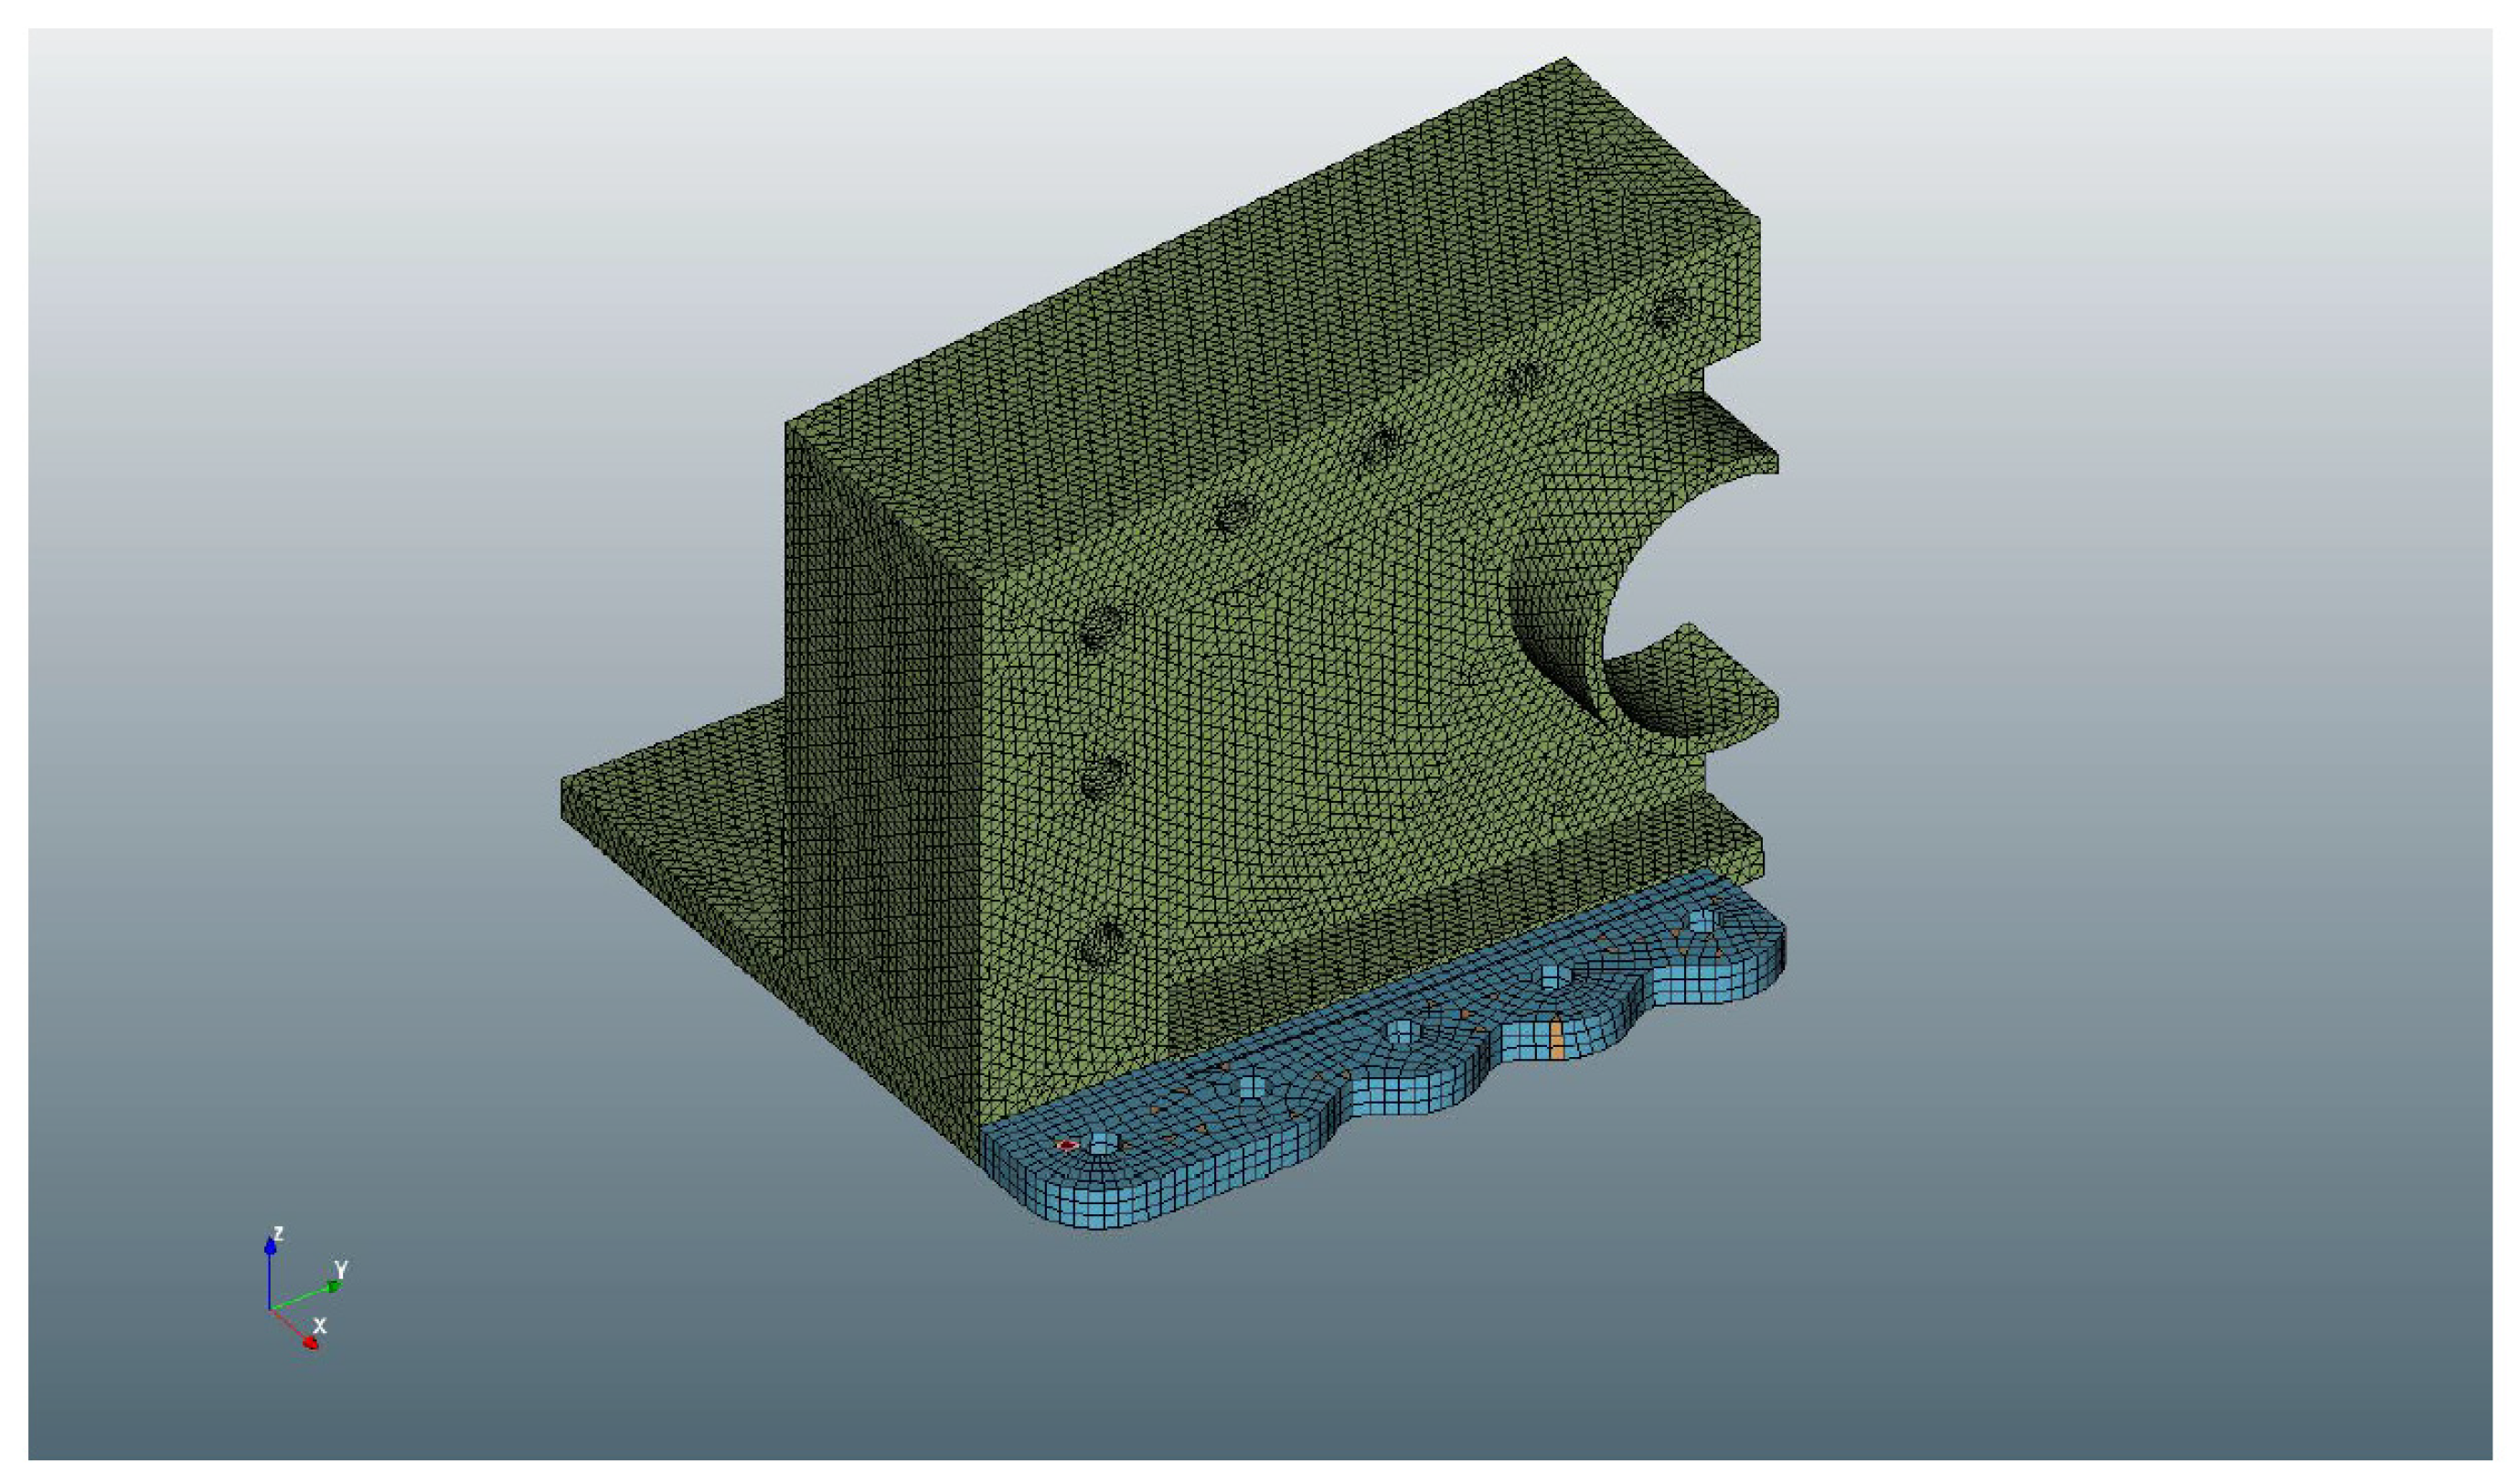
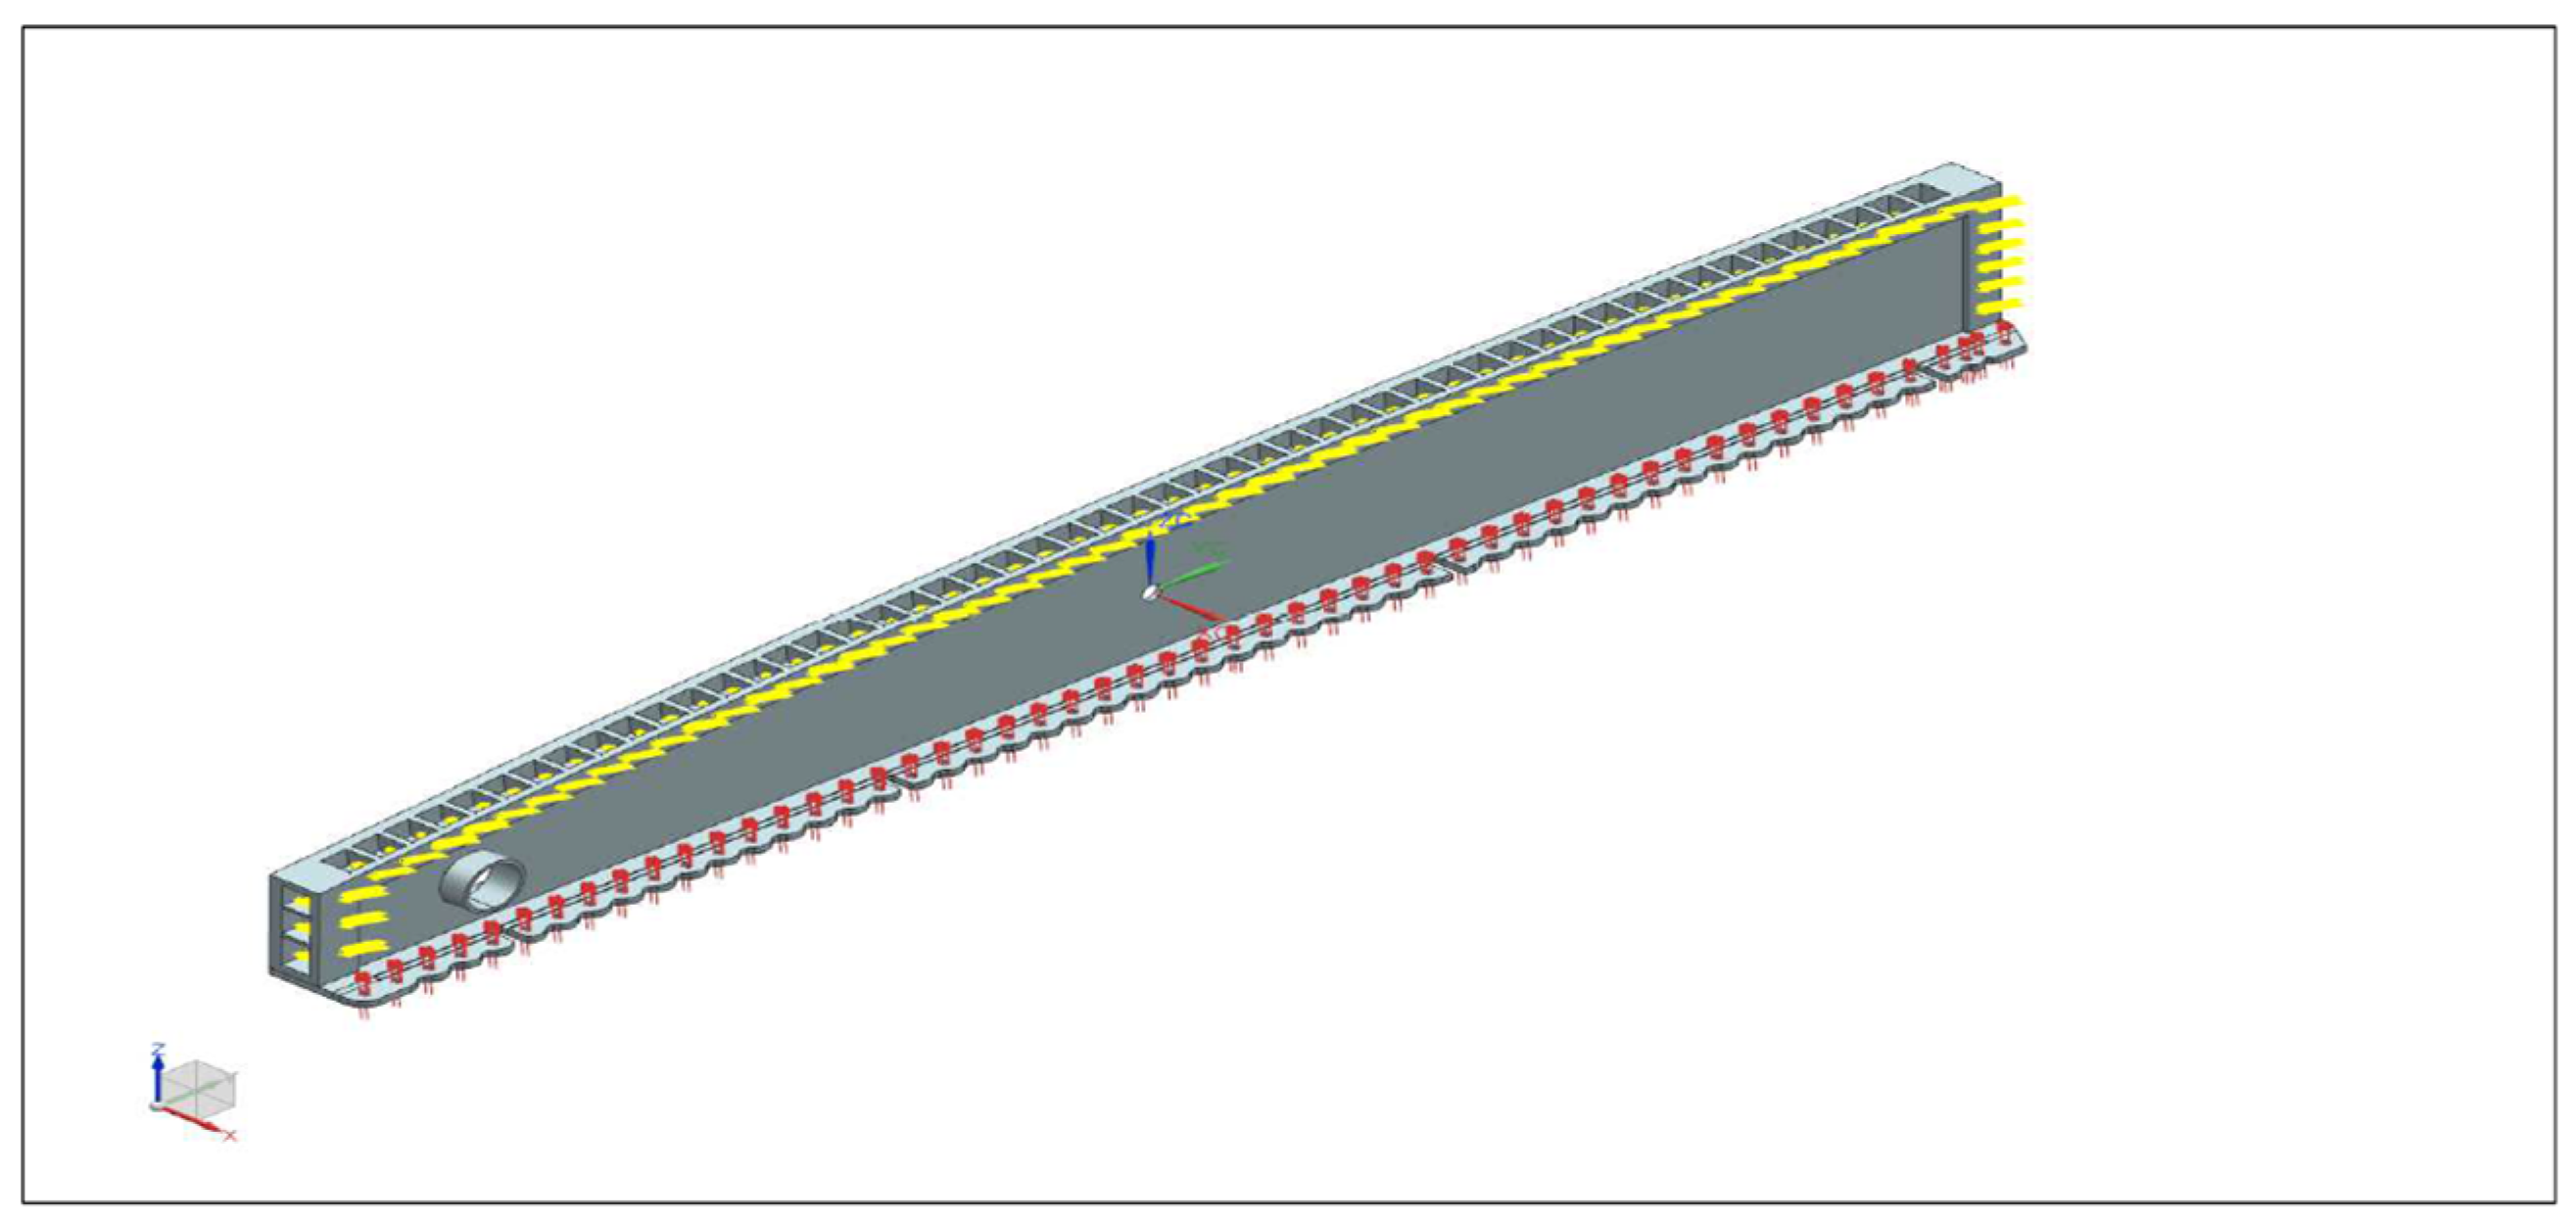
3.5. Development of the Finite Element Model

The FEA model only contained the single component of the wing root joint, which did not include the adjacent components. Strain gauge was be used to calibrate the inboard beam stiffness and the actuator of the fatigue test to match the load point of the actual displacement.
Figure 10 shows the Finite Element Models of the wing root structure portion and the assigned HEX and TET elements. The wing root structure was attached directly to the center wing, and the outer wing was connected to the wing root by bolts through the available holes. The finite element model meshed with mesh sizes of at least 2 mm in size. The initiated crack area was meshed using HEX elements to accommodate ZENCRACK crack block analysis.

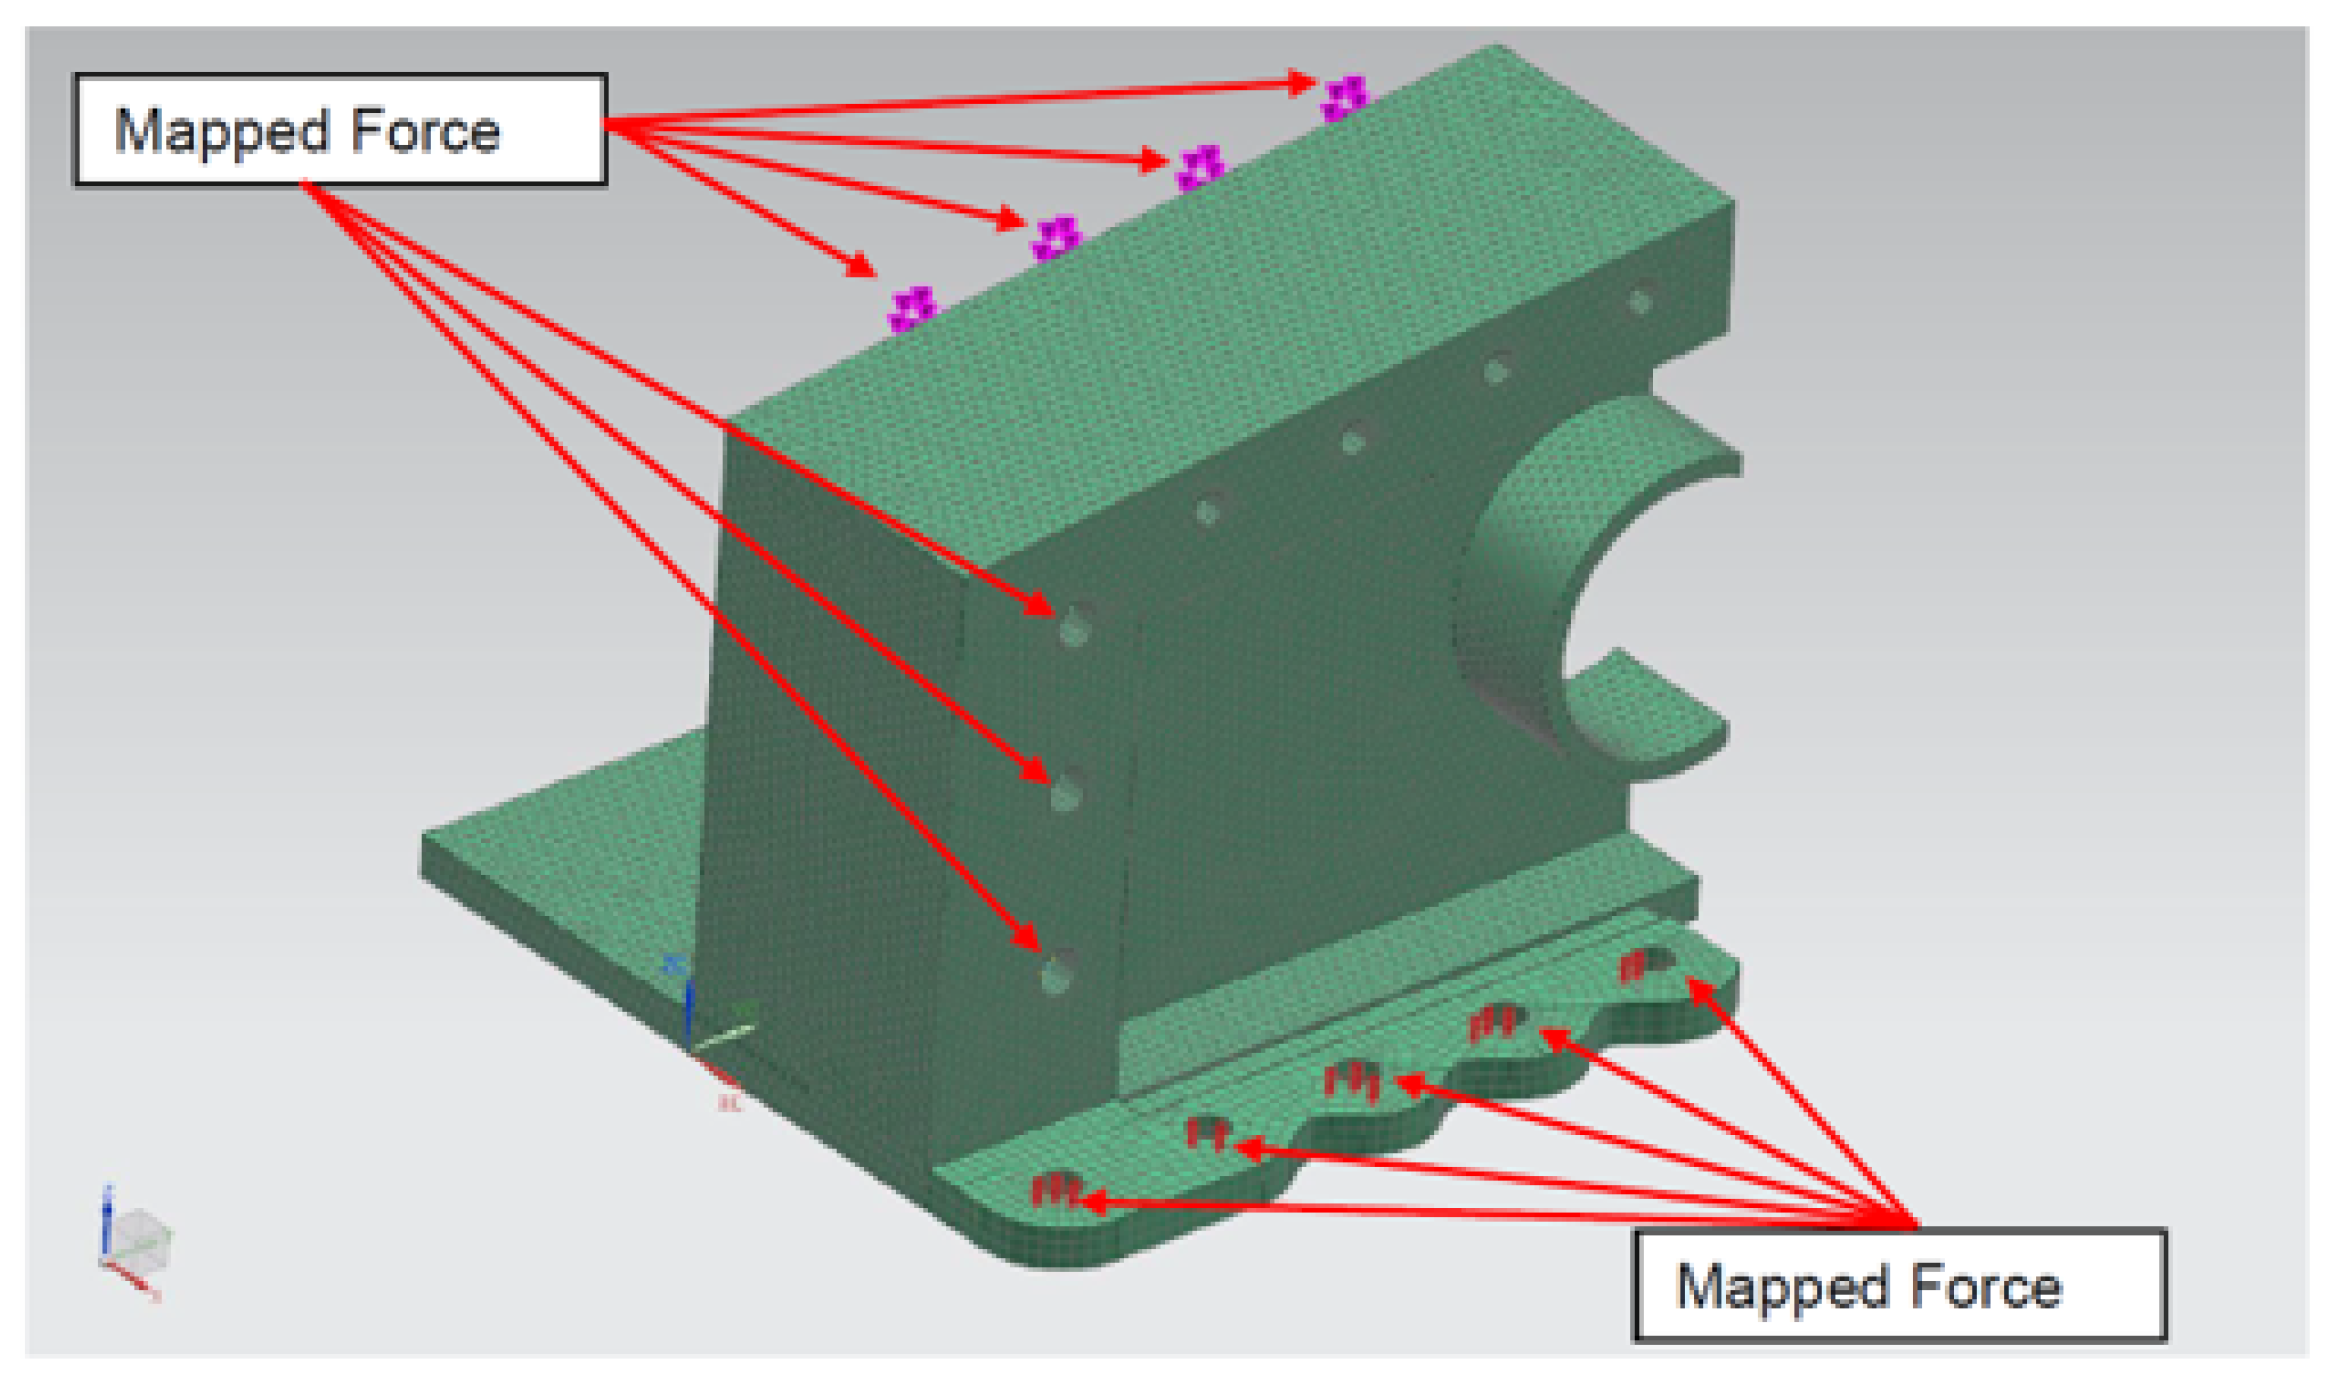
3.6. Loading Point on Wing Root Model

A mapped stress area was obtained from the complete Su-30MKM CAE. The model was used as an initial load input of the structure. An initial load value could be placed on the wing root structure model using these location-based input loads. Figure 11 shows the mapped force used as a load input for the fatigue crack growth analysis.
The loading obtained from the steady flight model showed that the main loading effect for each hole is shown in Table 4.
After completing the finite element analysis using N.X. Nastran, the model was transferred into the fracture mechanic software Zencrack. Multiple parameters needed to be considered before the transfer:
  • Complete CAD model of the structure. The transferred structure must not have any required clean-up or correction. All clean-up and correction must be performed in N.X. software.
  • Assigned mesh on the desired structure model. Hex elements must be used in the model for the area assigned for the crack model. This is required for the crack block system to be implemented.
  • All boundary conditions and loading systems must be in the correct locations.
  • Fatigue data history is not required from the model. Instead, these data will be implemented in the Zencrack simulation software.
Upon completion of all the requirements, Figure 12 shows the comprehensive.
Zencrack model.
Crack growth analysis was conducted using Zencrack on the transferred model to obtain crack behavior, critical crack length, and cracked part lifespan. A summary of the required procedures is as below:
  • CAD model input from N.X.
  • Material and crack properties allocations.
  • Modeling the crack characteristic.
  • Assigning the fatigue load history properties.
  • Mesh relaxation and boundary transfer representative assignment.
  • Zencrack solver interactions and modifications.
Upon completion of all procedures, results of the desired specifications were extracted and compiled.

4. Crack Growth Analysis Result

As stated above, an initiated crack on two locations was analyzed. Therefore, the crack behavior, critical crack length, and cracked part lifespan were entailed by these crack analyses.
Each graph shown in this section shows three different types of data: crack right, crack center, and crack left. The crack left, right, and center signify the crack characteristics and the element’s position in the crack model. For example, the position of these cracks is shown in Figure 13.
The critical crack length depended on the KIc and cycle vs. stress intensity factor graph. The cycle was defined as the number of times the aircraft went through peak and valley occurrences, while the sum of the da was the crack extension. Therefore, the crack behavior and cracked part lifespan was derived through the cycle vs. the sum of the da graph.

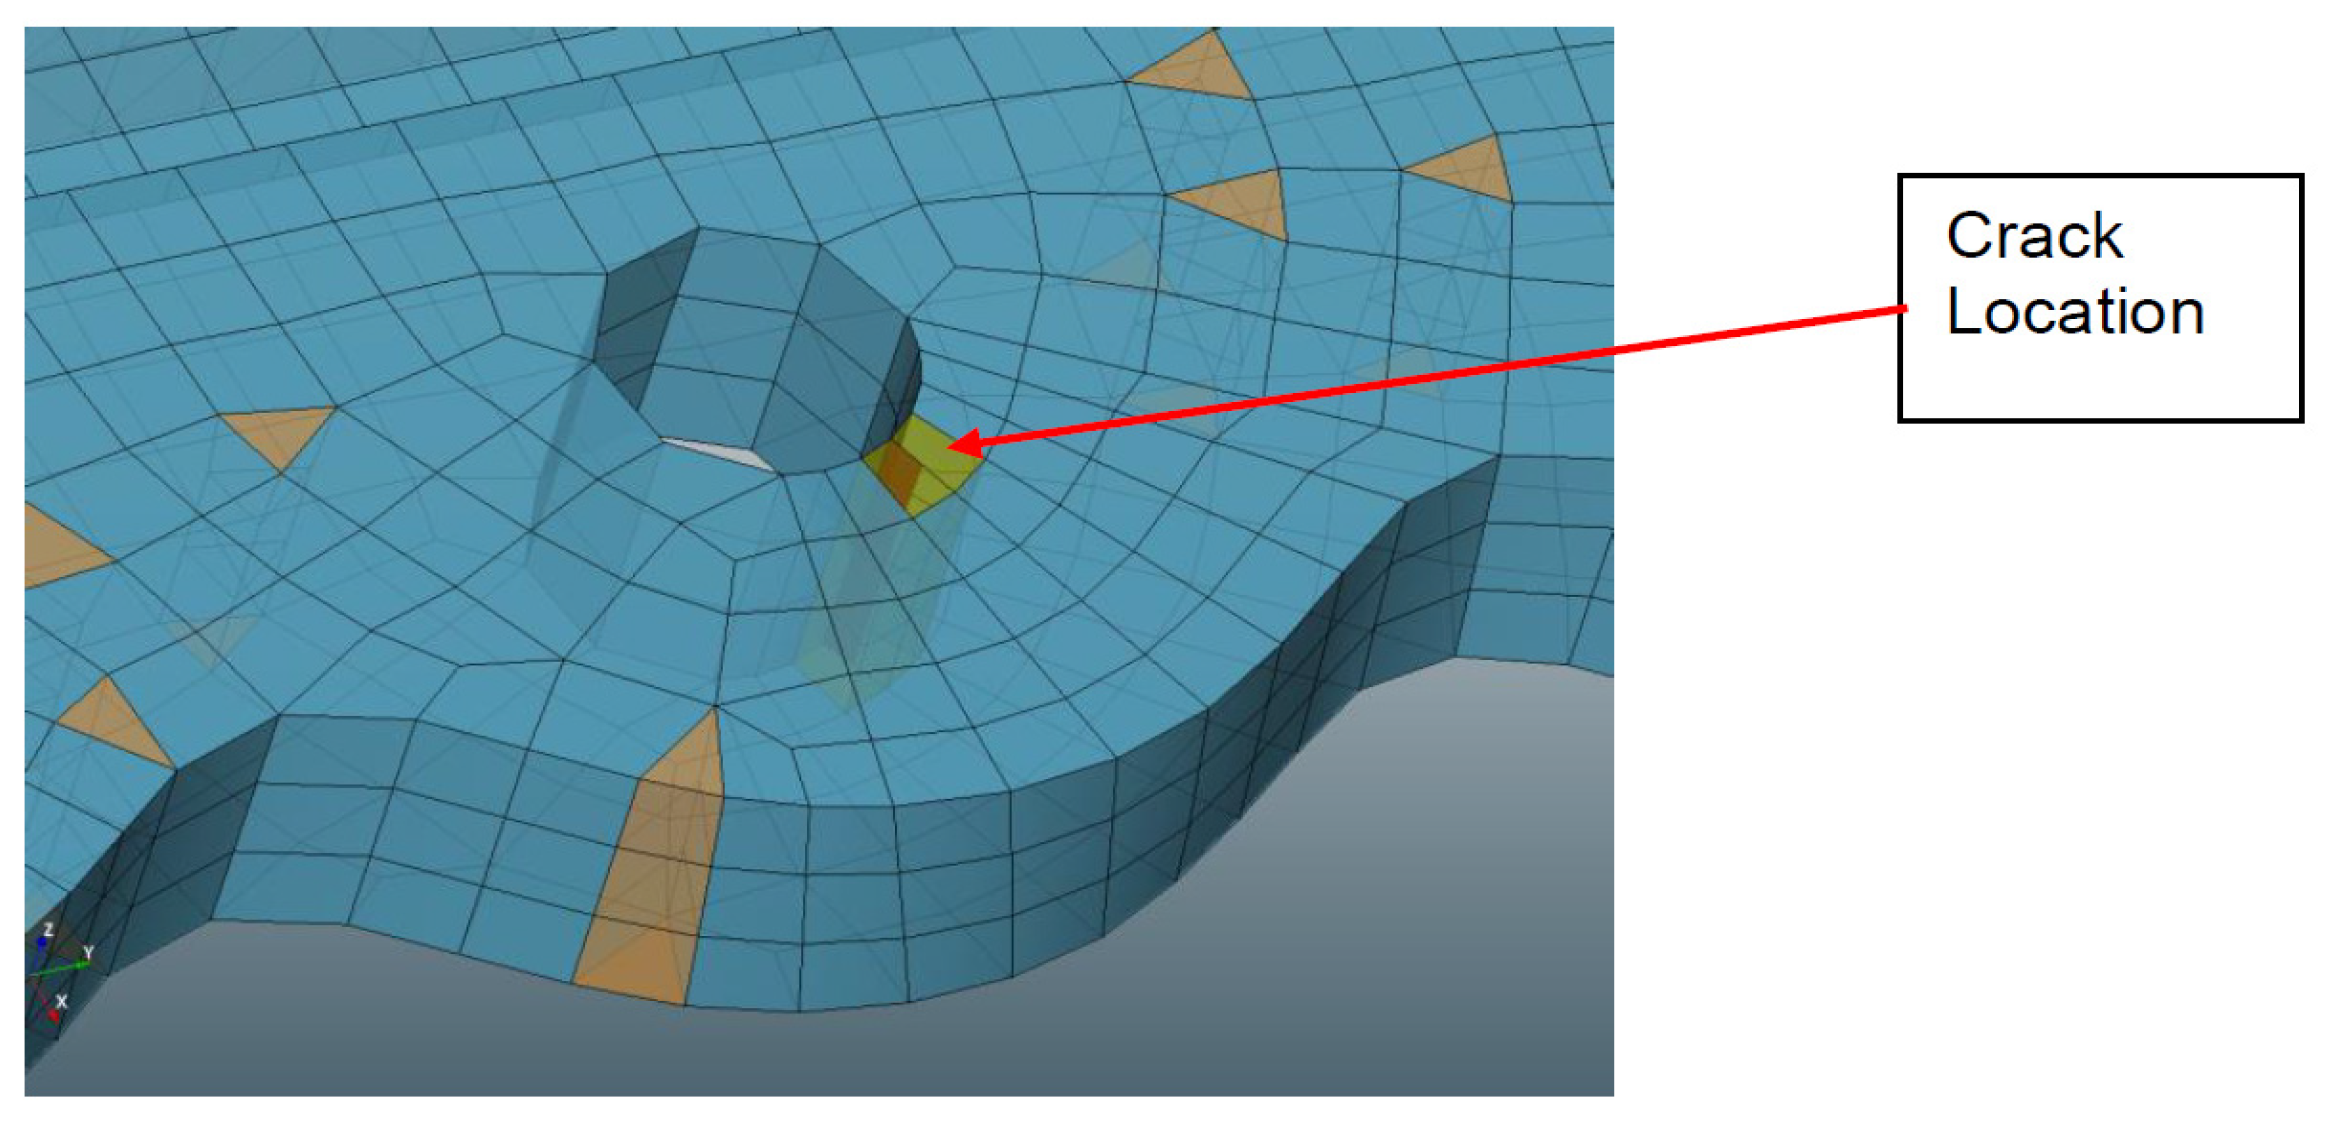
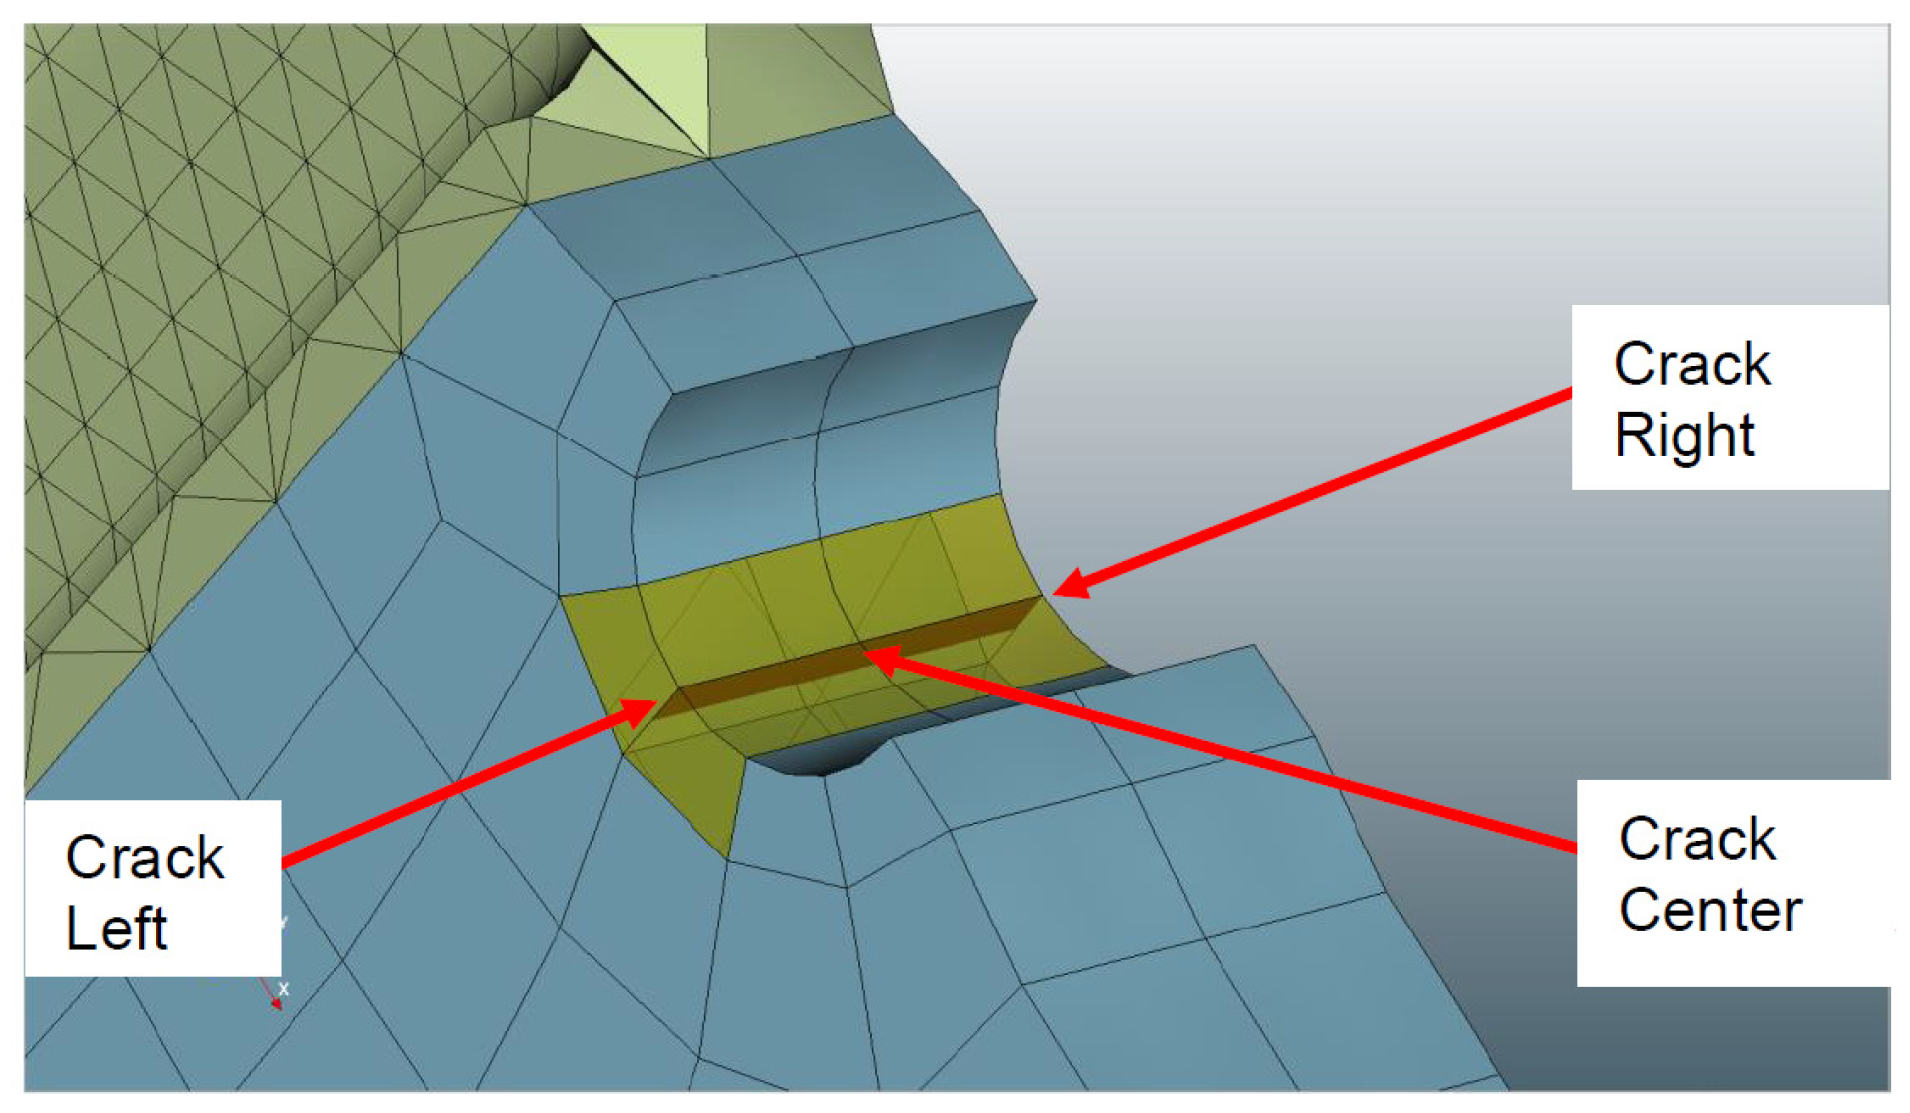
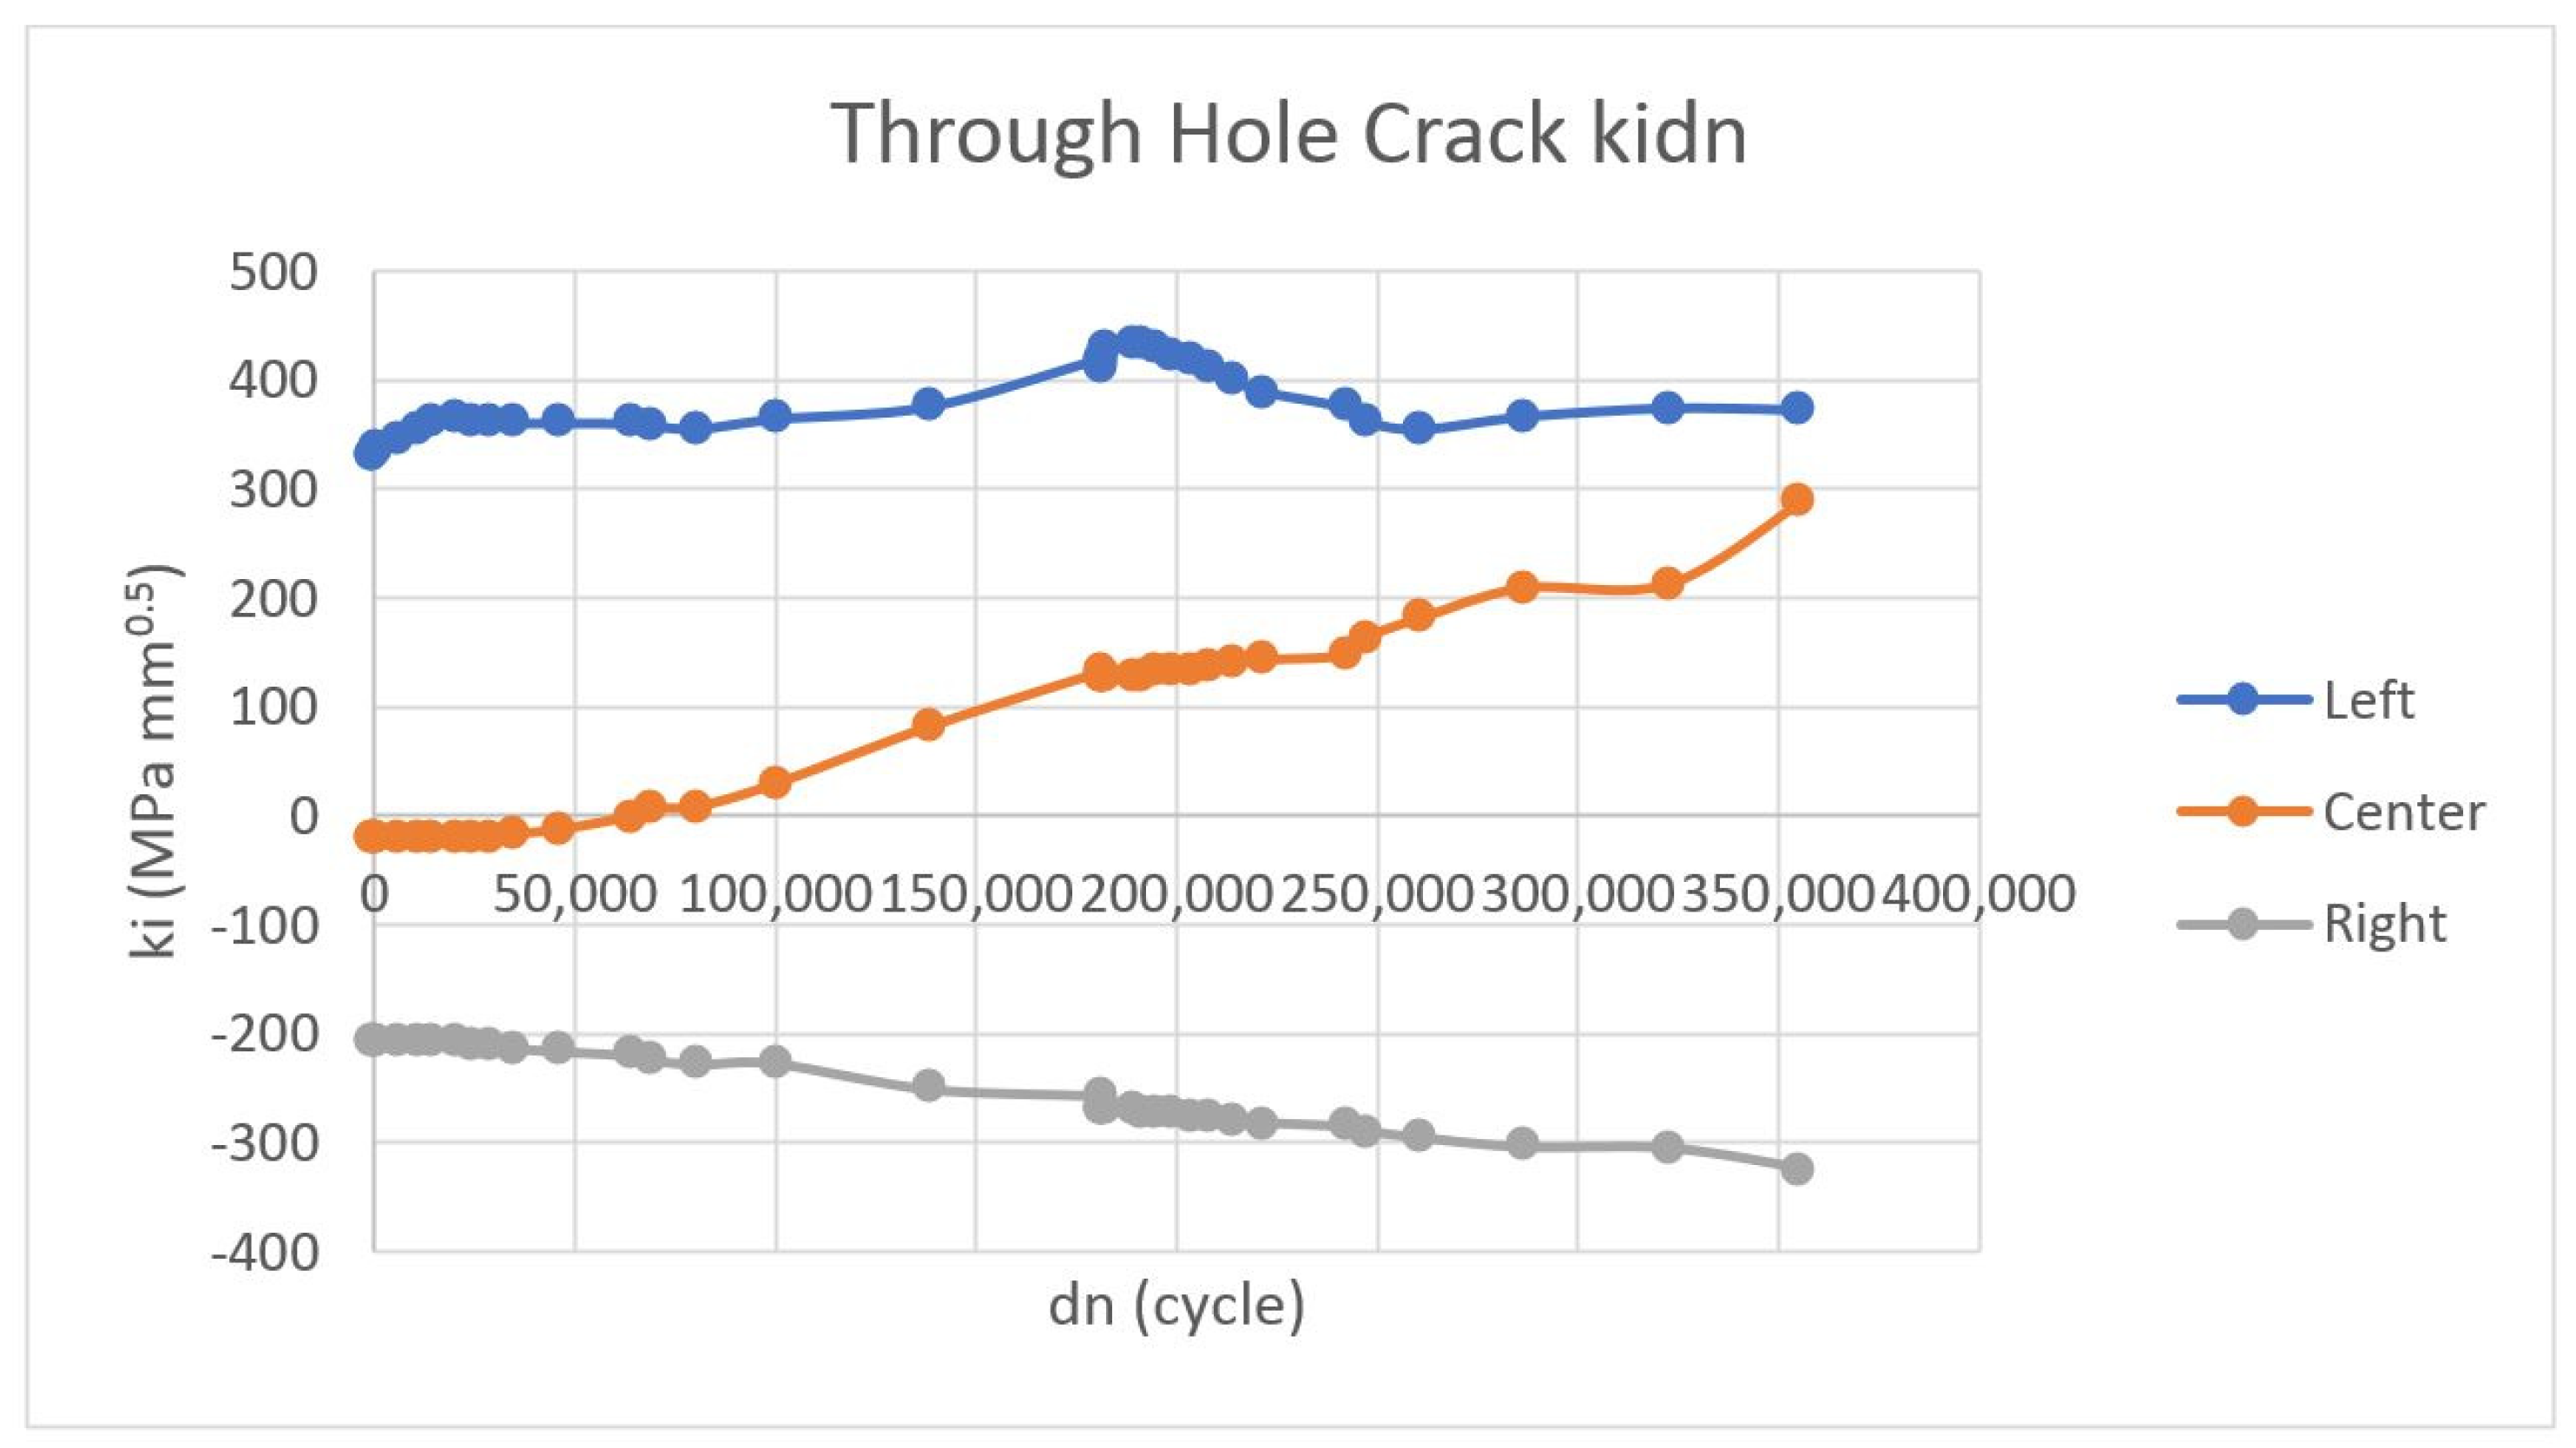
4.1. Through Hole Crack

The crack was modeled to be a straight-through crack with a depth of 2 mm on one of the holes used during attachment. Figure 14 shows the graph of the cycle vs. the sum of da (mm), while Figure 15 shows the graph cycle vs. KI (MPa mm0.5). The crack behavior is shown in Figure 16.

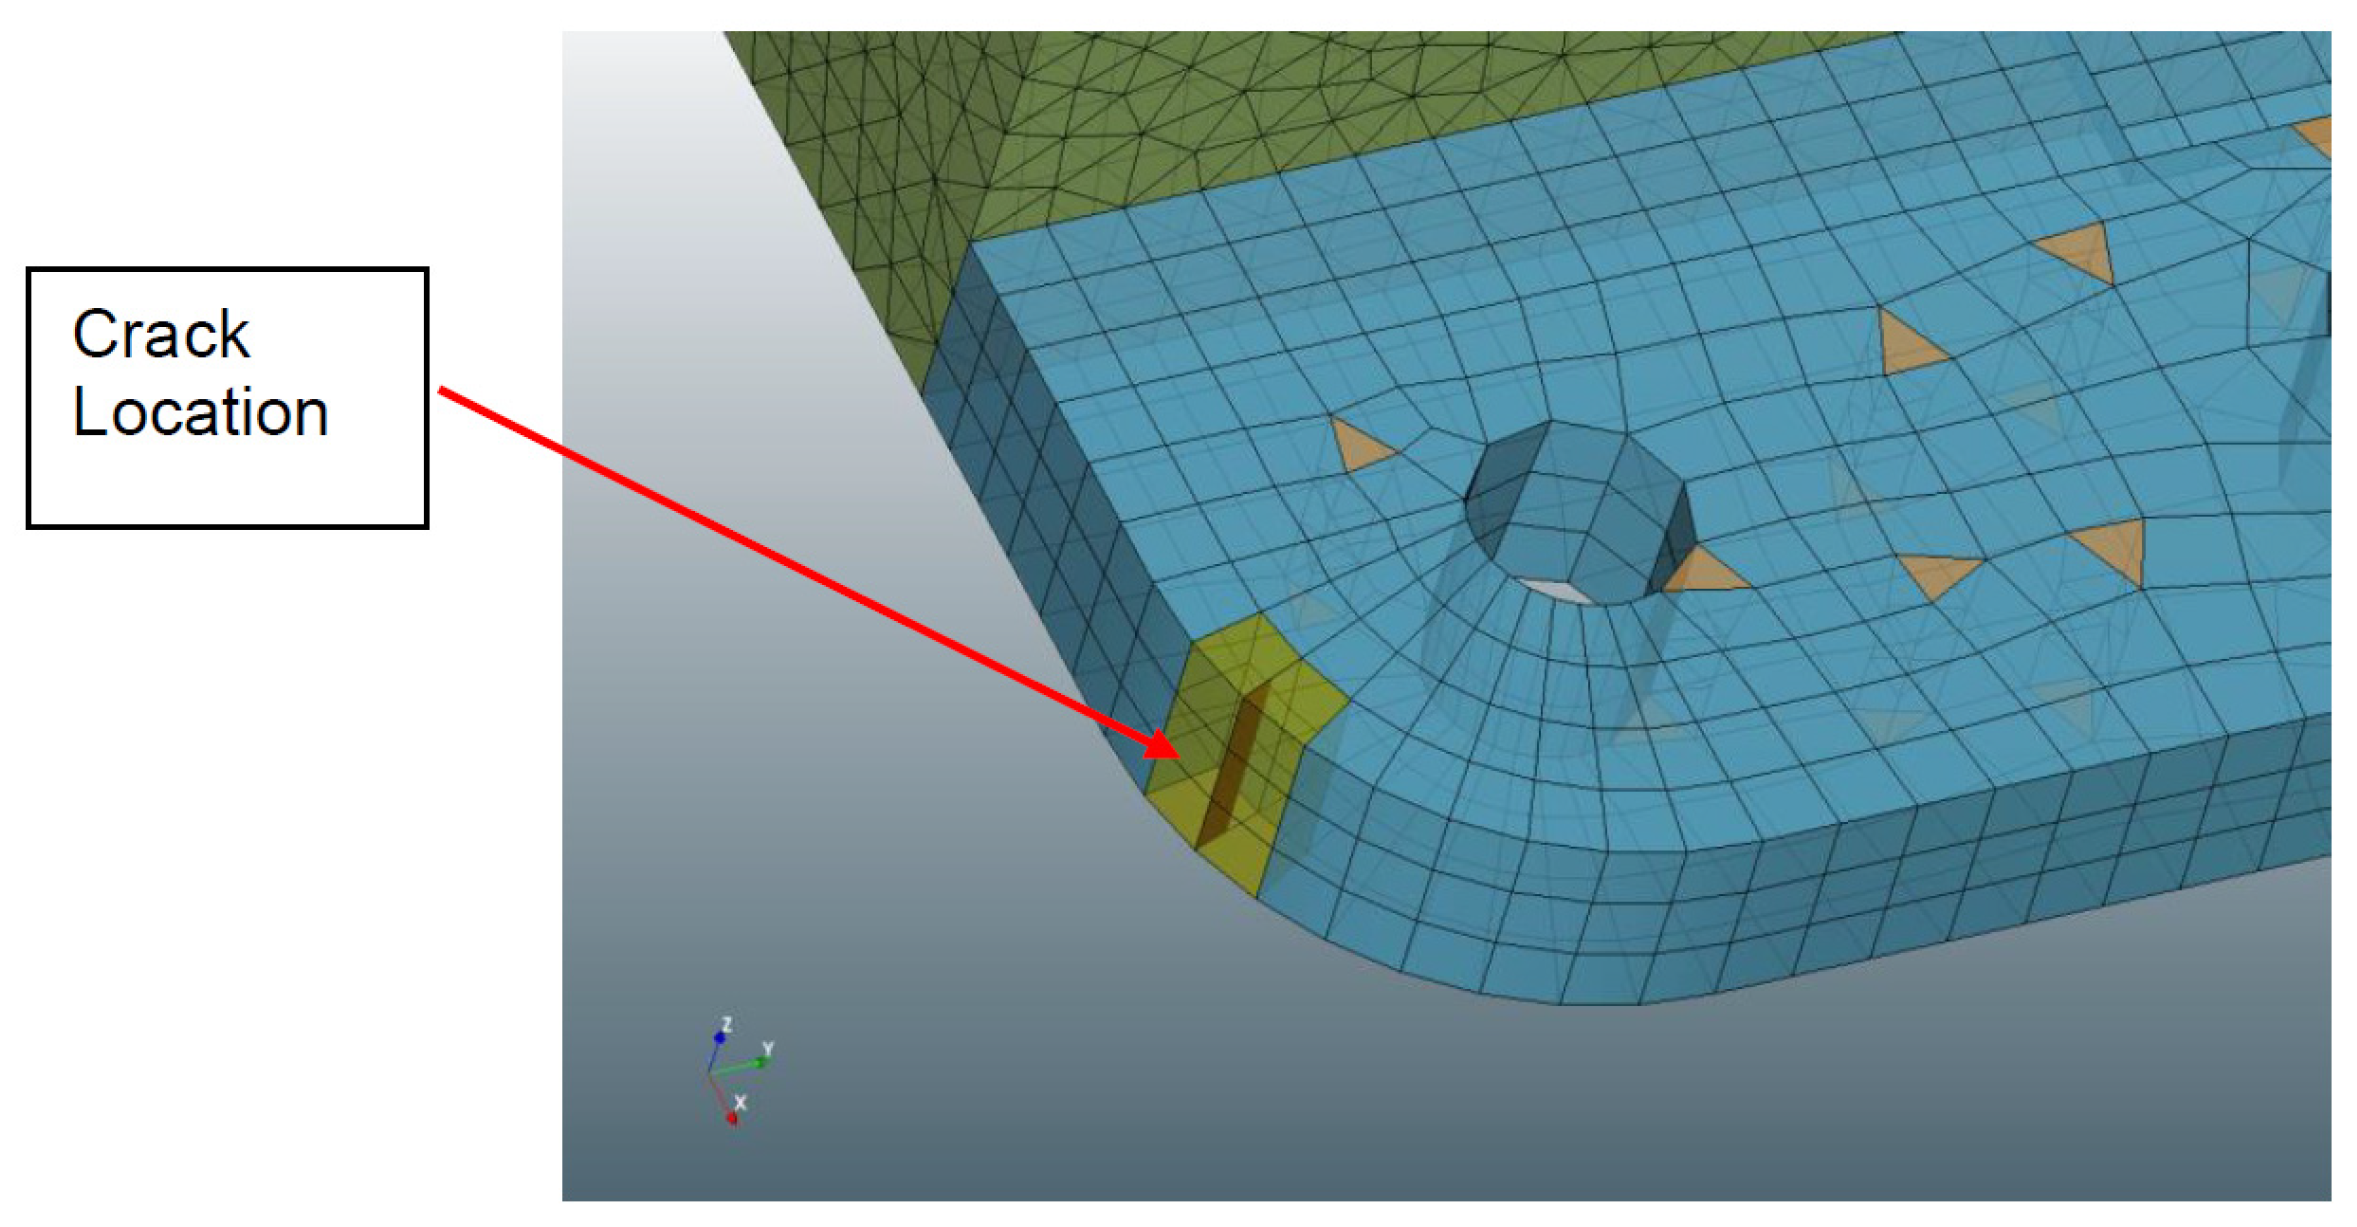
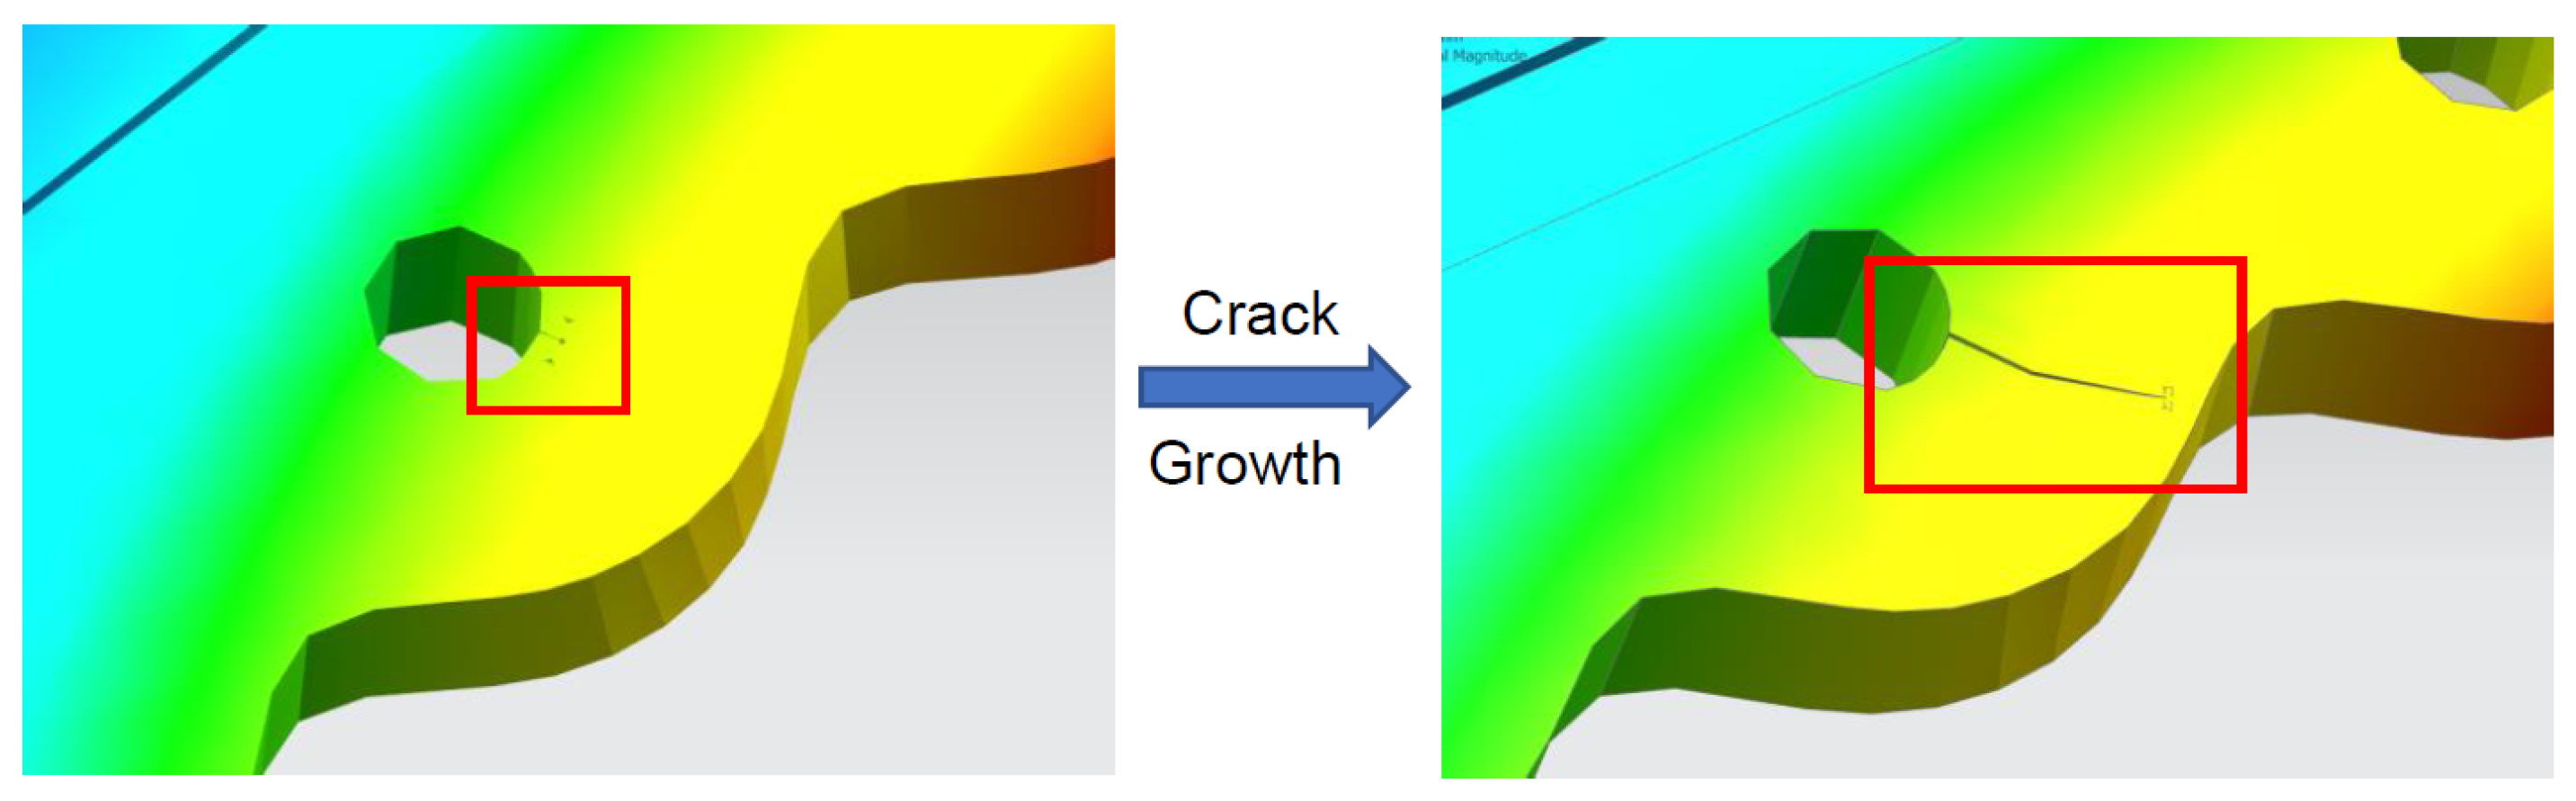
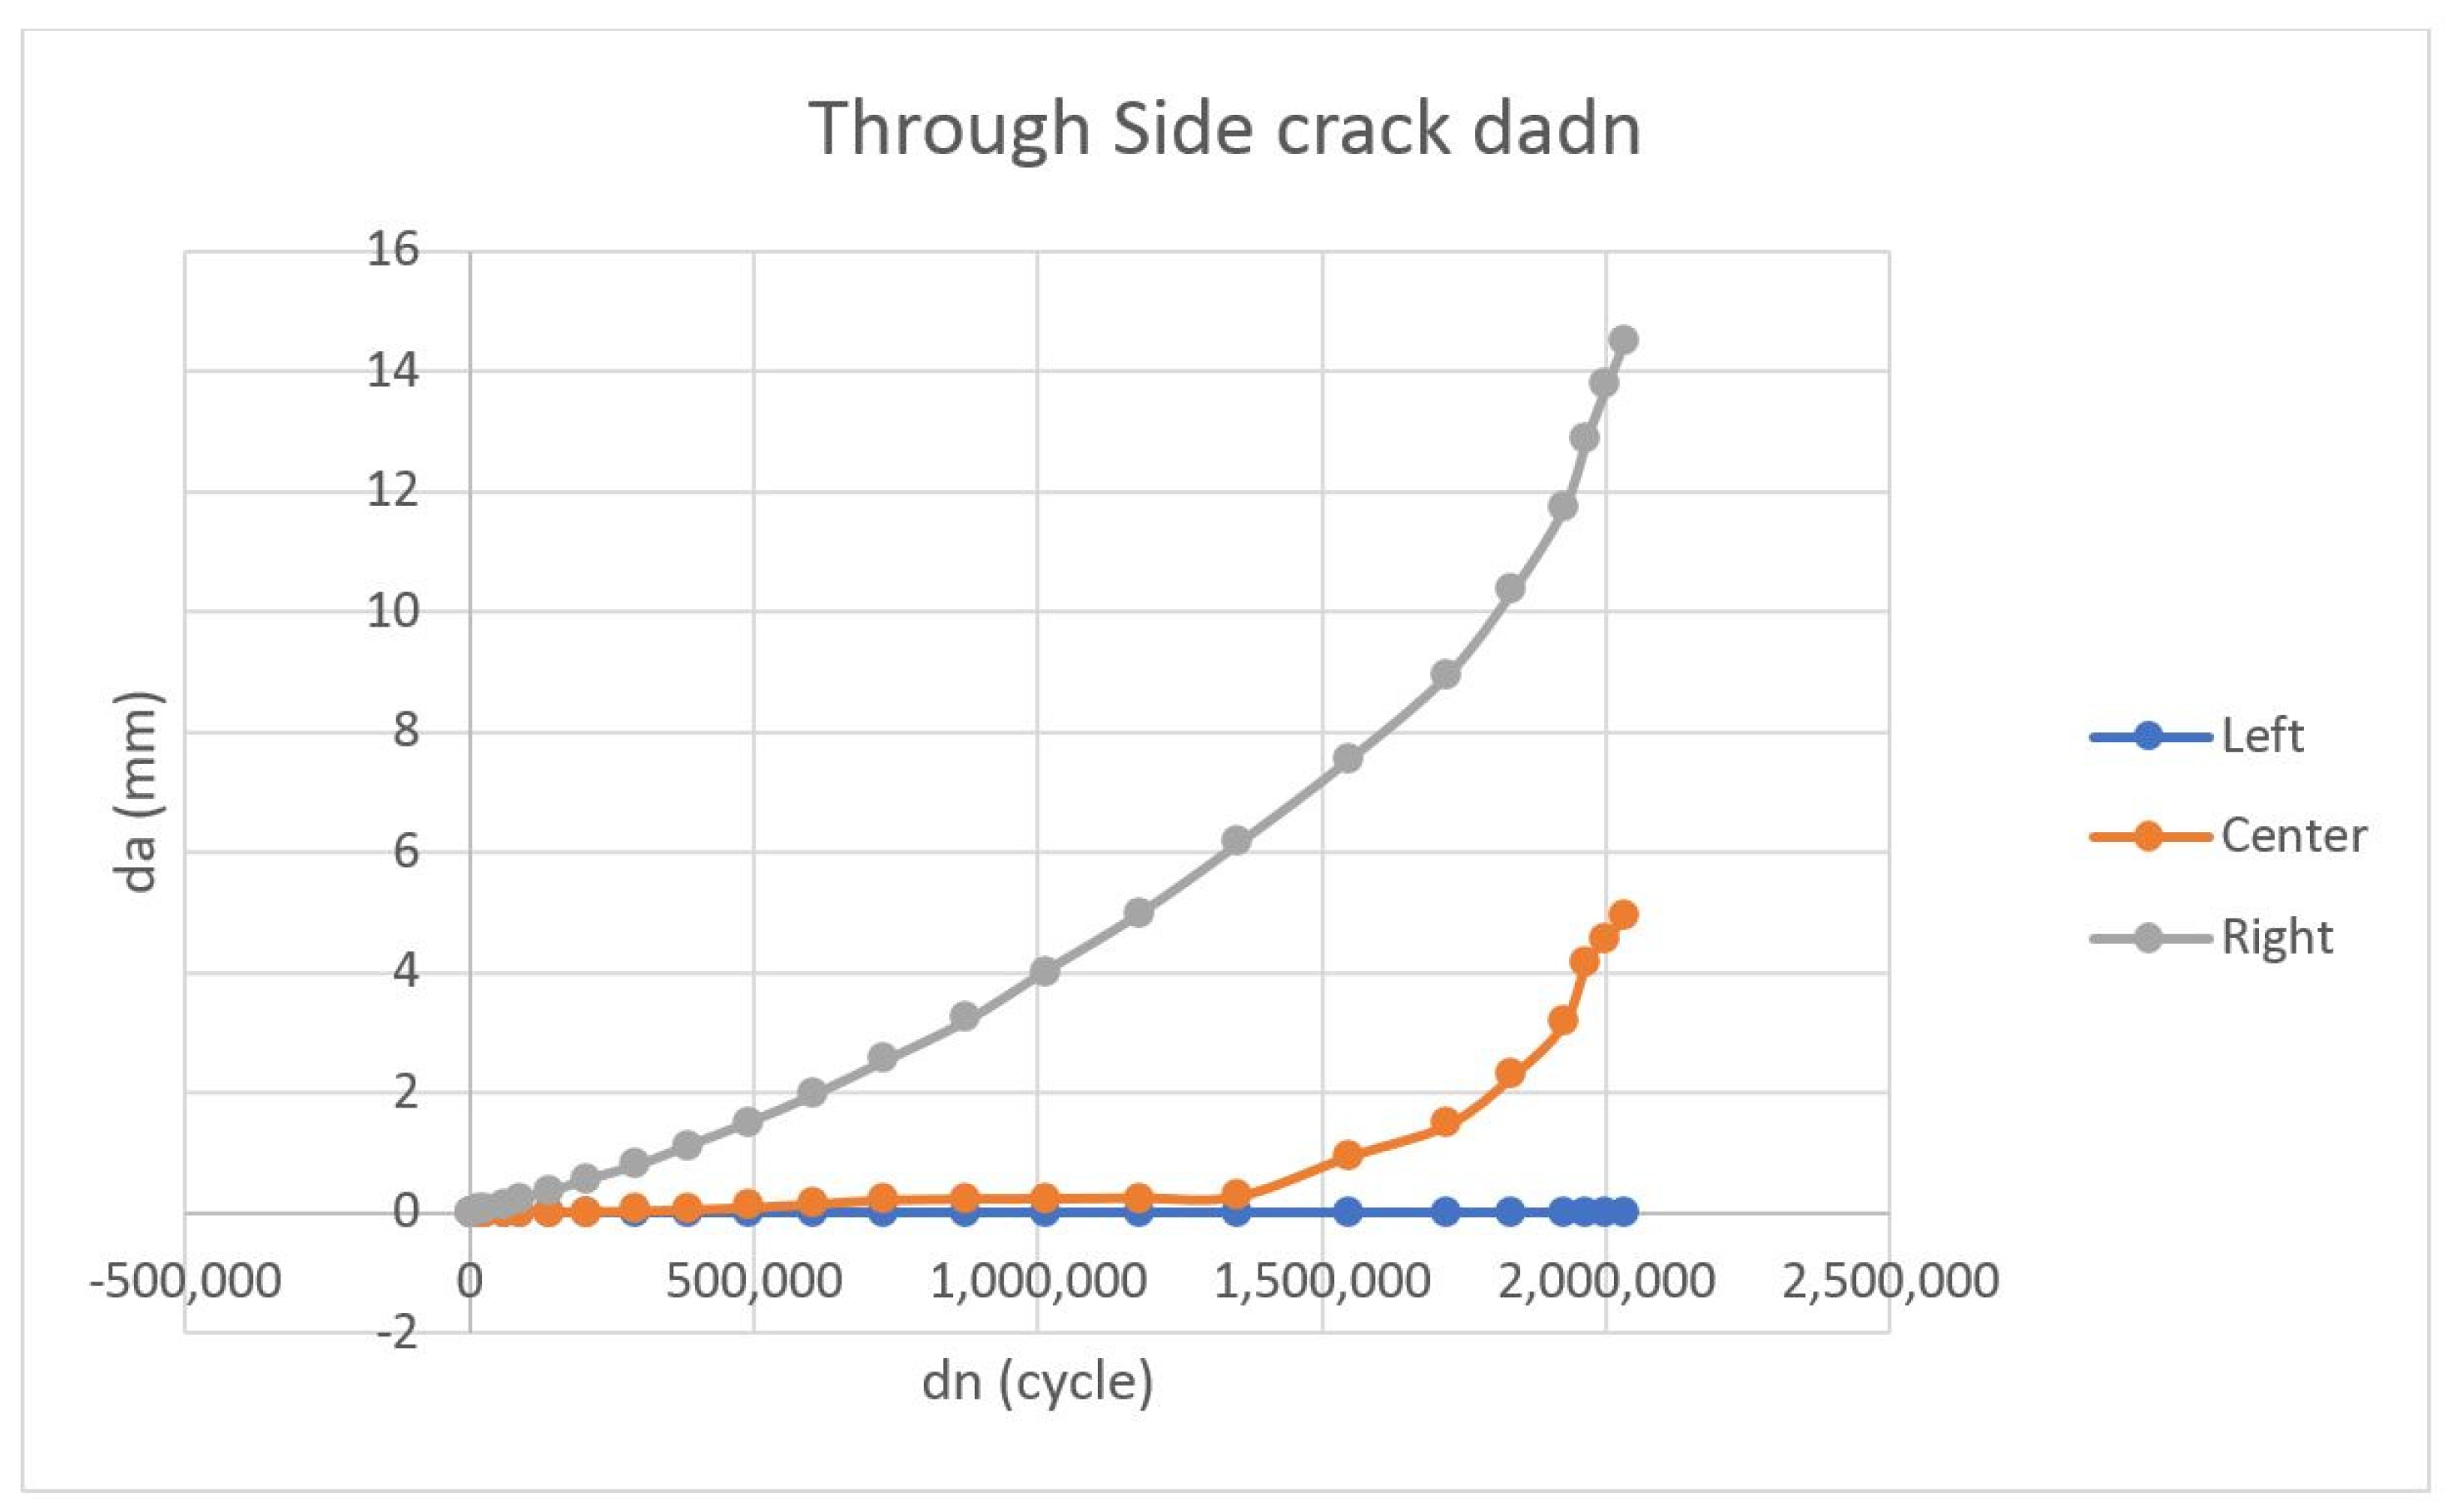
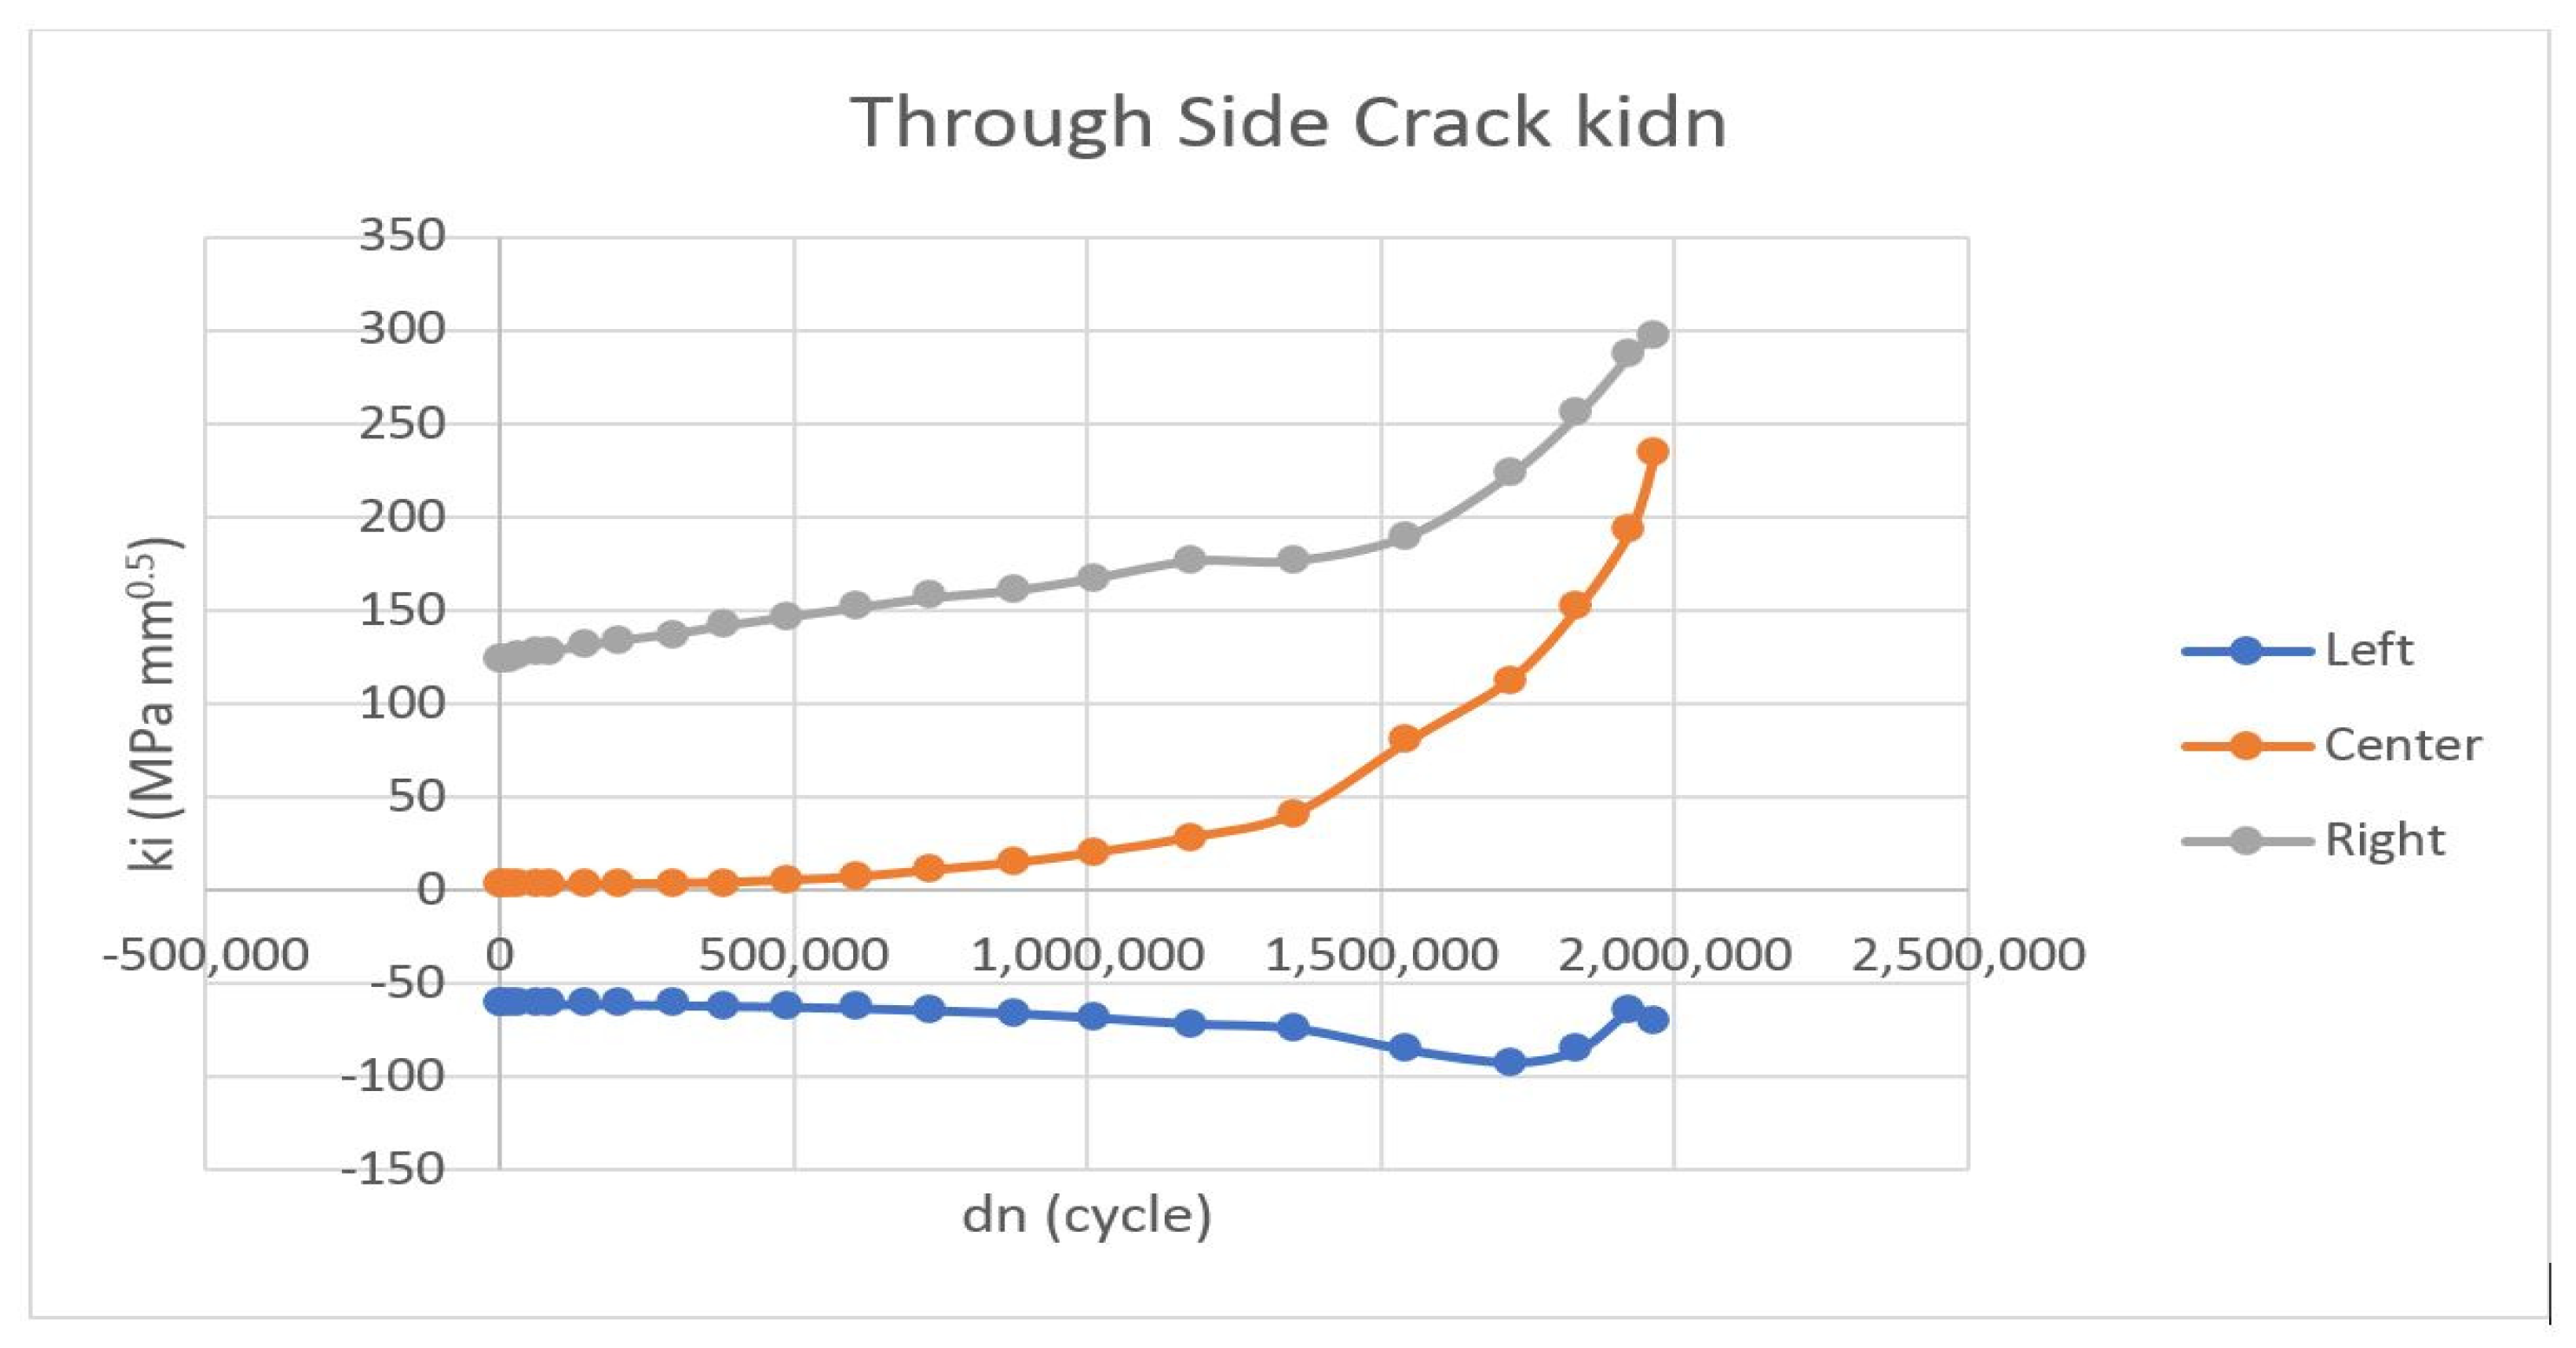
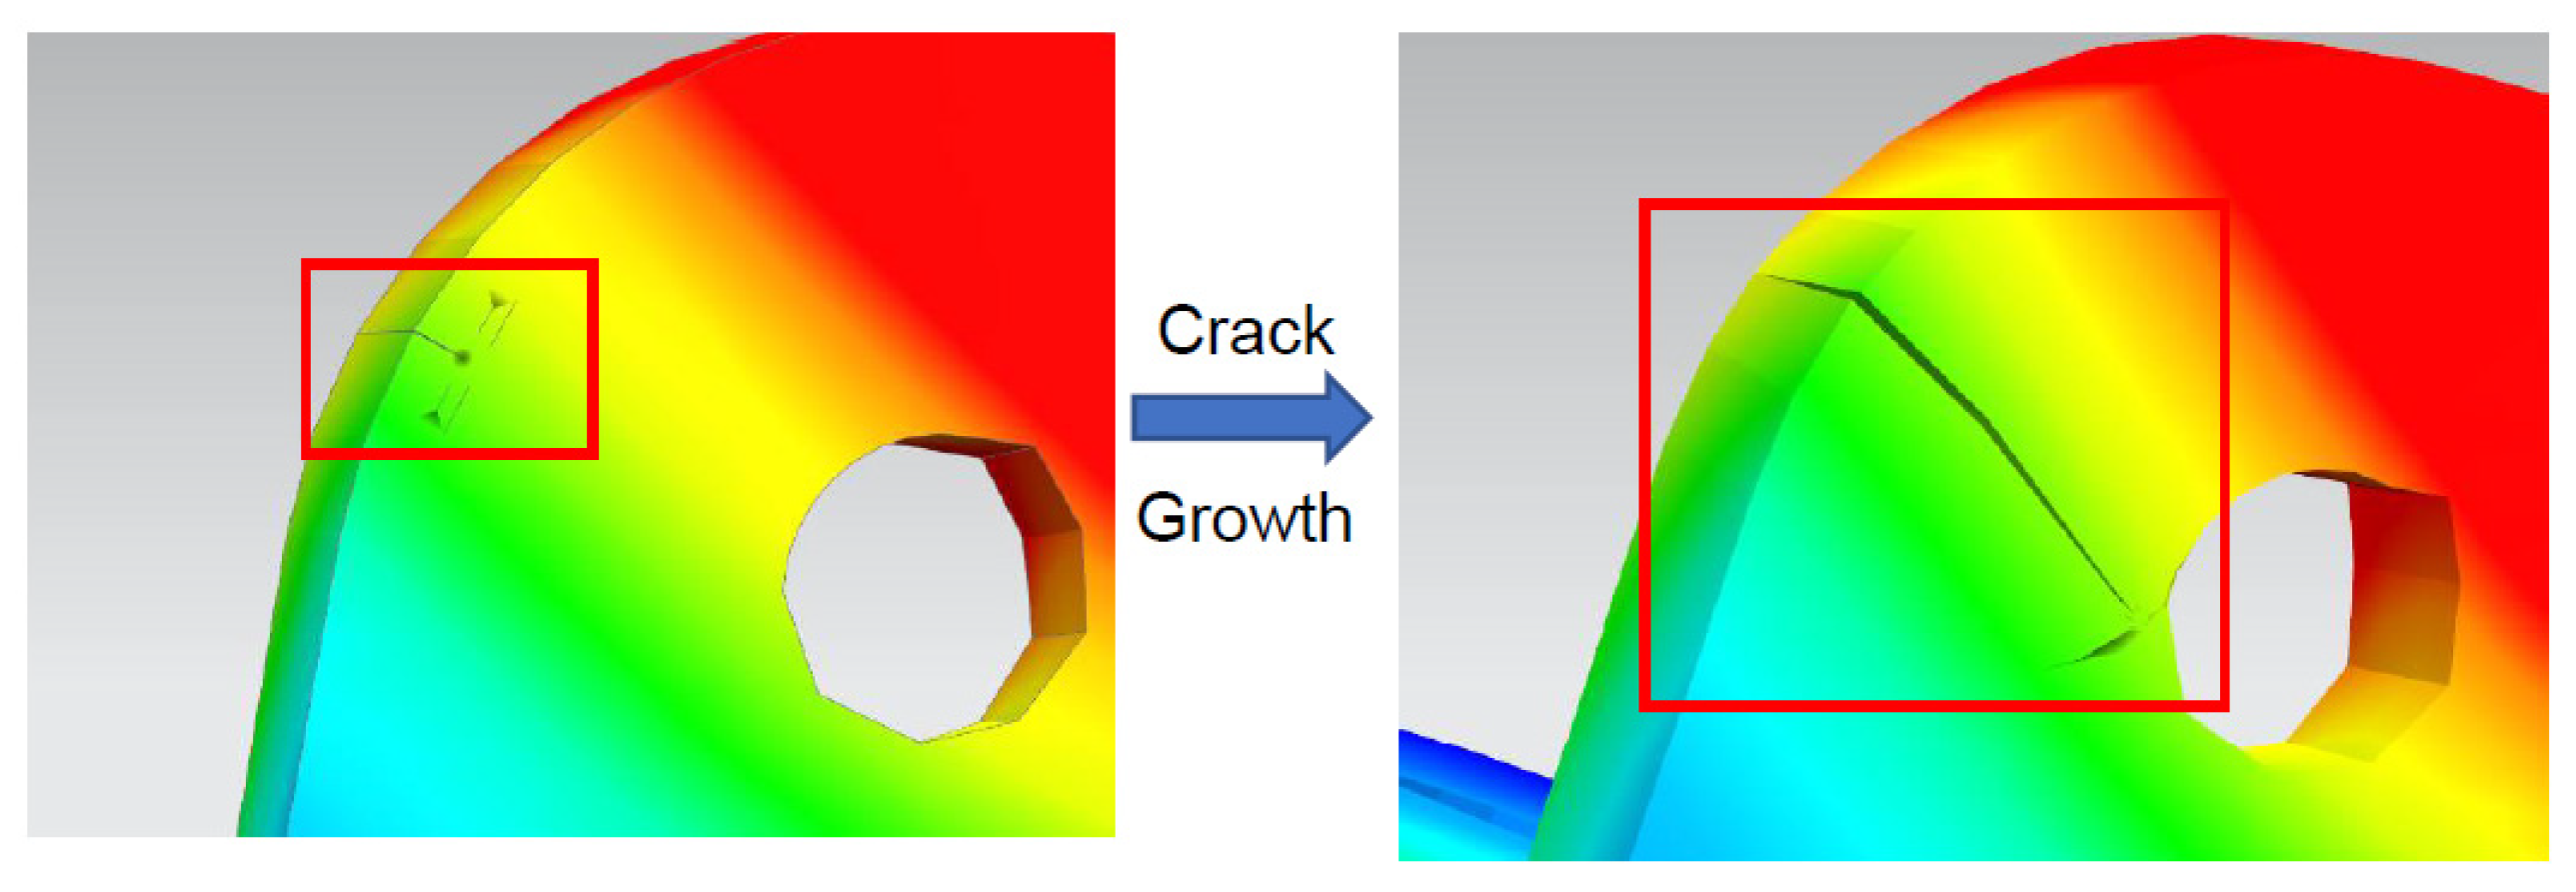
4.2. Through Side Crack

The crack was modeled to be a through the crack on the side of the wing root with a depth of 2 mm. Figure 17 shows the graph of the cycle vs. the sum of da, while Figure 18 shows the graph cycle vs. k, and Figure 19 shows the crack growth behavior.

4.3. FEA Analysis on Local Model

A static analysis, SOL 101, was performed on a wing root model. The wing root geometry was divided into two smaller parts. This was conducted due to these parts having different material properties. Figure 20 shows the constraint, glued solids, and the loading applied. The positive x-axis was the direction of the right wing, while the -x was the direction of the center wing. The top left blue indicator showed the fixed constraint boundary condition, fixing all the x, y, z, and rotation. The top right red indicator showed the glued connection between different meshes and solids. The bottom indicator showed that the top and bottom holes were connected to the center wing through the holes. The bottom part was meshed with a hex element, while the rest had a tetrahedron element, with an average meshing size of 5 mm. Figure 21 shows the FEA local model. The parts and their elements were connected using the surface-to-surface glue method.

4.4. Validation of Crack Growth Prediction and Finite Element Analysis

The fatigue life calculation of Sukhoi 30-MKM was performed on the wing–fuselage lug joint structure. The wing Lug was comprised of two blocks, which were created by using materials Al7075-T6 (aluminum alloy) and VT20-TI (titanium alloy).
Based on the output obtained, the total value of fatigue damage was approximately 0.0018, which indicated that only 0.18% of the damage incurred on the wing lug. For a reminder, a value of one meant 100% of damage had occurred on the structure. Additionally, from the result, a cycle to failure of 541 cycles meant it was very safe in terms of fatigue since one cycle was about ten years’ worth of flying. Therefore, it would take 541 times ten years per cycle for the wing root to fail. The “Local Model stress result” presents that it was expected from the static analysis that fatigue failure would not happen. The fatigue result confirmed this observation. The FEA regional analysis showed that the stress level at the wing root of 193.36 MPa was acceptable and could be deemed safe and adequately designed for mechanical static scenarios. A quick analysis showed that this value was at 20.1% from the Ultimate Tensile Strength (U.T.S.) of VT-20-TI. It showed that since the value was below 40% of U.T.S., it was, therefore, expected that fatigue failure was unlikely to occur at the wing root.

4.5. Summary of the Crack Model and Fatigue Analysis Result

Based on the modeled crack, the through hole crack model reached its critical crack length and its cracked part lifespan soonest. Table 5 shows the result value for each initiated crack model.
Critical crack length occurred when the crack propagated to a point where the crack growth could be spontaneous and catastrophic. This point was then translated to be the limiting value of the lifespan for the cracked part. Due to the design structure of the wing root, the crack growth for the crack in the hole did not reach a critical crack length. Thus, the final crack growth location on the edge of the wing root was selected as a critical crack length.
The justification of an extended lifespan due to the small loading was caused by the steady flight C.F.D. The pressure profile and the material structure has been identified to be of VT20. Comparing the yield stress of VT20, which was 805.58 Mpa and the average applied loading, which was 9887 N, it created a maximum stress load of 68.92 MPa for the 1G flight and 701.82 MPa for a maximum of 9G flight conditions. Both of these applied loads were lower than the yield strength.
A crack initiated on the hole of the wing root would reach critical crack length the soonest, after 35 years and six months compared to the crack initiated on the side of the wing root (132 years) with a similar history usage. This is due to the shape of the wing root structure designed to distribute the stress resultant towards the center of the wing root structure. These would create a larger opening of the hole crack compared to the side crack.
The fatigue analysis showed that the fatigue cycle to failure was 541 cycles (approximately 5410 years), and the current total damage value was at 0.00185 or 0.18% (out of 100%). Therefore, it was deemed that the wing root was well designed for the fatigue scenario.

4.6. Model Validation with Experimental Data

The validity of the crack growth model had to be validated. The prediction was compared with given data in References [41,42,43]. For this study, the crack growth data were tested under variable loading blocks using the 7075-T6 Aluminum alloy.

4.6.1. Crack Growth Rate Constants of Specified Materials

The specified material crack growth constant should be determined before any calculation is conducted. Due to lacking data in reference [42,43] was used to determine the crack growth constant. The fatigue growth data from other papers were used instead for AL 7075-T6. Initially, R = −0.8 was used for the loading spectrum. For this validation, R = −1, 0, and 0.5 were used for the crack growth data. The necessary crack growth data were rescaled using equations (1) and (3) with the given value of β = 0.7 and β 1 = 0.84. The material parameter was then fit into the equation (1). Taking into account the geometrical parameter of the specimens, the parameter was listed in Table 6. The shaping parameter n should be determined by the experiment. However, the value of n would be different from the predicted result and could cause misunderstanding when the data are used to predict the fatigue life subjected to variable loading. For simplicity, the shaping exponent n was set to the same value with the same material.

4.6.2. Predicted Result Compared with Experiment Data

The crack growth data of the material were subjected to variable loading by Porter [43]. This study was used to validate the current crack model. Figure 22a shows the loading block. Figure 22b compares the AL7075-T6 crack growth model with different p, q values. The prediction model was compared with test data shown in Table 5. The curve could be seen as abnormal. The current model was used for the prediction of crack growth under variable cyclic loading, as mentioned. Crack models such as NASTRAN and AFGROW were used. It was concluded that different loading blocks yielded different results while the crack growth model still held valid results, as depicted in Figure 22b.

5. Conclusions and Recommendation

A numerical crack growth prediction method implemented in ZENCRACK and the finite element analysis was used to predict a three-dimensional surface crack growth in the aircraft wing root under military operation loading conditions. Based on the results obtained, the analysis produced crack growth predictions that correlated well with the actual operational case. However, the linear elastic fracture mechanics predictions could be conservative regarding the actual crack growth, especially in high thermally driven stress areas.
The results also showed that with stress loading amounting to almost 9G, the maximum force acting on the structure was lower than the maximum yield strength. This can provide a solid basis for the extension of the wing root for the aircraft. Besides that, the Aircraft Structure Integrity Program initiated for the fleet will further enhance the structure assessment through Condition and Usage monitoring.
Based on the analysis performed, the following general recommendations could be drawn:
  • ZENCRACK was most helpful in inserting cracks with complicated shapes into existing 3D F.E. meshes. The feature of the crack block mesh significantly reduced the meshing time and modeling complexity. In addition, the compatibility with the analysis software such as ABAQUS (Dassault Systems, Boston, USA) was a positive feature, allowing the stress intensity factors to be readily calculated for complex geometries and crack shapes.
  • Mechanical and thermal loads could be included in calculating stress intensity and crack growth, although this was related to other crack growth software capabilities.
  • The crack growth modeling was based on linear elastic fracture mechanics and was limited to a crack growth analysis in linear elastic domains. In addition, the crack growth law (Paris equation) implemented in ZENCRACK was too fundamental for predicting crack growth in many practical situations.
  • The installation of a strain gauge should be performed to validate the simulation data and enhance the capability of Structure Health Monitoring (S.H.M.).

Author Contributions

Conceptualization, A.V., R.M. and M.F.S.K.; methodology, A.V., R.M. and M.F.S.K.; software, A.b.A.; validation, A.V., R.M. and M.F.S.K.; formal analysis, A.V., M.F.S.K., A.S., A.b.A. and O.E.; investigation, A.V., R.M., M.F.S.K., A.b.A. and O.E.; resources, A.S. and A.b.A.; data curation, A.V.; writing—original draft preparation, A.V.; writing—review and editing, A.V., R.M. and O.E.; visualization, A.S. and A.b.A.; supervision, R.M. and M.F.S.K.; project administration, A.V. and R.M.; funding acquisition, R.M., A.S. and A.b.A. All authors have read and agreed to the published version of the manuscript.

Funding

The project was funded by the Ministry of Higher Education under Fundamental Research Grant Scheme with FRGS UTM Vote No.: R.K130000.7856.5F205 and Universiti Teknologi Malaysia with “Geran Universiti Penyelidik” (GUP) Tier 2 Scheme, with UTM Vote No.: Q.K130000.2656.16J42.

Data Availability Statement

The data presented in this study are available on request from the corresponding author.

Acknowledgments

The project was funded by the Ministry of Higher Education under the Fundamental Research Grant Scheme with FRGS UTM Vote No.: R.K130000.7856.5F205 and Universiti Teknologi Malaysia with “Geran Universiti Penyelidik” (GUP) Tier 2 Scheme, with UTM Vote No.: Q.K130000.2656.16J42. The authors would like to express their greatest appreciation and utmost gratitude to the Ministry of Higher Education for awarding the Fundamental Research Grant Scheme, Razak Faculty of Technology and Informatics, Universiti Teknologi Malaysia (UTM). RMAF Centre of Aerospace Engineering Services Establishment, Subang Airbase, Shah Alam Selangor, Aerospace Technology Systems Corp. Sdn Bhd, ATSC Corporate Centre, Jalan Lapangan Terbang, Subang, Selangor, CAIDMARK Sdn Bhd, Damansara Utama, Petaling Jaya, Selangor and Sekolah Latihan Tempur TUDM, TUDM Bukit Ibam, Muadzam Shah, and Pahang for all the support towards making this study a success.

Conflicts of Interest

The authors declare no conflict of interest.

References

  1. Reeves, J.D.; Eveleigh, T.; Holzer, T.; Sarkani, S. The impact of early design phase risk identification biases on space system project performance. In Proceedings of the 2012 IEEE International Systems Conference SysCon 2012, Vancouver, BC, Canada, 19–22 March 2012; pp. 1–8. [Google Scholar]
  2. Clark, G. Aircraft fatigue life extension: Development of a mid-life rework method based on peening. In European Structural Integrity Society; Elsevier: Melbourne, Australia, 2000; Volume 26, pp. 97–114. [Google Scholar]
  3. Venugopal, A.; Mohammad, R.; Koslan, M.F.S.; Sayd Bakar, S.R.; Ali, A. The Effect of Tropical Environment on Fatigue Failure in Royal Malaysian Airforce (RMAF) Aircraft Structure and Operational Readiness. Materials 2021, 14, 2414. [Google Scholar] [CrossRef]
  4. Maksimović, S.; Vasić, Z.; Došić, R. Service Life Extension Program for Aircraft Structures. Sci. Tech. Rev. 2015, 65, 9. [Google Scholar] [CrossRef] [Green Version]
  5. Padfield, G.D. Flight Simulation in Machine Design and Manufacture; Padfield, G.D., Ed.; Blackwell Publishing: Oxford, UK, 2007. [Google Scholar]
  6. Olurin, O.B.; McCullough, K.Y.G.; Fleck, N.A.; Ashby, M.F. Fatigue crack propagation in aluminum alloy foams. Int. J. Fatigue 2001, 23, 375–382. [Google Scholar] [CrossRef]
  7. Jianguo, C.; Junjie, G.; Zhonghai, L.; Liqiu, L.; Jian, G.; Wei, L. The Fatigue Life Prediction Model Research for Aeroplane Structures. In Proceedings of the 2010 3rd International Symposium on Systems and Control in Aeronautics and Astronautics, Harbin, China, 8–10 June 2010. [Google Scholar]
  8. Alvesa, A.S.F.; Sampayoa, L.M.C.M.V.; Correiaa, J.A.F.O.; Jesus, A.M.P.D.; Moreiraa, P.M.G.P.; Tavaresa, P.J.S. Fatigue life prediction based on crack growth analysis using an equivalent initial flaw size model: Application to a notched geometry. Procedia Eng. 2015, 114, 730–737. [Google Scholar] [CrossRef] [Green Version]
  9. Xiang, Y.; Lu, Z.; Liu, Y. Crack growth-based fatigue life prediction using an equivalent initial flaw model. Part I: Uniaxial loading. Int. J. Fatigue 2010, 32, 341–349. [Google Scholar] [CrossRef]
  10. USAF. MIL-STD-1530C Aircraft Structure Integrity Program (ASIP); Department of Defense Standard Practice, United State Air Force: Arlington County, VA, USA, 2004. [Google Scholar]
  11. Hoeppner, D.W. The initiation of fatigue in aluminum alloys. In Proceedings of the Symposium on the Relation between Heat Treatment, Microstructure and Fatigue in Structural Materials, Atlanta, GA, USA, 17–20 May 1971. [Google Scholar]
  12. Boyer, H.E. Atlas of Fatigue Curves; ASM International: Novelty, OH, USA, 1986. [Google Scholar]
  13. Suresh, S. Fatigue of Materials, 2nd ed.; Cambridge University: Cambridge, UK, 1998. [Google Scholar]
  14. Zhan, Z.; Hu, W.; Li, B.; Zhang, Y.; Meng, Q.; Guan, Z. Continuum damage mechanics combined with the extended finite element method for the total life prediction of a metallic component. Int. J. Mech. Sci. 2017, 124, 48–58. [Google Scholar] [CrossRef]
  15. Gori, Y.; Verma, R.P.; Kumar, A.; Patil, P.P. FEA based fatigue crack growth analysis. Mater. Today 2021, 200–207. [Google Scholar] [CrossRef]
  16. Si, Y.; Rouse, J.P.; Hyde, C.J. Potential difference methods for measuring crack growth: A review. Int. J. Fatigue 2020, 136, 105624. [Google Scholar] [CrossRef]
  17. Geary, W. A review of some aspects of fatigue crack growth under variable amplitute loading. Int. J. Fatigue 1992, 14, 377–386. [Google Scholar] [CrossRef]
  18. Chakherlou, T.N.; Mirzajanzadeh, M.; Vogwell, J.; Abazadeh, B. Investigation of the fatigue life and crack growth in torque tightened bolted joints. Aerosp. Sci. Technol. 2011, 15, 304–313. [Google Scholar] [CrossRef]
  19. Sadananda, K.; Vasudevan, A.K.; Holtz, R.L.; Lee, E.U. Analysis of overload effects andrelated phenomena. Int. J. Fatigue 1999, 21, S233–S246. [Google Scholar] [CrossRef]
  20. Schijve, J. Some formulas for the crack opening stress level. Eng. Fract. Mech. 1981, 14, 461–465. [Google Scholar] [CrossRef] [Green Version]
  21. Noroozi, A.H.; Glinka, G.; Lambert, S. A two parameter driving force for fatigue crack growth analysis. Int. J. Fatigue 2005, 27, 1277–1296. [Google Scholar] [CrossRef]
  22. Huang, X.; Moan, T. Improved modeling of the effect of R-ratio on crack growth rate. Int. J. Fatigue 2007, 29, 591–602. [Google Scholar] [CrossRef]
  23. Ohta, A.; Suzuki, N.; Maeda, Y. Unique fatigue threshold and growth properties of welded joints in a tensile residual stress field. Int. J. Fatigue 1997, 19, 303–310. [Google Scholar] [CrossRef]
  24. Wheeler, O.E. Spectrum loading and crack growth. J. Basic Eng. Trans. ASME 1972, 94, 181–186. [Google Scholar] [CrossRef]
  25. Willenborg, J.; Engle, R.M.; Wood, H.A. A Crack Growth Retardation Model Using Effective Stress Concept; Technical Report AFFDL-TM-71-1-FBR; Air Force Flight Dynamics Lab.: Dayton, OH, USA, 1971. [Google Scholar]
  26. Simpson, D.L.; Molent, L. The Canadian and Australian F/A-18 International Follow-On Structural Test Project; Institute for Aerospace Research National Research Council of Canada: Ottawa, ON, Canada, 2002. [Google Scholar]
  27. Roth, M.; Sander, K. F/A-18 IFOSTP Fractographic Analysis Report NSD31201-1-1 FT312 68% Spar Shear-Tie Component Fatigue Test; Quality Engineering Test Establishment: Gatineau, QC, Canada, 2006. [Google Scholar]
  28. Kunz, J.; Siegl, J.; Nedbal, I.; Schijve, J. Fatigue Crack Growth History in Concept of Damage Tolerance of Aircraft Structures. In Proceedings of the International Conference on Damage Tolerance of Aircraft Structures, Delft, The Netherlands, 25–28 September 2007. [Google Scholar]
  29. RMAF. S2-B/AMP-53-9 (Aircraft Maintenance Publication) (53-Fuselage); Markas Pemerintahan Bantuan Udara, Sistem Grup A, Ed.; Sukhoi Design Bureau: Moscow, Russia, 2009. [Google Scholar]
  30. RMAF. S2-B/AMP-57-P SU-30MKM Air Vehicle Maintenance Publication (Wing); Markas Tentera Udara, Bahagian Kejuruteraan, Ed.; Sukhoi Design Bureau: Moscow, Russia, 2009. [Google Scholar]
  31. Faiz, Q.B.M. WBS2440 Aircraft Structural Integrity (ASI) Services Report; CAIDMARK: Damansara, Malaysia, 2018. [Google Scholar]
  32. Kuntjoro, W.; Ashari, M.S.; Ahmad, M.Y.; Mydin, A.M. Development of Fatigue Life Monitoring of RMAF Fighter Airplanes. In ICAF 2009, Bridging the Gap between Theory and Operational Practice; Springer: Dordrecht, The Netherlands, 2009; pp. 1155–1164. [Google Scholar]
  33. Wang, Y.; Lv, Z.; Yang, Z. Reliability Analysis of a Wing-Fuselage Attachment Fitting. Aircraft. Des. 2004, 3, 801–808. [Google Scholar]
  34. Fei, C.W.; Lu, C.; Liem, R.P. Hierarchical model updating strategy of complex assembled structures with uncorrelated dynamic modes. Chin. J. Aeronaut. 2020. [Google Scholar] [CrossRef]
  35. Institute, B.M. Metallic Materials Properties Developement and Standardization; Battelle Memorial Institute: Columbus, OH, USA, 2017; Volume 2, pp. 235–240. [Google Scholar]
  36. Moiseyev, V.N. Titanium Alloys Russian Aircraft and Aerospace Applications; CRC Press: Boca Raton, FL, USA, 2006. [Google Scholar]
  37. Yarema, S.Y.; Grechko, V.V.; Ostash, O.P. Cyclic Crack Resistance to VT20 Titanium Alloy Sheets and Its Anisotropy. Fiz. -Khimicheskaya Mekhanika Mater. 1978, 16, 47–52. [Google Scholar] [CrossRef]
  38. Underhill, R. F/A-18 IFOSTP Fractographic Analysis Report NSD31201-2-1 FT312 68% Spar Shear-Tie Component Fatigue Test; Royal Military College Canada: Kingston, ON, Canada, 2006. [Google Scholar]
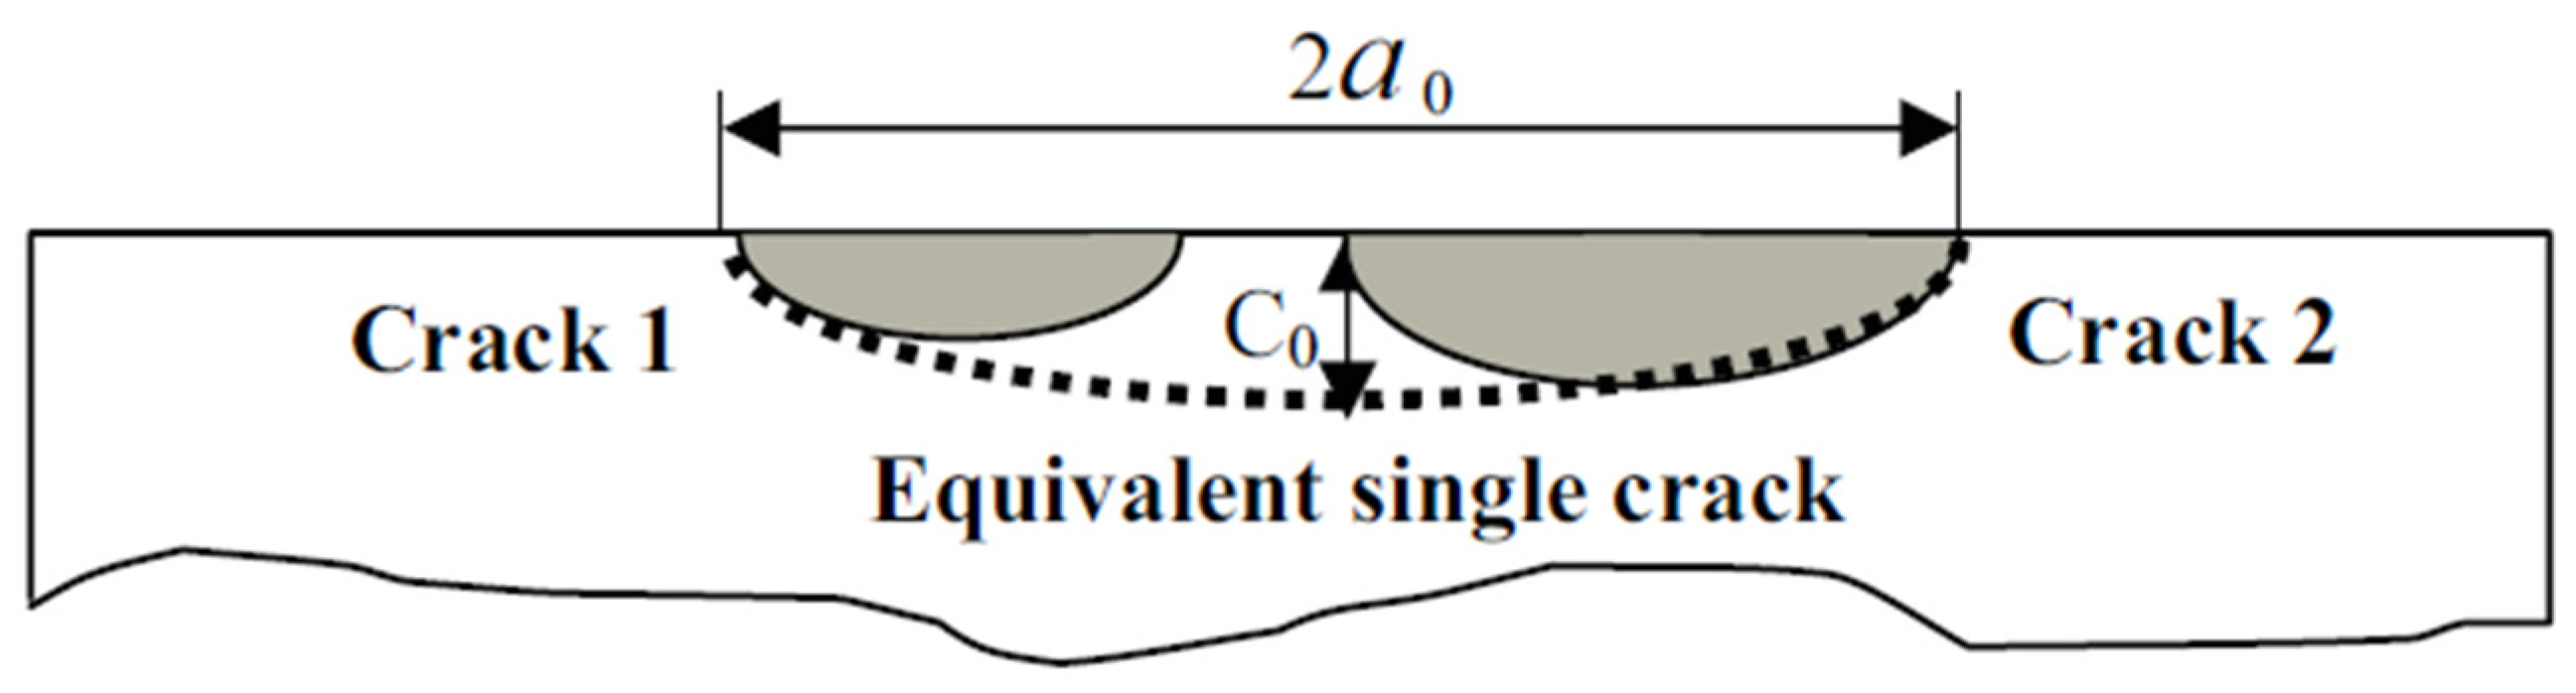
  39. Hu, W.; Liu, Q.; Barter, S.A. A study of interaction and coalescence of micro surface fatigue crack in aluminum 7050. In Proceedings of the 25th Symmposium of the International Committee on Aeronautical Fatigue (ICAF2009), Rotterdam, The Netherlands, 27–29 May 2009. [Google Scholar]
  40. Liao, M.; Renaud, G. Fatigue Analysis for CF-18 Component: Wing Fold Shear-Tie Lug; National Research Council Canada: Ottawa, ON, Canada, 2010.
  41. Taheri, F.; Trask, D.; Pegg, N. Experimental and analytical investigation of fatigue characteristics of 350WT steel under constant and variable amplitude loading. Mar. Struct. 2003, 16, 69–91. [Google Scholar] [CrossRef]
  42. Ray, A.; Patankar, R. Fatigue crack growth under variable-amplitude loading: Part II-Code development and model validation. Appl. Math. Model. 2001, 25, 995–1013. [Google Scholar] [CrossRef]
  43. Porter, T.R. Method of analysis and prediction for variable amplitude fatigue crack growth. Eng. Fract. Mech. 1972, 4, 717–736. [Google Scholar] [CrossRef]
Figure 1. ASIP methodology.
Metals 11 01453 g001
Figure 2. Fatigue test setup rig [26].
Metals 11 01453 g002
Figure 3. General wing root area.
Metals 11 01453 g003
Figure 4. Crack initiation location.
Metals 11 01453 g004
Figure 5. Wing root CAD model.
Metals 11 01453 g005
Figure 6. Redrawn wing root for crack growth analysis.
Metals 11 01453 g006
Figure 7. Simplified crack model to simulate multiple cracks site [40].
Metals 11 01453 g007
Figure 8. Through hole crack initiated on the wing root model.
Metals 11 01453 g008
Figure 9. Through side (edge) crack initiated on the wing root model.
Metals 11 01453 g009
Figure 10. N.X. mesh of the wing root structure portion and strain gauge position.
Metals 11 01453 g010
Figure 11. Mapped loading on the wing root model.
Metals 11 01453 g011
Figure 12. Zencrack wing root model.
Metals 11 01453 g012
Figure 13. Straight crack positions.
Metals 11 01453 g013
Figure 14. Cycle vs. the sum of da for through hole crack.
Metals 11 01453 g014
Figure 15. Cycle vs. KI for through hole crack.
Metals 11 01453 g015
Figure 16. Through hole crack growth behavior.
Metals 11 01453 g016
Figure 17. Cycle vs. the sum of da for through side crack.
Metals 11 01453 g017
Figure 18. Cycle vs. stress intensity factor for through side crack.
Metals 11 01453 g018
Figure 19. Through side hole crack growth behavior.
Metals 11 01453 g019
Figure 20. Boundary Conditions of wing root joint FEA.
Metals 11 01453 g020
Figure 21. FEA of wing root joint.
Metals 11 01453 g021
Figure 22. Comparison of AL7075-T6 test data [43]. (a) loading blocks; (b) comparison of predicted model with experimental data.
Metals 11 01453 g022
Table 1. Aircraft weight distribution.
DescriptionWeight (kg)Percentage
Landing Gear1201.70214.12%
Flight Navigation Equipment123414.50%
Electronics1594.2318.73%
Aero-Engine157018.45%
Total Mass of Components8510.1713100.00%
Table 2. Basic material Properties.
No.PropertyValue
1Young’s Modulus121.59 GPa
2Poisson Ratio0.34
3Yield Strength805.58 MPa
4Ultimate Tensile Strength1103.21 MPa
Table 3. Crack material properties [35].
No.PropertyValue
1C7.87 × 10−12 MPa m0.5
2N3.04
Table 4. Loading vale extracted from Global FEA.
No.PropertyValue
1X9887 N
2Y−5112.9 N
3Z8735.2 N
Table 5. Summary of result.
No.Crack TypePropertiesValue
1Through Hole CrackCrack part lifespan413,397 cycles
35 years 6 Month
Critical crack length 16.794 mm
Maximum cycle reached 413,397 cycles
35 years 6 Month
Maximum stress intensity factor 386.731 MPa mm0.5
Maximum sum of da16.794 mm
2Through Side CrackCrack part lifespan 1,547,090 cycles
132 years 11 month
Critical crack length 7.53 mm
Maximum cycle reached 2,032,310 cycles
174 years 8 month
Maximum stress intensity factor 296.704 MPa mm0.5
Maximum sum of da14.49 mm
Table 6. Geometry and material variation in specimens.
Specimen Materialσy (MPa)Cmnt (mm)w (mm)
7075-T6 (aluminium alloy)5206.85 × 10−83.210.34.1305
2024-T3 aluminium alloy3153.0 × 10−83.1/3.20.324.1229
350WT steel3501.5 × 10−82.80.55100
Publisher’s Note: MDPI stays neutral with regard to jurisdictional claims in published maps and institutional affiliations.

