Article

Effect of Ca Element on Microstructure and Corrosion Behavior of Single-Phase Mg–Sc Alloy

1
School of Chemistry and Chemical Engineering, Chongqing Key Laboratory of Soft-Matter Material Chemistry and Function Manufacturing, “The Belt and Road (B&R)” International Joint Research Laboratory of Sustainable Materials, Southwest University, Chongqing 400715, China
2
The Key Laboratory of Chongqing Inorganic Special Functional Materials, Yangtze Normal University, Chongqing 408100, China
3
School of Chemistry and Chemical Engineering, Engineering Research Center of Materials-Oriented Chemical Engineering of Xinjiang Bintuan, Shihezi University, Shihezi 832003, China
4
State Key Laboratory of Solidification Processing, School of Materials Science & Engineering, Northwestern Polytechnical University, Xi’an 710072, China
5
State Key Laboratory of Mechanical Transmission, College of Materials Science and Engineering, Chongqing University, Chongqing 400044, China
*
Authors to whom correspondence should be addressed.
Metals 2022, 12(1), 93; https://doi.org/10.3390/met12010093
Submission received: 20 November 2021 / Revised: 30 December 2021 / Accepted: 30 December 2021 / Published: 4 January 2022

Abstract

:
The effect of Ca on the microstructure and corrosion behavior of a single-phase Mg–Sc alloy was investigated. The microstructure was characterized by optical microscopy and scanning electron microscopy. Corrosion behavior was measured by hydrogen evolution tests and electrochemical measurements. With the addition of microalloyed Ca, the grain size of Mg-0.3Sc alloy is refined and the Mg2Ca phase particle is precipitated. The corrosion test results reveal that the addition of microalloyed Ca is beneficial to the corrosion resistance of Mg-0.3Sc single-phase alloy, which is related to the grain refinement and the protective performance of the corrosion product film. As the content of Ca increases, the corrosion resistance of the alloy first increases and then decreases, which is mainly related to the microstructure of the alloy.

1. Introduction

The presence of the second phase has a great influence on the corrosion behavior of magnesium (Mg) alloys [1,2,3,4]. The potential difference between the second phase and the matrix phase can easily lead to the generation of galvanic corrosion, which accelerates the corrosion of the Mg alloys [5,6,7]. Song et al. [8] considered that Mg is more negative than many typical second-phase particles, which makes the Mg matrix as the anode preferentially corrode. Li et al. [9] found that the corrosion rate of an Mg–Li alloy containing a α + β dual-phase structure was significantly higher than that of a Mg–Li alloy containing a single-phase α-Mg and single-phase β-Li structure. Therefore, compared with multi-phase Mg alloys, single-phase Mg alloys can greatly avoid galvanic corrosion caused by the second phase, which is beneficial for the improvement of its corrosion resistance. Scandium (Sc) has a large solid solubility in Mg. Moreover, Sc possesses a relatively high hydrogen evolution overpotential, and its lattice parameter is very close to that of Mg, which may result in the high corrosion resistance of Mg–Sc alloys [10,11].
In previous research [12], we prepared the Mg–Sc binary alloy and studied its corrosion behavior. The addition of Sc can refine the grain structure of an Mg alloy and, thus, improve its corrosion resistance. The corrosion resistance of the alloy increases with the increase in Sc content when the Sc content is low. However, when the Sc content is too high, the second phase will gradually appear in the alloy, and galvanic corrosion will occur, which has an adverse effect on the corrosion resistance of the alloy. Therefore, the Mg–Sc single-phase alloy has superior corrosion resistance. However, the Mg–Sc binary single-phase alloy has a relatively large grain size compared with the commercially used Mg alloys. The addition of microalloyed alloying elements to the Mg–Sc single-phase alloy is expected to refine its grain structure and might further increase the density of the corrosion product film without introducing or introducing a very small amount of the second phase, thereby improving the corrosion resistance of the alloy performance. However, related research is still relatively limited. Ca is a common alloying element in Mg alloys, which can effectively improve the corrosion resistance of Mg alloys [13]. The main reasons are as follows: on the one hand, Ca can be used as a grain nucleating agent in the smelting and preparation process of Mg alloys [14]; on the other hand, the addition of Ca can control the morphology and structure of the second phase of the alloy to hinder the diffusion of corrosion in the alloy. Wu et al. [15] studied the effect of the addition of Ca on the corrosion performance of an AZ91D alloy and found that the network of an Al2Ca phase was formed with the addition of 1 wt.% Ca, which acts as a physical barrier to hinder the progress of corrosion, thus reducing the corrosion rate of the alloy. In addition, the addition of Ca is conducive to improving the compactness of the product film, thereby improving its protective effect on the alloy matrix. Yang et al. [16] investigated the effect of the addition of different Ca amounts on the microstructure and corrosion performance of Mg–Al–Mn alloys and found that the presence of CaCO3 in the corrosion product film is beneficial to the improvement of the corrosion performance of the alloy.
Thus, Mg–Sc–Ca alloys containing different Ca content were prepared in this study, and the influence mechanism of the addition of microalloyed Ca on the microstructure and corrosion behavior of Mg–Sc single-phase alloys was studied.

2. Materials and Methods

The as-cast Mg-0.3Sc-xCa (x = 0, 0.1, 0.2 and 0.4 wt.%) ternary alloys were prepared from pure Mg (>99.999 wt.%), Mg-10Sc and Mg-25Ca master alloys in a resistance furnace system under the protection of CO2 + SF6 mixed gas. The as-cast alloys were subjected to solution treatment at 400 °C for 24 h, and then extruded at 280 °C to form a plate with a thickness of 5 mm and a width of 60 mm. The extrusion ratio is 18.9, and the extrusion speed is 1 m min−1. Subsequently, the extruded alloy was heated at 400 °C for 20 min and then rolled in four passes to obtain a rolled alloy sheet with a final thickness of 2 mm. The rolling reduction per pass was about 20%. In the middle of two adjacent passes, the alloy is annealed at 400 °C for 10 min. Finally, the plate was annealed at 400 °C for 1 h. The actual chemical composition of the alloy was determined by a plasma-atomic emission spectrometer (ICP-AES), and the results are shown in Table 1. The Mg-0.3Sc-xCa ternary alloy (x = 0, 0.1, 0.2 and 0.4 wt.%) was named MS, MS1Ca, MS2Ca and MS4Ca, respectively.
The rolled alloys were polished with 2000 grid SiC papers to a state where there were no obvious scratches on the surface and then polished with a diamond polishing agent with a particle size of 0.25 μm. Subsequently, the metallographic structure of the alloys was observed by an optical microscope. The microstructure and corrosion product morphologies of the alloys were observed by a scanning electron microscope (Tescan vega 3 LMH, Czech).
The rolled alloy was cut into disc-shaped specimens with a diameter of 20 mm and then polished with 2000 grid SiC papers to a smooth surface without obvious scratches. The sample was wrapped with phenolic resin, leaving only a circular test surface with a diameter of 20 mm, which was used for the hydrogen evolution experiment. The hydrogen evolution experiment device consists of a beaker, an inverted funnel and an inverted basic burette, and the volume of the solution used in the test is 250 mL. The electrochemical experiment was carried out in a standard three-electrode system. The working electrode (WE) used was a Mg alloy sample, the reference electrode (RE) was a saturated calomel electrode, and the auxiliary electrode (CE) was a platinum electrode sheet (1 mm × 15 × 15). The test area of the test specimen is 1 cm2. After immersing the sample in NaCl solution for 0.5 h, the polarization curve and impedance spectroscopy were tested using a PARSTAT 4000 electrochemical system. The scanning speed of the potentiodynamic polarization curve is 1 mV/s, and the scanning interval is −2.0~−1.3 V (vs. SCE); the frequency range of the electrochemical impedance spectroscopy (EIS) test is 100 kHz~0.01 Hz, the amplitude is 5 mV, and the number of points per decade is 10. Although 1 mV/s was adopted for the experimentations, it is remarkable that this selection has not provided substantial distortions in the polarization curves obtained. In this sense, it is worth noting that the potential scan rate has an important role in order to minimize the effects of distortion in Tafel slopes and corrosion current density analyses, as previously reported [17,18,19,20]
The 3.5 wt.% NaCl solution was saturated with Mg(OH)2 to ensure that the solution had the same pH value during the experiment, thereby avoiding the influence of the change of the solution’s pH value on the corrosion rate of the alloy during the test [21]. The reagents used in this study are all analytical grades, and the water used is deionized water. Both the hydrogen evolution and the electrochemical tests were carried out at 25 ± 2 °C.

3. Results and Discussion

3.1. Microstructure Analysis

Figure 1 shows the metallographic structure of the four alloys. The grain size of the alloy gradually decreased with the increase in the Ca content. The grain size of MS alloy was about 22.3 μm, and that of MS1Ca, MS2Ca and MS4Ca alloys was refined to 20.6 ± 1.5, 19.4 ± 1.6 and 18.3 ± 2.3 μm, respectively. Figure 2 shows the microstructure of the four alloys. The Mg-0.3Sc alloy shows a single-phase structure. However, with the addition of 0.1 wt.% Ca, a small amount of Mg2Ca phase particles appeared, and the number of Mg2Ca phase particles in the alloy continued to increase with Ca content.

3.2. Hydrogen Evolution Test

Figure 3 shows the hydrogen evolution volume–time curves of the four alloys in the NaCl solution. The hydrogen evolution volume of the three Ca-containing alloys is lower than that of MS alloy. That is, the addition of Ca decreased the hydrogen evolution rate of MS alloy. With the increase in Ca content, the hydrogen evolution volume of MS alloy firstly decreased and then increased, and the hydrogen evolution volume of MS2Ca alloy was the lowest. The corrosion rate PH (mm y−1) can be calculated from the hydrogen evolution volume VH (mL cm−2) and the immersion time t (day) by the following formula [22]:
P H = 2.088 V H / t
It can be calculated that the PH values of MS, MS1Ca, MS2Ca and MS4Ca alloys are 1.83, 1.46, 1.01 and 1.17 mm y−1, respectively. Therefore, the MS2Ca alloy has the lowest corrosion rate among the four alloys.

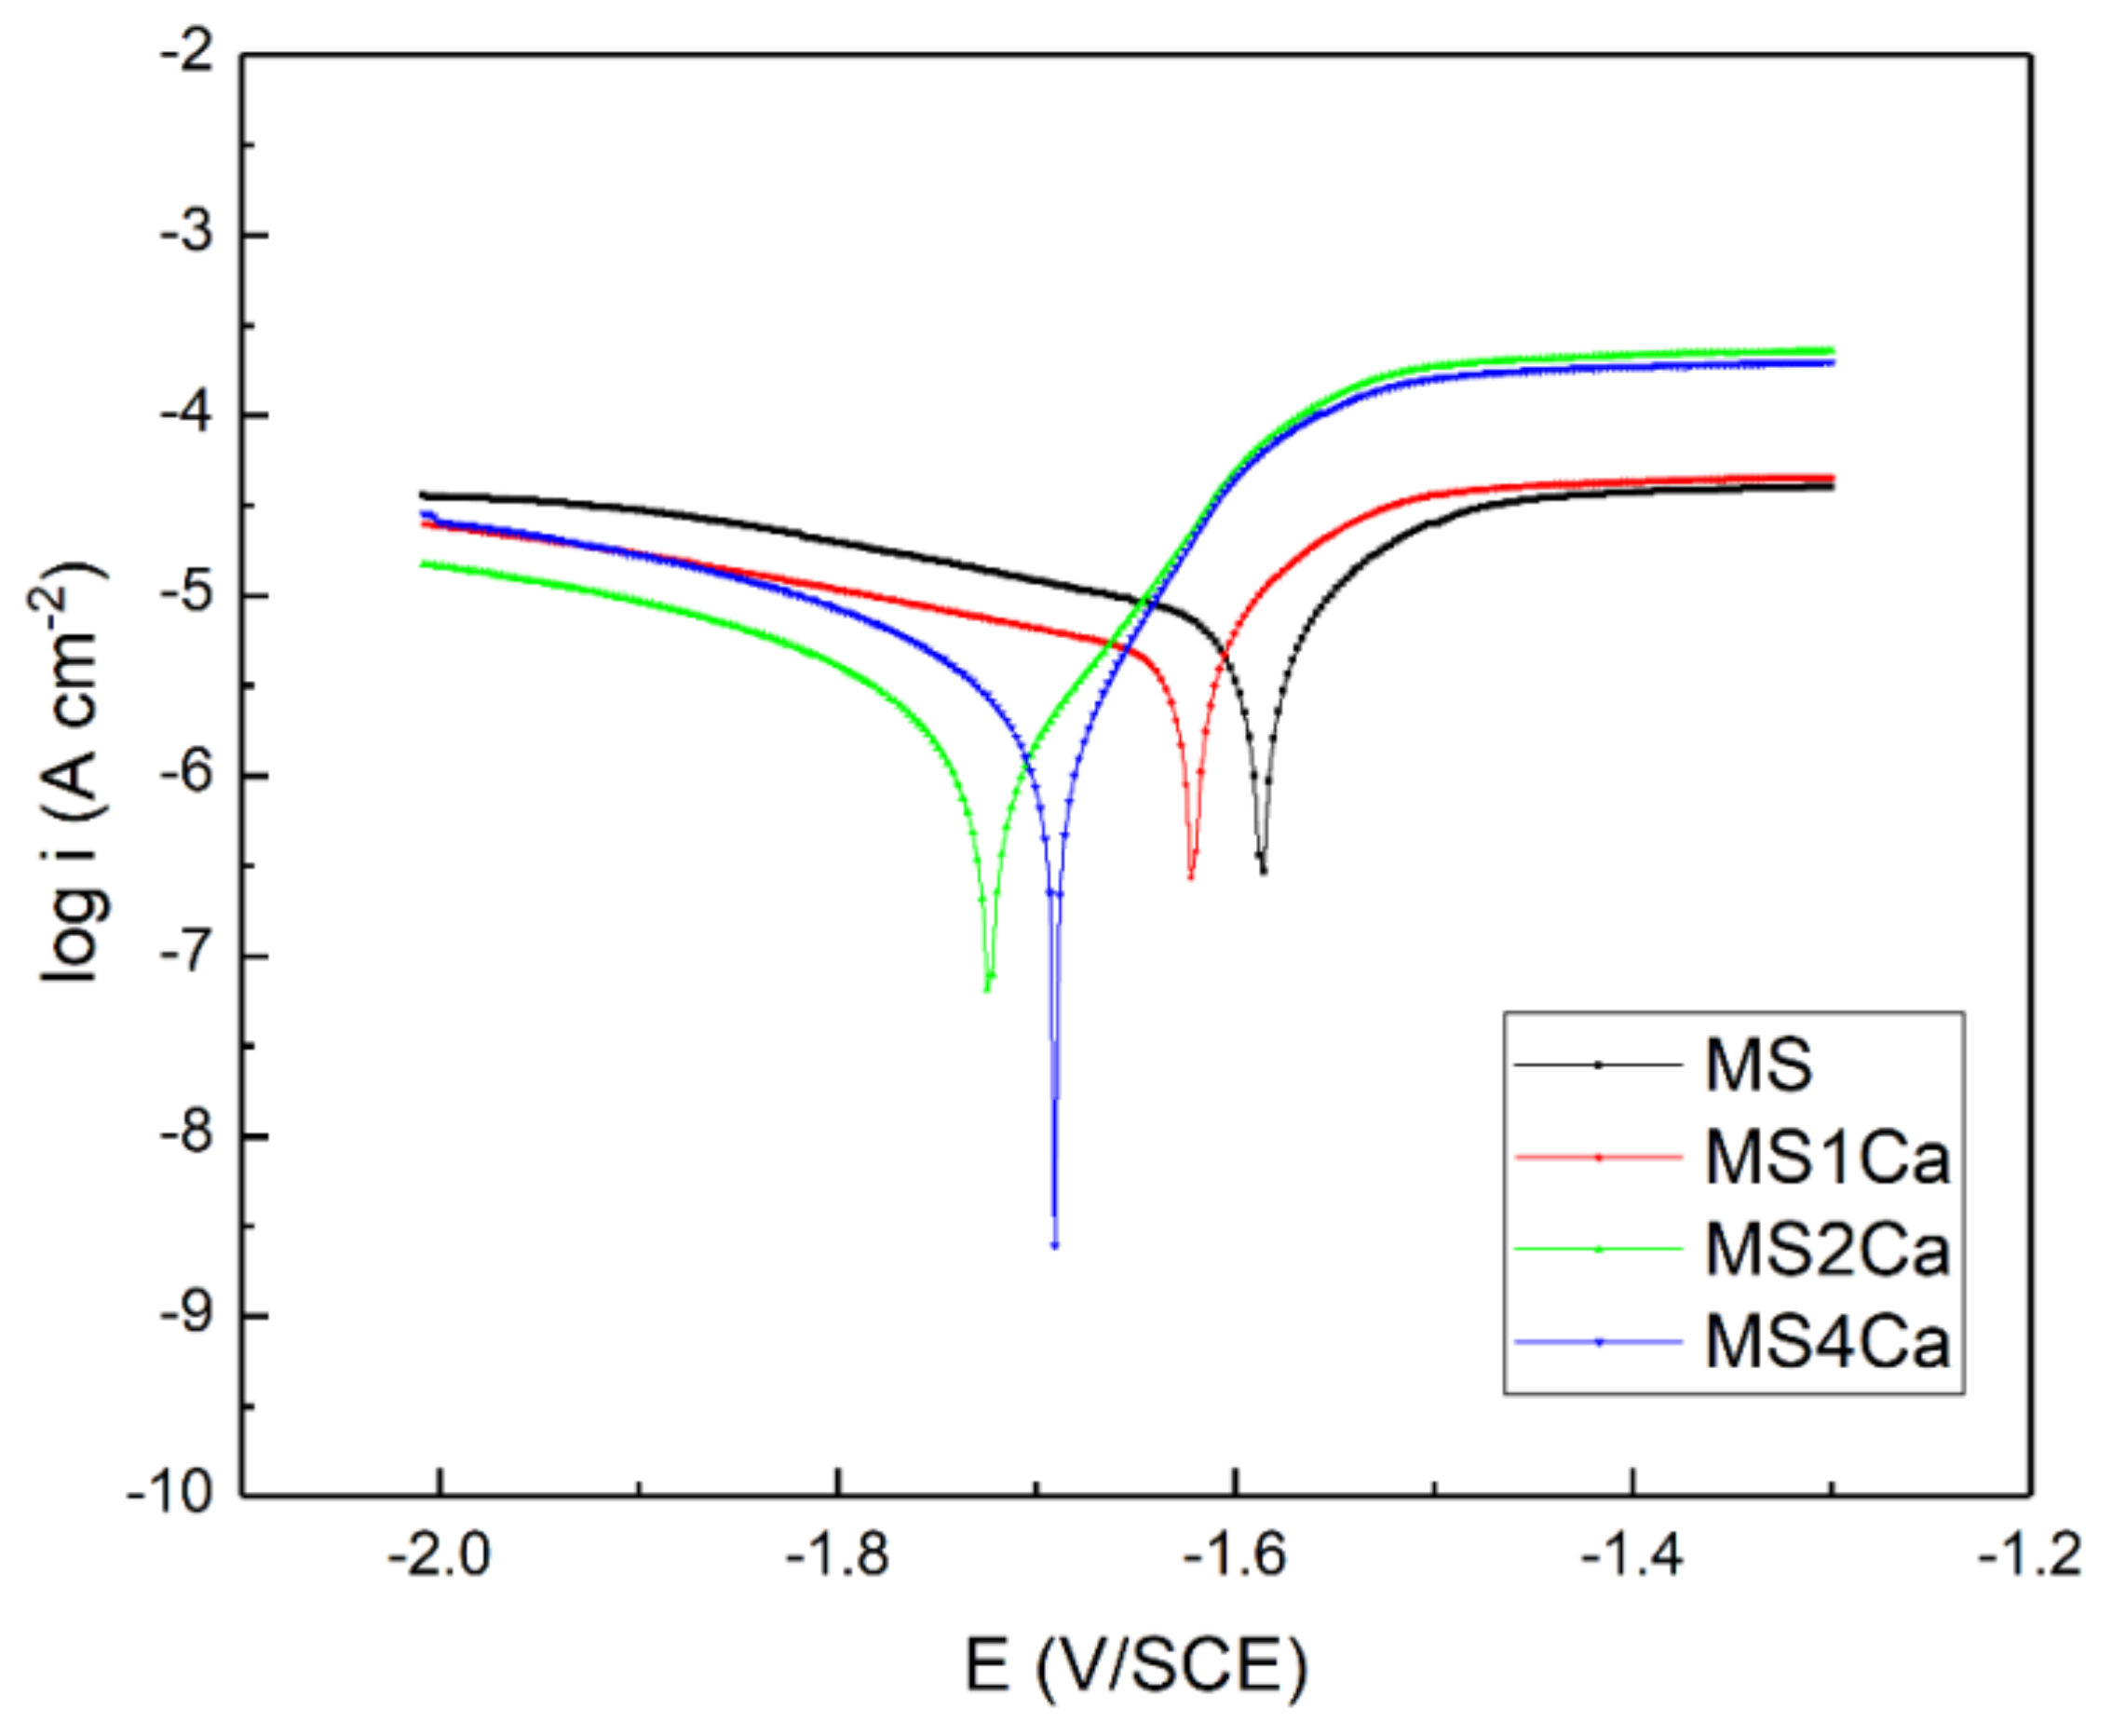
3.3. Potentiodynamic Polarization Curves

Figure 4 shows the potentiodynamic polarization curves of four alloys in the NaCl solution. The results of the icorr and Ecorr values obtained by fitting the polarization curves of the four alloys are shown in Table 2. The icorr values of MS, MS1Ca, MS2Ca and MS4Ca alloys are 3.55 × 10⁻⁶, 2.51 × 10⁻⁶, 1.05 × 10⁻⁶ and 1.58 × 10⁻⁶ A cm−2, respectively. The lower the icorr value, the lower the corrosion rate of the alloy [23,24]. The icorr value of the alloy containing Ca was lower than that of the MS alloy, which shows that the addition of Ca decreased the corrosion rate of the MS alloy. The icorr value of the alloy decreased first and then increased with the increase in Ca content. That is, MS2Ca alloy had the lowest corrosion rate.

3.4. EIS Curves

Figure 5 shows the EIS curves and the corresponding equivalent circuit diagrams of four alloys in the NaCl solution. Rs, Rf, and Rt correspond to solution resistance, corrosion product resistance, and charge transfer resistance, respectively. RL and L represent inductive resistance and inductance, respectively. Q represents a constant phase angle element [25,26,27]. The Nyquist plots of the four alloys all exhibited two capacitive reactance arcs, while the capacitive reactance arc in the high-frequency region and the low-frequency region is related to the charge transfer process and the surface corrosion product film, respectively [28]. The Nyquist diagram showed that the capacitive arc diameter of Ca-containing alloys was larger than that of the MS alloy, and the capacitive arc diameter of the alloys first increased and then decreased with the increase in Ca content. Among them, the capacitive reactance arc diameter of the MS2Ca alloy was the largest. The Bode plots of |Z|-frequency showed that the four alloys exhibited a trend that the impedance first increased and then gradually stabilized within the test frequency range. The impedance of the Ca-containing alloys was greater than that of MS alloys, and the impedance of the alloys first increased and then decreased with the increase in Ca content. Among them, the impedance of MS2Ca alloy was the largest. The Bode plots of phase angle–frequency showed that there were two peaks in the four alloys, that is, two time constants; one is the high-frequency time constant and the other is the low-frequency time constant. The high-frequency time constant is determined by the double-layer capacitor and the corresponding charge transfer resistance. The low-frequency time constant is related to the resistance of the corrosion product film [29]. Table 3 shows the fitting results of the four alloys. The (Rt + Rf) value reflects the corrosion resistance of the alloy [26]. The larger (Rt + Rf) value reflects the stronger corrosion resistance of the alloy. The (Rt + Rf) values of MS, MS1Ca, MS2Ca and MS4Ca alloys are 1434.2, 1791.3, 2756.2 and 2083.9 Ω cm2, respectively. This showed that the addition of Ca is beneficial for improving the corrosion resistance of MS alloy, and the corrosion resistance of MS2Ca is the best. The experimental results of EIS are consistent with the results of the above-mentioned hydrogen evolution and polarization curve experiments.

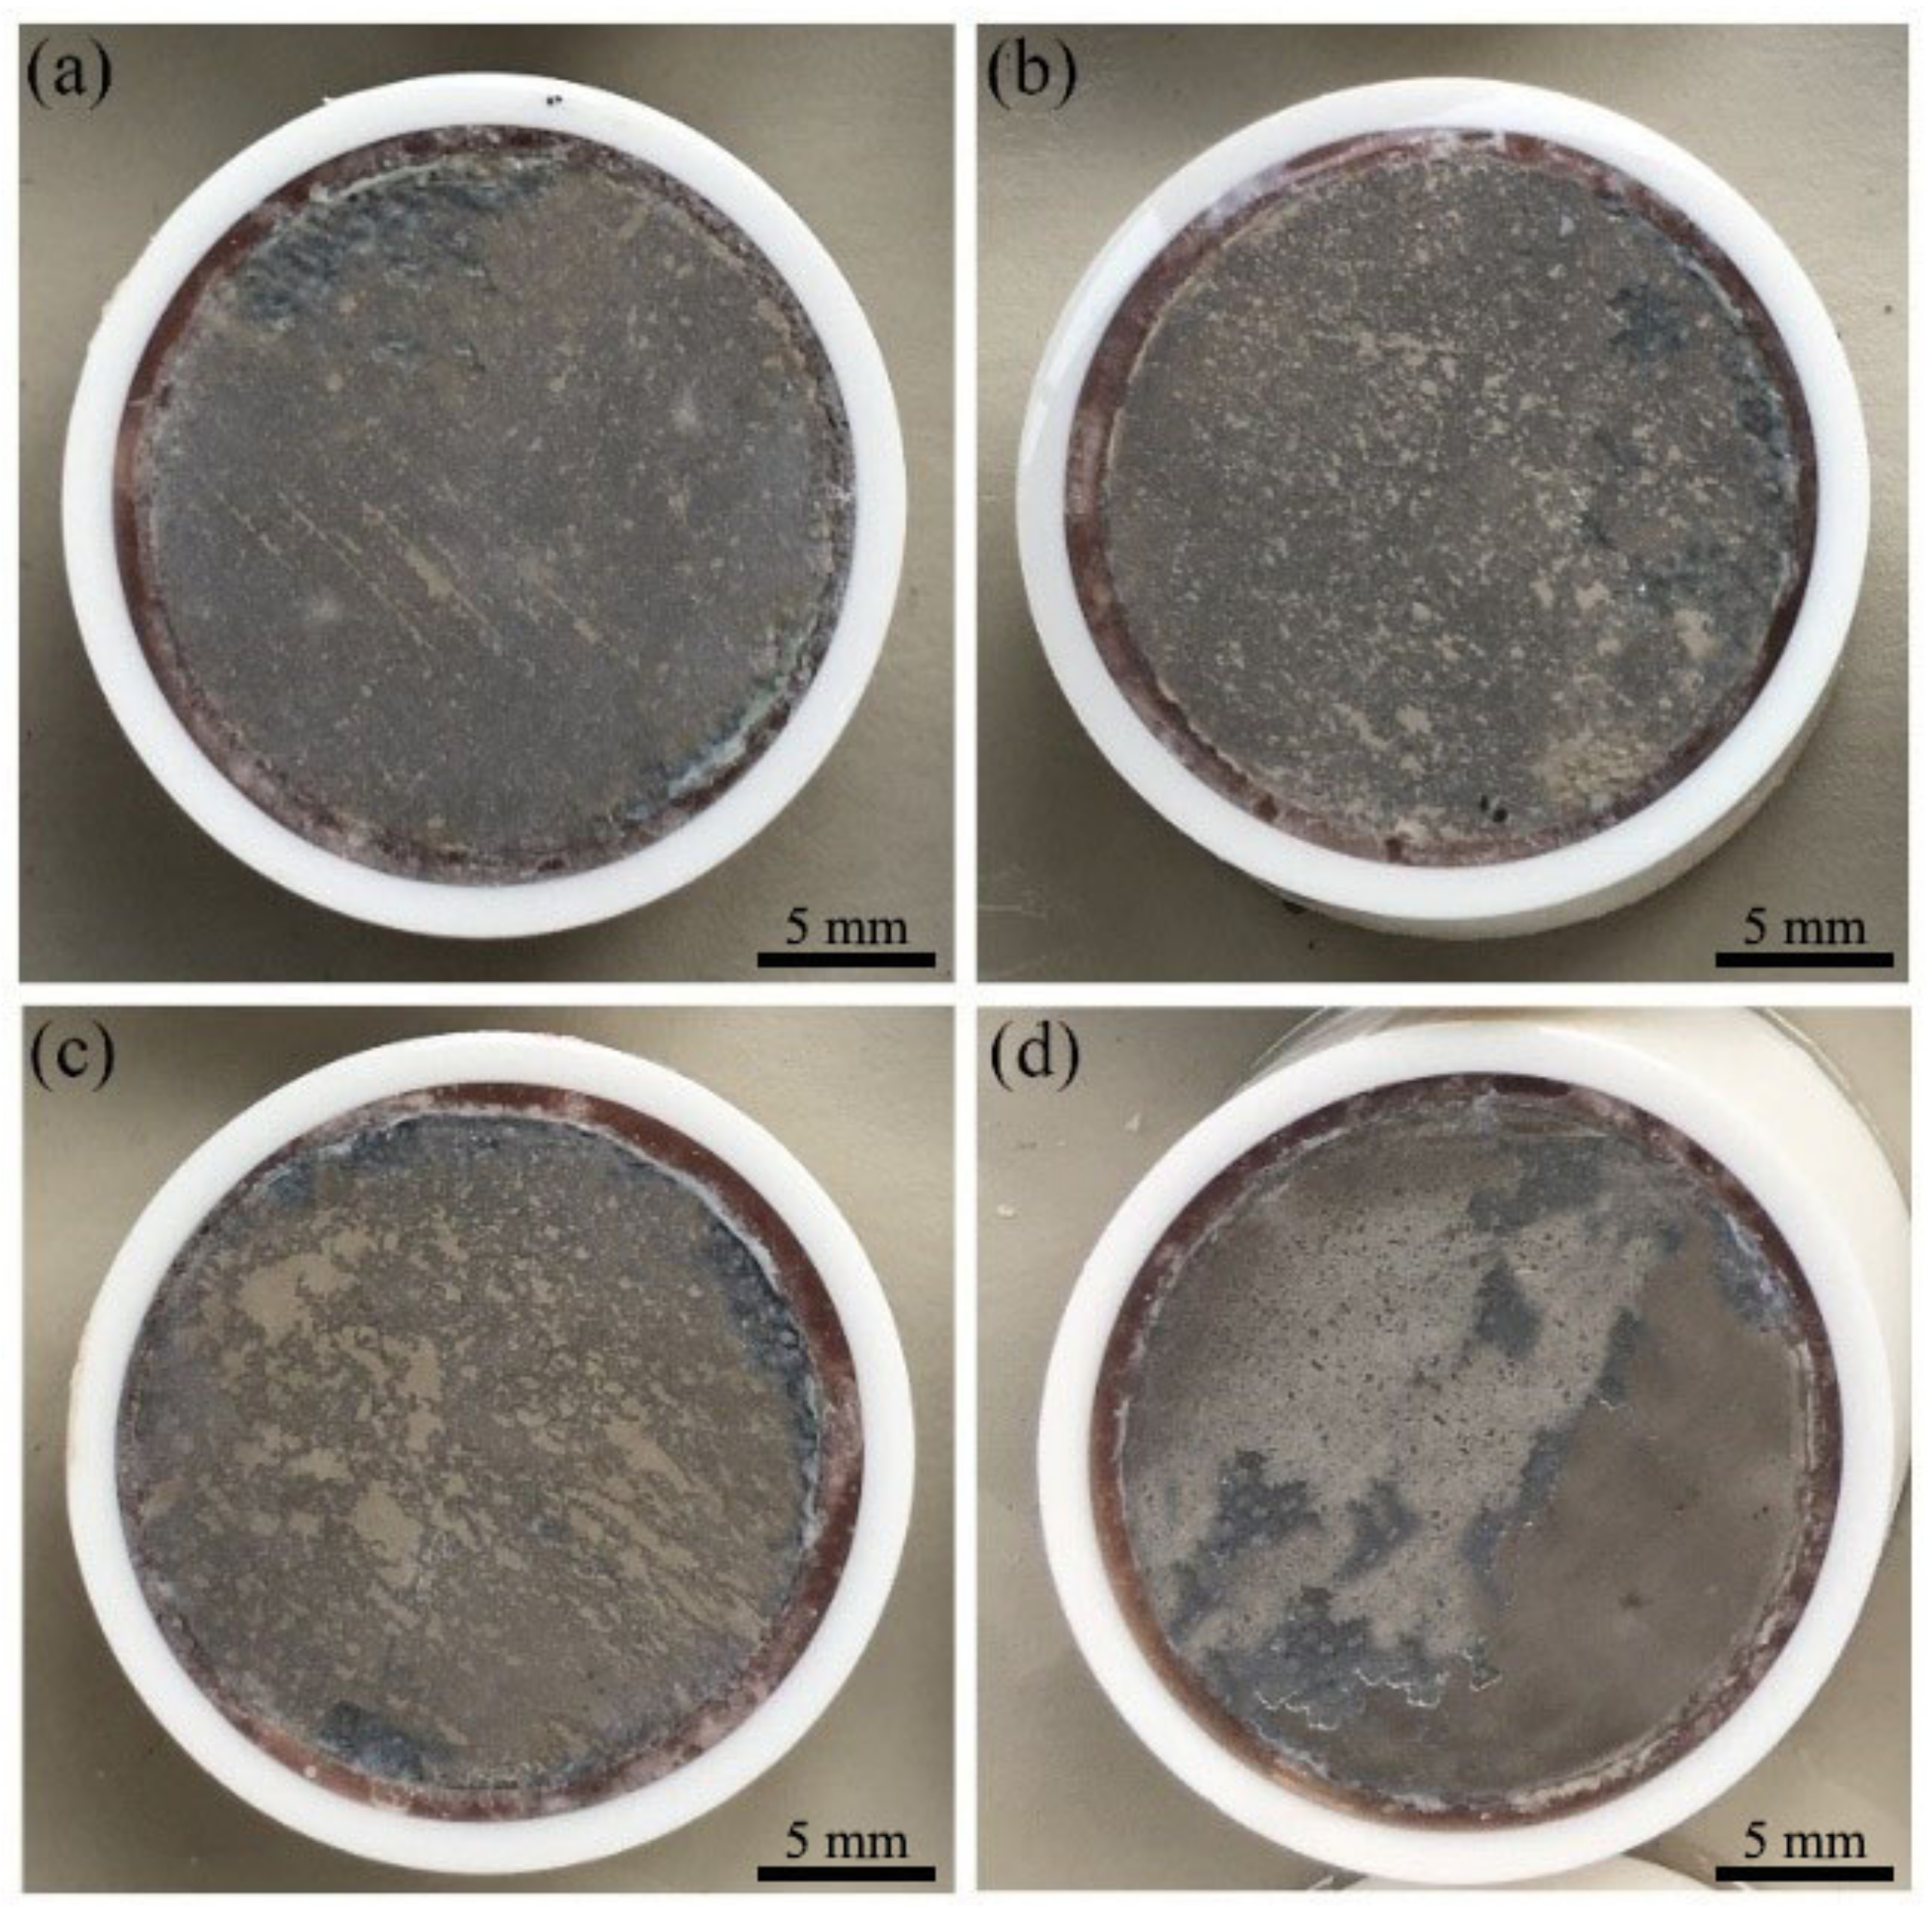
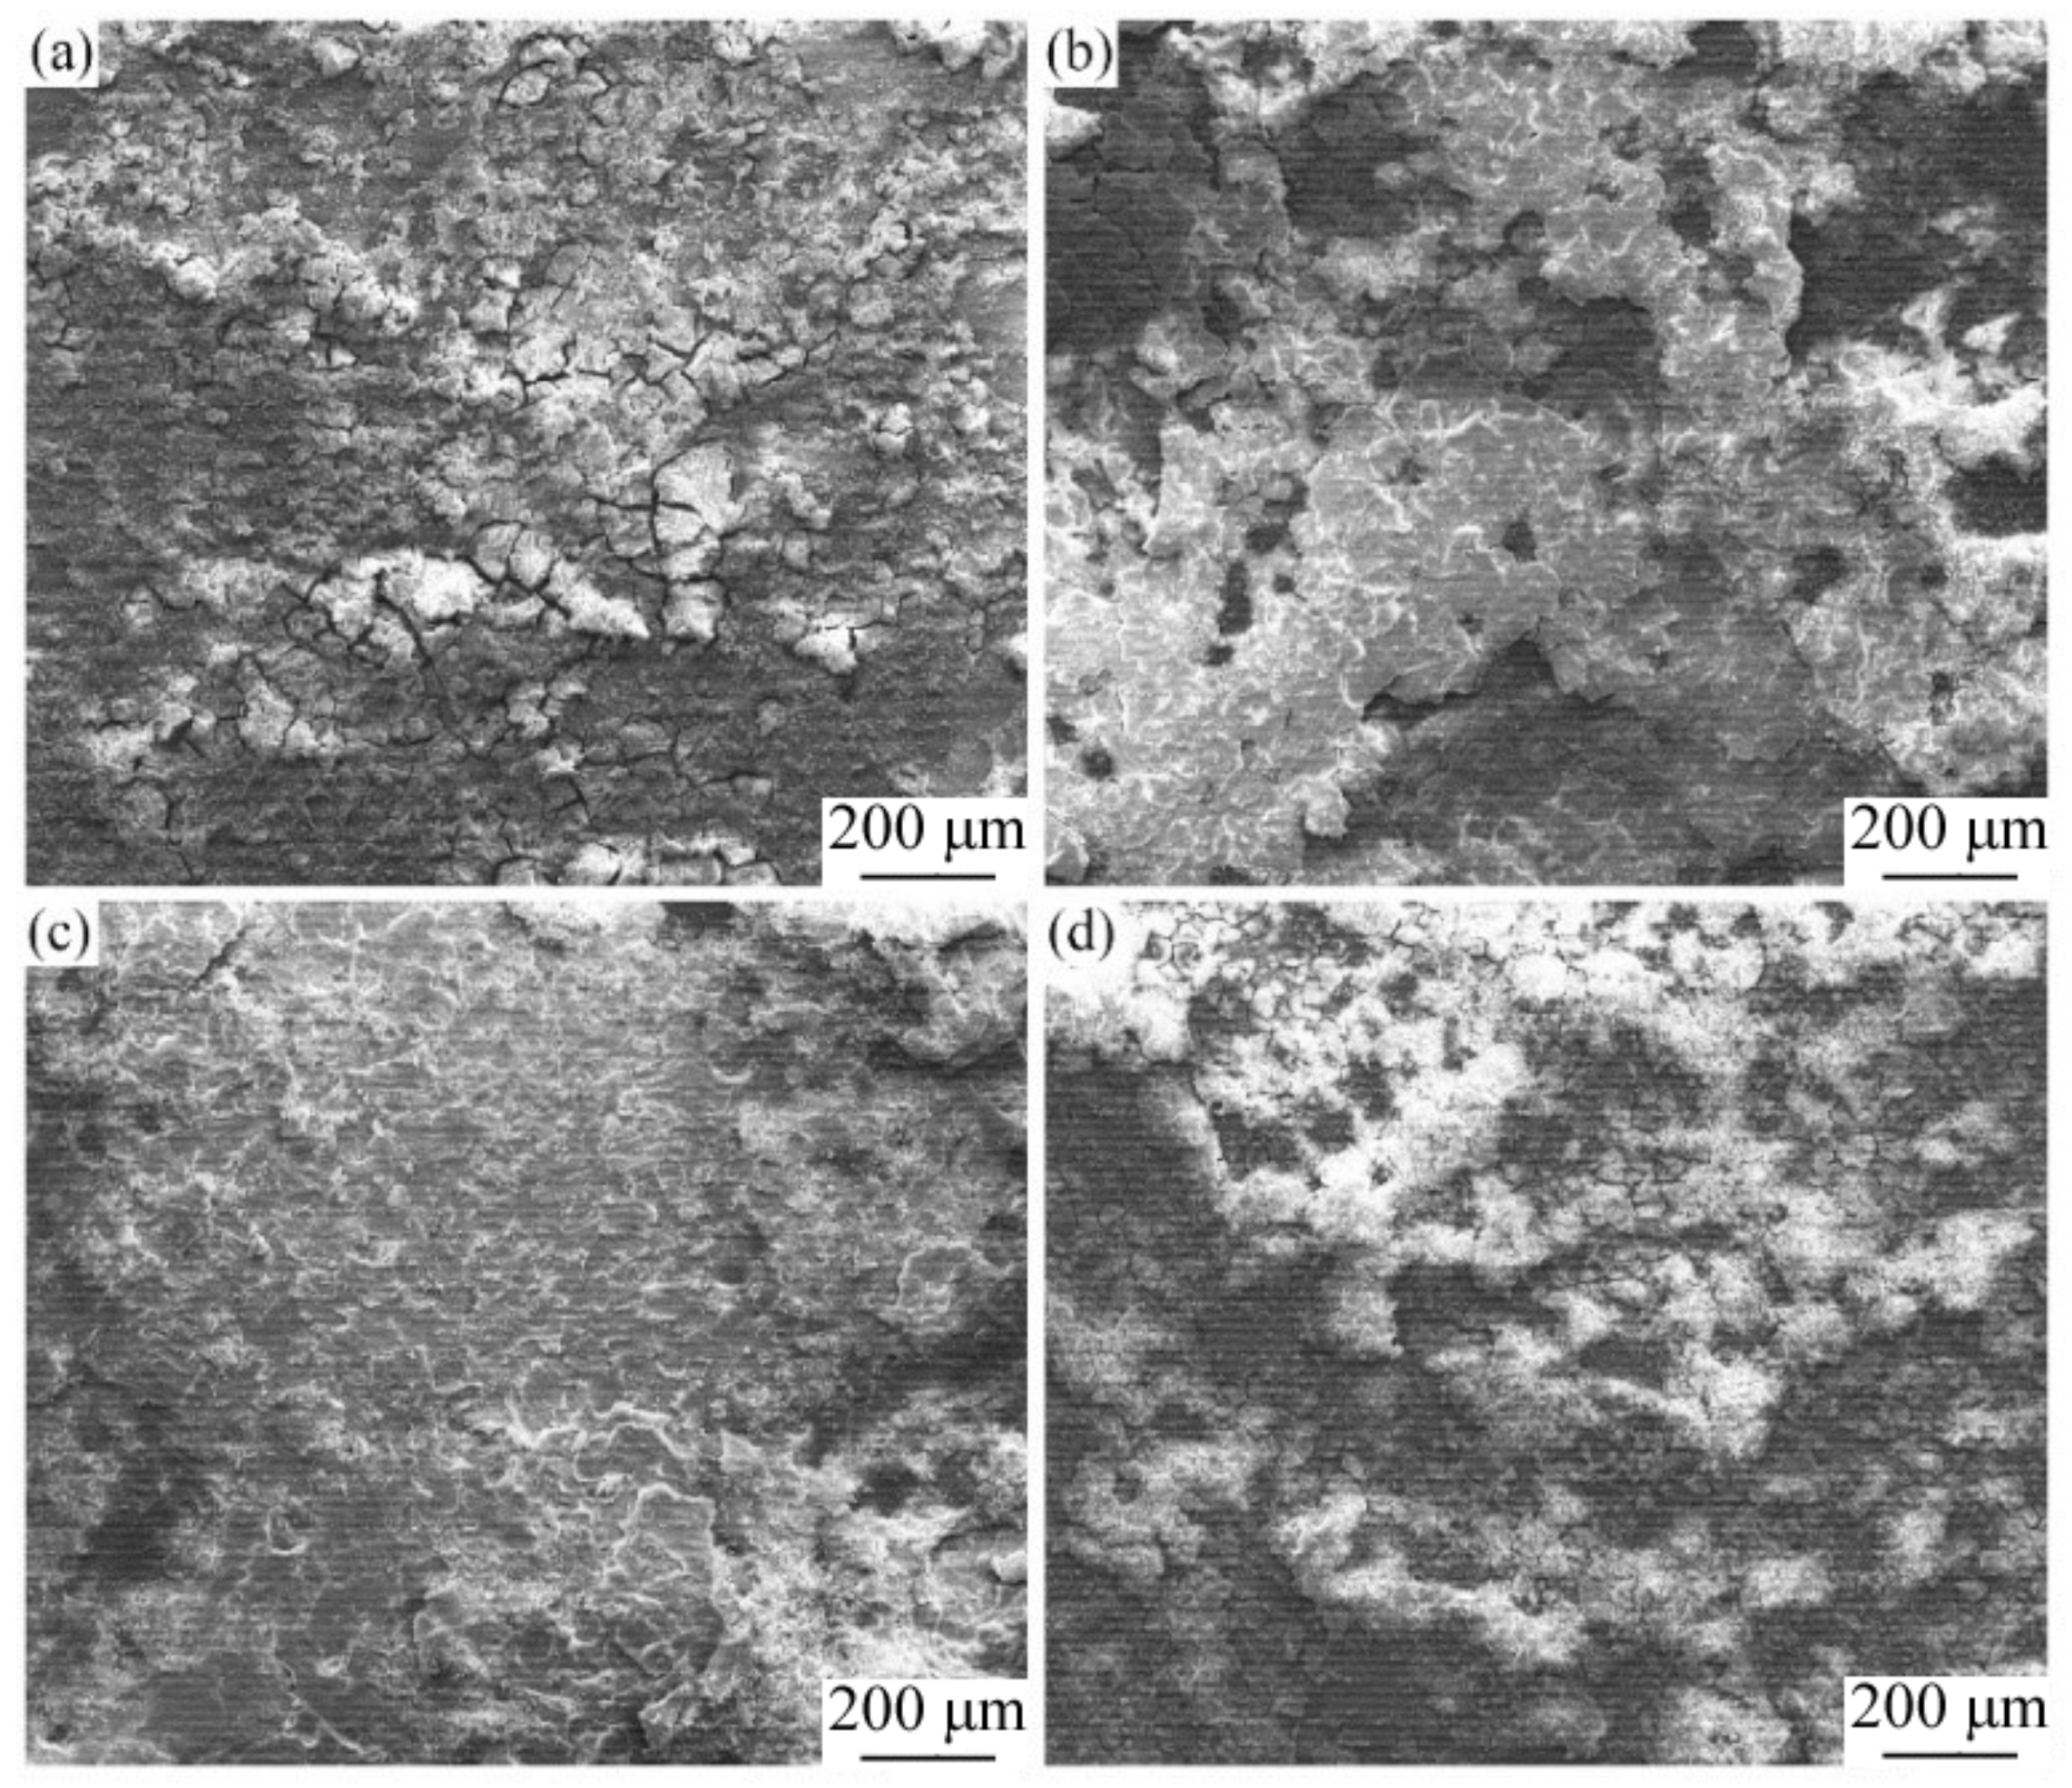
3.5. Surface Morphologies after Corrosion

Figure 6 shows the macroscopic corrosion morphologies of the four alloys after immersion in the NaCl solution for 60 h, which indicates that the local corrosion of the MS4Ca alloy is relatively more serious compared with the other three alloys. In order to better observe the corrosion morphologies of the four alloys, the microscopic corrosion morphologies of the four alloys after immersion in the NaCl solution for 60 h was observed by SEM (as shown in Figure 7). There were many cracks in the corrosion products’ film on the surface of the MS alloy. However, the corrosion products’ film became obviously dense and the cracks were obviously reduced after the addition of Ca. Among them, MS2Ca alloy has the densest corrosion products’ film.

3.6. Corrosion Mechanism

The above results indicate that the addition of Ca is beneficial for the improvement of the corrosion resistance of an MS alloy. On the one hand, the addition of Ca refines the grain size of an MS alloy. This is because Ca can act as a nucleating agent and can hinder the movement of grain boundaries at the same time [30], and the small grain size is beneficial to improve the corrosion resistance of the Mg alloy [31]. Moreover, the addition of Ca can make the corrosion products’ film compact and improve its protective effect on the alloy matrix [16]. However, the corrosion resistance of the alloy first increases and then decreases with the increase in Ca content. This is related to the influence of Ca on the structure of the MS alloy. No precipitation of the second phase was detected in the MS alloy, which shows a single-phase structure. When adding 0.1 wt.% Ca element, a small amount of Mg2Ca precipitated phase appeared, and the amount of Mg2Ca precipitated phase in the alloy gradually increased with Ca content. The potential of the Mg2Ca phase is more negative than that of the Mg matrix [32,33]. It forms galvanic corrosion with the Mg matrix. The anode acting as the galvanic corrosion is preferentially corroded, which can slow down the corrosion of the Mg matrix to a certain extent and improve the corrosion resistance of the alloy. Corrosion performance might have a beneficial effect. However, although the Mg matrix acts as a cathode for galvanic corrosion to be protected, when galvanic corrosion occurs, the balanced system of the alloy surface will be destroyed, which can easily cause further damage to the Mg matrix by Cl. Thus, the corrosion rate of the alloy becomes larger when the content of Ca is increased to 0.4 wt.%.
In general, the addition of Ca improves the corrosion resistance of MS alloys, and the corrosion resistance of the alloy first increases and then decreases with the increase in Ca content. This is because the addition of Ca is conducive to the refinement of the structure and the formation of a dense corrosion products’ film. As the content of Ca increases, the number of second phases in the alloy increases, which accelerates galvanic corrosion, destroys the balanced system of the alloy surface, and thus reduces the corrosion resistance of the alloy.

4. Conclusions

In this study, the influence law and mechanism of the microalloyed Ca on the microstructure and corrosion resistance of a Mg–Sc single-phase alloy were investigated. The results indicate that the addition of Ca with appropriate content can refine the grain structure of the Mg–Sc single-phase alloy and at the same time can improve the compactness of the product film, thereby improving its corrosion resistance. Moreover, the addition of excessive Ca will introduce a large amount of Mg2Ca phase in the alloy, which can easily be corroded. Therefore, the corrosion resistance of the alloy first increases and then decreases with the increase in Ca content. The MS2Ca alloy has the best corrosion resistance.

Author Contributions

Conceptualization, C.Z. and L.W.; methodology, C.Z. and Y.Z.; validation, G.W.; formal analysis, T.H.; investigation, Y.Z. and G.W.; data curation, C.P. and J.H.; writing—original draft preparation, C.Z. and Y.Z.; funding acquisition, C.P. and G.H.; project administration, C.Z., J.H. and G.H. All authors have read and agreed to the published version of the manuscript.

Funding

This work was supported by the National Natural Science Foundation of China (Grant No. 51905366), the China Postdoctoral Science Foundation (Grant No. 2021M692626), the Project for Chongqing University Innovation Research Group of Chongqing Education Committee (Grant No. CXQT19008), the Chongqing Talent Plan for Innovation and Entrepreneurship Demonstration Team (Grant No. CQYC201903243), the S&T Project of Science and Technology Bureau of Bishan District in Chongqing (Grant No. Bskj20200011), the Science and Technology Research Program of Chongqing Municipal Education Commission (Grant No. KJQN201801419).

Institutional Review Board Statement

Not applicable.

Informed Consent Statement

Not applicable.

Data Availability Statement

Not applicable.

Conflicts of Interest

The authors declare no conflict of interest.

References

  1. Song, G.; Atrens, A. Understanding Magnesium Corrosion—A Framework for Improved Alloy Performance. Adv. Eng. Mater. 2003, 5, 837–858. [Google Scholar] [CrossRef]
  2. Atrens, A.; Johnston, S.; Shi, Z.; Dargusch, M.S. Viewpoint—Understanding Mg corrosion in the body for biodegradable medical implants. Scripta. Mater. 2018, 154, 92–100. [Google Scholar] [CrossRef]
  3. Zhang, C.; Wu, L.; Huang, G.; Huang, Y.; Pan, F. Effect of microalloyed Ca on the microstructure and corrosion behavior of extruded Mg alloy AZ31. J. Alloy. Compd. 2020, 823, 153844. [Google Scholar] [CrossRef]
  4. Zhang, C.; Wu, L.; Zhao, Z.; Huang, G.; Jiang, B.; Atrens, A.; Pan, F. Effect of the Al–Si eutectic on the microstructure and corrosion behavior of the single-phase Mg alloy Mg–4Li. J. Magnes. Alloy. 2021, 9, 1339–1348. [Google Scholar] [CrossRef]
  5. Grimm, M.; Lohmüller, A.; Singer, R.F.; Virtanen, S. Influence of the microstructure on the corrosion behaviour of cast Mg-Al alloys. Corros. Sci. 2019, 155, 195–208. [Google Scholar] [CrossRef]
  6. Deng, M.; Höche, D.; Lamaka, S.V.; Wang, L.; Zheludkevich, M.L. Revealing the impact of second phase morphology on discharge properties of binary Mg-Ca anodes for primary Mg-air batteries. Corros. Sci. 2019, 153, 225–235. [Google Scholar] [CrossRef]
  7. Zhang, C.; Wu, L.; Huang, G.; Liu, K.; Jiang, B.; Wang, G.; Xia, D.; Atrens, A.; Pan, F. Influence of Microalloying with Ca and Ce on the Corrosion Behavior of Extruded Mg-3Al-1Zn. J. Electrochem. Soc. 2019, 166, C445–C453. [Google Scholar] [CrossRef]
  8. Song, G.L.; Atrens, A. Corrosion Mechanisms of Magnesium Alloys. Adv. Eng. Mater. 1999, 1, 11–33. [Google Scholar] [CrossRef]
  9. Li, C.Q.; Xu, D.K.; Chen, X.B.; Wang, B.J.; Wu, R.Z.; Han, E.H.; Birbilis, N. Composition and microstructure dependent corrosion behaviour of Mg-Li alloys. Electrochim. Acta 2018, 260, 55–64. [Google Scholar] [CrossRef]
  10. Beaudry, B.J.; Daane, A.H. A study of the scandium-magnesium system from 0 to 60 at.% scandium. J. Less Common Met. 1969, 18, 305–308. [Google Scholar] [CrossRef]
  11. Li, T.; He, Y.; Zhou, J.; Tang, S.; Yang, Y.; Wang, X. Effects of scandium addition on biocompatibility of biodegradable Mg–1.5Zn–0.6Zr alloy. Mater. Lett. 2018, 215, 200–202. [Google Scholar] [CrossRef]
  12. Zhang, C.; Wu, L.; Liu, H.; Huang, G.; Jiang, B.; Atrens, A.; Pan, F. Microstructure and corrosion behavior of Mg-Sc binary alloys in 3.5 wt.% NaCl solution. Corros. Sci. 2020, 174, 108831. [Google Scholar] [CrossRef]
  13. Kim, K.H.; Nam, N.D.; Kim, J.G.; Shin, K.S.; Jung, H.C. Effect of calcium addition on the corrosion behavior of Mg–5Al alloy. Intermetallics 2011, 19, 1831–1838. [Google Scholar] [CrossRef]
  14. Seong, J.W.; Kim, W.J. Development of biodegradable Mg-Ca alloy sheets with enhanced strength and corrosion properties through the refinement and uniform dispersion of the Mg2Ca phase by high-ratio differential speed rolling. Acta Biomater. 2015, 11, 531–542. [Google Scholar] [CrossRef]
  15. Wu, G.; Fan, Y.; Gao, H.; Zhai, C.; Zhu, Y.P. The effect of Ca and rare earth elements on the microstructure, mechanical properties and corrosion behavior of AZ91D. Mater. Sci. Eng. A 2005, 408, 255–263. [Google Scholar] [CrossRef]
  16. Yang, J.; Peng, J.; Nyberg, E.A.; Pan, F.-S. Effect of Ca addition on the corrosion behavior of Mg–Al–Mn alloy. Appl. Surf. Sci. 2016, 369, 92–100. [Google Scholar] [CrossRef]
  17. Osório, W.R.; Freitas, E.S.; Garcia, A. EIS and potentiodynamic polarization studies on immiscible monotectic Al–In alloys. Electrochim. Acta 2013, 102, 436–445. [Google Scholar] [CrossRef]
  18. Osório, W.R.; Peixoto, L.C.; Moutinho, D.J.; Gomes, L.G.; Ferreira, I.L.; Garcia, A. Corrosion resistance of directionally solidified Al–6Cu–1Si and Al–8Cu–3Si alloys castings. Mater. Des. 2011, 32, 3832–3837. [Google Scholar] [CrossRef]
  19. Zhang, X.L.; Jiang, Z.H.; Yao, Z.P.; Song, Y.; Wu, Z.D. Effects of scan rate on the potentiodynamic polarization curve obtained to determine the Tafel slopes and corrosion current density. Corros. Sci. 2009, 51, 581–587. [Google Scholar] [CrossRef]
  20. McCafferty, E. Validation of corrosion rates measured by the Tafel extrapolation method. Corros. Sci. 2005, 47, 3202–3215. [Google Scholar] [CrossRef]
  21. Atrens, A.; Song, G.-L.; Cao, F.; Shi, Z.; Bowen, P.K. Advances in Mg corrosion and research suggestions. J. Magnes. Alloy. 2013, 1, 177–200. [Google Scholar] [CrossRef] [Green Version]
  22. Cao, F.; Shi, Z.; Hofstetter, J.; Uggowitzer, P.J.; Song, G.; Liu, M.; Atrens, A. Corrosion of ultra-high-purity Mg in 3.5% NaCl solution saturated with Mg (OH)2. Corros. Sci. 2013, 75, 78–99. [Google Scholar] [CrossRef]
  23. Feng, Y.-J.; Wei, L.; Chen, X.-B.; Li, M.-C.; Cheng, Y.-F.; Li, Q. Unexpected cathodic role of Mg41Sm5 phase in mitigating localized corrosion of extruded Mg-Sm-Zn-Zr alloy in NaCl solution. Corros. Sci. 2019, 159, 108133. [Google Scholar] [CrossRef]
  24. Xiang, Q.; Jiang, B.; Zhang, Y.; Chen, X.; Song, J.; Xu, J.; Fang, L.; Pan, F. Effect of rolling-induced microstructure on corrosion behaviour of an as-extruded Mg-5Li-1Al alloy sheet. Corros. Sci. 2017, 119, 14–22. [Google Scholar] [CrossRef]
  25. Zhang, T.; Meng, G.; Shao, Y.; Cui, Z.; Wang, F. Corrosion of hot extrusion AZ91 magnesium alloy. Part II: Effect of rare earth element neodymium (Nd) on the corrosion behavior of extruded alloy. Corros. Sci. 2011, 53, 2934–2942. [Google Scholar] [CrossRef]
  26. Jiang, P.; Blawert, C.; Hou, R.; Scharnagl, N.; Bohlen, J.; Zheludkevich, M.L. Microstructural influence on corrosion behavior of MgZnGe alloy in NaCl solution. J. Alloy. Compd. 2019, 783, 179–192. [Google Scholar] [CrossRef]
  27. Yin, Z.; Chen, Y.; Yan, H.; Zhou, G.-h.; Wu, X.-q.; Hu, Z. Effects of the second phases on corrosion resistance of AZ91-xGd alloys treated with ultrasonic vibration. J. Alloy. Compd. 2019, 783, 877–885. [Google Scholar] [CrossRef]
  28. Metalnikov, P.; Ben-Hamu, G.; Eliezer, D.; Shin, K.S. Role of Sn in microstructure and corrosion behavior of new wrought Mg-5Al alloy. J. Alloy. Compd. 2019, 777, 835–849. [Google Scholar] [CrossRef]
  29. Zhang, G.; Wu, L.; Tang, A.; Weng, B.; Atrens, A.; Ma, S.; Liu, L.; Pan, F. Sealing of anodized magnesium alloy AZ31 with MgAl layered double hydroxides layers. RSC. Adv. 2018, 8, 2248–2259. [Google Scholar] [CrossRef] [Green Version]
  30. Liu, S.; Li, B.; Wang, X.; Su, W.; Han, H. Refinement effect of cerium, calcium and strontium in AZ91 magnesium alloy. J. Mater. Process. Technol. 2009, 209, 3999–4004. [Google Scholar] [CrossRef]
  31. Aung, N.N.; Zhou, W. Effect of grain size and twins on corrosion behaviour of AZ31B magnesium alloy. Corros. Sci. 2010, 52, 589–594. [Google Scholar] [CrossRef]
  32. Zeng, R.-C.; Qi, W.-C.; Cui, H.-Z.; Zhang, F.; Li, S.-Q.; Han, E.-H. In vitro corrosion of as-extruded Mg–Ca alloys—The influence of Ca concentration. Corros. Sci. 2015, 96, 23–31. [Google Scholar] [CrossRef]
  33. Rad, H.R.B.; Idris, M.H.; Kadir, M.R.A.; Farahany, S. Microstructure analysis and corrosion behavior of biodegradable Mg–Ca implant alloys. Mater. Des. 2012, 33, 88–97. [Google Scholar] [CrossRef]
Figure 1. Metallographic microstructure of the alloys: (a) MS, (b) MS1Ca, (c) MS2Ca and (d) MS4Ca.
Metals 12 00093 g001
Figure 2. SEM micrographs of the alloys: (a) MS, (b) MS1Ca, (c) MS2Ca and (d) MS4Ca.
Metals 12 00093 g002
Figure 3. Hydrogen evolution volume–time curves of the alloys after immersion in the NaCl solution for 60 h.
Metals 12 00093 g003
Figure 4. Potentiodynamic polarization curves of the four alloys after immersion in the NaCl for 0.5 h.
Metals 12 00093 g004
Figure 5. EIS curves of the four alloys after immersion in the NaCl solution for 0.5 h: (a) Nyquist plots, (b) |Z|-frequency curves, (c) phase–frequency curves and (d) equivalent circuit.
Metals 12 00093 g005
Figure 6. Optical images of the surface corrosion morphologies of the four alloys after immersion in the NaCl for 60 h: (a) MS, (b) MS1Ca, (c) MS2Ca and (d) MS4Ca.
Metals 12 00093 g006
Figure 7. Corrosion morphologies of the four alloys after immersion in the NaCl for 60 h: (a) MS, (b) MS1Ca, (c) MS2Ca and (d) MS4Ca.
Metals 12 00093 g007
Table 1. Actual chemical composition of the Mg-0.3Sc-xCa alloys (wt.%).
AlloysMgScCaFeSi
MSBal.0.2300.00240.0032
MS1CaBal.0.250.090.00210.0046
MS2CaBal.0.240.220.00320.0078
MS4CaBal.0.230.380.00280.0065
Table 2. Corrosion parameters of the four alloys obtained by fitting the polarization curves in the NaCl solutions.
AlloysEcorr (V vs. SCE)icorr (A cm−2)
MS−1.5883.55 × 10−6
MS1Ca−1.6222.51 × 10−6
MS2Ca−1.7291.05 × 10−6
MS4Ca−1.6911.58 × 10−6
Table 3. The fitting results of EIS curves of the four alloys.
AlloysRs
(Ω cm2)
Ydl
−1 cm−2 sn)
ndlRt
(Ω cm2)
Yf
−1 cm−2 sn)
nfRf
(Ω cm2)
χ2
MS32.21.50 × 10−30.74575.81.2 × 10−50.92858.41.32 × 10−3
MS1Ca32.01.13 × 10−30.72811.01.5 × 10−50.93980.31.46 × 10−3
MS2Ca31.41.16 × 10−50.921388.11.2 × 10−30.761368.21.73 × 10−3
MS4Ca32.41.28 × 10−30.73810.81.2 × 10−50.921273.11.22 × 10−3
Publisher’s Note: MDPI stays neutral with regard to jurisdictional claims in published maps and institutional affiliations.

