Article

Simulating Diffusion Induced Grain Boundary Migration in Binary Fe–Zn

Department of Materials Science and Engineering, KTH Royal Institute of Technology, SE-10044 Stockholm, Sweden
*
Authors to whom correspondence should be addressed.
Metals 2022, 12(10), 1632; https://doi.org/10.3390/met12101632
Submission received: 22 August 2022 / Revised: 21 September 2022 / Accepted: 23 September 2022 / Published: 29 September 2022
(This article belongs to the Section Computation and Simulation on Metals)

Abstract

:
A recently developed phase-field model for simulating diffusion-induced grain boundary migration (DIGM) is applied to binary Fe–Zn. The driving force for the boundary migration is assumed to come from the coherency strain energy mechanism suggested by Sulonen. The effect of the angle of the grain boundary with the surface on the velocity of the boundary migration is studied in detail. The simulation results compare favorably with experimental observations, such as the oscillatory motion of the grain boundary, velocity of the moving grain boundary during DIGM, and the maximum value of mole fraction of Zn at the surface after 20 h of heat treatment.

1. Introduction

The discontinuous precipitation (DP) reaction, where a grain boundary constitutes the growth front behind which alternating lamellae of the precipitating phase and a solute impoverished matrix phase grow, was for a long time discussed as a recrystallization reaction [1]. As a consequence, the mechanism of grain boundary motion in DP reactions was not an issue. Somehow this view seems to have affected the early theories of DP [2,3] although it was by that time realized that grain boundary diffusivity was an important factor. Hillert [4] concluded that there would be no driving force for grain boundary motion in DP unless there were a deviation from the local equilibrium between the precipitating phase and the boundary. In a short note, Sulonen [5] suggested that a zone in front of the advancing boundary should form where the lattice misfit due to the inward diffusion of solutes in the bulk from the boundary leads a to coherency strain energy, acting as the driving force for grain boundary motion. Later it was also suggested that the boundaries moved due to a pulling effect exerted by the precipitates [6]. Some recent studies have shown that the grain boundary movement in similar processes exhibits jerky motions [7] and corresponding simulations have been performed to explain DP reaction with reaction front tracking and eventual composition changes in the microstructure [8]. There are other factors that could influence the grain boundary motion, one such factor could be the formation of grain boundary phases [9,10] which may eventually control grain growth. In this study, the formation of such phases is neglected for simplicity.
When further investigating the role of grain boundary diffusion of zinc during DP in Fe–Zn alloys, Hillert and Purdy [11] found that grain boundaries in iron samples, when exposed to an atmosphere of zinc and without forming a precipitate phase, moved. They called the phenomenon Chemically-Induced Grain Boundary Migration and suggested that the driving force for the boundary motion had a chemical origin. Nowadays, the phenomenon is often called DIGM (Diffusion Induced Grain Boundary Migration) [12,13,14,15,16,17,18] and is considered to be an important component of the DP reaction.
To model DIGM the phase-field method is a suitable choice. Cahn et al. [14] suggested a phase-field model for DIGM, with which they could study different mechanisms for the driving force. They concluded that a driving force based on the coherency strain energy is “…consistent with the observed features of DIGM in nearly all cases” [14]. The purpose of the present paper is to test this prediction on a real case, the binary Fe–Zn system, using a recently developed phase-field model for simulating DIGM by Mukherjee et al. [19].

2. Phase-Field Model for DIGM in Fe–Zn

The model was described in detail in [19] for a hypothetical binary system. For the convenience of the reader, the main parts are repeated here for the Fe–Zn case.

2.1. Governing Equations

The basic expression of the phase-field method is the total Gibbs energy of the system (G), which is written as a functional for a binary system, such as Fe–Zn:
G = 1 V m g 0 + κ ( x Z n ) 2 + ϵ ( ϕ ) 2 d V .
where g 0 is Gibbs energy per mole, κ and ϵ are the gradient energy coefficients for gradients in mole fraction ( x Z n ) and phase field variable ϕ , respectively, and V m corresponds to the molar volume. Here, 0 x Z n 1 and 0 ϕ 1 .
The equations governing the evolution of mole fraction and phase field variable are the Cahn–Hilliard equation [20], Equation (2), and the Allen–Cahn equation [21], Equation (3), respectively:
x ˙ Z n V m = · L δ G δ x Z n ,
ϕ ˙ = M ϕ δ G δ ϕ .
In Equation (2), L is a kinetic parameter related to the diffusional mobility and M ϕ in Equation (3) is also a kinetic parameter but related to the boundary mobility. The g 0 in Equation (1) will be divided into two parts, i.e., g 1 and g 2 , where g 1 is the weighted average of the molar Gibbs energy of the phases present locally while g 2 is a function of mole fraction and phase field variable. In addition, the gradient term κ ( x Z n ) 2 is dropped out due to its insignificance in the model. However, the gradient in the phase field variable ( ϕ ) has been taken into account due to the nature of our simulation setup. We consider only a single phase ferrite, α , in our simulations, thus the term g 1 then becomes:
g 1 = G m α .
The term g 2 contains information about additional interfacial energy contribution apart from the gradient term in ϕ in Equation (1), and the strain energy contribution which will serve as a driving force for DIGM. Therefore, g 2 can be divided into g 21 and g 22 . The term g 21 maintains the shape of the interface inspired by Finel et al. [22], see Equation (5),
g 21 = λ 4 d 2 Θ 2 1 Θ 2 l o g 1 Θ 2 2 ϕ 1 2 2 ϕ 1 2 .
Here, λ refers to the energy barrier coefficient given by 2 d σ which is similar to ϵ in Equation (1), σ is the interfacial energy in J/m 2 , and Θ is given by,
Θ = tanh d w ,
where d is the grid spacing and w is controlling the width of the interface.
The term g 22 contains the strain energy contribution due to the incorporation of Zn atoms in either of the two grains, as a result of diffusion of Zn atoms along the boundary. The term was proposed as an interaction between concentration and phase field variable by Cahn et al. [14] and later modified by Mukherjee et al. [19] to model DIGM in a hypothetical system, which for the Fe–Zn system can be written as:
G i n t = g 22 = K ϕ ( 1 ϕ ) x Z n x Z n 0 2 , 0 ϕ 1
Here, x Z n 0 is the mole fraction of Zn in the grain in front of the moving grain boundary which is not yet swept by it, x Z n is the mole fraction of the area of the grain swept by the grain boundary, the term ϕ ( 1 ϕ ) suggests that it is confined to the interface and the pre-factor K was given by Hillert [13] as,
K = Y V m η 2 ( 1 ν ) ,
where Y refers to Young’s modulus of α -Fe. This, however, is supposed to change due to the diffusion of Zn into the matrix phase. Therefore, Vegard’s law was used to calculate Y for x Z n = 0.1 (corresponding to the maximum value of x Z n observed at the sample surface in Ref. [23]). Due to a very small difference in the Poisson’s ratio ν for pure Fe and the alloy formed with x Z n = 0.1 , the ratio was taken for α -Fe, i.e., 0.29 and the lattice misfit η is given by,
η = d ( l n a ) d x Z n .
Here, d ( l n a ) corresponds to the difference in the natural logarithm of the lattice parameter of pure Fe and the alloy. The lattice parameters for pure Fe and pure Zn were taken from [24,25] and Vegard’s law was again used to calculate the lattice parameter of the alloy formed due to Zn diffusion with x Z n = 0.1 . The interaction term G i n t is responsible for grain boundary migration, which is triggered when Zn atoms from the vapor phase diffuse, much faster than the bulk diffusion, along the grain boundary.

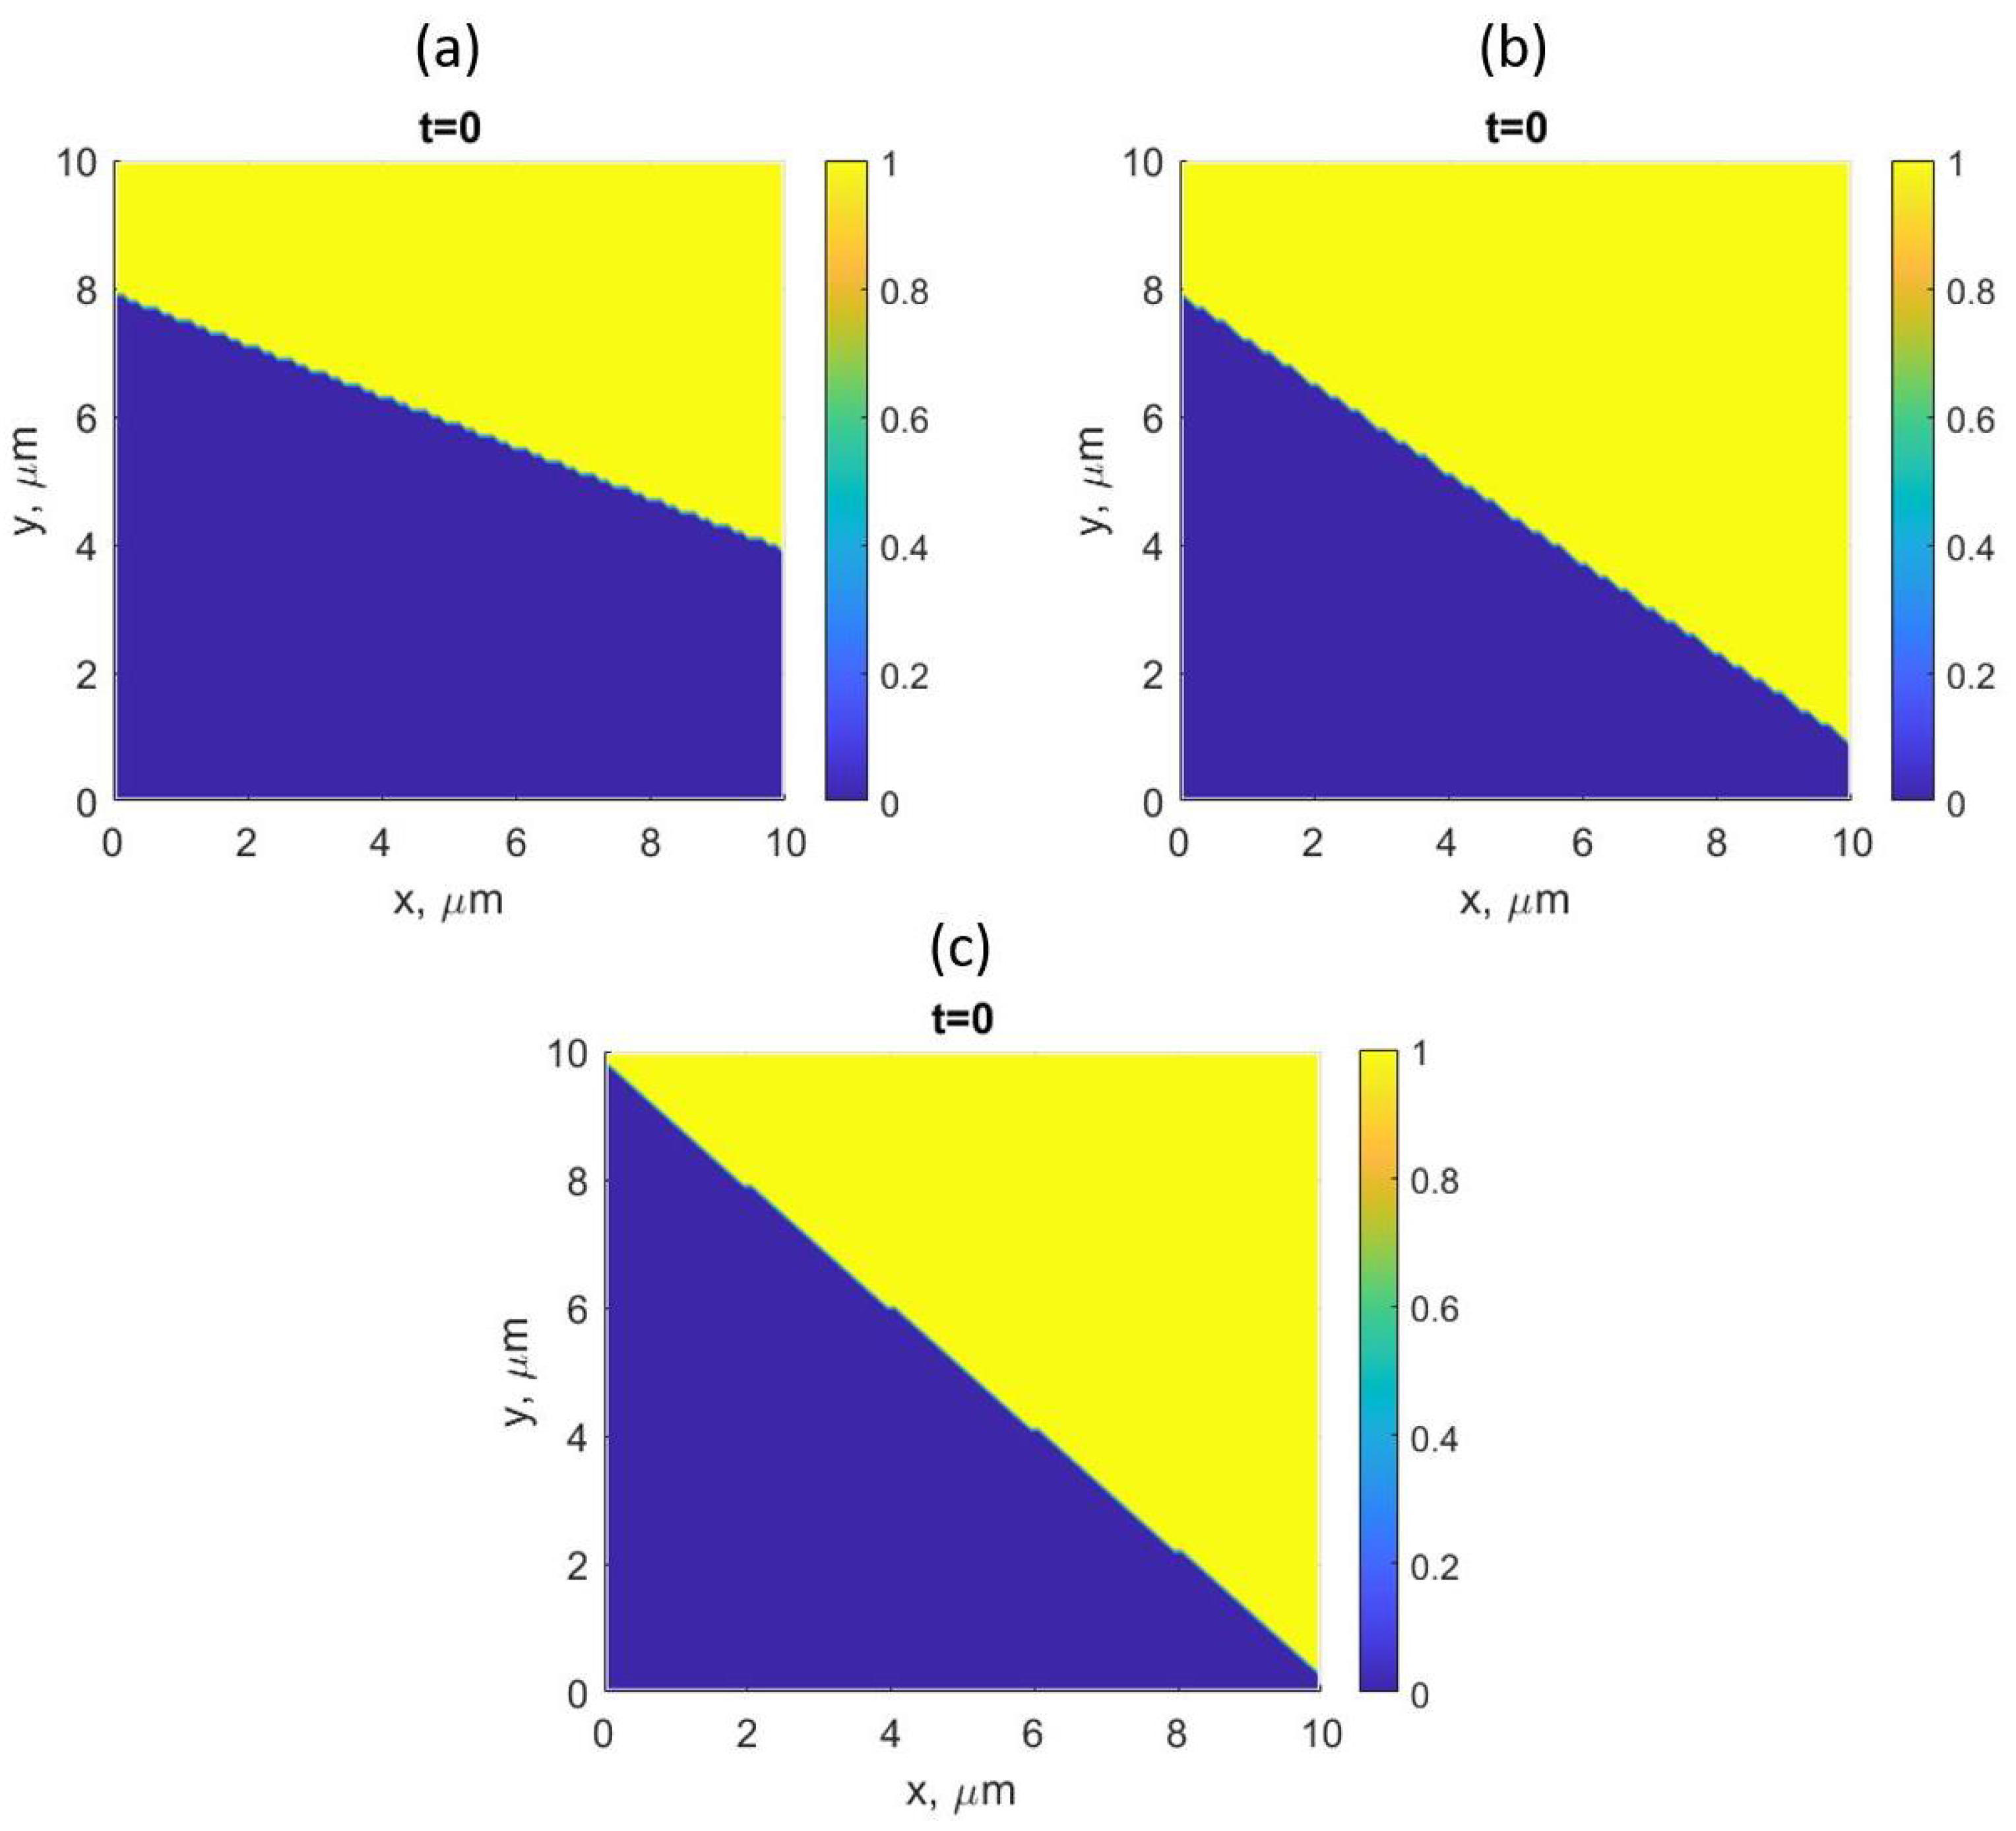
2.2. Simulation Setup

The simulations performed are compared with the experiment on the Fe–Zn system by Chongmo and Hillert [23], where pure Fe samples were exposed to a vapor of Zn from turnings of three different alloys: Fe-33wt%Zn, 18.8wt%Zn and 9wt%Zn. The alloy with 18.8wt%Zn and the temperature 873 K were chosen for our simulations. According to microprobe measurements in [23], the mole fraction Zn on the sample surface was close to the solubility limit for Zn, i.e., x Z n = 0.1 . The initial microstructure was set up such that the grain boundary extends from the top of the surface to 10 μ m below the surface, a schematic of such a setup was shown in our previous work [19].
The enhanced diffusivity in the boundary was controlled by a factor F which simply was multiplied by the bulk diffusivity. One of the most striking results by Hillert and Purdy [11] was that the diffusivity of moving grain boundaries was up to four orders of magnitude larger than for stationary boundaries. This effect we cannot account for in the simulations, and the same high diffusivity was used for the whole simulation time. The factor F, however, will be affected by the thickness of the grain boundary. As per Kaur et al. [26], the boundary diffusivity is inversely proportional to its thickness. Since the boundary thickness for metals or metallic alloys is generally between 0.5 nm to 1 nm the factor F is changed from 10 4 to 200 corresponding to the thickness of the boundary used in our simulations, which is of the order of grid spacing, i.e., 0.1 μ m. The thickness of the grain boundary is controlled by w in Equation (6). In our simulations, the value of w is taken, such that d / w = 2 , where, d is the grid spacing.
The kinetic parameter M ϕ in Equation (3) is related to the boundary mobility M by
M ϕ = M ξ k M ,
where ξ = δ ( d ϕ / d z ) 2 d z , and it can be shown that ξ = 0.235 / δ [27]. The boundary mobility M for α - α grain boundaries in Fe has been suggested to be [28]:
M = 0.035 e ( 1.47 × 10 5 ) / R T .
k M is a fudge factor that was set to around 200; it turned out that the value obtained from Equation (11) was too low to yield a reasonable agreement with experimental results.
In our simulations, σ , the interfacial energy, is used as a fitting parameter. All parameter values used are collected in Table 1. The thermodynamic and kinetic data were taken from Thermo-Calc Software TCFE12 Steels/Fe-alloys database [29] and MOBFE7 Steels/Fe-Alloys Mobility database [30], respectively. The mobility values for Fe and Zn at temperature T = 873 K are also listed in Table 1.

2.3. Numerical Details

The simulations were performed using YAPFI [31], a software for phase-field simulations based on the Wheeler–Boettinger–McFadden phase field model [32]. In YAPFI, the governing equations are solved in a fully implicit manner, and the implementation is based on a finite volume approach that allows for multiple phase-field variables and multiple components.

3. Results and Discussion

The simulations were performed on a setup based on Chongmo and Hillert’s experiments. The initial stage at t = 0 h shows that the grain boundary is at an angle with the surface of higher Zn activity, Figure 1. The results show DIGM after 3 h, where the grain boundary was observed to migrate faster at the junction of boundary and surface, Figure 2. The grain boundary on the other side of the plot in Figure 2, however, moves only due to its curvature as no activity of Zn is present here, therefore, no DIGM occurs.
In Figure 2, the velocity of the grain boundary is higher close to the surface which is why it is more bent near the surface. This happens due to the driving force from the interaction term in Equation (7), which acts only when an asymmetric concentration gradient across the grain boundary is present. The gradient is created by the diffusion of Zn atoms along the grain boundary. Concurrently, the energy is generated corresponding to the interaction term and it results in a change in the overall energy of one of the grains. The grain with lower energy grows over the other resulting in a grain boundary migration. In the end, it leaves behind an enriched Zn surface, as shown in Figure 3 (blue curve).
Due to grain boundary migration, a steep but continuously increasing profile of X Z n is left behind the growing front, Figure 3. On a closer look at the profile, it was noted that the effect of the grain boundary curvature was only active at the beginning, and the effect of G i n t was relatively low during that time. This is evident from Figure 3 where the red curve corresponding to G i n t = 0 and the blue curve with a non-zero G i n t overlap with each other till 3 μ m. After that, the X Z n achieves a sufficiently high value which generates a significant concentration gradient across the interface. As a result, the interaction term becomes active and aids in pushing the grain boundary to 5.6 μ m (blue curve). As per the experiments, the surface concentration of Zn should reach around 11 wt% after 16.5 h (see Figure 17 in Ref. [23]) which corresponds to X Z n = 0.095 . Compared to the simulation results, X Z n reaches 0.077 after 16 h, Figure 4, which is in reasonable agreement with the experimental measurement.
The extent of DIGM was tested with three types of grain boundaries, depending on their contact angle at the surface of high Zn activity, Figure 5. Here, the Zn activity is active on the right-hand side of the plot, same as in Figure 1. It was observed that the migrating boundary showed a dependence on the angle of contact (here, the angle of contact is calculated anti-clockwise from the surface of high Zn activity to the grain boundary). The position of the interface in the course of their migration is shown in Figure 6.
The high-angled boundary, corresponding to Figure 5a, moved slower than a low-angled boundary Figure 5c. This is clear from Figure 6, where the position of the interface with a lower angle ( S L 3 ) moves faster than S L 2 when it crosses over each other at t = 2000 s. The comparison could also be done with S L 1 when the starting point of S L 2 and S L 3 are set to the same starting point as that of S L 1 . A relative comparison showed that S L 3 covers the longest distance, followed by S l 2 and then S L 1 , Figure 7.
According to Chongmo and Hillert [23] the angle with which the grain boundary meets the surface should be almost 90 due to initial annealing at 850 C, however, a straight grain boundary meeting at a right angle at the surface would hardly show DIGM in our simulations. Therefore, three different angles were taken accordingly and the angle close to a right angle ( S L 1 ) moved to 6.8 μ m, S L 2 to 4.9 μ m, and S L 3 to 5.3 μ m. When the velocity of the interface was calculated at the surface, S L 3 seemed to have a higher velocity in the beginning, i.e., v = 4 nm/s and then quickly reduced to 1 nm/s. Whereas S L 2 had an initial velocity of v = 2 nm/s and S L 1 had v = 1 nm/s. On further analysis of the velocity of S L 3 , see Figure 8, it was noted that it achieved a high value in the beginning because of the combined effort from the two forces, i.e., one due to G i n t and the other due to boundary curvature, which was aiding in grain boundary migration, however, it was observed to drop quickly to 1 nm/s and followed a stop and go motion because of a constant struggle between the two forces. In the end, the velocity was zero as the forces ended up balancing each other. On comparison with the velocity calculated for such interfaces in the experiments, it was reported as v = 2.8 nm/s at 873 K, see Table 1 in Ref. [23], which is well under the range obtained in our simulations.
Another feature of DIGM from the experiments was the oscillatory motion of grain boundaries, see Figure 6 in Ref. [23]. The grain boundary was observed to go through an oscillatory motion until it stopped moving in the end. The micrograph corresponding to Figure 7 in Ref. [23] captured a clear image of the oscillations of the grain boundaries at a surface. In the simulations, this was observed when a grain boundary beneath the surface moved forward and backward, i.e., it reverted back after moving forward for a period of time. In Figure 9, the traces (where ϕ = 0.5 ) of the grain boundary are shown where, due to the slant nature of the boundary, the direction of motion was fixed, however, due to the faster movement of the interface the angle of the boundary at the surface changed quickly, thereby, leading to a force that would stop the boundary from moving and straighten out instead. As can be seen, the grain boundary has reverted back after t = 3 h and then stopped moving after 4 h. Although the two forces, one due to G i n t and the other due to the curvature, would like to ultimately balance each other, the curvature of the boundary changes quickly after 3 h and the bent boundary, corresponding to Figure 2, has a force to straighten out in the opposite direction. Therefore, the two forces are again aligned but in a different direction. However, the alignment changes just after the fourth hour, and the two forces are in constant struggle with one another, thereby leading to zero velocity. Such an observation was made by Chongmo and Hillert [23], where the grain boundary migration seemed to be balanced by the growth of Zn-rich grains. The growth of grains corresponds to the curvature effects and the chemical driving force which aids in grain boundary migration corresponds to the elastic strain energy ( G i n t ). A demonstration of such an oscillation effect could be explained by Figure 10 where the position and the velocity of the interface are plotted with time. An unusual kink was observed between the third and fourth hour and, thereafter, a zero velocity is maintained till the twentieth hour. The unusual kink in Figure 10a corresponds to the change in position of the interface from forward to backward. According to Ref. [23] the grain boundary in a Zn-rich region “should eventually come in contact with the surface…” and “establish a right angle”, i.e., it should stop moving after a few oscillations. In the results from our simulations, this can be validated by plotting the velocity of the interface. In Figure 10b, it is seen that the grain boundary velocity continuously decreases with time and ends up achieving a negative value after t = 3 h until it immediately reverts back to zero at the fourth hour. Later, the grain boundary was observed to be stationary between 4 to 20 h, and the rest of the boundary straightened out during this time.
Another comparable feature with the experiments was the non-uniform composition profile along the surface where the grain boundary has swept away more than once. It was observed that the grain boundary reverted back when the curvature effect took precedence over the strain energy effect, thereby leading to an unusual mole fraction profile of Zn at the surface as shown in Figure 11. The mole fraction profile of Zn after 20 h of simulation shows a ditch between two peaks. This corresponds to the position where the boundary was stuck after oscillation. At this position, there is an equal driving force due to G i n t on either side of the boundary as the grain boundary is almost straight and there is no excess driving force due to curvature.
Therefore, the model for DIGM suggested by Mukherjee et al. [19] also explains most of the observed features of DIGM from experiments but there is a lack of full quantitative analysis, such as the Zn profile from the surface to the interior of the grains. A plausible explanation for this could be the inability to reproduce the nucleation of new grains at the surface as observed by Chongmo and Hillert [23]. Nevertheless, the current model is successful in reproducing most of the features of DIGM in a real system, such as Fe–Zn.

4. Conclusions

The phase field model proposed by Mukherjee et al. [19] was used successfully to explain most of the observable features of DIGM in the Fe–Zn system. The following conclusions can be made:
  • The assumption that the driving force for DIGM comes from the coherency strain energy ( G i n t ), that is generated due to the concentration gradient across the interface, seems to be valid for Fe–Zn. This gradient was achieved by swift grain boundary diffusion that was controlled by the factor F, see Refs. [19,33].
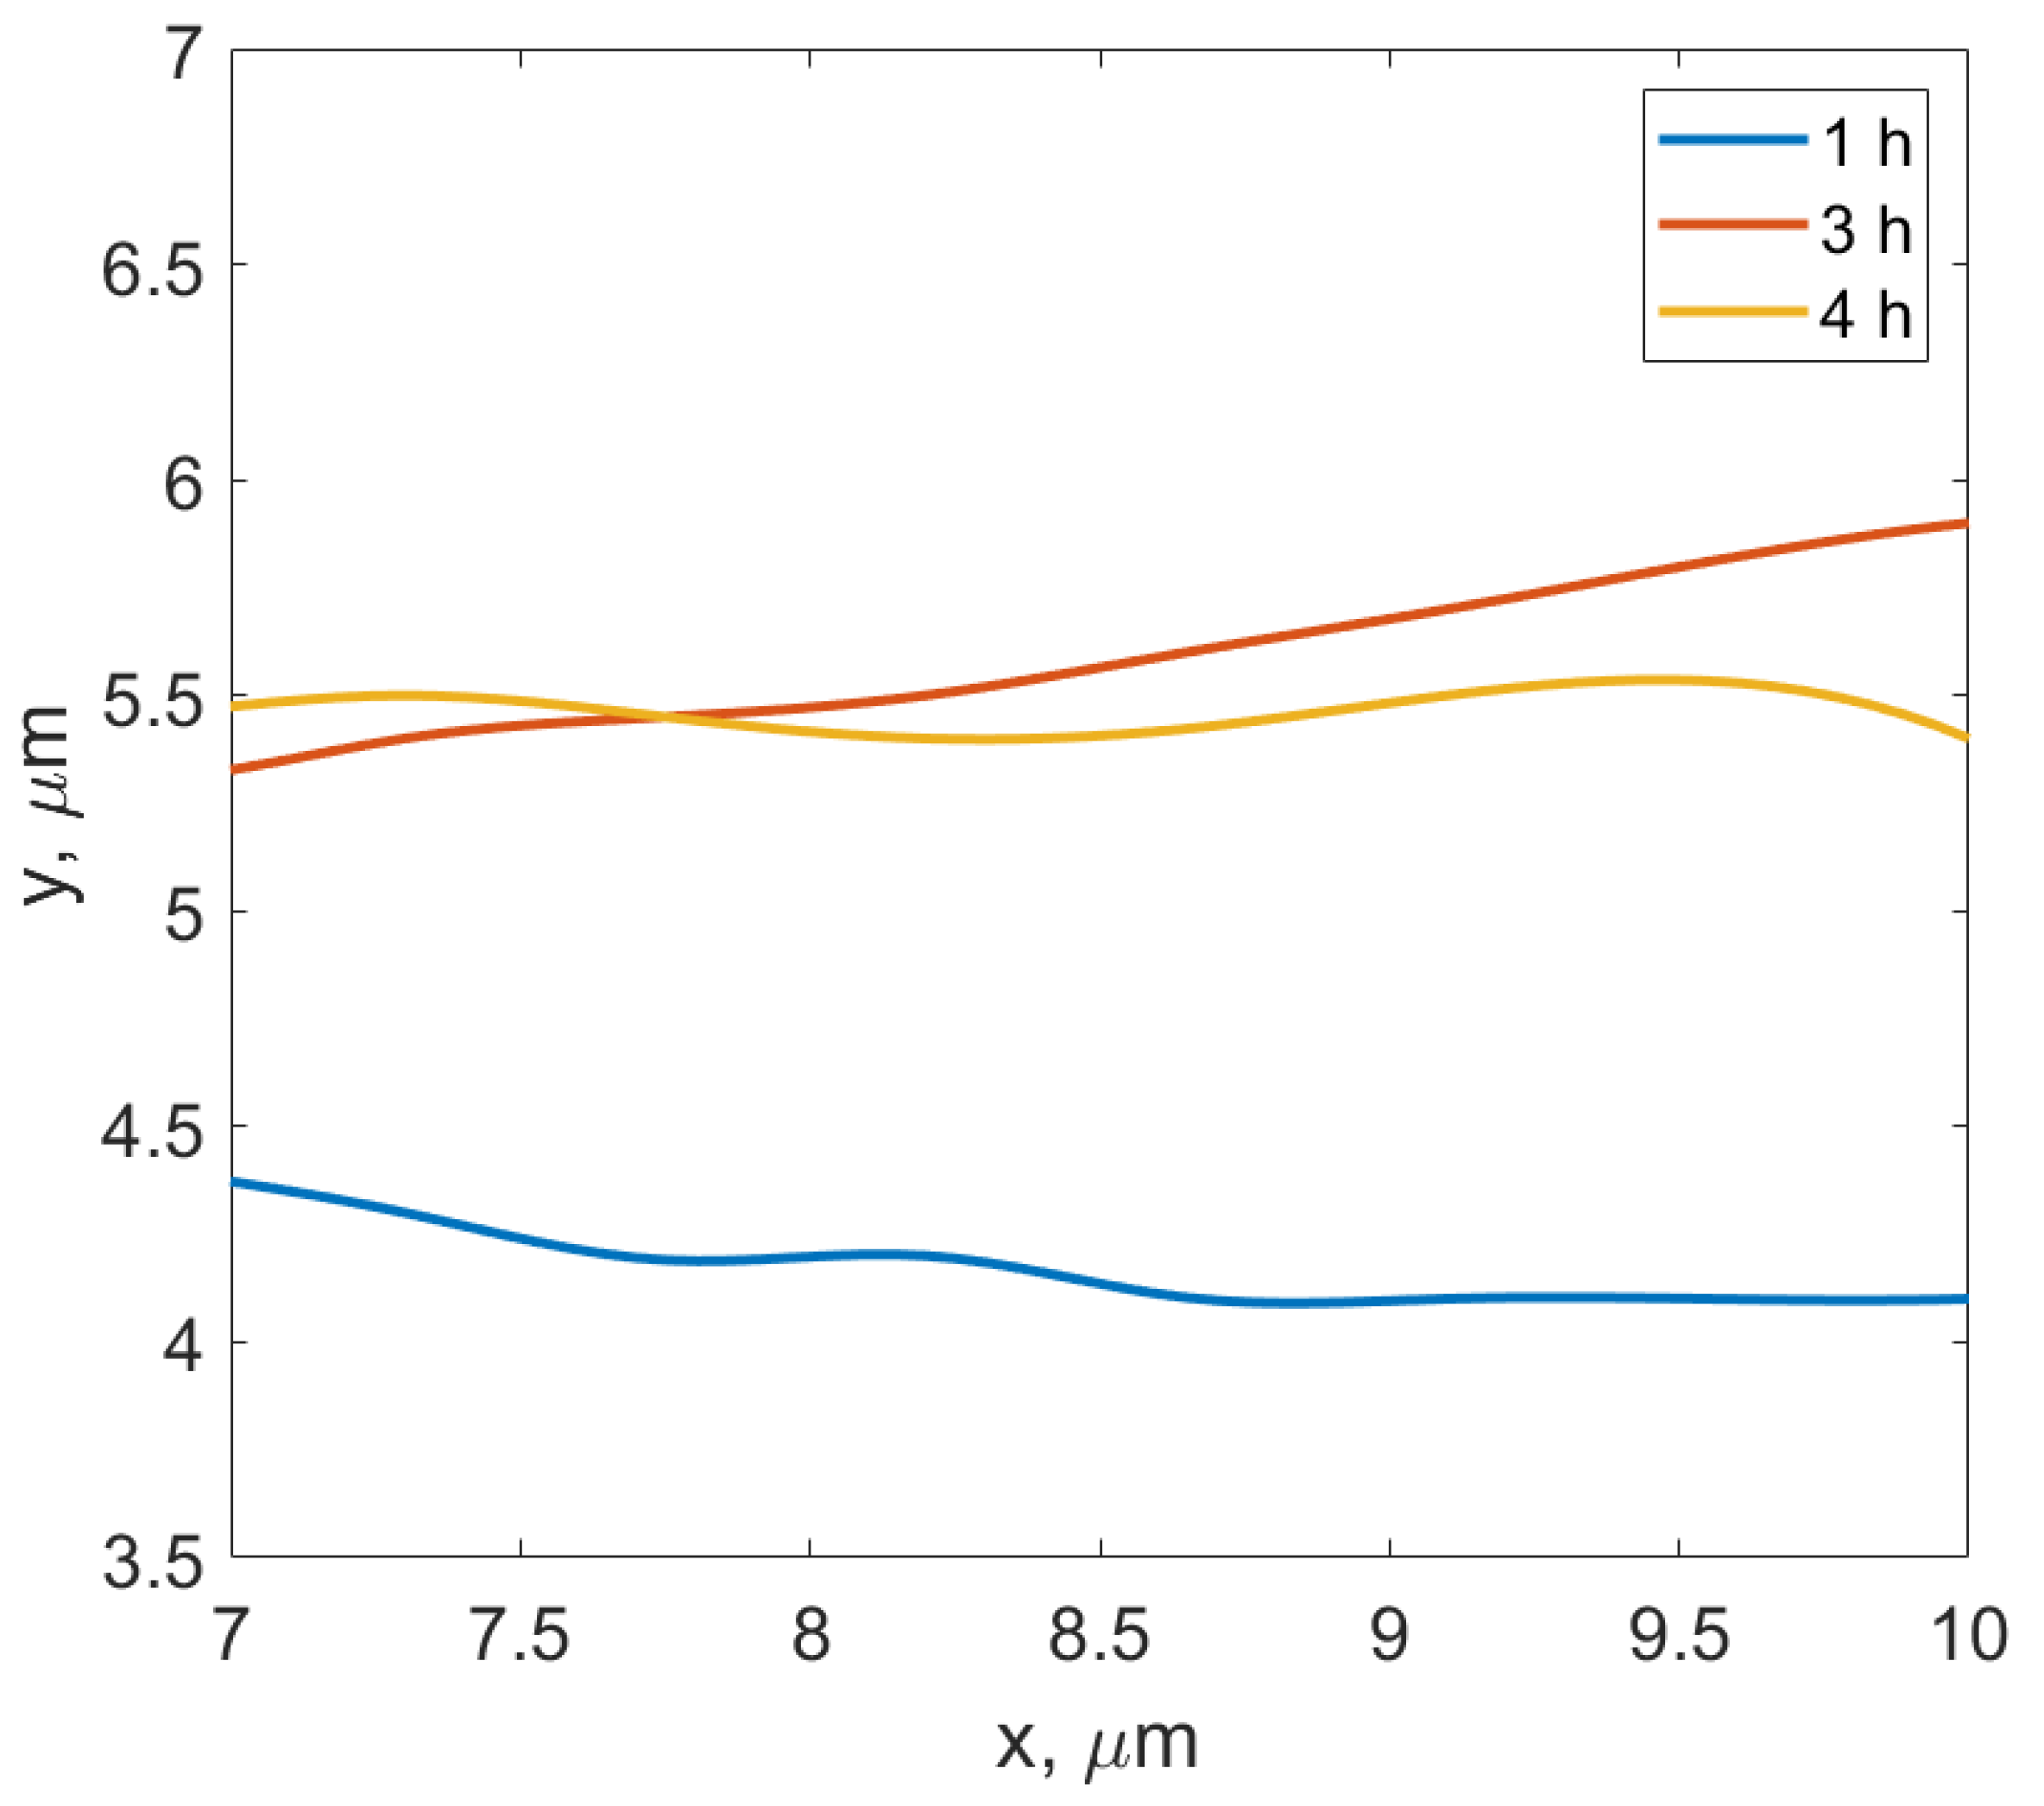
  • The observed features from the experiments by Chongmo and Hillert [23], such as a distorted grain boundary at the junction of the boundary and the surface, and the oscillatory motion of the grain boundary at the surface agreed qualitatively well with the simulation results. The reason for the oscillatory motion is thought to be due to a competitive relationship between two forces, i.e., one due to the interaction term ( G i n t ) and the other due to the curvature of the boundary. During the course of migration, these two forces either aligned, opposed, or balanced each other multiple times.
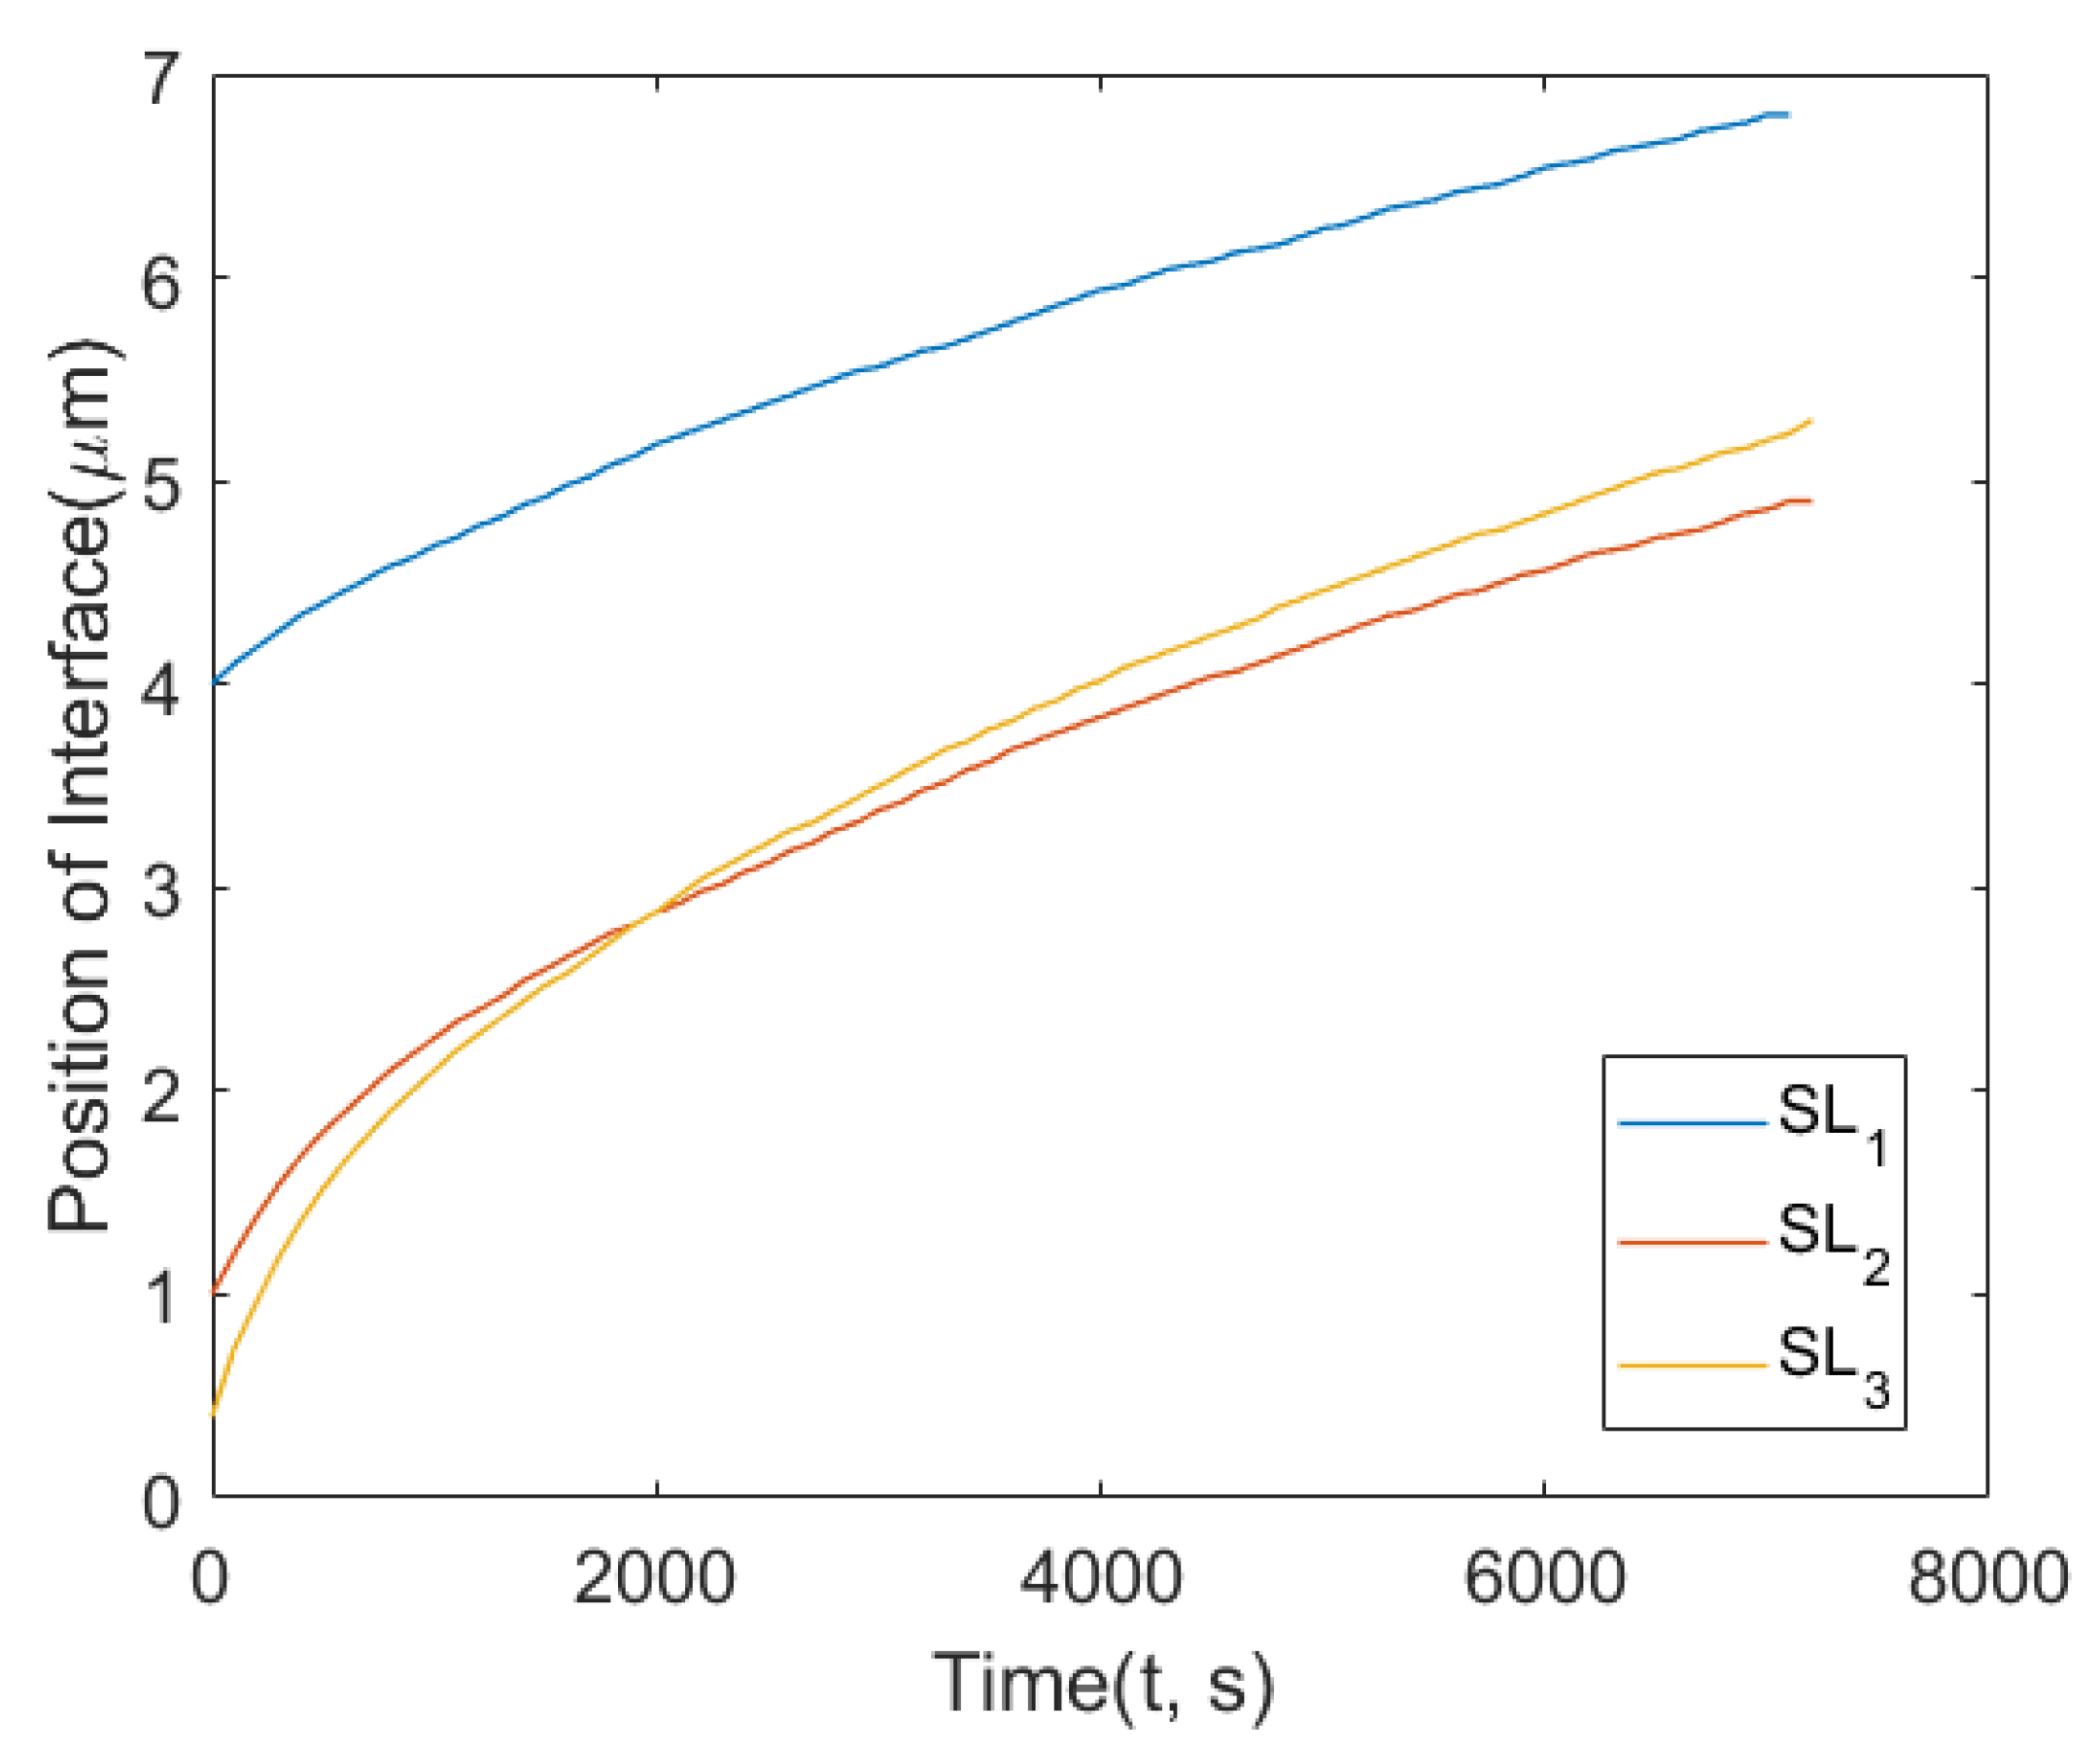
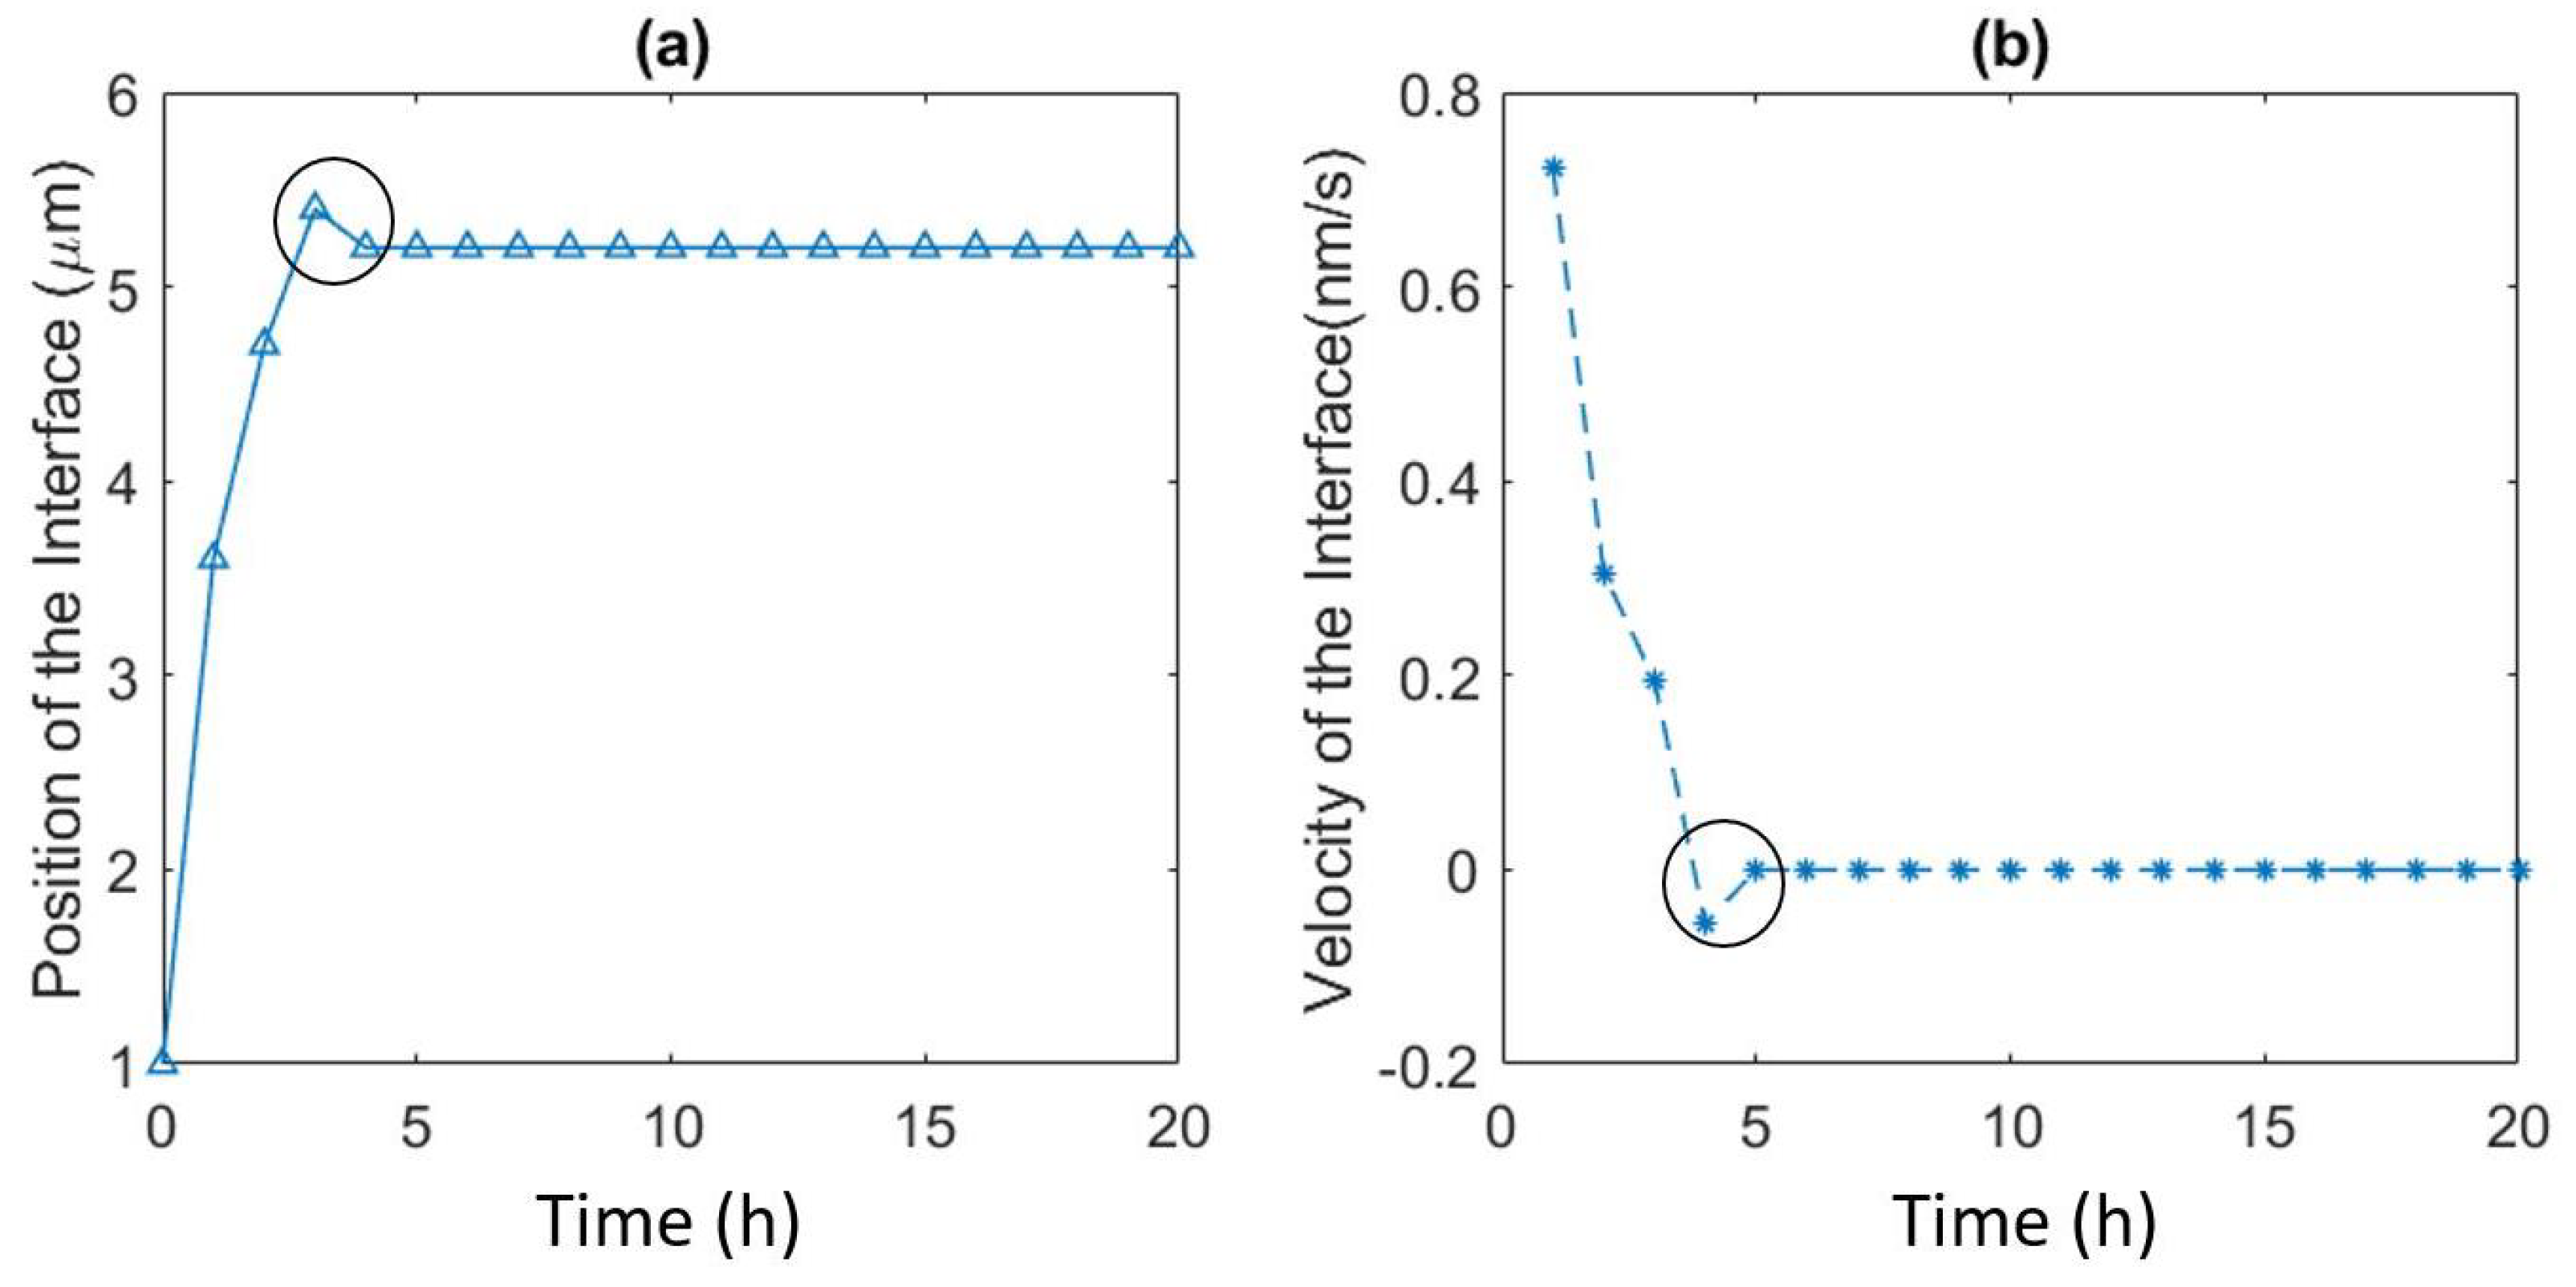
  • The influence of the contact angle of a grain boundary with the surface on the velocity of the interface, and the mole fraction of Zn at the surface agreed quantitatively with the previous experiments [23]. The velocity of the interface from Chongmo and Hillert [23] was under the range of the values obtained from the simulation. It was also observed that the grain boundary with a higher angle of contact between the boundary and the surface (close to 90 ) moved slower than a low-angled grain boundary. When evaluated, the velocity of the low-angled grain boundary was very high at the beginning of migration and then gradually dropped to follow a stop-and-go motion till it reached zero velocity.

Author Contributions

Conceptualization, D.M., H.L. and J.O.; methodology, D.M., H.L. and J.O.; software, H.L.; writing—original draft preparation, D.M.; writing—review and editing, H.L. and J.O.; visualization, D.M.; supervision, H.L. and J.O.; project administration, H.L. and J.O.; funding acquisition, H.L. and J.O. All authors have read and agreed to the published version of the manuscript.

Funding

We thank the Swedish Foundation for Strategic Research (RMA-15-0062), The Foundation for Applied Thermodynamics and the Swedish iron and steel producers’ association for supporting this research project.

Institutional Review Board Statement

Not applicable.

Informed Consent Statement

Not applicable.

Data Availability Statement

Not applicable.

Conflicts of Interest

The authors declare no conflict of interest. The funders had no role in the design of the study; in the collection, analyses, or interpretation of data; in the writing of the manuscript; or in the decision to publish the results.

Abbreviations

The following abbreviations are used in this manuscript:
DIGMDiffusion Induced Grain Boundary Migration
DPDiscontinuous Precipitation

References

  1. Smoluchowski, J.E.M.R.; Weyl, W.A. Precipitation from Solid Solutions of Metals. Phase Transformations in Solids; General Electric Company: Schenectady, NY, USA, 1951; pp. 387–545. [Google Scholar] [CrossRef]
  2. Turnbull, D. Theory of Cellular Precipitation. Acta 1955, 3, 55–63. [Google Scholar] [CrossRef]
  3. Cahn, J.W. The kinetics of cellular degregation reactions. Acta Metall. 1959, 7, 18–28. [Google Scholar] [CrossRef]
  4. Hillert, M. The role of interfaces in phase transformations. In The Mechanism of Phase Transformations in Crystalline Solids; Institute of Metals for the Metals & Metallurgy Trust: London, UK, 1969; Volume 33, pp. 231–247. [Google Scholar]
  5. Sulonen, M. On the driving force of discontinuous precipitation and dissolution. Acta Metall. 1964, 12, 749–753. [Google Scholar] [CrossRef]
  6. Fournelle, R.A.; Clark, J.B. The genesis of the cellular precipitation reaction. Metall. Trans. 1972, 3, 2757–2767. [Google Scholar] [CrossRef]
  7. Chronowski, M.; Straumal, B.; Baretzky, B.; Zieba, P. Jerky Motion of the Reaction Front during Dissolution in a Fe-13.5at.% Zn Alloy. Materials 2022, 15, 3525. [Google Scholar] [CrossRef]
  8. Opara, J.; Straumal, B.; Ziȩba, P. Cellular automata modelling of discontinuous precipitation. Materials 2021, 14, 4985. [Google Scholar] [CrossRef]
  9. Straumal, B.B.; Noskovich, O.I.; Semenov, V.N.; Shvindlerman, L.S.; Gust, W.; Predel, B. Premelting transition on 38°<100> tilt grain boundaries in (Fe-10at.% Si)-Zn alloys. Acta Metall. Et Mater. 1992, 40, 795–801. [Google Scholar] [CrossRef]
  10. Straumal, B.B.; Mazilkin, A.A.; Kogtenkova, O.A.; Protasova, S.G.; Baretzky, B. Grain boundary phase observed in Al-5 at.% Zn alloy by using HREM. Philos. Mag. Lett. 2007, 87, 423–430. [Google Scholar] [CrossRef]
  11. Hillert, M.; Purdy, G.R. Chemically Induced Grain Boundary Migration. Acta Metall. 1977, 26, 333–340. [Google Scholar] [CrossRef]
  12. Cahn, J.W.; Pan, J.D.; Balluffi, R.W. Diffusion induced grain boundary migration. Scr. Metall. 1979, 13, 503–509. [Google Scholar] [CrossRef]
  13. Hillert, M. On The Driving Force for Diffusion Induced Grain Boundary Migration. Scr. Metall. Mater. 1983, 17, 237–240. [Google Scholar] [CrossRef]
  14. Cahn, J.W.; Fife, P.; Penrose, O. A phase-field model for diffusion-induced grain-boundary motion. Acta Mater. 1997, 45, 4397–4413. [Google Scholar] [CrossRef]
  15. Penrose, O. On the elastic driving force in diffusion-induced grain boundary motion. Acta Mater. 2004, 52, 3901–3910. [Google Scholar] [CrossRef]
  16. King, A.H. Diffusion induced grain boundary migration in hexagonal materials. Int. Mater. Rev. 1987, 32, 173–189. [Google Scholar] [CrossRef]
  17. Chary, V.R.; Gupta, S.P. Diffusion induced grain boundary migration in the Ag-Zn system. Mater. Charact. 2009, 60, 1202–1213. [Google Scholar] [CrossRef]
  18. Bréchet, Y.J.M.; Purdy, G.R. On the possibility of DIGM-assisted abnormal grain growth. Scr. Mater. 2006, 54, 2009–2011. [Google Scholar] [CrossRef]
  19. Mukherjee, D.; Larsson, H.; Odqvist, J. Phase field modelling of diffusion induced grain boundary migration in binary alloys. Comput. Mater. Sci. 2020, 184, 1–9. [Google Scholar] [CrossRef]
  20. Cahn, J.W.; Hilliard, J.E. Free Energy of a Nonuniform System. I. Interfacial Free Energy. J. Chem. Phys. 1958, 28, 258–267. [Google Scholar] [CrossRef]
  21. Samuel, A.M.; Cahn, J.W. A microscopic theory for antiphase boundary motion and its application to antiphase domain coarsening. Acta Metall. 1978, 27, 1085–1095. [Google Scholar]
  22. Finel, A.; Le Bouar, Y.; Dabas, B.; Appolaire, B.; Yamada, Y.; Mohri, T. Sharp Phase Field Method. Phys. Rev. Lett. 2018, 121, 25501. [Google Scholar] [CrossRef] [Green Version]
  23. Chongmo, L.; Hillert, M. A metallographic study of diffusion-induced grain boundary migration in the Fe-Zn system. Acta Metall. 1981, 29, 1949–1960. [Google Scholar] [CrossRef]
  24. Feng, Z. The Lattice Parameter of Gamma Iron and Iron-Chromium Alloys. Ph.D. Thesis, Case Western Reserve University, Cleveland, OH, USA, 2015. [Google Scholar]
  25. Narkevicius, A.; Bucinskiene, D.; Rucinskiene, A.; Pakstas, V.; Bikulcius, G. Study on long term atmospheric corrosion of electrodeposited zinc and zinc alloys. Trans. Inst. Met. Finish. 2013, 91, 68–73. [Google Scholar] [CrossRef]
  26. Kaur, I.; Mishin, Y.; Gust, W. Fundamentals of Grain and Interphase Boundary Diffusion; John Wiley: Hoboken, NJ, USA, 1995; pp. 2–411. [Google Scholar]
  27. Loginova, I.; Odqvist, J.; Amberg, G.; Ågren, J. The phase-field approach and solute drag modeling of the transition to massive γα transformation in binary Fe-C alloys. Acta Mater. 2003, 51, 1327–1339. [Google Scholar] [CrossRef]
  28. Hillert, M.; Höglund, L. Mobility of α/γ phase interfaces in Fe alloys. Scr. Mater. 2006, 54, 1259–1263. [Google Scholar] [CrossRef]
  29. Thermo-Calc Software. TCFE Steels/Fe-Alloys Database, Version 12.0; Thermo-Calc Software, Inc.: McMurray, PA, USA, 2022. [Google Scholar]
  30. Thermo-Calc Software. TCFE Steels/Fe-Alloys Mobility, Version 7.0; Thermo-Calc Software, Inc.: McMurray, PA, USA, 2022. [Google Scholar]
  31. Larsson, H. The YAPFI phase-field implementation. arXiv 2021, arXiv:2104.11501. [Google Scholar]
  32. Wheeler, A.A.; Boettinger, W.J.; McFadden, G.B. Phase-field model for isothermal phase transitions in binary alloys. Phys. Rev. A 1992, 45, 7424–7440. [Google Scholar] [CrossRef]
  33. Fife, P.C.; Cahn, J.W.; Elliot, C.M. A free-boundary model for diffusion-induced grain boundary. Oxford 2001, 3, 291–336. [Google Scholar] [CrossRef] [Green Version]
Figure 1. Plot of ϕ showing the initial setup with a slant grain boundary meeting the surface of high Zn activity.
Metals 12 01632 g001
Figure 2. Plot of variable ϕ shows bent grain boundary near the surface due to DIGM.
Metals 12 01632 g002
Figure 3. X Z n along the surface referring to Figure 2 at x = 10 μ m, with and without G i n t after 3 h.
Metals 12 01632 g003
Figure 4. X Z n profile at the surface left behind by the moving grain boundary.
Metals 12 01632 g004
Figure 5. Plot of the variable ϕ at t = 0 h for three slant boundaries (a) S L 1 , (b) S L 2 and (c) S L 3 , based on different angle of contact at the surface, i.e., right side of the plots.
Metals 12 01632 g005
Figure 6. Position of the interface after 2 h for S L 1 , S L 2 , and S L 3 .
Metals 12 01632 g006
Figure 7. Relative position of the interface after 2 h for S L 1 , S L 2 , and S L 3 when the starting point is adjusted for S L 2 and S L 3 so that it is same for all three cases, i.e., 4 μ m. A clear difference is observed when S L 3 moved further than S l 2 and S L 1 .
Metals 12 01632 g007
Figure 8. Velocity of the interface for S L 3 setup where the velocity is observed to drop with time.
Metals 12 01632 g008
Figure 9. Trace of the grain boundary after 1, 3, and 4 h for S L 2 .
Metals 12 01632 g009
Figure 10. (a) Position of the interface and (b) Velocity of the interface. These plots show the unusual kink (encircled in the figure) after 3 h which refers to the oscillation of grain boundary for S L 2 .
Metals 12 01632 g010
Figure 11. X Z n profile at the surface after 20 h.
Metals 12 01632 g011
Table 1. Simulation parameters.
ParametersValues
M ϕ 10 2
(m 3 /J)
σ 6.88 × 10 2
(J/m 2 )
Mobility of Fe 8.55 × 10 24
(m 2 mol/J)
Mobility of Zn 5.96 × 10 23
(m 2 mol/J)
F200
Y212
(GPa)
V m 7.27 × 10 6
(m 3 /mol)
K10,323
(J/mol)
Publisher’s Note: MDPI stays neutral with regard to jurisdictional claims in published maps and institutional affiliations.

