Article

Characterizing the Tensile Behavior of Double Wire-Feed Electron Beam Additive Manufactured “Copper–Steel” Using Digital Image Correlation

Institute of Strength Physics and Materials Science, Siberian Branch of Russian Academy of Sciences, 634055 Tomsk, Russia
*
Authors to whom correspondence should be addressed.
Metals 2022, 12(11), 1797; https://doi.org/10.3390/met12111797
Submission received: 20 September 2022 / Revised: 17 October 2022 / Accepted: 19 October 2022 / Published: 24 October 2022

Abstract

:
The paper presents the results of the evaluation of the mechanical characteristics of samples of multi-metal “copper-steel” structures fabricated by additive double wire electron beam method. The global and local mechanical characteristics were evaluated using uniaxial tensile tests and full-field two-dimensional digital image correlation (DIC) method. DIC revealed the peculiarities of the fracture stages: at the first stage ( 0.02 < ε 0.08 ) the formation of V-shaped shear lines occurs; at the second stage ( 0.08 < ε 0.15 ) transverse shear lines lead to the formation of a block structure; at the third stage ( 0.15 < ε 0.21 ) the plasticity resource ends in the central part of the two necks cracks are formed, and the main crack is the cause of the fracture of the joint. It is found that shear lines are formed first in copper and then propagate to steel. Electron microscopy proves that uniformly distributed iron particles could always be found in the “Fe-Cu” and “Cu-Fe” interfaces. Additionally, the evolution of average strain rates and standard deviations were measured (calculated) in the regions of necks in copper and steel regions. New shear approach shows that the most of angles for parallel shears components are ±45°, rupture angles are about 0°, and combined account of these two types of shears provides us additional discrete angles.

1. Introduction

Now additive technologies are promising methods to fabricate new polymetallic products consisting of two or more components [1,2,3,4,5,6]. The practical application of polymetallic products has a wide range of industries such as aviation, rocket and machine building. The variety of practical applications is used due to the special demands to lightweight structures with optimized, variable characteristics and functionality. This need arises when different parts of a product or its surface are subjected to complex stress or/and high temperature. For example, the double system “copper-steel” is used when intensive heating is applied to the work steel part of the product while the copper part effectively removes the heat which leads to keeping high mechanical characteristics of the product [3,4,7,8,9].
Due to the large differences in the properties of Cu and SS, such as melting point (Cu—1085 °C, SS—1400–1500 °C) and thermal conductivity (Cu—401 W/mK, SS—17–19 W/mK), it is not always possible to achieve the desired properties for the whole product. This is because thermal conductivity of copper is 20 times greater than steel conductivity, which tends to dissipate heat quickly from the melting zone, making it difficult to reach the melting point during the joining the two materials. In addition, copper has limited solubility in steel [9], and copper penetration in the heat affected zone (HAZ) can be a cause of pore formation and hot cracking [10]. On the other hand, some papers point on the high-quality of “copper-steel” system, received by means of additive technologies. For example, in [11] “copper-steel” functionally graded material with ultra-high bond strength was obtained by laser powder bed fusion. It was shown that small dendritic grains at the copper-steel interface, initiated by a high cooling rate, increase tensile and adhesive strength at the interface. Additive manufacturing of copper—H13 tool steel shows that material deformation mostly happened in the Cu region with minimal elongation in the D22 and H13 zones [12].
Wire electron beam additive technology has an advantage over other additive technologies in high power and high efficiency, which makes this technology suitable for the rapid fabrication, however, the price is much higher than in other systems. Vacuum plays an important role in the manufacture of reactive metals, or materials prone to oxidation at elevated temperatures. Using this technology, high-quality copper-steel joints have already been made [3,4,13]. Osipovich et al. [3,4] obtained “copper–steel” multi-metallic structures samples using the double wire-feed electron beam additive manufacturing technique. The material structure of copper-steel interface is mechanical mixture of copper and austenitic steel grains. Here, intermetallic phases “copper-iron” were not formed. Analysis of the macrostructure at the “copper-steel” interface has not found large pores and cracks. Up to now the mechanical behavior of double wire-feed electron beam additive manufactured “copper–steel” structures samples has not been investigated yet.
It is well-known that residual plastic deformation at the grain level develops inhomogeneously in polycrystalline metals [14]. It was shown that accurate prediction of fracture processes depends on detailed knowledge of the accumulation of inhomogeneous strains at the microlevel [14]. For example, it has been observed that plastic deformation and possible cracking accumulate in the regions where plastic deformation was previously localized. The unique microstructural characteristics of additively produced multimaterials create an additional challenge in determining the effect of their microstructure on macroscale mechanical properties, including their behavior under monotonic loading. Therefore, it is important to identify the general quantitative relationship between anisotropic plasticity and structural elements of the material to find out exactly which structural elements dominate in fracture mechanics.
In wire-feed electron beam additive manufacture, the wire is feed directly into a moving heat source (electron beam) that melts the material. After deposition the molten material undergoes complex molten pool dynamics with rapid solid-state cooling. The addition of new layers exposes the material to thermal heating-cooling cycles with alternative temperature. These phenomena are determined by the process parameters and create a hierarchical microstructure [15] that differs from conventionally processed materials. That also means that the original cast or forged materials and the layer-grown material have various microstructures. Therefore, under mechanical loading it is a cause of residual stress and localization of deformation in the “copper-steel” interface.
In recent years, digital image correlation has been widely used to measure materials with inhomogeneous deformations [12,16,17,18,19,20,21,22,23,24,25,26,27,28]. DIC quantifies the displacement on the sample surface by identifying the same position between two images using the brightness distribution around some point of interest. DIC measurements can be performed in 2D using a single camera or in 3D using multiple cameras. For tensile testing, two-dimensional measurement is often considered adequate [16]. To date, quite a lot of work has been published on the DIC study of the deformation processes of steel and copper samples after various impacts [16,17,18,19,20,21,22], and in particular those made using additive technologies [21,22]. In [18], a full-field measurement system based on the high-temperature DIC approach was successfully applied to track strain inhomogeneities in specimens of FV566 turbine steel from initial ductility to failure and thus provided some significant information regarding localization and hence the occurrence of ductile fracture. The authors of [19] used the DIC method to study the inhomogeneity of macro- and micro deformations on polycrystalline copper samples during uniaxial tensile tests using samples with different curvature and grain size. It has been shown that when the scale of a microscopically inhomogeneous structure such as crystal grains becomes large compared to the macroscopic structure and/or when the macroscopic stress gradient becomes large, the inhomogeneous strain in the microscopic structure affects the macroscopic strain.
In [20], the tensile deformation behavior of a copper bicrystal with a perpendicular grain boundary was studied using DIC method. The results of the experiments showed that the distribution of displacements and deformations on the surface of the sample is inhomogeneous, and the deformation at the grain boundary is lower than inside the grains. The strain localization behavior of two different friction stir welding (FSW) welds of a copper container was studied using tensile tests combined with digital image correlation [16]. An early localization of deformation was found on the outgoing side of the new gas-shielded weld. According to the authors of the article, it was occurred due to a strength mismatch and a grain size gradient between the weld and the base material. In [17], an optical measurement of the deformation of copper samples welded by friction stir and electron beam technique, was investigated by means of digital image correlation during tensile tests. The defective zones of the weld showed large local deformations and early onset of localization of plastic deformation, as a result of which the regions outside the defective zones of the weld were deformed less in comparison with defect-free samples.
In works on the study of DIC methods for layer-by-layer steel samples using additive technologies [21,22], one and the same characteristic feature of such samples was noted. Digital image correlation for microstructural analysis of deformation pattern in additively manufactured 316L thin walls found strong deformation localization, located at the interface between layers.
There are significantly fewer publications on DIC studies of “copper-steel” samples; we found only two related works [12,23]. The general and local mechanical characteristics of gas tungsten arc welded copper–stainless steel joints were evaluated using uniaxial tensile tests and full-field 2D-DIC [23]. Seam and heat affected zone local stress-strain curves were received on the base of 2D-DIC analysis. These curves were very close to Cu-BM (base material) and the weld metal achieved an equivalent tensile strength of Cu-BM. The main DIC results are consistent with those obtained from conventional uniaxial tensile tests, performed on transverse and longitudinal tensile specimens.
Thus, a detailed study of strain localization using the DIC method has been carried out in this work. Using method will help the relationship between local material deformations and the resulting mechanical properties for the samples, produced by electron beam additive manufacturing with double wire-feed. The use of the proposed methodology will further help to characterize similar multimetallic materials with a high degree of confidence for further exploitation.

2. Materials and Methods

2.1. Additive Sample Growth

“Copper-steel” specimens were made according to the technology described in [3]. An electron-beam experimental setup was used to obtain a polymetallic sample. The electron beam gun used an indirectly heated cathode, which ensures the greatest stability of the 3D printing process. Maximum operating parameters of the electron beam gun: accelerating voltage 30 kV, beam current 100 mA. To obtain a two-component sample of electron-beam 3D printing technology, two wire feeders were used (Figure 1).
The current of manufacturing the vertical wall is varied from 55 to 50 mA for steel and copper, respectively. Copper and steel filaments with a diameter of 1 mm were fed alternately in the following sequence: 5 layers of steel–5 layers of copper–5 layers of steel–5 layers of copper–5 layers of steel. The chemical composition of the wires used is given in Table 1.
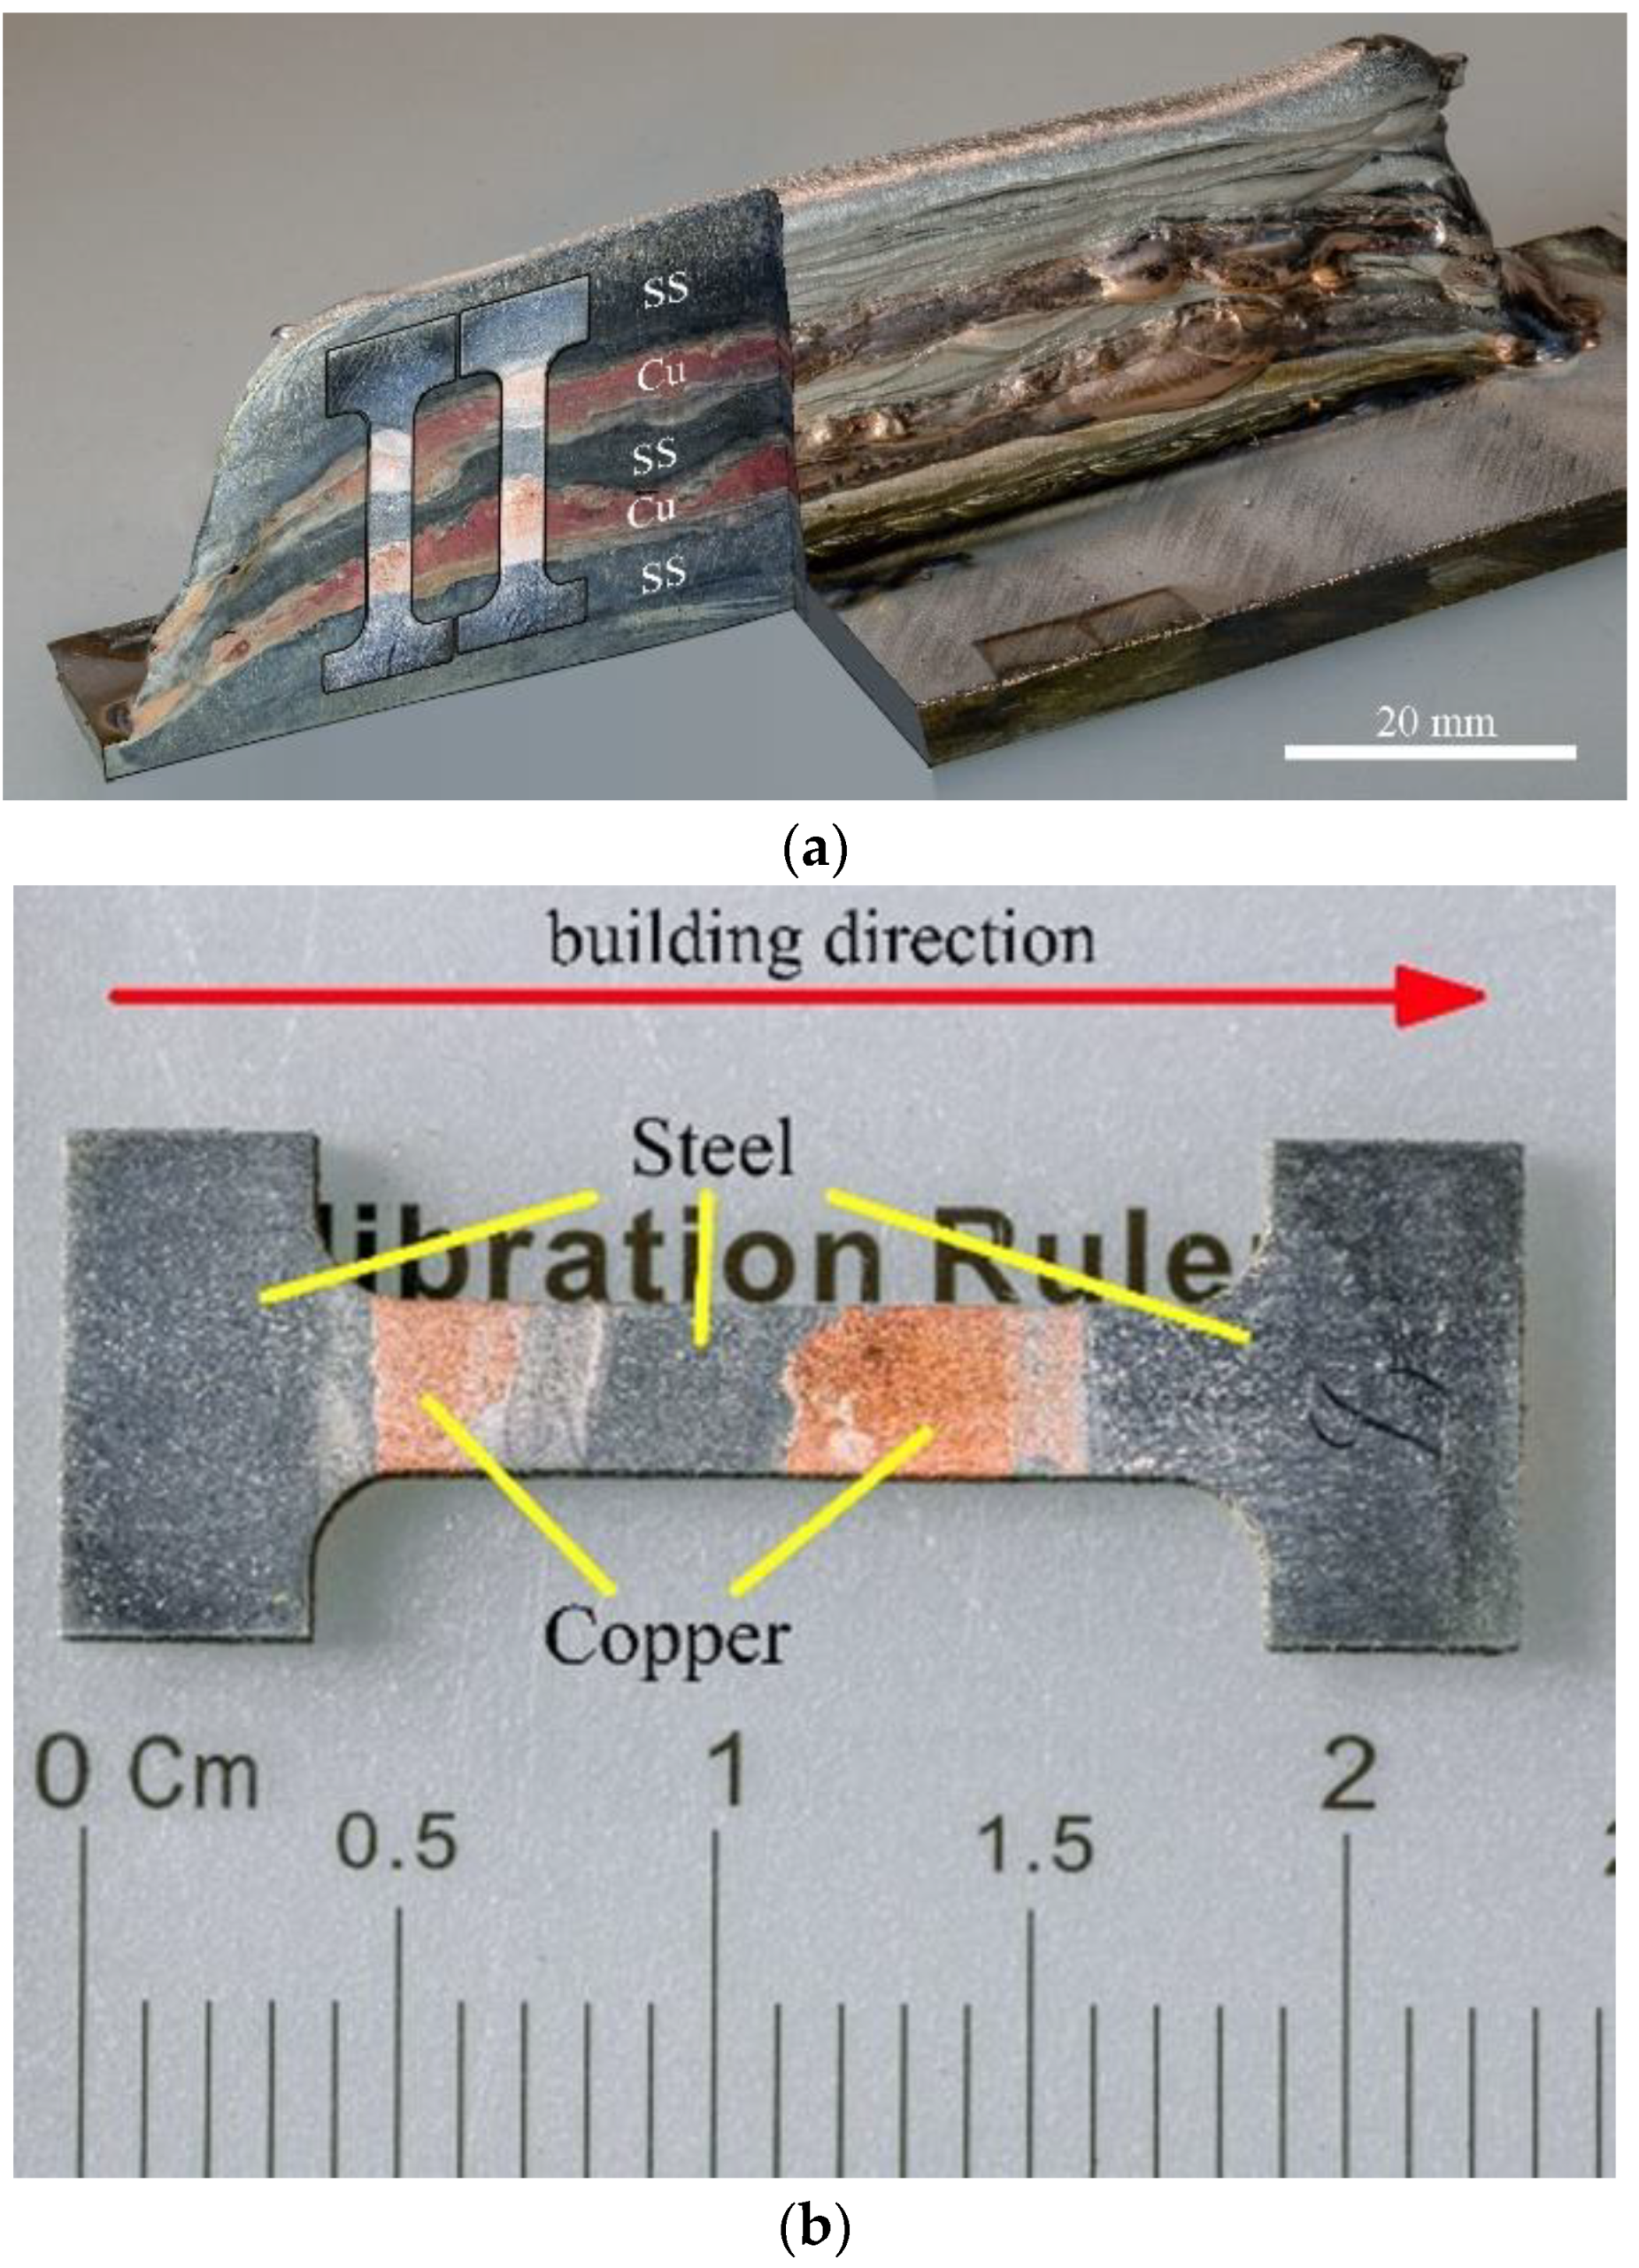
From the resulting sample in the form of a vertical wall, samples were cut for mechanical tensile tests (Figure 2a). Samples were cut out on DK7750 electro-erosion machine. The samples were prepared in several stages, including grinding on sandpaper of different grits, polishing with diamond paste, and etching the samples in a solution of 10 mL HCl + 1 g. FeCl3 + 20 mL H2O. The metallographic tensile sample preparation allowed, first, a detailed study of the samples after fracture, and, second, etching made the samples contrast for DIC purposes.
Figure 2b shows image of the resulting static tensile test specimen. The dimensions of the working area of the tensile specimen were 12.0 mm × 2.7 mm × 1.5 mm.

2.2. Mechanical Tests

The tensile test was carried out on a UTS 110M-100 1-U testing machine (Etalonpribor, Mytishchi, Russia) at room temperature with optical strain measurement by a DIC. The samples were tested at a constant slider speed of 1 mm/min.
The direction of tension was normal to the direction of printing, thus, the layers of copper and steel contained in the sample in the working part of the samples for tension were oriented perpendicular to the axis of tension.

2.3. DIC

At loading images of the working area of the samples were recorded with a Nikon d90 digital camera (Nikon Corporation, Tokyo, Japan) equipped with a Tamron SP AF 90 mm f/2.8 Di Macro 1:1 lens (Tamron Co., Ltd., Saitama, Japan) and saved to a computer hard drive. Computer processing of a pair of images, obtained at various time moments, gives us displacement vectors field, based on DIC. Additional computer processing of the vector field also provides us the spatial distribution of strain, components of the deformation tensor, shear [26] and vortex [24] characteristics of vector field and a number of others.
The DIC method has long and successfully entered experimental mechanics. It is based on computer processing of digital image files of a material surface during loading. The measurement result is a field of displacement vectors.
The measurement technique is as follows. The image of a surface area is perceived by an optical microscope, converted into digital form by a camera, and recorded on a computer hard drive. This is the reference image. Then, the material is subjected to mechanical loading and again the second image is recorded as current image.
To calculate the field of displacement vectors in the DIC method, a block algorithm is used (Figure 3). The reference image is divided into a number of reference sections (template) of size m × m , located from each other at a distance of the spatial period T . The second image (after loading) is divided into search regions of size R × R ( R > m ) and the same spatial period. Then, the reference area is scanned within the corresponding search area, and for each current position, the value of some functional is calculated S = Ω f ( I 1 , I 2 ) , where I 1 and I 2 are arrays of image brightness values, f ( I 1 , I 2 ) is a measure of proximity, and Ω is the scanning area. A criterion of the template identification was the global extremum of the functional. Usually, difference or correlation functionals are used as a measure of proximity. According to the coordinates of the global extremum in the spatial distribution of the functional, the coordinates of the desired vector are found.
The vector field is described by the relation u ( x , y ) = u x ( x , y ) e x + u y ( x , y ) e y , where u x ( x , y ) are longitudinal, u y ( x , y ) are transverse components, and e x ,   e y are orts. Local deformation was calculated as cardinal plastic shear:
γ ( x , y ) = ( ε x x ε y y ) 2 + 4 ε x y 2
where ε x x ,   ε y y ,   ε x y −deformation tensor components.
We will consider the spatial distribution of deformation as a deformation structure. This distribution can be converted into a pseudo-image in the following way. Let the deformation change in a certain interval, and the brightness of the eight-bit image vary in the range 0 I ( x , y ) 255 . By dividing the deformation interval into 255 parts and comparing each of them with the corresponding brightness value, we get an eight-bit pseudo-image in grayscale. For an inverse pseudo image, the higher the deformation, the darker the image area will be. To improve the quality of perception of such pseudo-images, one can work with them as with ordinary optical images.

2.4. Structural Studies before and after Tensile Tests

X-ray diffraction analysis (XRD) was performed on an X-ray diffractometer (DRON-7, Innovation center “Burevestnik”, St. Petersburg, Russia) using CoKα radiation with a scan range of 20–165° (2θ) with step size of 0.05°. Identification of the XRD reflections was performed using Crystal Impact’s software “Match!” (Version 3.9, Crystal Impact, Bonn, Germany).
The structure of the samples after additive growth and after tensile tests was studied using scanning electron microscopes (SEM): (1) LEO EVO 50 (Carl Zeiss AG, Oberhochen, Germany), (2) TESCAN VEGA 3 SBU (TESCAN ORSAY HOLDING, Brno, Czech Republic) equipped with electron energy dispersive spectroscopes (EDS) OXFORD X-Max 50 (Oxford Instruments, Concord, MA, USA) with 20 kV accelerating voltage, 4–12 nA current, and approximately 2 µm probe spot diameter.

3. Results

3.1. Initial “Steel-Copper”Structure

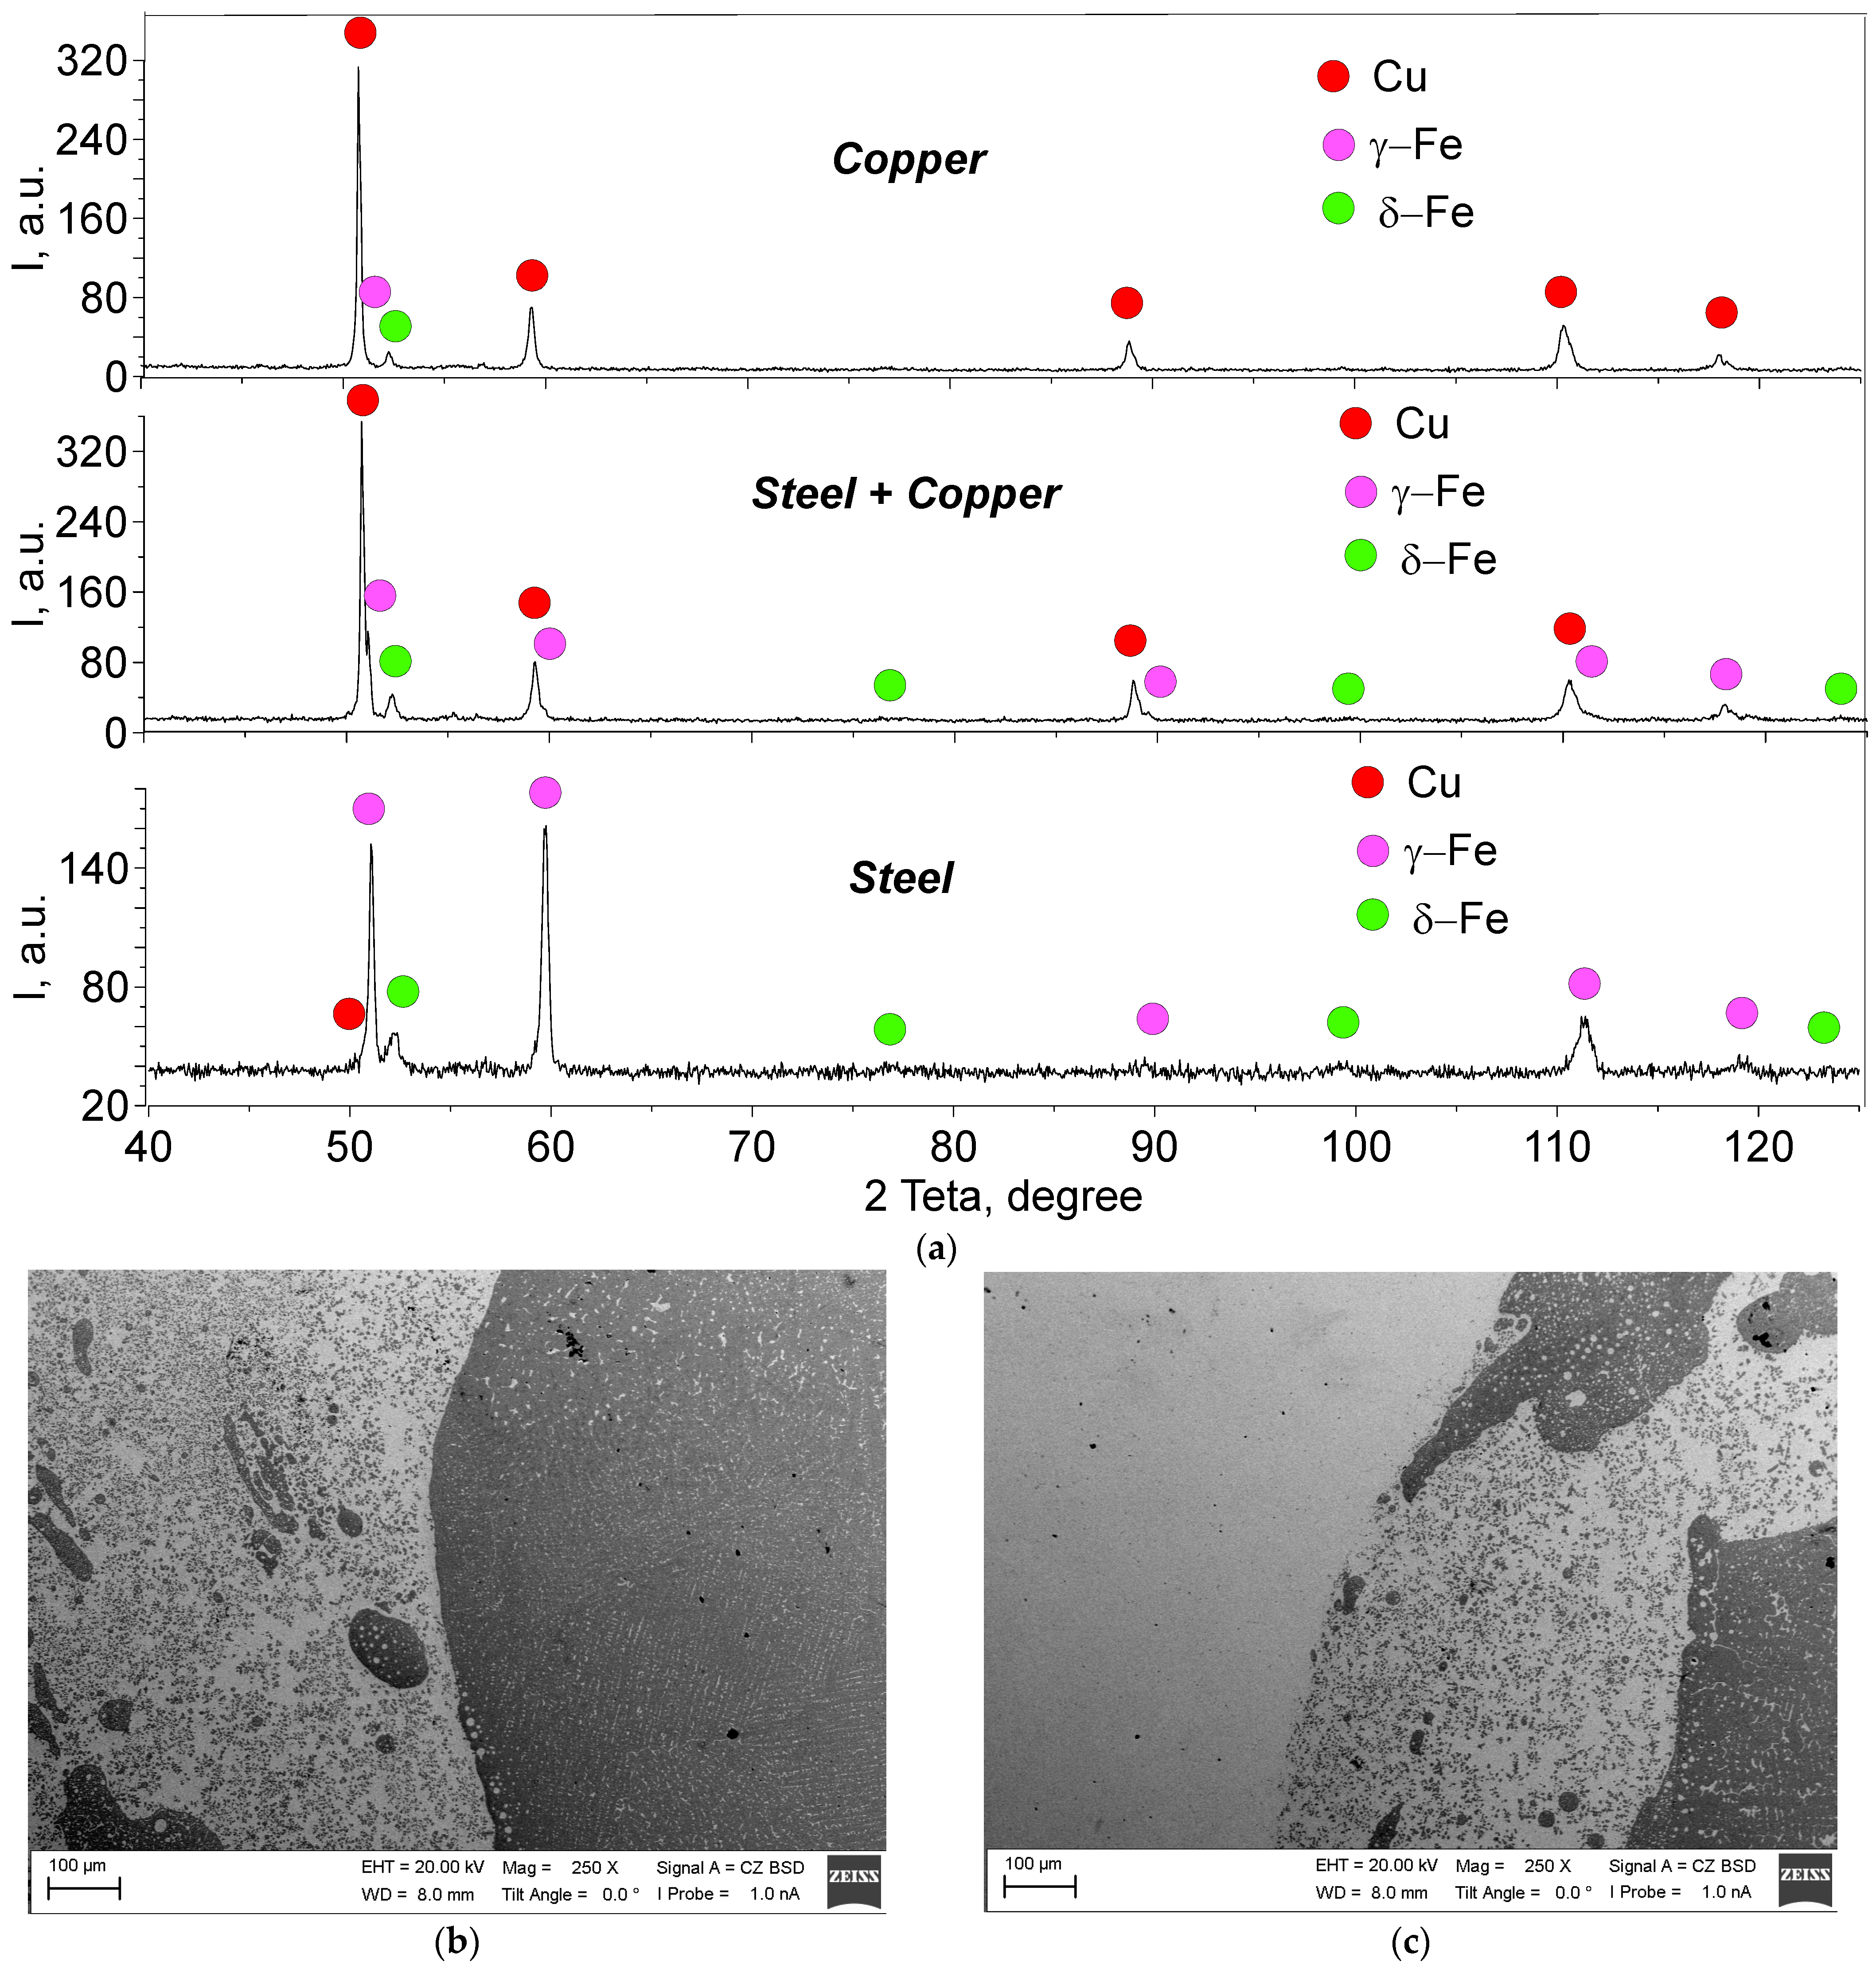
XRD studies have shown that three phases are present in “copper-steel” sample: (i) FCC copper, (ii) γ—Fe and (iii) δ—Fe (Figure 4a). No intermetallic phases were found. At the same time, when studying the phase composition of individual zones with layers of only copper and only steel, it was always possible to detect X-ray reflexes of all three phases. Weak X-ray reflexes of the γ—Fe and δ—Fe could be seen in the zone of copper layers, and weak copper X-ray reflexes were found in the zone of steel layers (Figure 4a).
Analysis of the microstructure of the grown sample “steel-copper” shows the absence of defects and cracks. Curvilinear interface between the steel and copper layers are formed (Figure 4b–e). Interfacial interaction occurs in both copper and iron parts, which leads to mutual mixing and penetration of copper (light areas) into steel (dark areas) and steel into copper (Figure 4b–e). This results in a curvilinear interface between the first steel layer and the already deposited copper layers. During the deposition of the top layer, it is limited by the much colder bottom layer, causing elastic compressive deformation. However, at elevated temperatures, the yield strength of the upper layer decreases, which allows it to be plastically compressed. Cooling the now plastically compressed top layer causes it to shrink, causing a bending angle with respect to the direction of application of the layer. This results in tensile stress in the growth direction. The boundary of the first layer of copper and the last layer of steel is similar to a mechanical mixture of these materials. The material was distributed as steel particles on the copper layer shown in Figure 4b,e. During the deposition of the second and subsequent layers, the impact with subsequent melting of the steel layers, the volume fraction of steel in the copper layers decreased. the boundary zone is present in all samples and its size is within 300–700 μm. It should be noted that this area is without visible defects, therefore a high-quality metallurgical bond is formed between steel and copper. Cu particles with an average size of 5 μm are formed (Figure 4d). This is due to convective motion in a liquid medium, which plays a decisive role in the transfer of heat and mass of materials [27]. Marangoni convection was the main driving force behind the flow in the molten bath. According to [28], it was the high power of the beam electron beam that led to a high temperature and caused a sharp decrease in dynamic viscosity, which led to an intensification of the Marangoni flow in the melt pool. This melts a small amount of the previously applied hardened stainless steel layer and forms a small mechanical mixture zone. And behind this area, only copper and steel areas are formed (Figure 4c).
Fe particles with an average size of 10 µm are formed in the copper matrix (Figure 4b–e). It can be seen that there are two regions in the zone of interfaces between the copper and steel layers, which differ in structure, but are equally compositional: these are (i) the regions enriched in copper with steel inclusions, and (ii) the regions enriched in steel with copper inclusions. Analysis of the boundary of the steel-copper polymetallic sample showed that iron inclusions of arbitrary shape are formed in the copper region (Figure 4e), as well as copper particles are formed in the iron matrix (Figure 4d).

3.2. Tensile Tests

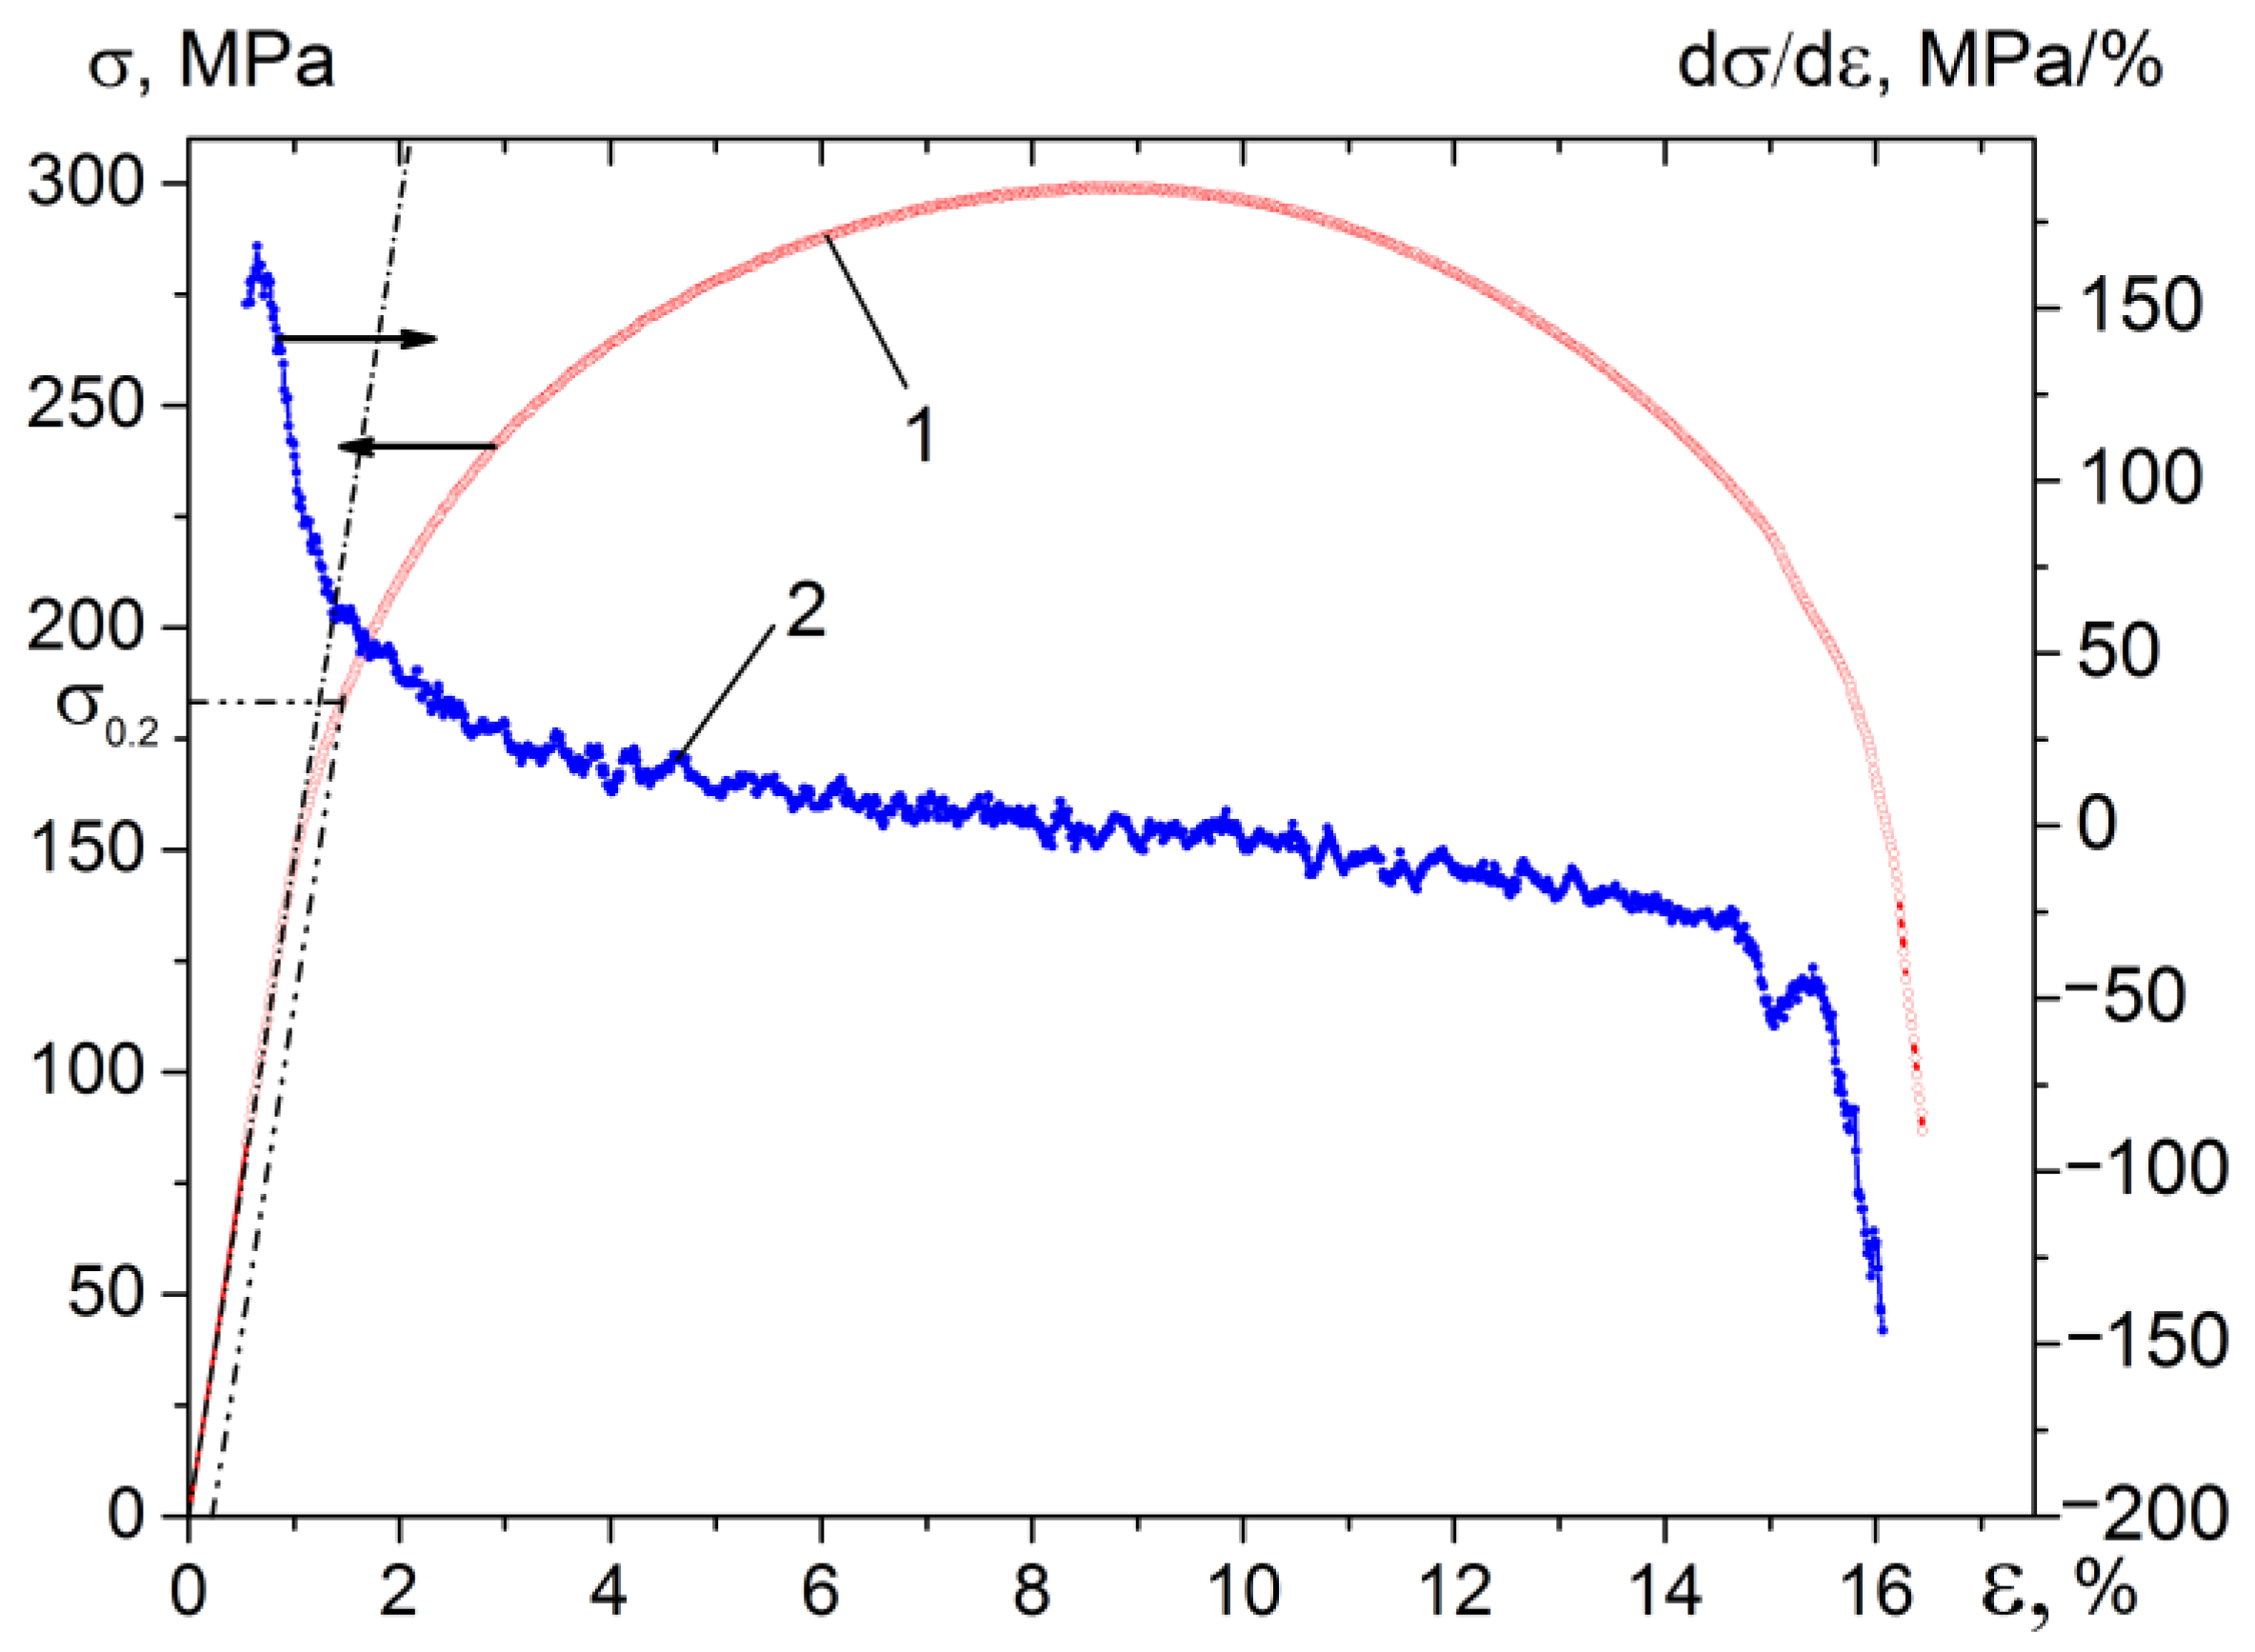
Figure 5 gives the “stress-strain” curve for polymetallic sample of the “copper-steel” system from which the procedures for calculating the localization of deformation by the DIC method were carried out, presented in Section 3.3. It can be seen from the curve that the ultimate tensile strength (UTS) of the “copper- steel” system is 299 MPa, elastic limit σE = 150 MPa, yield strength σ 0.2 = 183   MPa , the relative elongation is 15.4%. In [29] was studied the mechanical properties of SS 321 steel and C11000 copper samples produced by the wire-feed electron-beam additive technology. The yield strength of SS 321 produced by the wire-feed electron-beam technology additive is 275 MPa and the UTS is 560 MPa. The relative elongation is on average 86%. The yield strength of C11000 produced by the wire-feed electron-beam technology additive is 150 MPa and the UTS is 225 MPa. The relative elongation is on average 54%. In other words, the obtained “copper-steel” sample had higher values of the UTS and yield strength compared to C11000 copper samples with a lower value of the relative elongation.
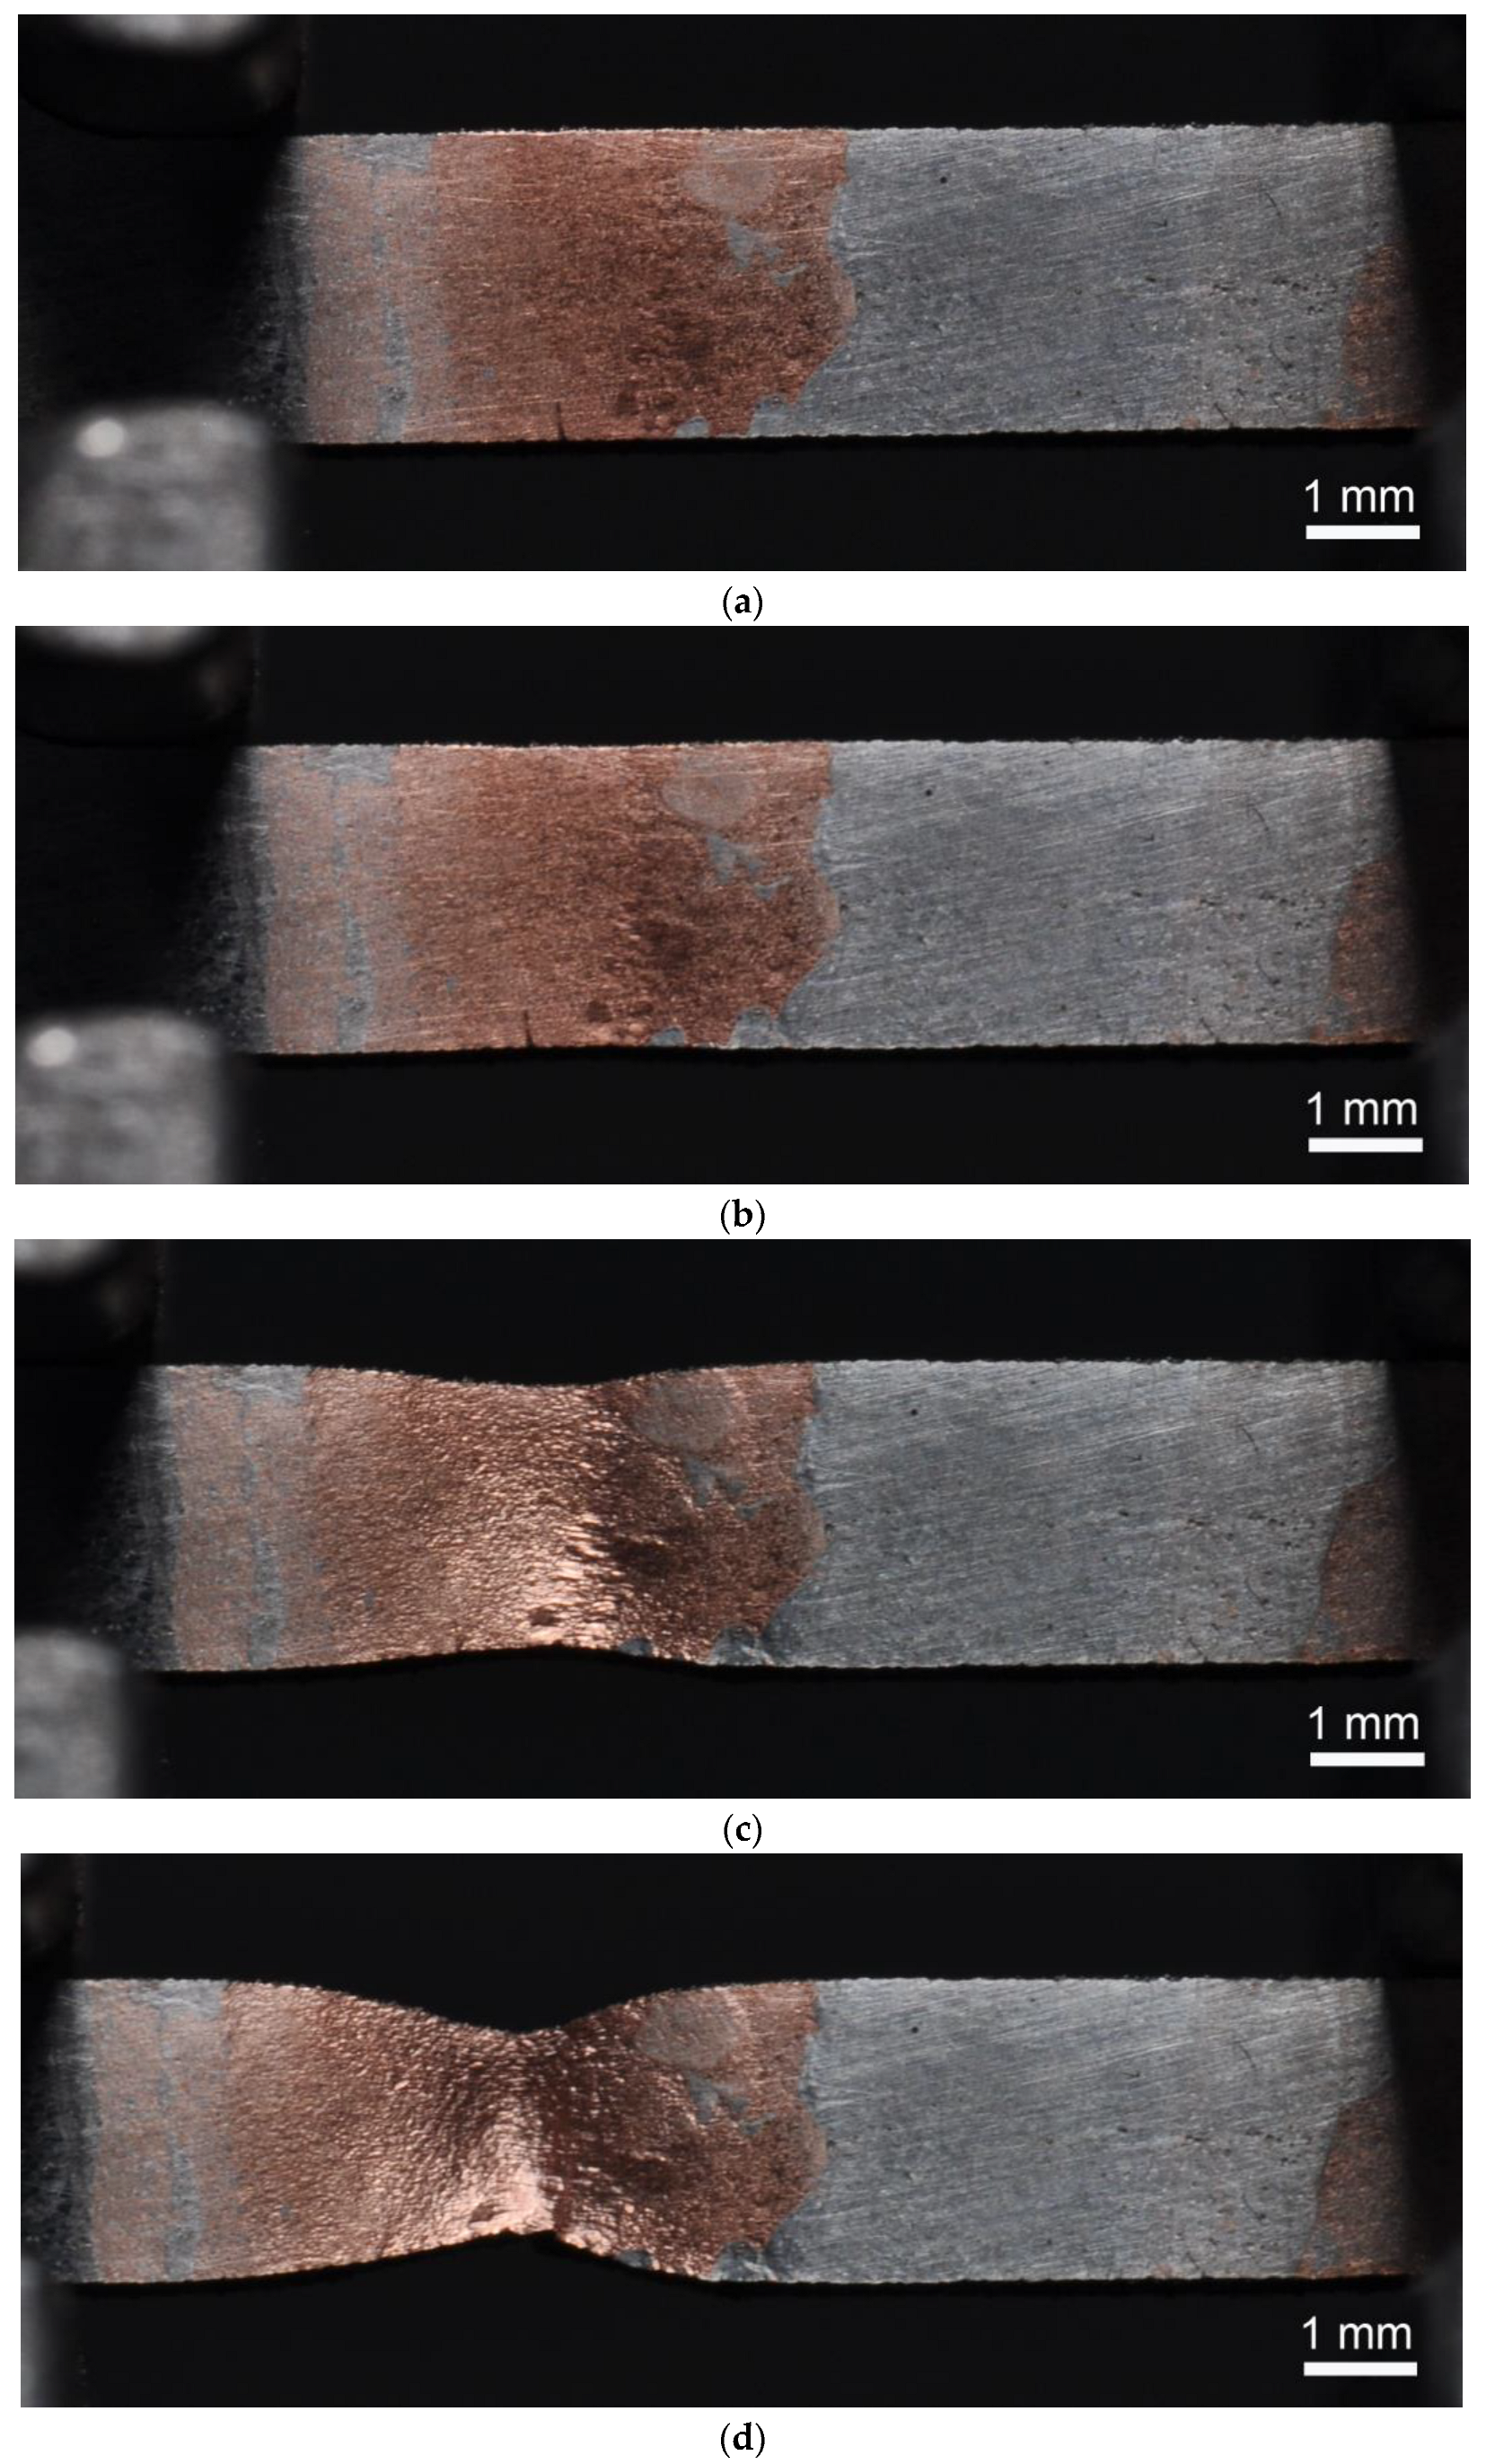
Figure 6 shows selective macrophotographs, obtained during the tensile process at different strain values.

3.3. Digital Image Correlation

In this work, the behavior of a “copper-steel” specimen in a mechanical uniaxial static tensile test is divided into several stages: the running-in stage (zero stage), the stage of formation and development of a stable neck (first stage), the stage of unstable neck development (second stage), the stage of cracks (third stage). Here zero stage is related to specimen movement to adjust to the applied force. This is technical stage it is not closely connected with the mechanisms of the joint fracture.
Each stage corresponds to the deformation area of the sample. The evolution of two necks, crack initiation and lines of localized deformation are investigated by DIC. Further, the paper will describe a sequential description of each stage of the destruction of the polymetallic sample, interpretation of the data obtained and analysis of localized deformations occurring in the copper and steel components.

3.3.1. Run-in Stage ( 0 < ε 0.02 ) (Zero Stage)

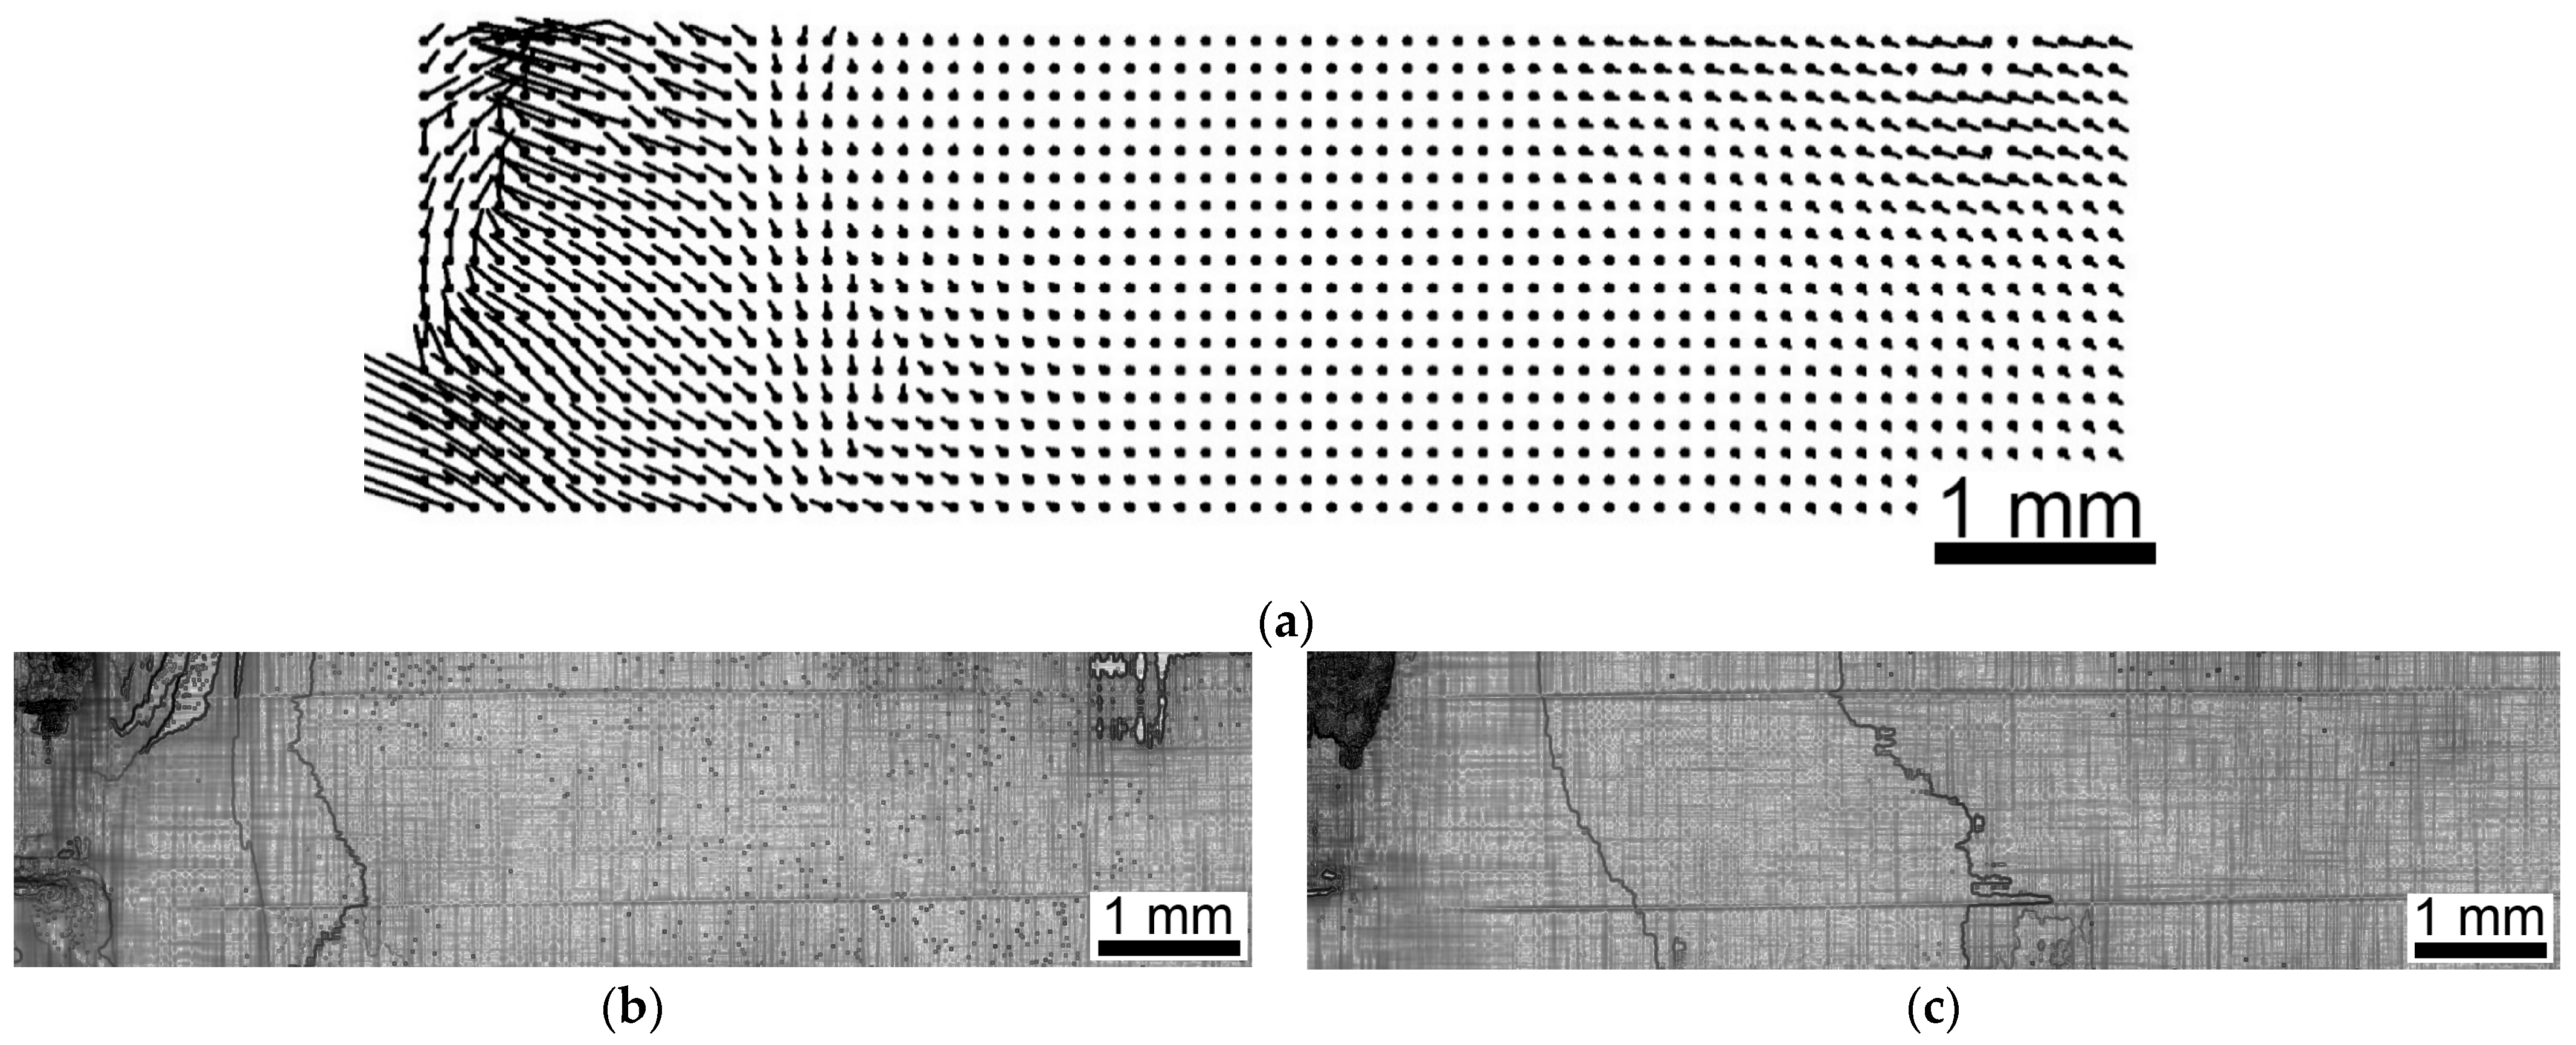
Irreversible deformation begins when the elastic limit is exceeded, and when it is reached, the ε 2 % sample has already adjusted to the conditions of external influence. It can be seen (Figure 7) that from the very beginning of loading, the main flow is observed near the left grip (Figure 7a), where the main deformation is also concentrated (Figure 7b). The flow as a whole has a shear character, which is due to the loading conditions (uniaxial tension). In the middle part of the sample, where the copper layer is located, it almost does not manifest itself (Figure 7c).
The amplitude of the longitudinal displacements varies within only two pixels (Figure 7d), however, the displacement field calculation program has subpixel accuracy, which makes it possible to study the processes of deformation and fracture. Despite static tension, the longitudinal strain near the left grip ( ε x ) has negative values and can reach 1% or more (Figure 7d). In the future, the test material itself begins to work, although at some moments around the grips, the deformation may exceed the average values.
Some lines (Figure 7b,c), registered at the “copper−steel” boundaries, are the lines of rill fluidity (RF) [25]. They have a complex shape (trajectory) and can cross the entire sample in height. Such lines are usually observed in regions with relatively weak deformation rate, where they play an accommodative role. Damage to the crystal structure over time can manifest itself as such at the mesoscale level.

3.3.2. Stage of Formation and Development of a Stable Neck (First Stage)

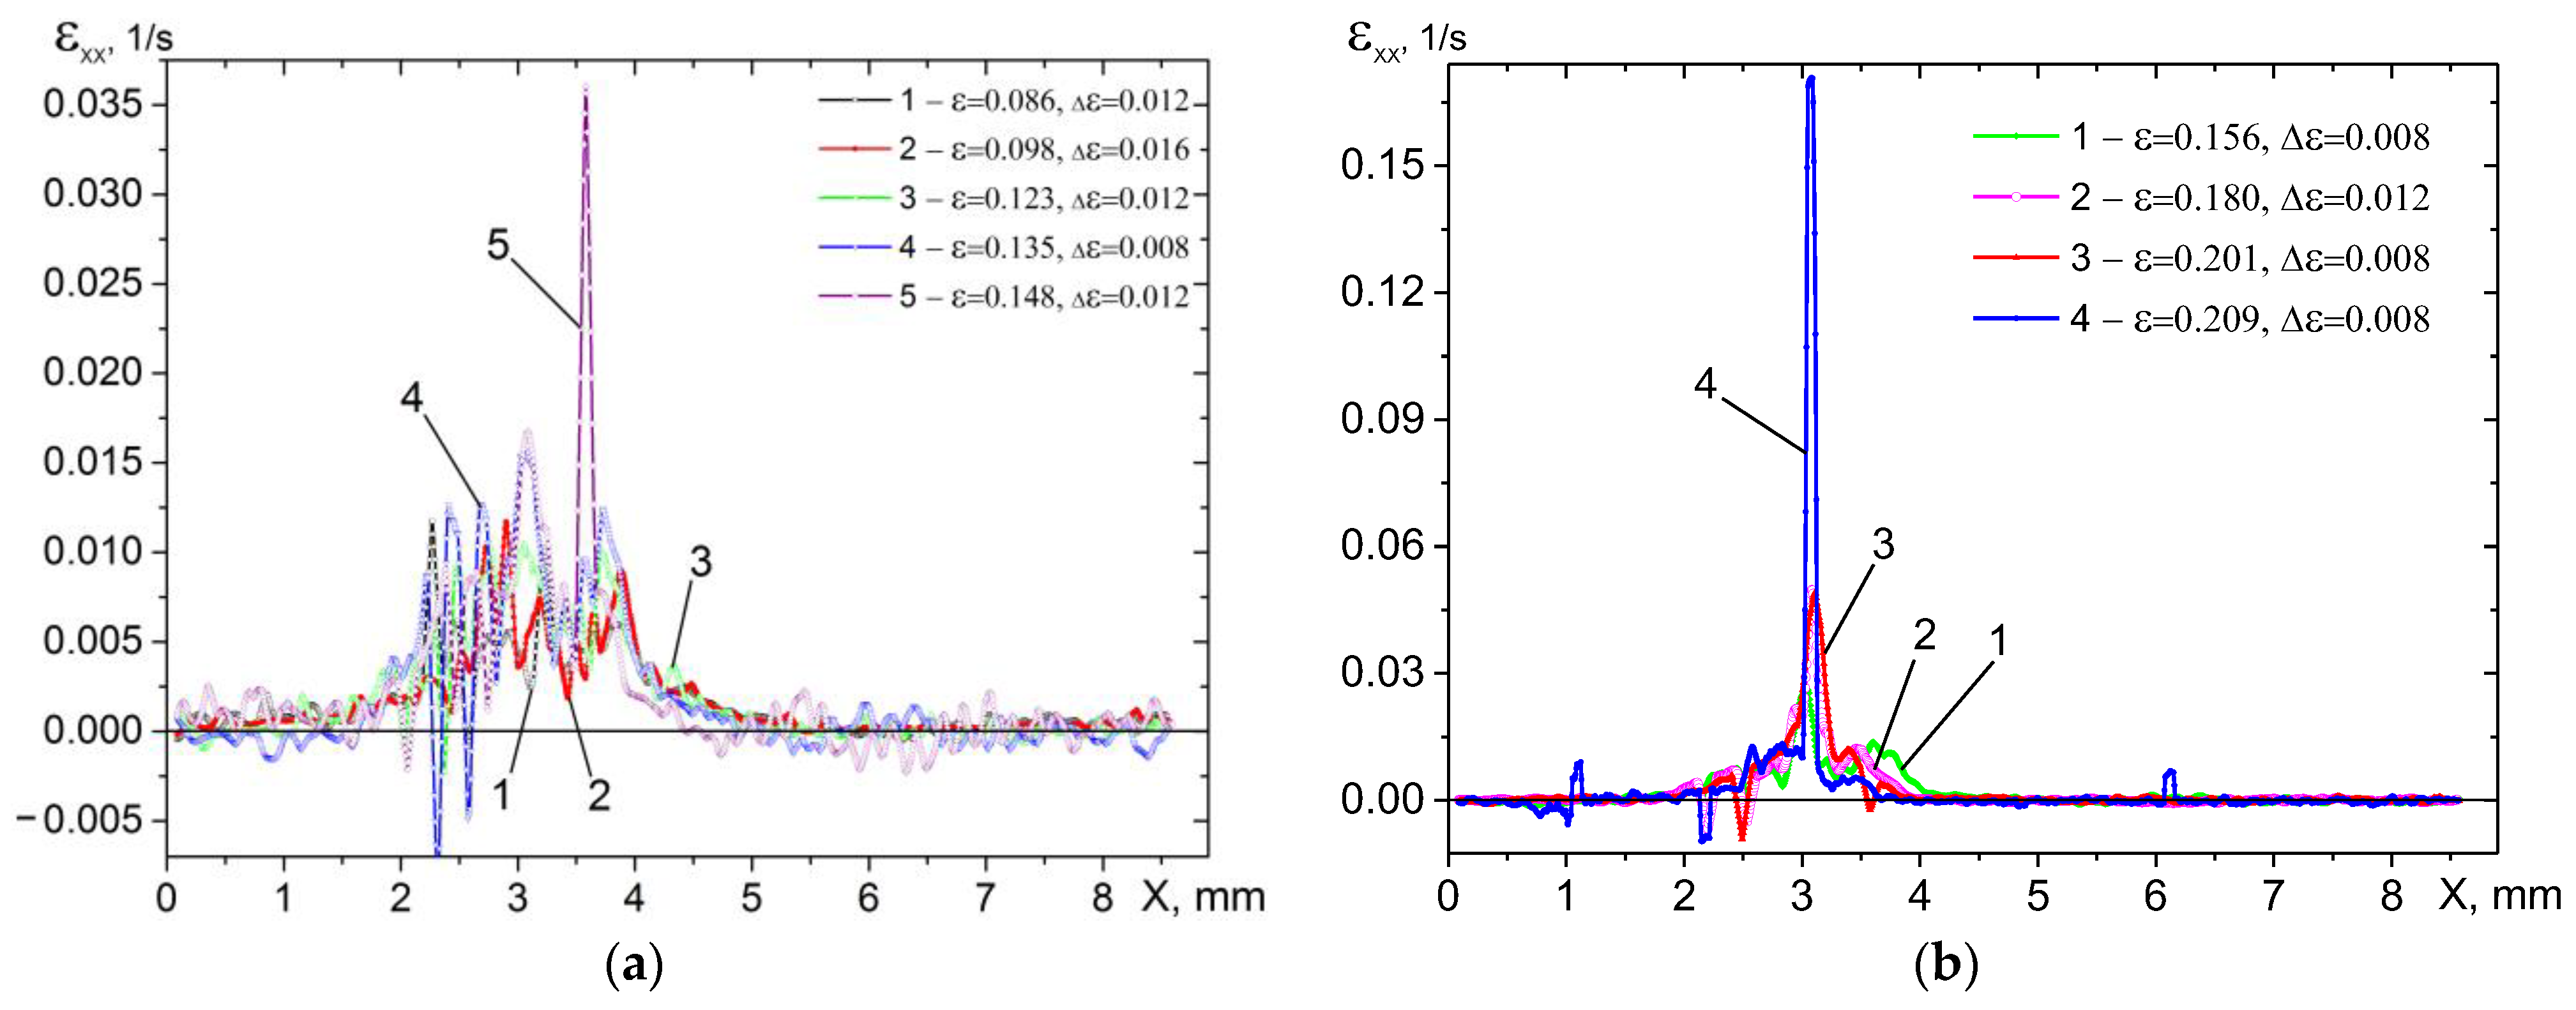
At the beginning of the first stage ( 0.02 < ε 0.08 ), local deformation ε x x ( x ,   ε ) develops predominantly in the region of the copper layer with coordinates 1.5 x 5.5 mm, where its maximum values are at the level of gradually increasing within 0.002 ε x x 0.0061 /s. Local deformation has a spatially inhomogeneous character, which is due to local hardening processes that develop as fronts of localized plastic flow (Figure 8a). In steel, it can take negative values at all stages of the flow, which is due to the action of residual compressive stresses. In addition, obviously, due to the layered nature of the formation of the structure, in some areas the flow has an abrupt character (Figure 8b). In areas with an abrupt nature of the flow, the velocity of longitudinal displacements changes abruptly within 0.2–1 μm/s when moving to a neighboring point even at T = 1 .
When calculating the deformation components along the median line y = y m / 2 , the dependencies u x ( x ,   y = y m / 2 ) were smoothed over 13 points using adjacent-averaging algorithm, then numerical differentiation was applied to the data and smoothing was repeated again. The smoothing conditions determine the final values of the local deformation in the case of an abrupt change in the displacement amplitude. The scatter of the curves in Figure 8b is explained by different values of the constant vector which contains each vector field.
The picture of deformation development becomes clearer if we consider the evolution of deformation structures.
Our experience is shown that initiation and development of a neck in metals are accompanied with fine lines of local shears at some moment. These fine lines, probably, are not shears bands which are a dynamic recrystallization as a result of shear banding in metallic materials [30]. “Shear lines” of a neck have the next properties: (i) they have V-shape appearance; (ii) their lines are approximately normal to their displacement vectors; (iii) their initiation is referred to the strain increasing of some threshold and they cover all specimen; (iv) their quantity increase at the next increasing the strain; (v) if the amplitudes of neck shears are different, then the shear lines form would be assymetrical too; (vi) shear lines are usually not visible on optical images, but are visible on pseudoimages (deformation structures); (vii) The appearance of new shear lines correlates with the appearance of peaks in the strain hardening curve.
From the very beginning of loading, separate shear lines are observed (Figure 9a) at the boundaries of the structures and in the grip area. There are more and more of these lines (Figure 9b), but in the copper region these are shear lines, and in the steel region these lines are RF lines. Then a neck appears in the copper region (Figure 9c). It is accompanied by the development of shear lines having a V-shape. A flow of this type is recorded if two shifts in conjugate directions of maximum shear stresses occur over a certain period of time [24].
The darkening of the background on the pseudo images indicates an increase in the average strain in the neck region. The number of shear lines increases, and they begin to cover the region not only of copper, but also of steel (Figure 9d). At this stage, the shear lines do not yet intersect with the rill flow lines.

3.3.3. Stage of Unstable Neck Development (Second Stage)

At the beginning of the second stage ( 0.08 < ε 0.15 ), the shear lines cover an ever larger area (Figure 10a). They go far into the steel region, where they can pass into the RF lines (Figure 10b,c). Starting from deformation ε = 11 % , transverse shear lines begin to play an increasingly important role and a block structure is formed (Figure 10c). The flow becomes more and more localized, where the density of transverse shears increases. This leads to the formation of an increasing number of blocks, the size of which is rapidly decreasing. By the end of this stage, the strain accumulated over Δ ε = 0.02 , shows the formation of main crack (Figure 10d).
It can be seen that at this stage, the size of the region covered by the flow gradually decreases to 3.5–4.0 mm, which is due to the hardening of the material at the ″copper–steel″ interface. The strain rate varies within 0.003–0.015 1/s and reaches 0.035 1/s in the region of the formed crack (Figure 11a,b). Due to the smoothing procedure, the size of the localization area is overestimated, and the limit values of the deformation are underestimated.

3.3.4. Crack Stage (Third Stage)

At the last, third stage ( 0.15 < ε 0.21 ), the deformation structure, formed even in a small gap, reflects the development of a crack (Figure 12a–d). The region of localized deformation near the crack rapidly narrows. From Figure 11b it is seen that already at the beginning of the stage, the strain rate is very high ~ (0.02 ÷ 0.03) 1/s and grows rapidly. Before destruction, the local strain rate is almost equal to the total one.

3.3.5. Evolution Curves Based on Deformation

When analyzing the curves ε x x ( x , y = y m / 2 ,   ε ) , it is seen that the longitudinal deformation component varies over a wide range both in the region of localized flow and it is concentrated in copper and steel regions. Negative strain values, as it was mentioned above, are the result of residual compressive stresses, and individual significant strain jumps are due to the layered nature of the original joint. They determine the quality of the “copper-steel” join and are associated with the technological regime of the additive technique.
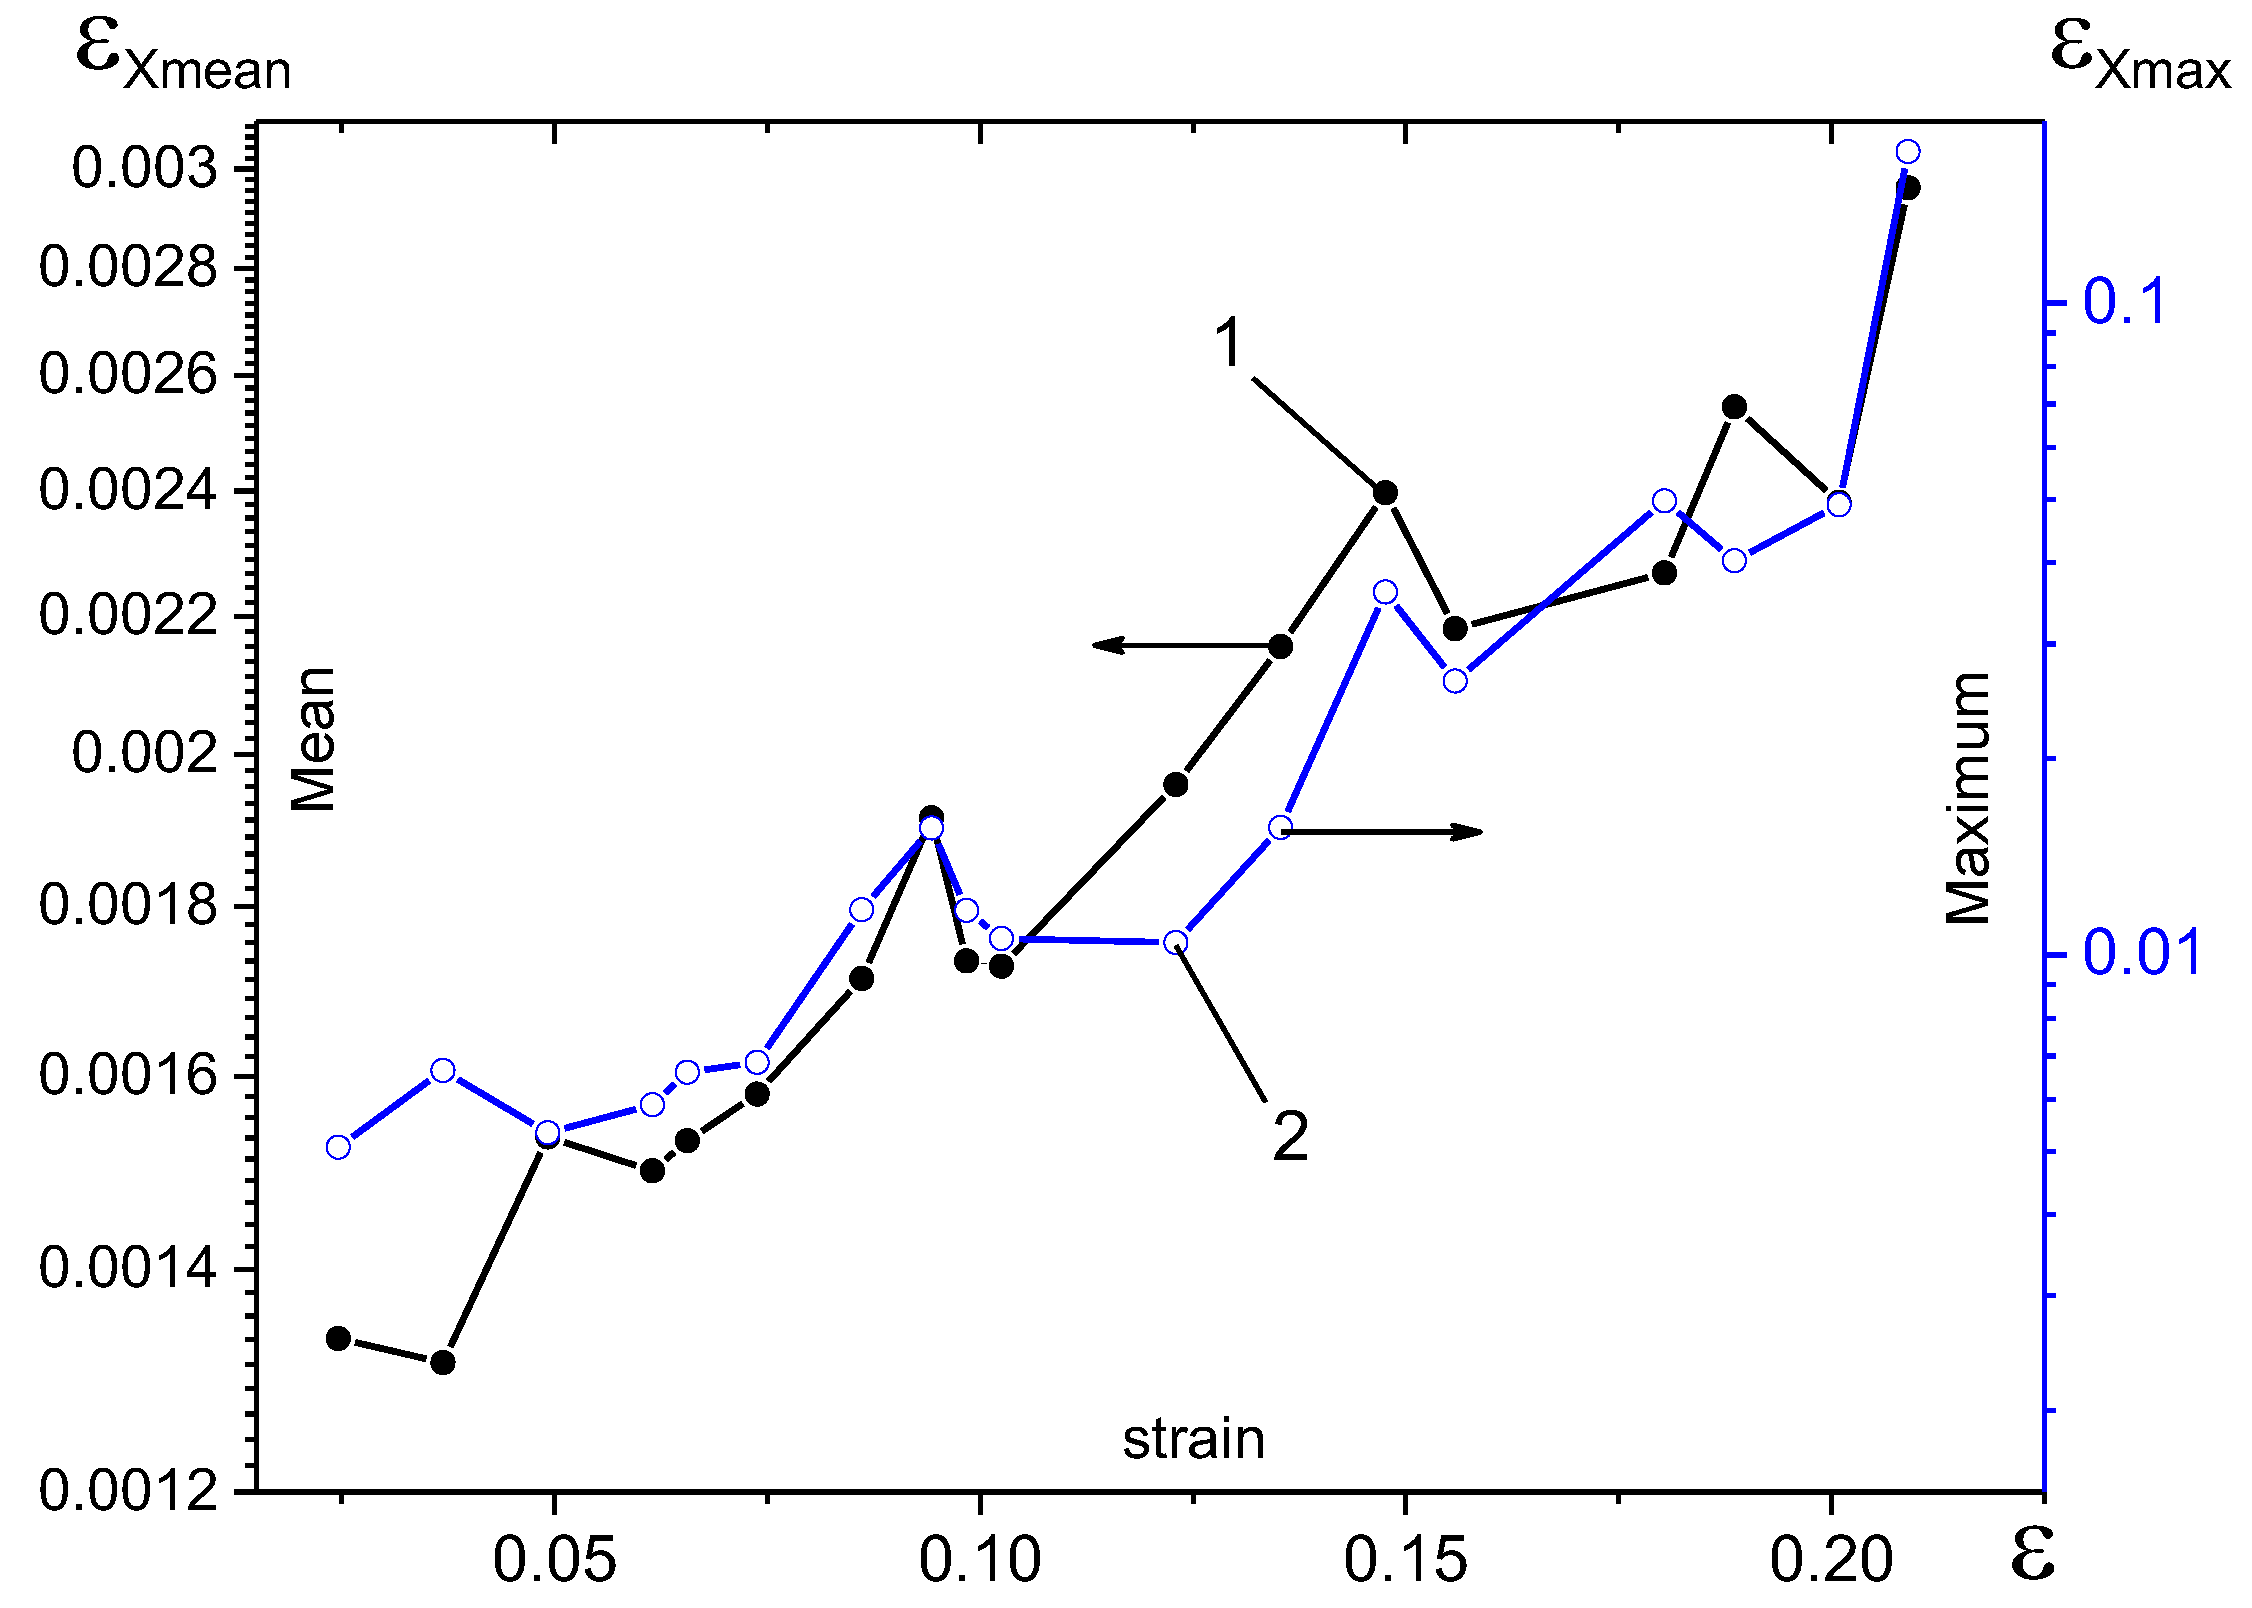
However, in this case, when studying the deformation process, negative values of longitudinal deformation, in essence, is a source of systematic error. Therefore, in order to obtain average strain characteristics at different times, we will take into account only positive strain values. This approach makes it possible to find the dependences of the average and maximum values of the longitudinal strain versus the total strain (Figure 13). On a semi-logarithmic scale, these dependencies can be approximated by straight lines, which means that over time, the average longitudinal strain and its maximum values increase exponentially.

3.3.6. Analysis of Shear Characteristics

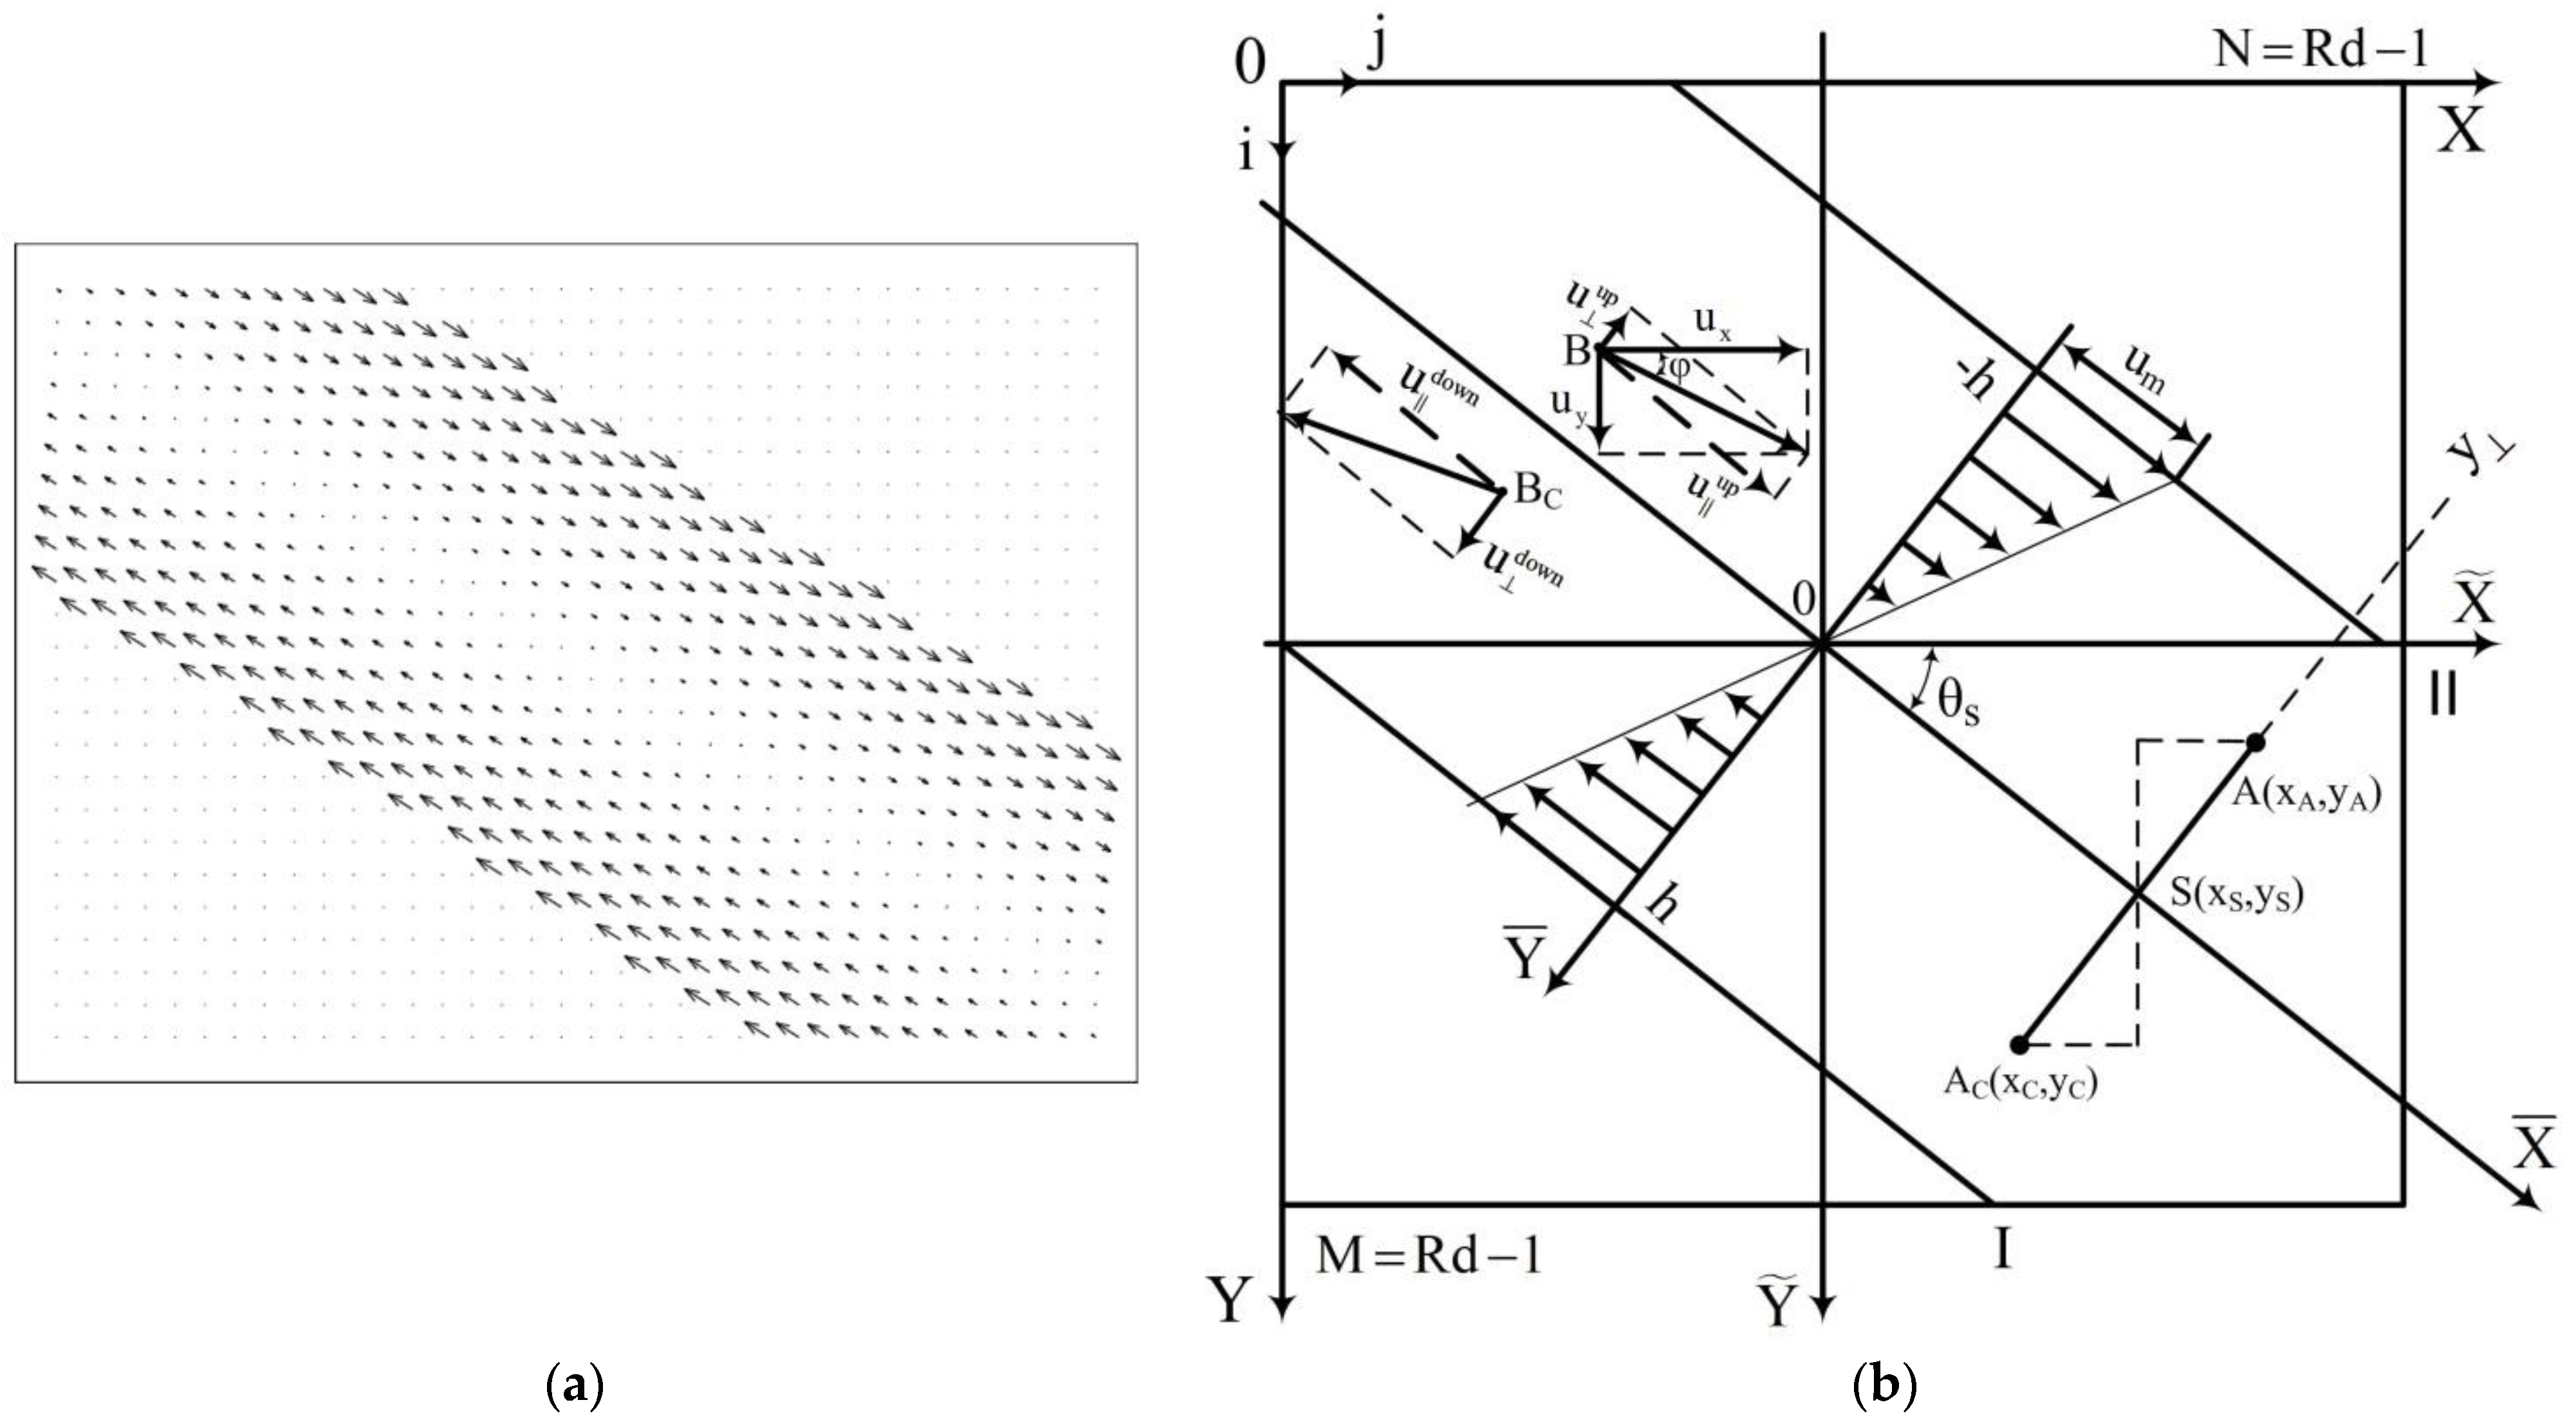
It is well known that local shears play a cardinal role in the processes of deformation and fracture of solids. Such a character of the flow in the mechanics of a deformable solid is described by the shear component εxy of deformation tensor. A vector field at simulation can be assigned with very small error which mostly defines by assumptions of a theory. However, experimental displacements are measured with some absolute error and the numerical differentiation increases this error. On the other hand, this approach does not allow to find the shear angle in the local area. The idea of new algorithm [26,31] is that the computer program numerically searches the shear angle in a local area where a shear functional is extremal. The value of the extremum functional is proportional to shear amplitude. Here, the pure shear in the area is the linear approximation of local field from the shear point. Let us apply the approach proposed in [26]. Recall how the algorithm works. The model shear field to be found and the scheme are shown in Figure 14. If a shear type of flow occurs within a block size R d × R d (Figure 10a), then functional (2) will have an extremum:
F S ( θ S ) = [ i = 0 R 1 j = 0 R 1 | u i , j ( θ S ) u C i , j ( θ S ) | | u i , j ( θ S ) u C i , j ( θ S ) | ] / n Σ ( θ S ) m a x .
Here u i , j ( u i , j ) are displacements parallel (perpendicular) to the sought line with current angle θ S , θ is a sought shear angle, n Σ ( θ S ) −number of points, belonging to the block under study. To find the angle θ (Figure 14b) it is necessary to go through all the angles θ S with a step Δ θ in the range 0 θ S π and found the value at which θ = θ S   ( F S max ) . The functional F S max is the shear amplitude u s h , averaged over the analyzed domain R d × R d .
By successively scanning the initial vector field with a block the size of R d × R d a spatial period T d , one can find the values of the amplitude u s h and the shear angle θ at each point of the field. A section of the vector field with a block size R d can be considered to be involved in two movements: shear and normal separation.
Knowing the shift angle, the unit vector in this direction can be taken as the basis. The other basis vector will be the unit vector directed along the normal to the shear vector (Figure 14). This approach allows us to decompose any displacement vector into a pure shear, where the normal component is not taken into account, and a normal rupture, where the shear component is not taken into account. Then we can consider the following functionals:
F ( θ S ) = [ i = 0 R d 1 j = 0 R d 1 | u i , j ( θ S ) u C i , j ( θ S ) | ] / n Σ ( θ S ) m a x ,
F ( θ S ) = [ i = 0 R 1 j = 0 R 1 | u i , j ( θ S ) u C i , j ( θ S ) | ] / n Σ ( θ S ) m a x ,
where F ( θ S )   ( F ( θ S ) ) is the mean amplitude of shear (rupture) at an angle θ S , averaged over the area of the block. Summation over all differences makes it possible to eliminate the constant vector of the vector field.
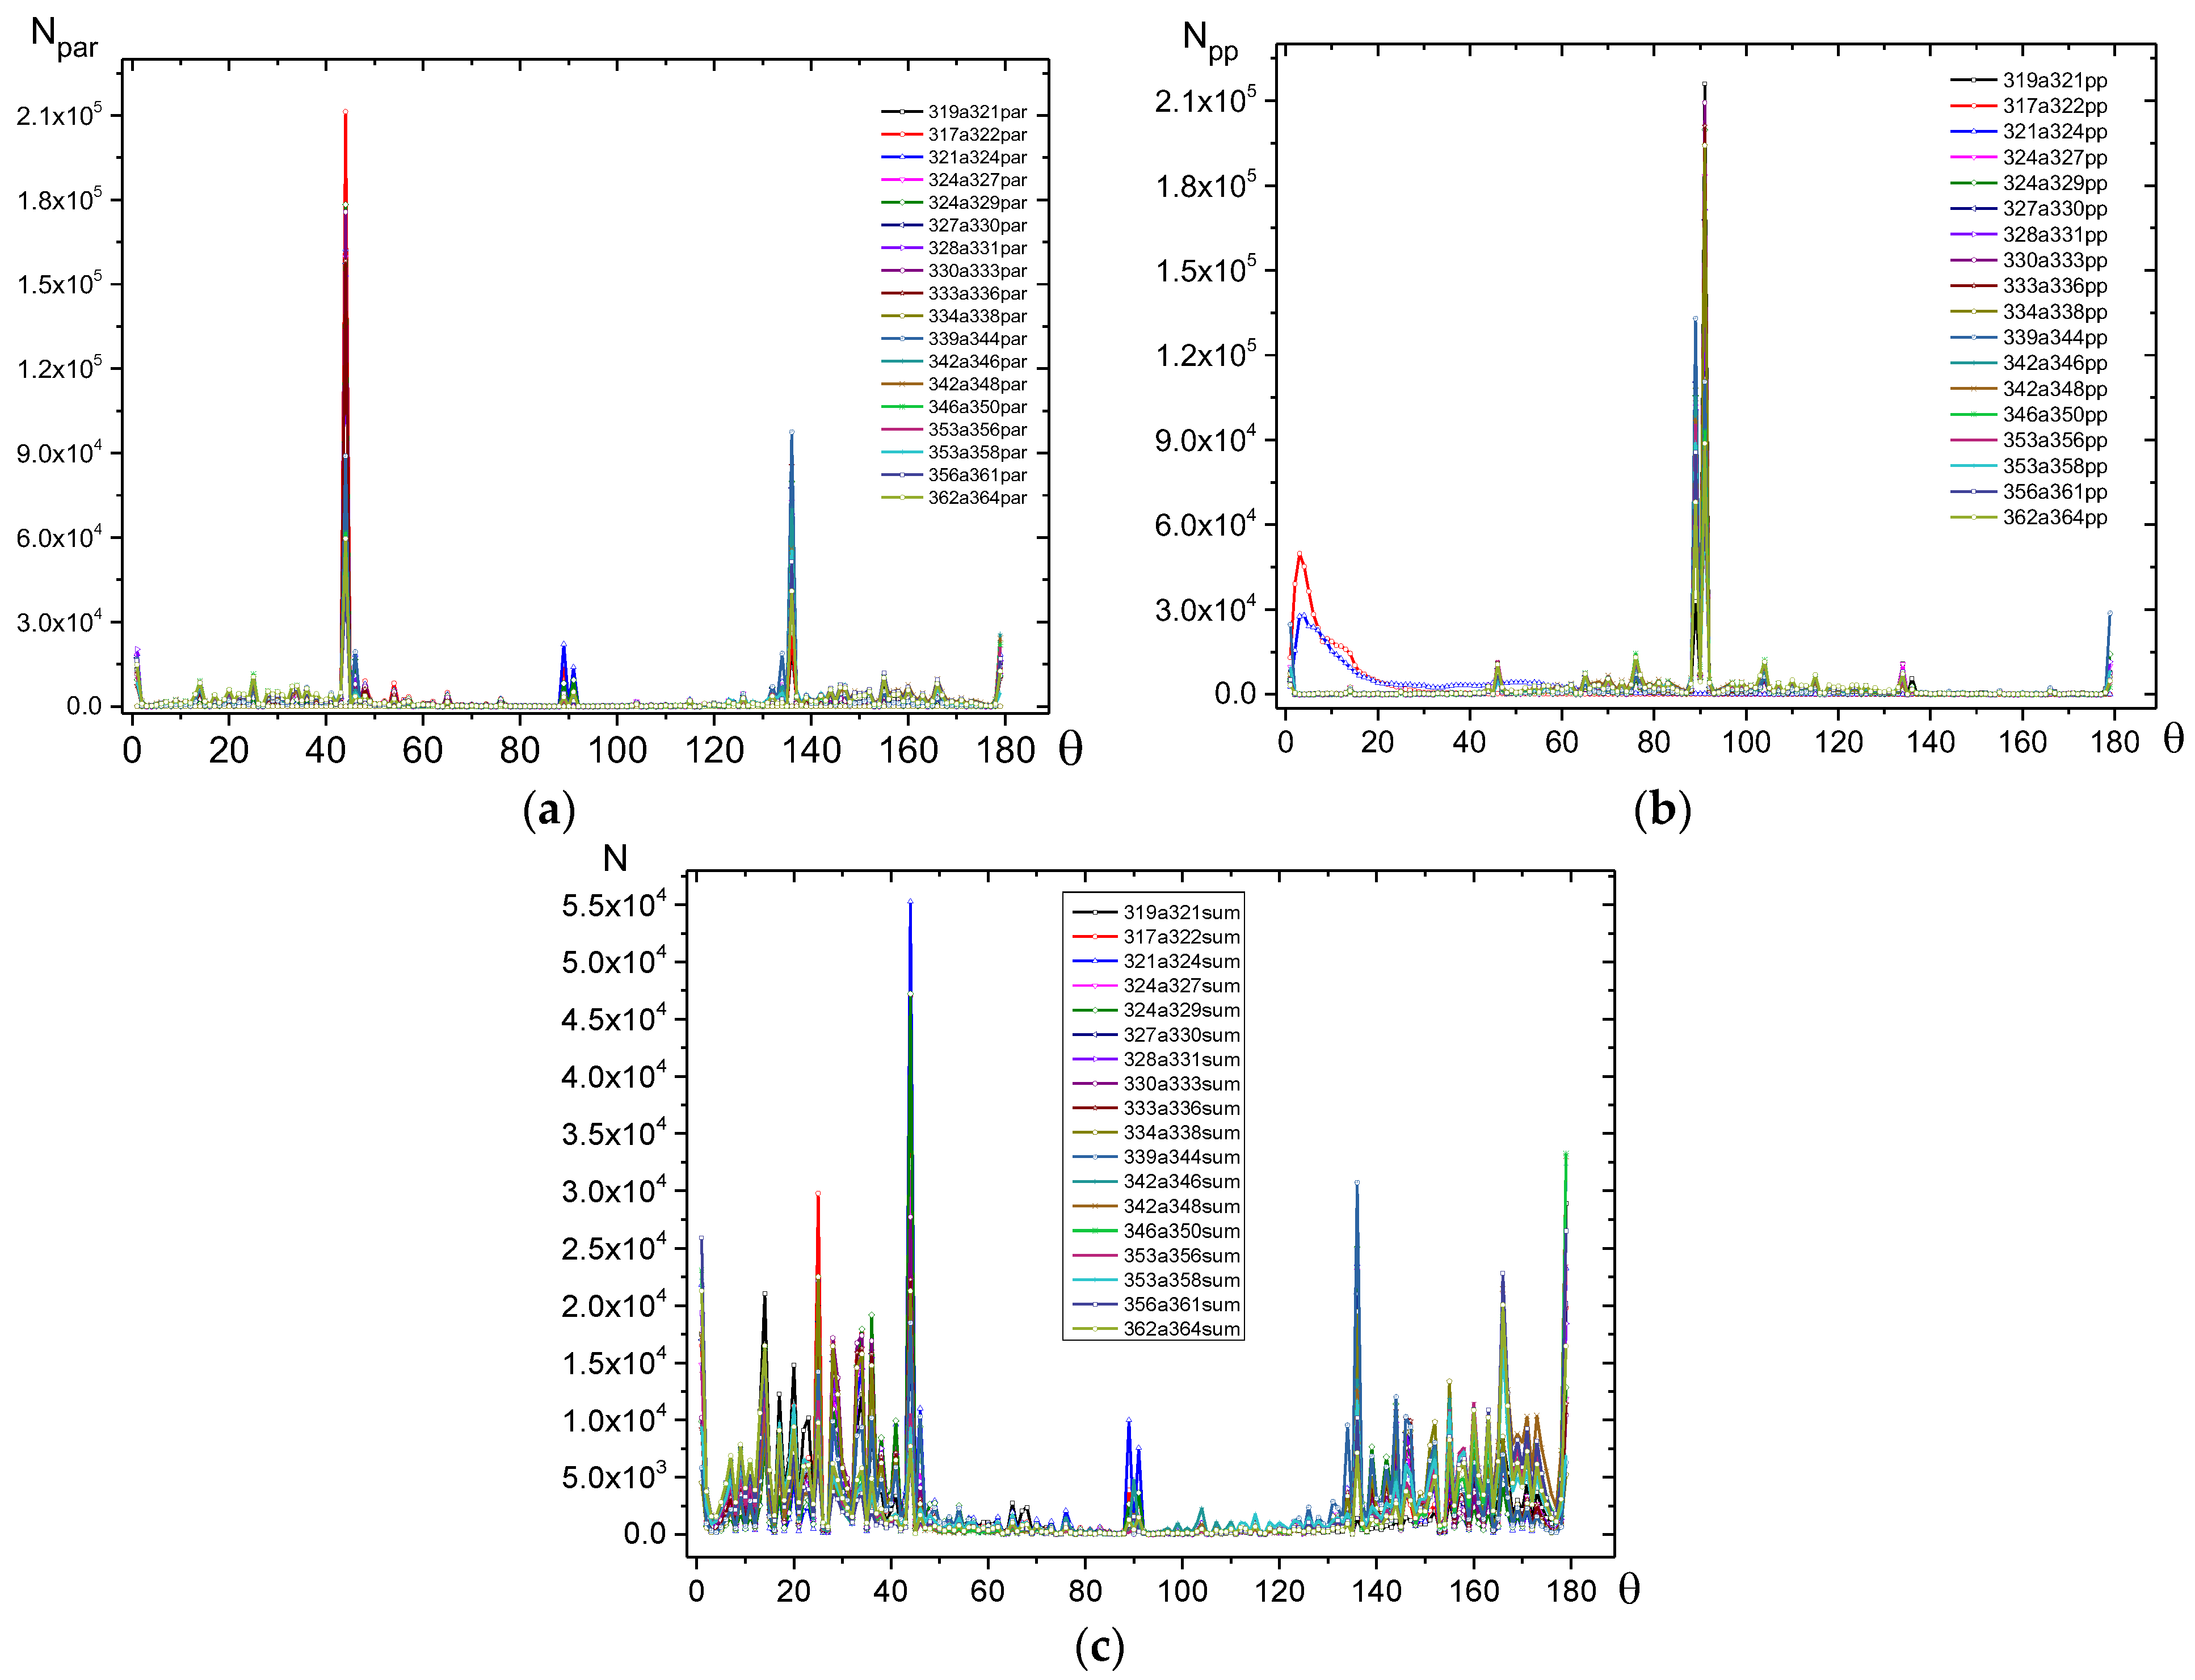
Based on the functionals (2)−(4) of a displacement fields, the spatial distributions of the amplitudes and shear angles were calculated, as well as the angular distributions for the components of pure shear, rupture and their vector sum (Figure 15). Here, in the global coordinate system, the Y-axis is pointing down, so the angles are counted in the clockwise direction. Therefore, the shear angle of 135 in the given coordinate system corresponds to the angle in 45 the classical coordinate system.
It can be seen that for pure shear (functional F ( θ S ) ) at all stages of deformation and destruction of the “copper−steel” system, the main role is played by the maximum shear stresses, which are characterized by angles ± 45 . In the coordinate system adopted in the work, where the OY axis is directed downward, they correspond to the angles 135 and 45 . It is at these angles that the greatest number of local shears is observed. In second place are the normal stresses associated with the angles 0 and 180 . Although the external force is applied in this direction, the number of separation elements is approximately an order of magnitude smaller (Figure 14a,b). Two deviations from this rule can be explained by the running-in effect, when the material near one of the fillets is actively deformed.
For the rupture functional F ( θ S ) the key is the angle 90 (Figure 15b). If functional (2) is used to identify the shear, then in addition to the above angles, a whole spectrum of additional angles will appear, lying in the range 4 < θ < 45 . This is obviously due to the interference effect, where the modulus sign is the sum of the two terms.
Amplitude and angular spatial distributions of shears will also be represented as inverse pseudoimages. The darker the local area on the amplitude distribution, the higher the shear amplitude will be. Despite the fact that the pure shear search algorithm is used to calculate the shear amplitude distributions, it can be seen (Figure 16a–c) that the spatial shear distributions is similar to the deformation structure (Figure 9c). This is due to the fact that the deformation structure takes into account all possible deformation components (see (1)), where the lines of localized deformation are predominantly shear lines.
The amplitude of rupture component (Figure 16b) is higher than the shear component (Figure 16a), which reflects its leading role, where the shear plays the role of an accommodative component. The spatial distributions of the angles show that the flow is inhomogeneous.
In the total spatial distribution of angles, you can select different conjugate angles and build their pseudo images (Figure 17). It can be seen (Figure 17b) that a band stands out where the orientation of the corners approximately retains its direction. From Figure 17a, it follows that the discontinuity of a powerful current with an inclination to the right is due to the fact that two shears took place over a given period of time—one stronger with a right inclination, and then the second, less active, with a left inclination.

3.3.7. Evolution Curves Based on Average Strain in the Areas of Interest

When evaluating the current mechanical state of the additive compound based on the deformation component ε x x ( x , y = y m / 2 ,   ε ) , its positive values, taken over the entire area of interest, were taken into account. Since the compound itself is very heterogeneous in composition and properties, it would be more correct to choose the most informative regions of (1) copper and (2) steel.
For this purpose, images of regions of interest for copper and steel were prepared, and displacement fields were calculated at different points in time with a relatively small time interval between frames. We will assume that, in this case, the deformation is approximately uniform in each of these regions. Such approach makes it possible to approximate the displacement components by planes:
u x a ( x , y ) = a x x + b x y + u x 0 ,   u y a ( x , y ) = a y x + b y y + u y 0
where a x ,   a y ,   b x ,   b y , u x 0 ,   u y 0 are constants, determined from experiment by the least squares method, u x a ( x , y ) and u y a ( x , y ) are approximated values of the vector components.
The average strain rate γ n , taking into account (5), can be found from the relationships as cardinal plastic shear:
γ = ( ε x x ε y y ) 2 + 4 ε x y 2 = ( a x b y ) 2 + ( b x + a y ) 2 ,   γ n = γ / Δ t
Here ε x x , ε y y , ε x y −deformation components, γ −cardinal plastic shear, Δ t is a span between two frames.
The deviation of displacements from the approximation plane can be estimated using the standard deviation (SD):
σ = D x + D y / M N ,   σ n = σ / Δ t , D x = i = 1 M j = 1 N ( ( u x a ) i , j ( u x ) i , j ) 2 ,   D y = i = 1 M j = 1 N ( ( u y a ) i , j ( u y ) i , j ) 2
where M ( N ) is the number of rows (columns) of arrays u x ( x , y ) , u y ( x , y ) , represented in digital form. The displacements standard deviation (SD) σ , normalized on the number of field dimensions, shows the specific deviation of displacement components from the related approximation plane. It allows to estimate the total variance, that is an important characteristic which also makes it possible to evaluate the main fracture stages.
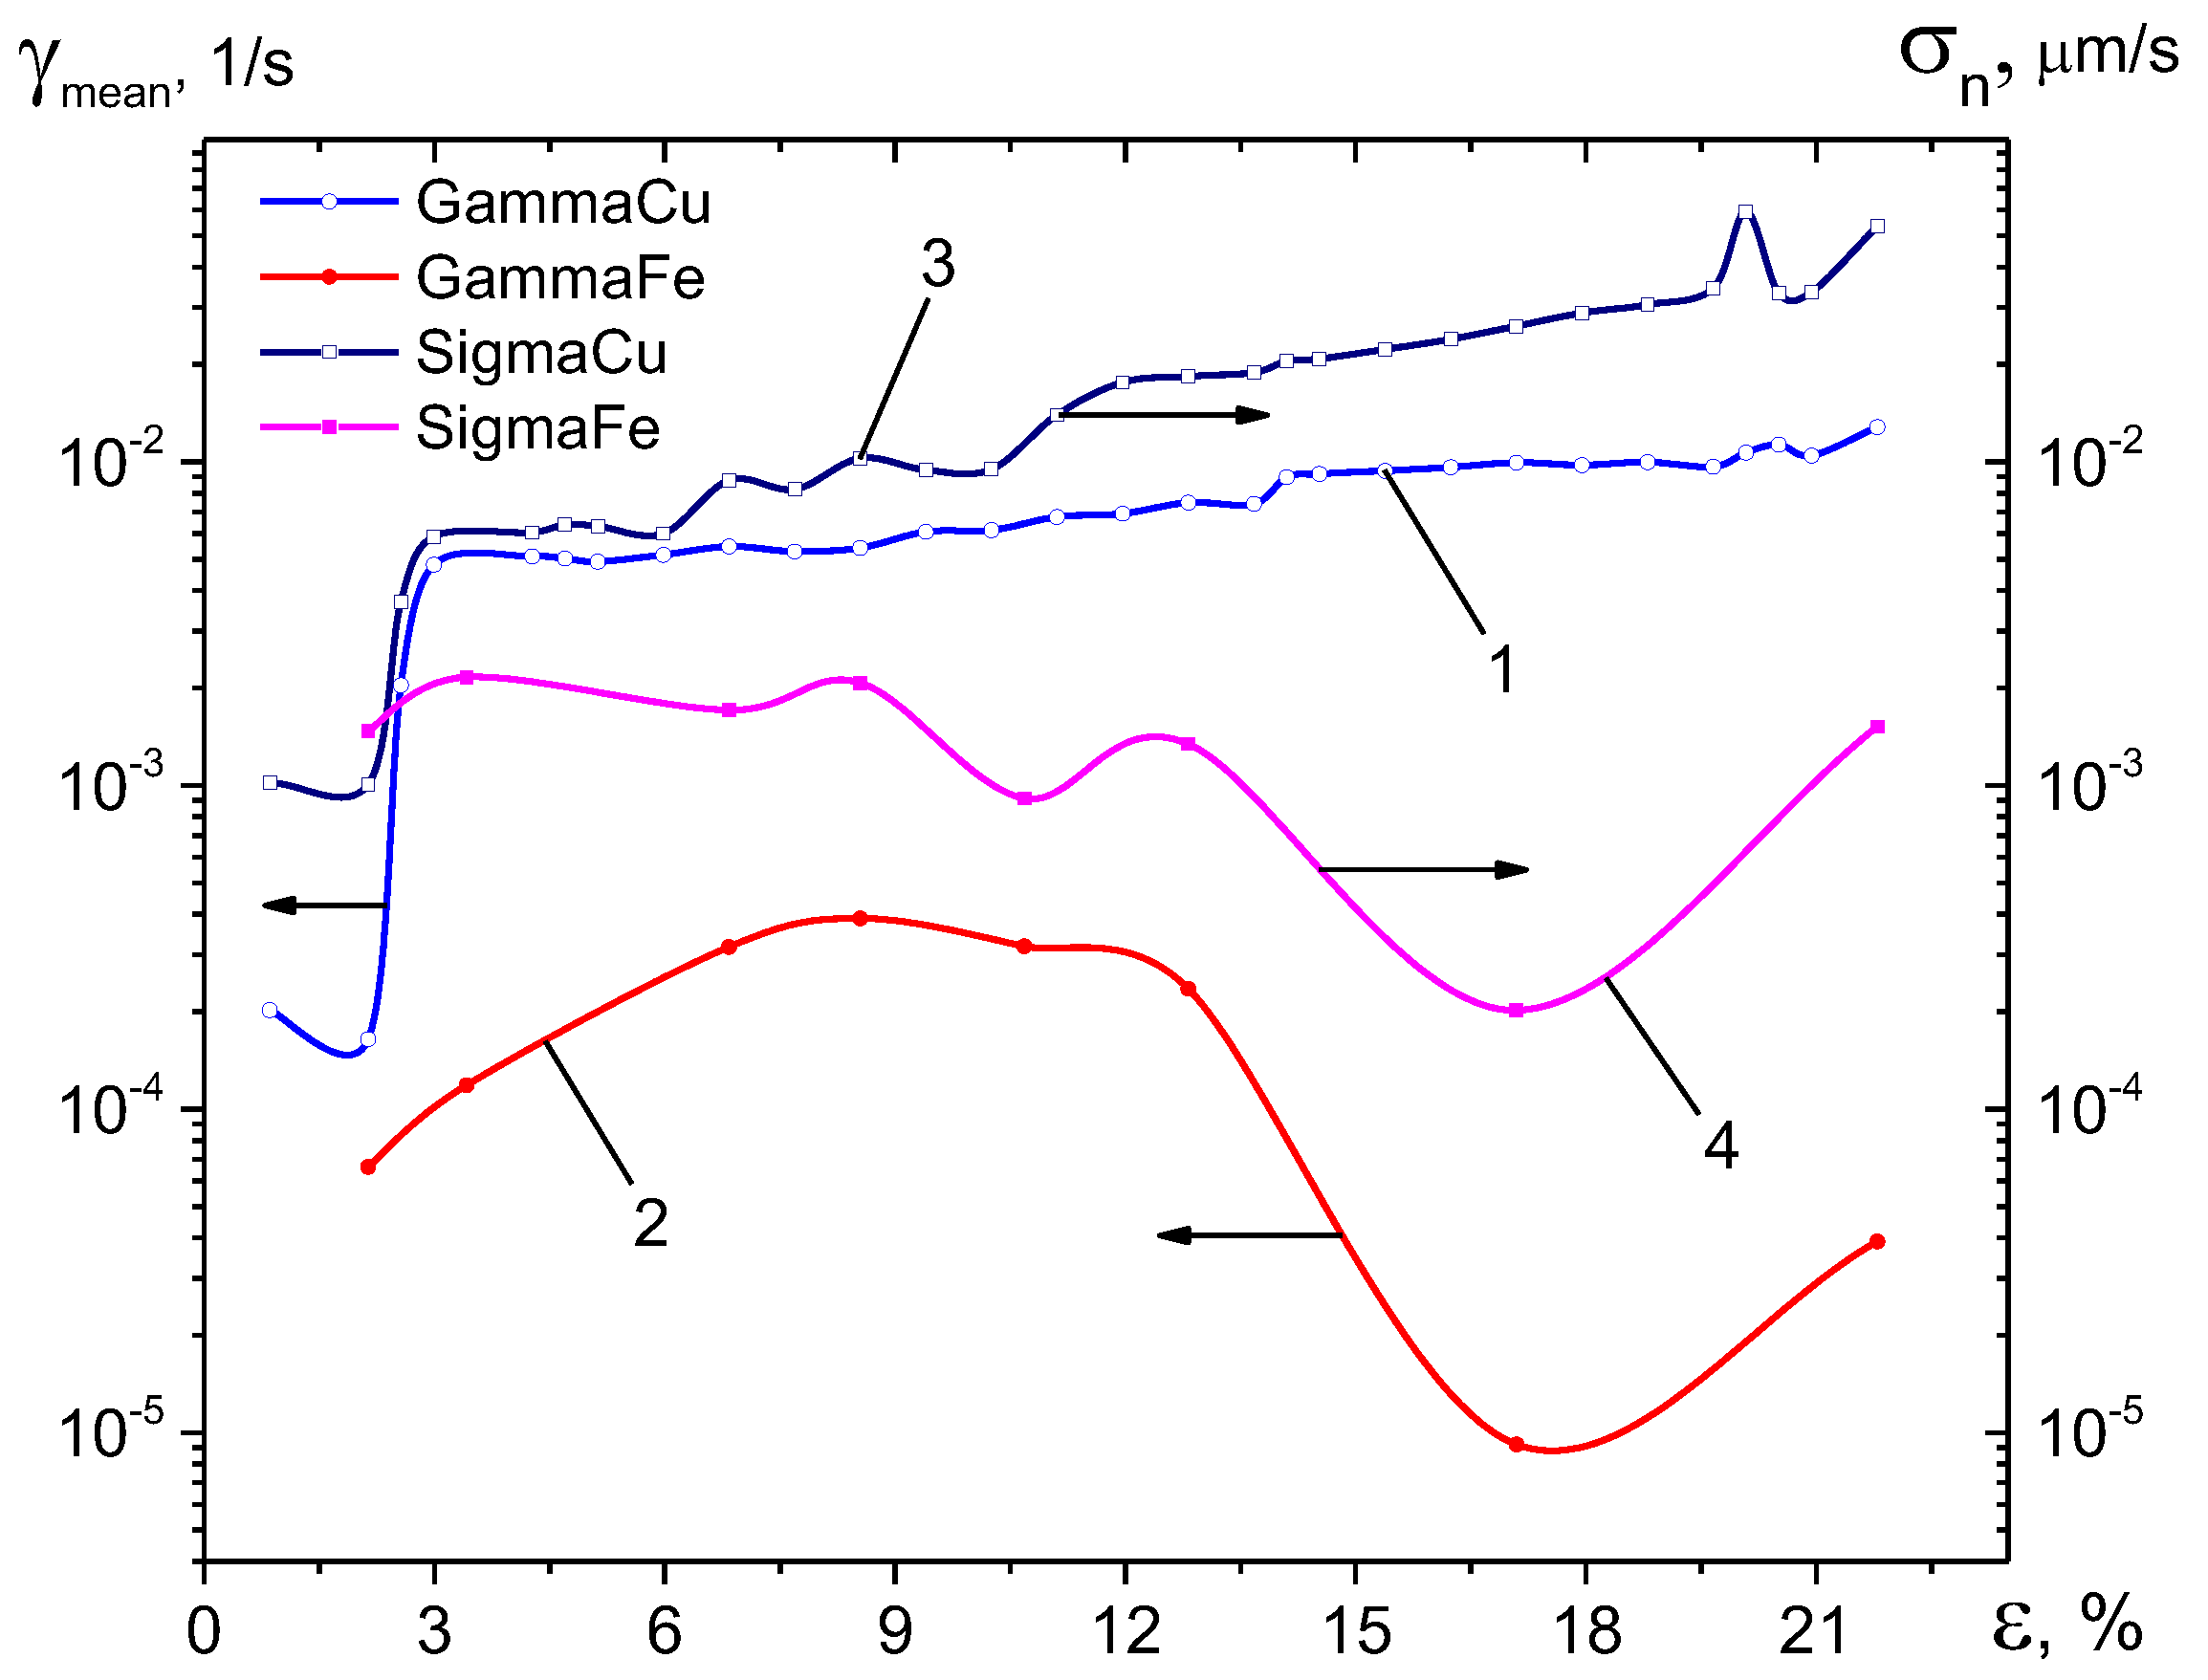
Figure 18 shows the dependences of the average strain rate and SD in the necking regions for copper and steel. To obtain these curves, the displacement fields with a spatial period were first calculated at T = 1 for different time points and then the values of the average strain rate and the standard deviation of the displacements were found. For iron, the number of points is less, since the strain rate was very low, and therefore it was necessary to increase the time interval between frames in order to achieve an acceptable error. The measurement data were approximated using the modified Bezier algorithm.
It is seen that the deformation rate of copper is 2–3 orders of magnitude higher than that of steel, since copper has a significantly higher ductility. From the moment the sample enters the loading mode ( ε > 2 % ), the strain rate is 5 × 10 3 1/s, it increases exponentially and reaches the value 10 × 10 3 1/s by the moment of failure.
At 3 % ε < 8 % , steel still competes with copper, where the strain also increases exponentially. In the range 8 % ε < 13 % , the strain rate in steel remains approximately constant, while at ε > 13 % it decreases by an order of magnitude. The decrease in the strain rate in steel coincides with the moment when cracks appear during deformation (Figure 10c,d) and is apparently due to relaxation processes during fracture. In this case, the material behaves as if it works under conditions of high-cycle fatigue, and not under static tension. In it, a uniform flow is recorded in the neck area, which is usually accompanied by individual narrow lines resembling mode I + II cracks (Figure 19). These lines are, as a rule, rill lines. The flow in steel has a jump-like character in time.
The standard deviation for displacements in copper has a character similar to that of deformation. This is due to the fact that the deformation becomes more and more localized, and therefore less homogeneous in the neck area. At a fixed size of the region of interest, the plane approximation becomes less and less accurate, which leads to an increase in the standard deviation.
For steel, this approach does not work. In the region of neck development in steel, the deformation generally retains its uniformity. At certain moments of time, when the flow is small, the standard deviation of the displacements can decrease significantly, but not so much as a result of a very uniform flow, but due to the small amplitude of the displacements themselves.

3.4. Study of the Structure and Elemental Composition of Samples after Tensile Tests by SEM and EDS

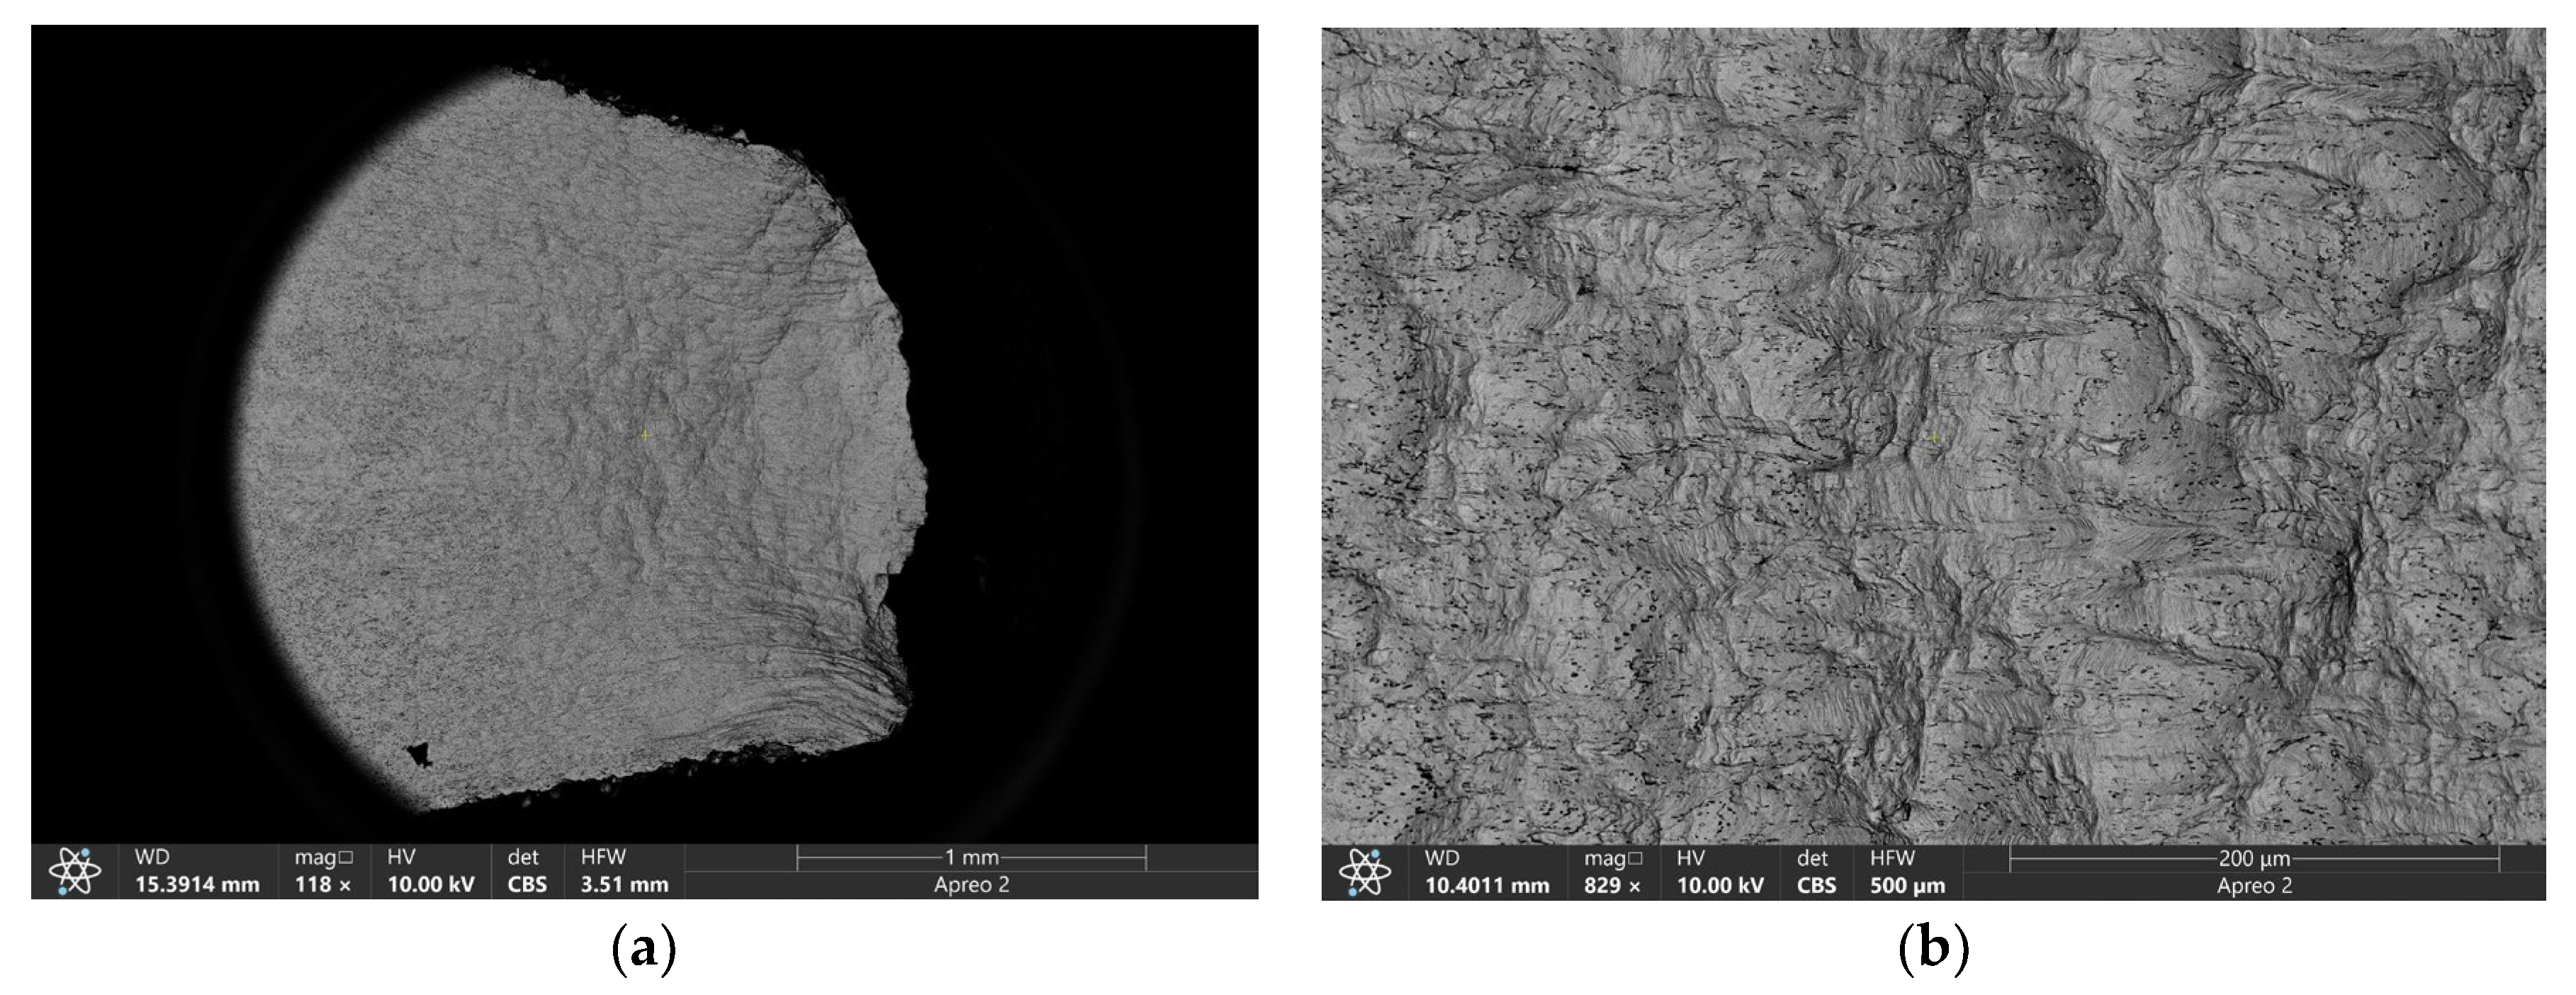
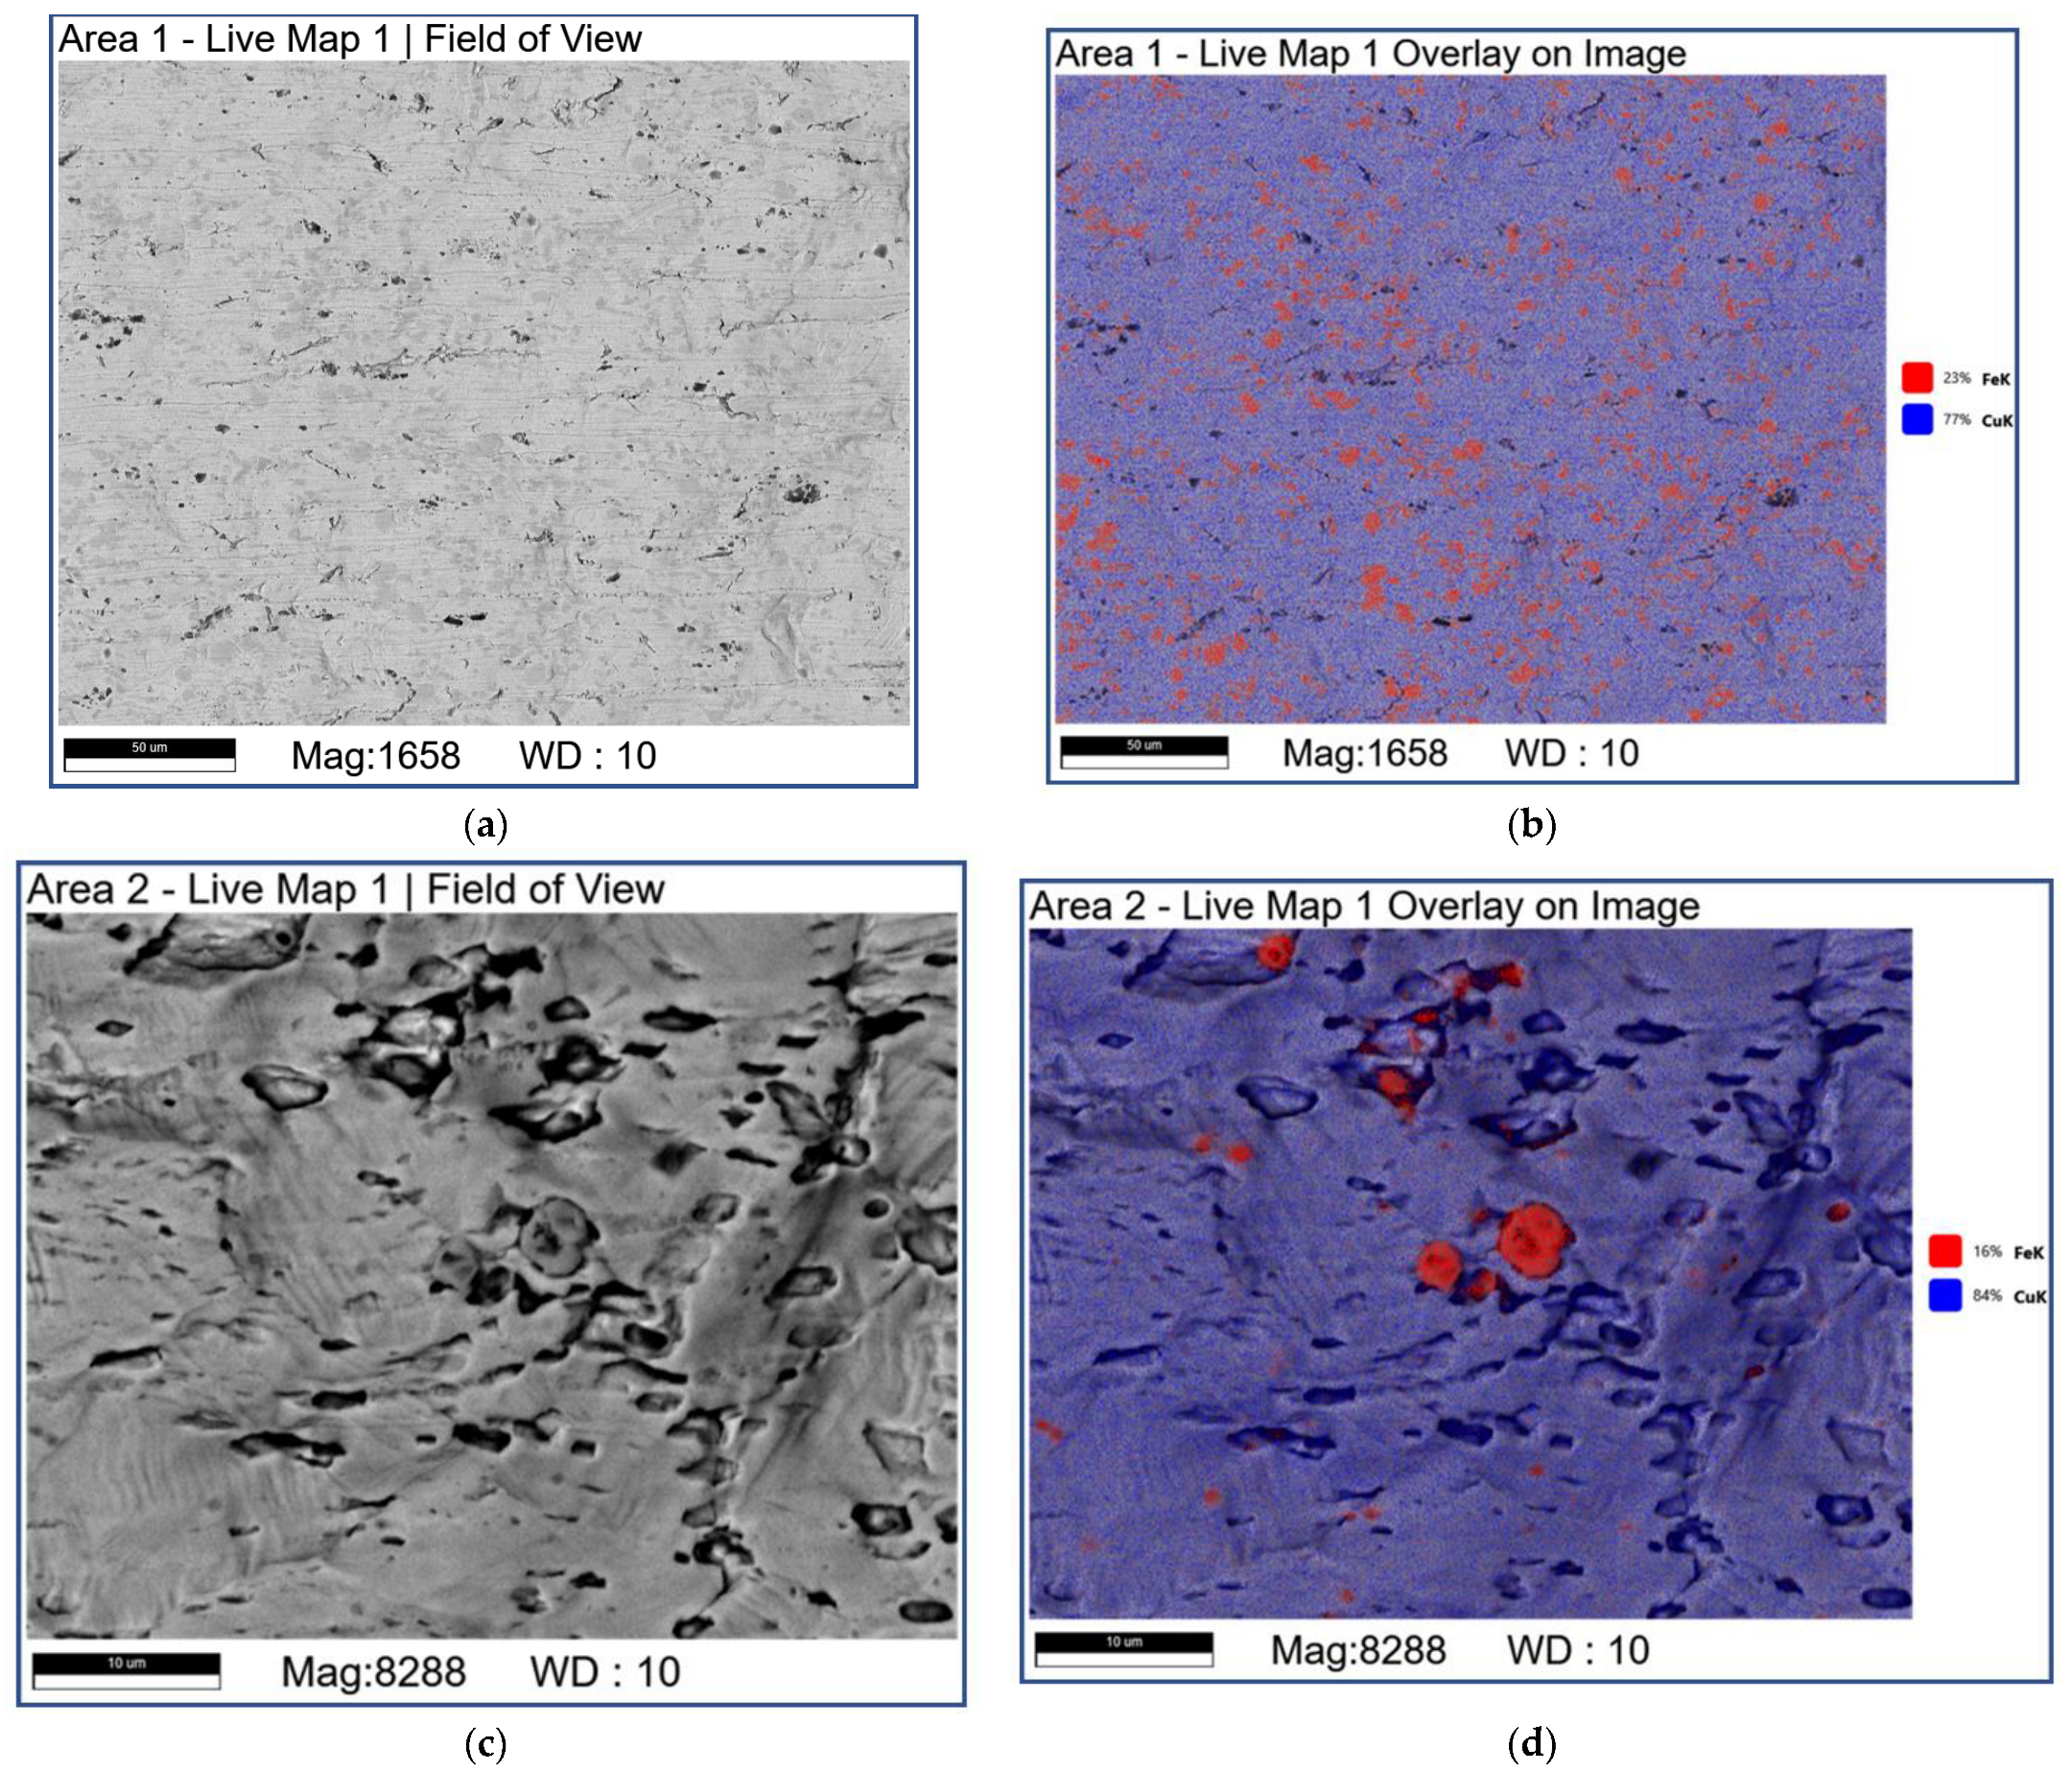
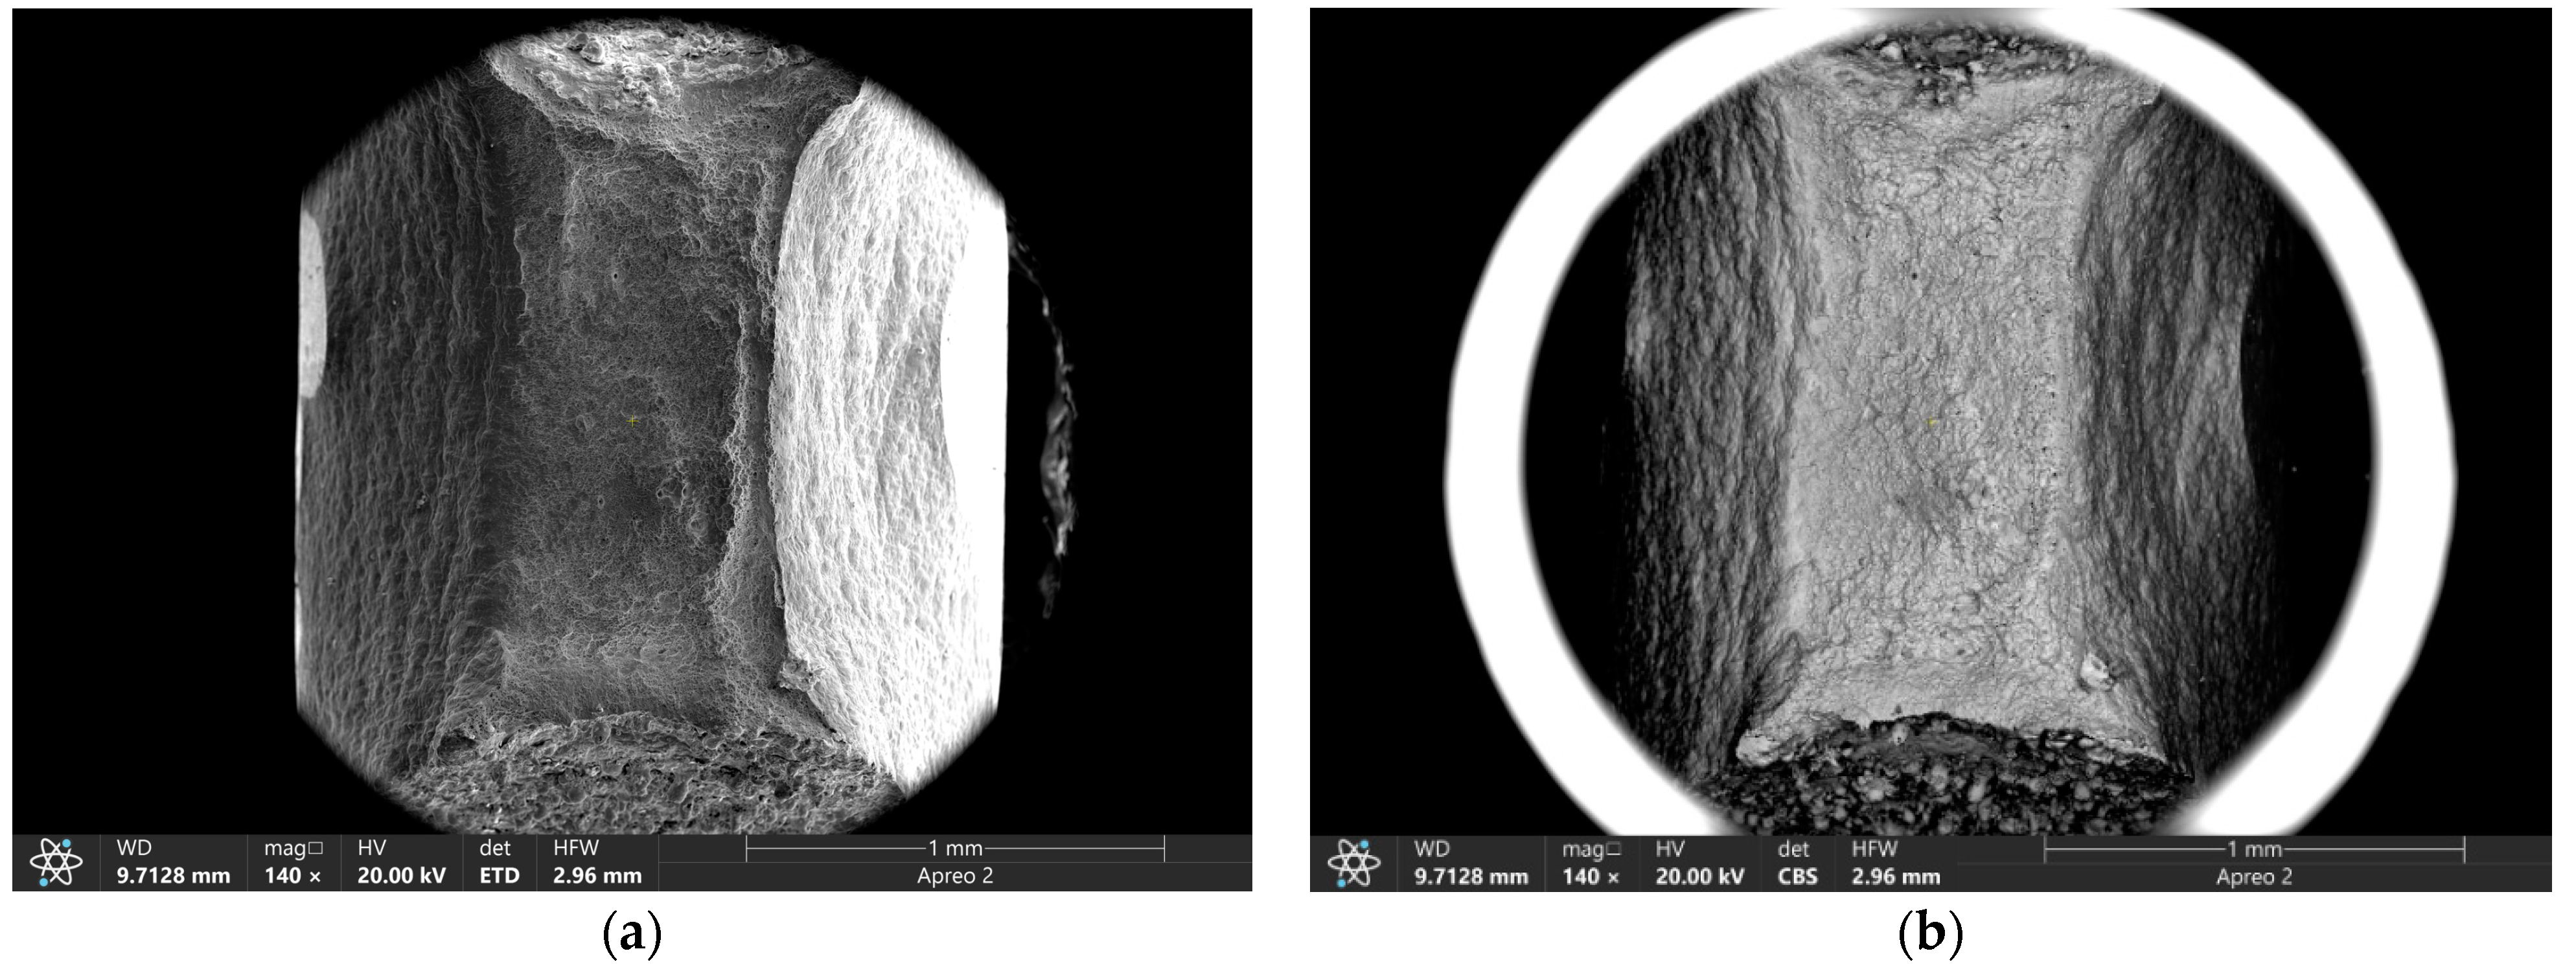
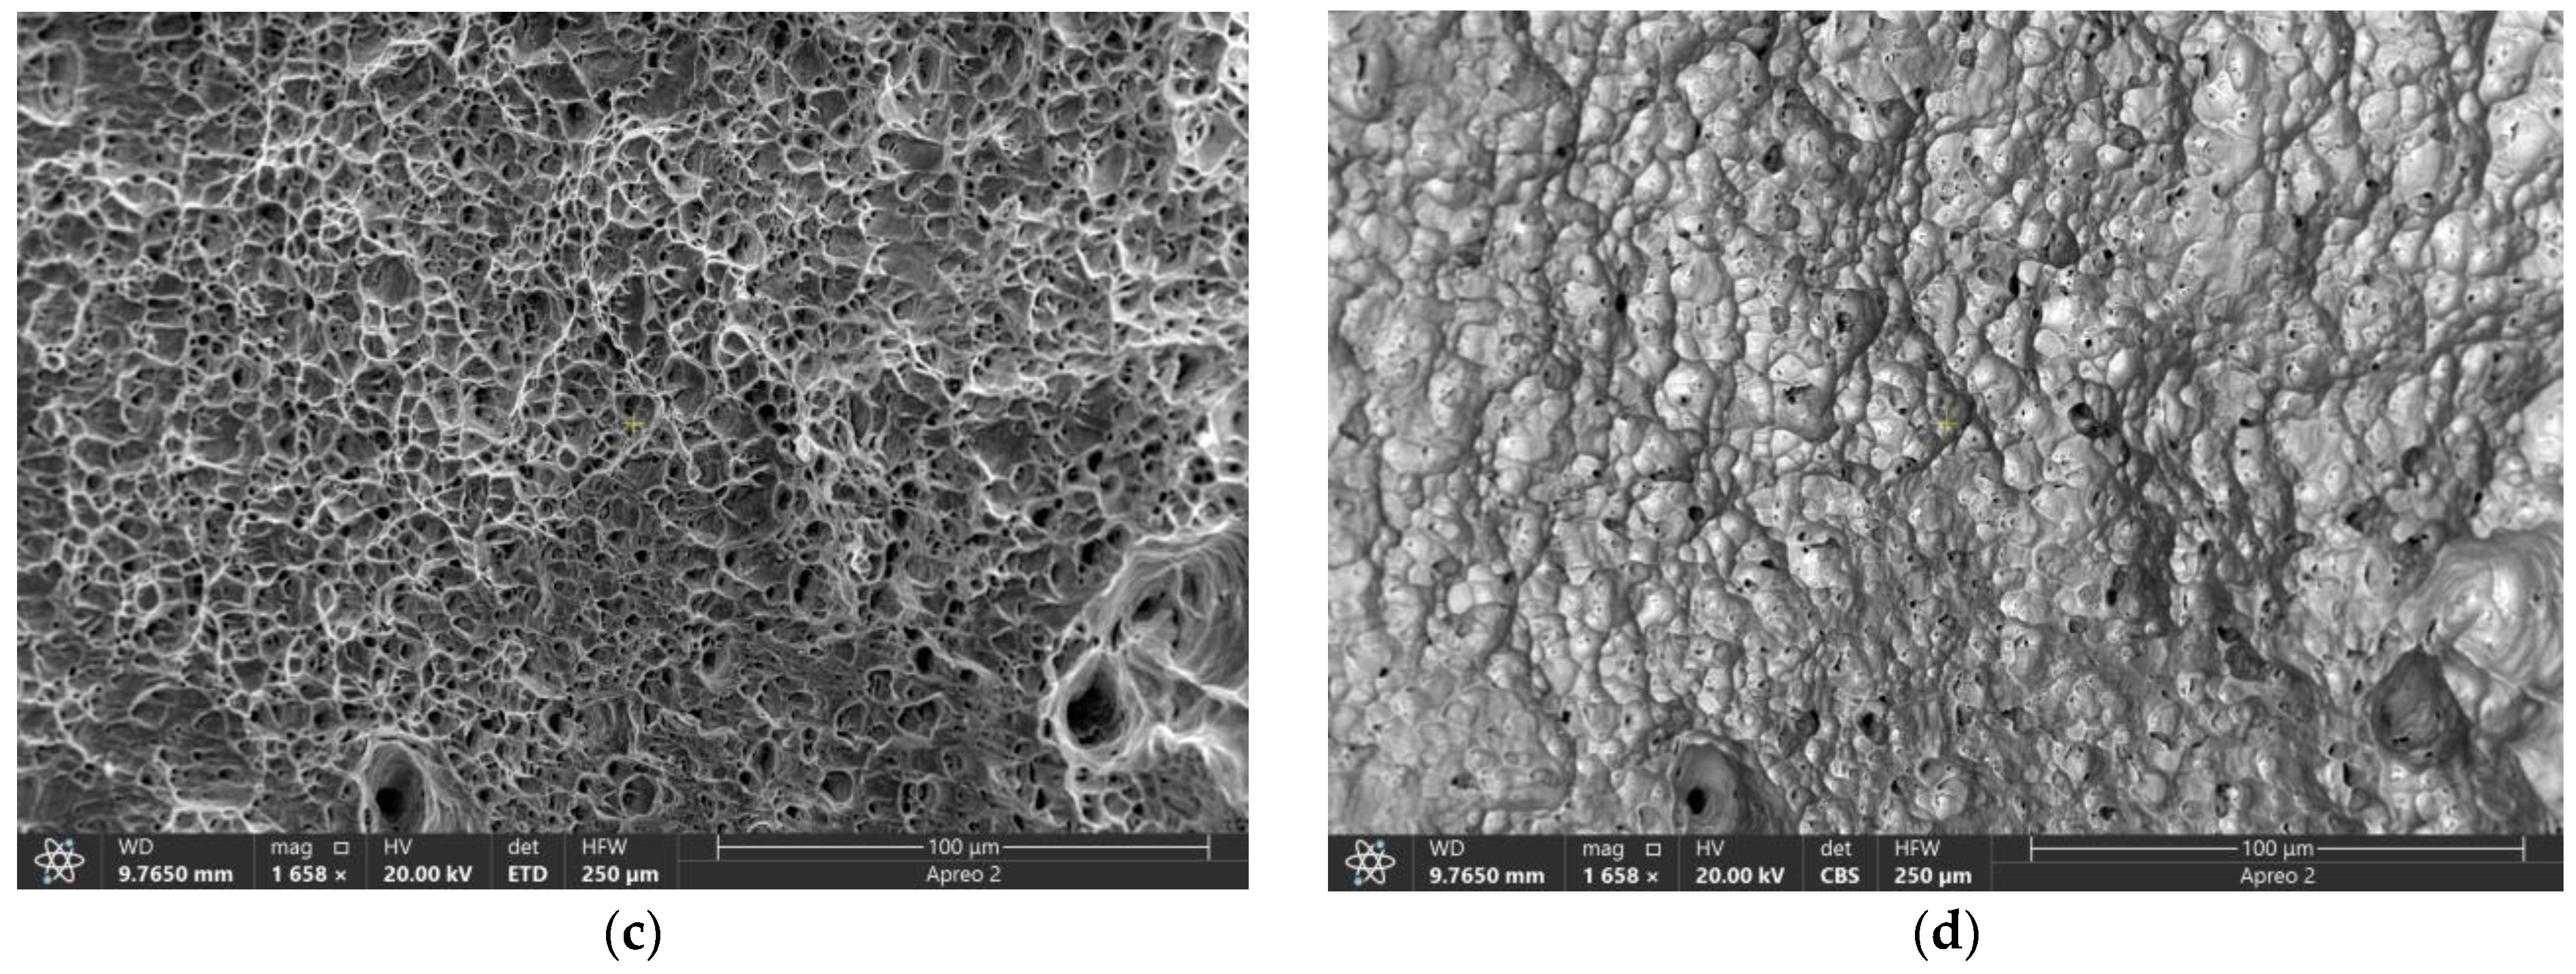
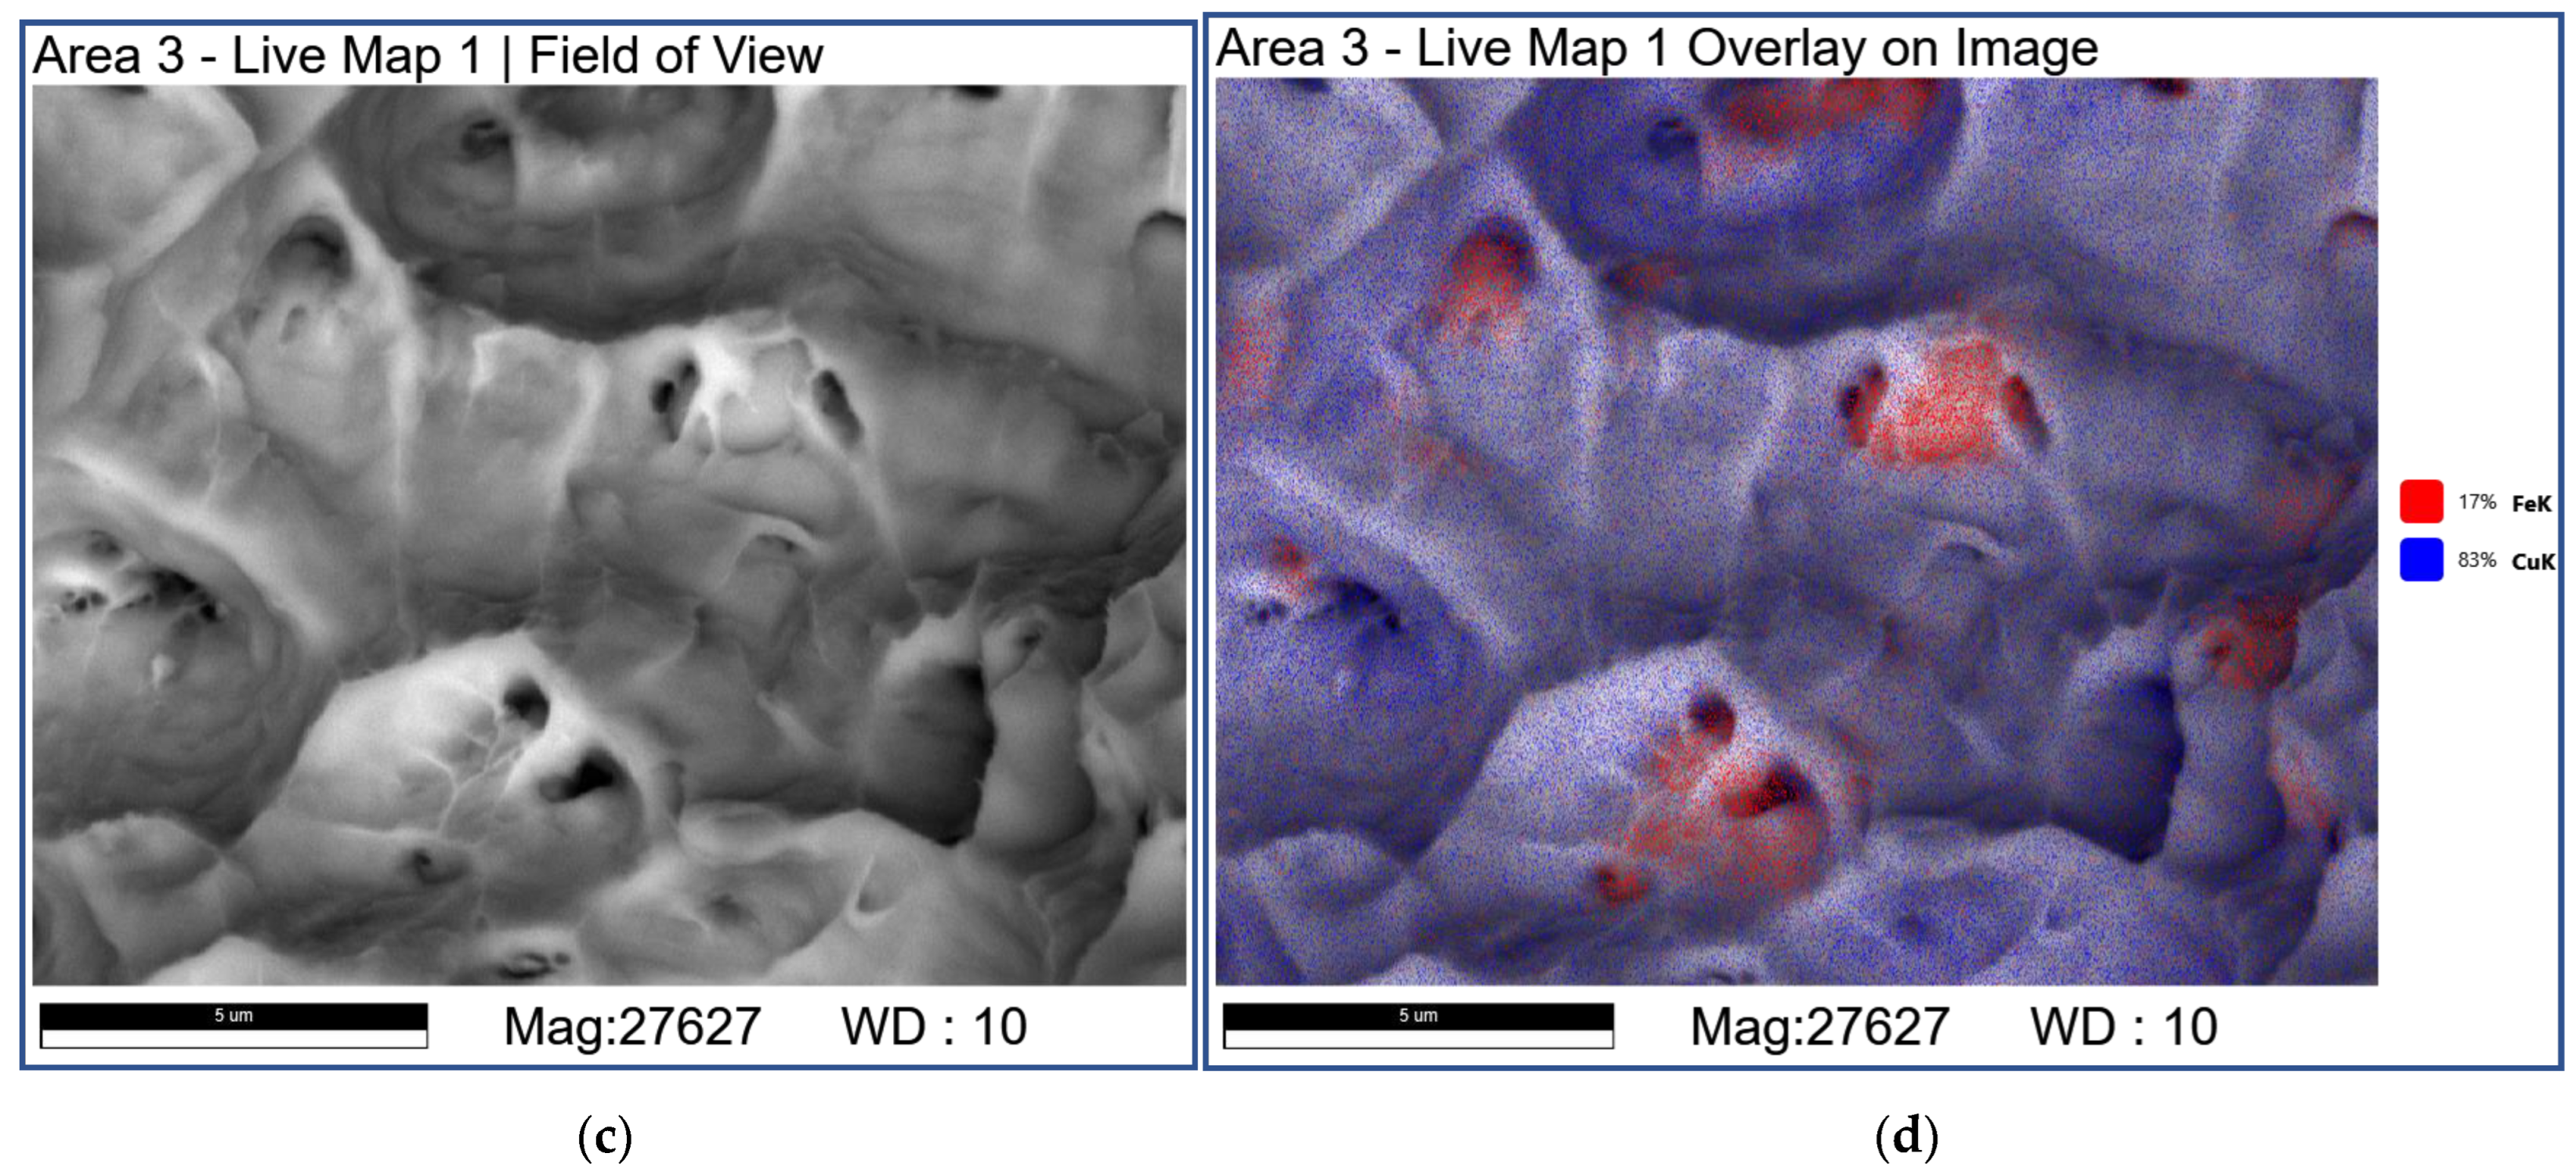
SEM images of the bimetallic sample after tensile testing in the neck area showed the presence of an emerging block structure (Figure 20). On such surfaces one could observe the presence of numerous steel inclusions, the size of which was in the range from 4 to 7 µm (Figure 21a,b). Some steel particles were less than a micron in size (Figure 21c,d). SEM images of the fracture surface bimetallic sample after tensile testing viscous type of fracture (Figure 22). At the same time, there are no cleavage areas on the fracture surface, but there are some facets of individual grains and small “pits”. Facets are the result of destruction along the grain boundary. Around the facets there are areas of viscous fracture, in which the nucleation of micropores occurred along the matrix-inclusion interface. Micropores grow and expand until they merge, leaving behind hemispherical cavities—“pits”. Near the pits, thin slip lines are observed, indicating that the growth of the pits occurs by sliding along many active systems (Figure 22a,c).
Since in these samples, both the number and size of inclusions in the matrix are higher in volume (Figure 21c), then in local area (Figure 21d), when the load is applied, undamaged areas are formed (Figure 22a,b).

4. Discussion

As follows from the above results, the DIC method has been successfully applied to trace strain inhomogeneities from initial plasticity to failure and thus provided some significant information regarding the localization and therefore the occurrence of plastic failure.
Delaminations along the “steel-copper” interface are often encountered in such materials processed by traditional methods, due to the following intractable difficulties: (1) incompatibility and mismatch of thermal properties of materials, such as the coefficient of thermal expansion between copper and steel, which often causes large misfit strains and high residual stresses to form at the interface, leading to cracking [11]; (2) poor weldability between materials, which is determined by their crystal structure, atomic diameter, and compositional solubility in liquid and solid states [32]. The absence of solid solution phases in the Fe–Cu phase diagram is noted [32]. In a limited number of literature sources, it is reported that it is difficult to achieve high bond strength at the Fe–Cu interface [11,33,34,35].
It is noteworthy that, up to large degrees of deformation, the interface between Cu and steel materials is preserved and does not have damage, as well as large local deformations up to the stage of the sample destruction, which indicated a high adhesion strength of these two materials. A similar behavior of compounds of two materials by the DIC method was observed earlier [12,36].
The reason for the high adhesion strength of materials at the interface can be explained by their internal composite structure and a curvilinear interface between the steel and copper layers (Figure 4b–e). Thus, in [3], the near-boundary regions of the “copper−steel” joint in layers are similar to those studied in the present work of “copper-steel” samples were studied in detail. It is shown that the metal structure in the interface zone is represented by a mechanical mixture of copper and austenitic steel regions. At the same time, the “copper-steel” interfaces have a wavy structure, and are also completely devoid of any microscopic defects, such as large porosity and hot cracks. Our studies have shown the same trends in the formation of “copper-steel” interface zones. Mutual penetration of Fe and Cu inclusions into the “copper-steel” interface with a composite microstructure is typical both for the initial state of the studied samples (Figure 4b–e) and for the deformation structure of such a compound after tensile tests (Figure 20 and Figure 21). SEM images of fractured surfaces after tensile tests (Figure 23) additionally demonstrate with great persuasiveness the almost microcomposite structure of the fracture sites of such a material. Interfacial interaction occurs in both copper and iron parts. Cu particles with an average size ≤ of 5 μm are formed directly near the sharp boundary with the iron matrix. Fe particles with an average size of ≤ 10 µm are formed in a copper matrix. Since the interfacial interaction occurs at the boundary of Fe and Cu at an equal value of the concentration of the components, then in this area such structural elements as solid solutions of copper in iron, and iron in copper with additional mutual dissolution of alloying elements, mechanical mixtures of system components are formed. It should be noted that the dissolution and redistribution of alloying elements of steel occurs only inside the steel. This suggests that the formation of a mechanical mixture occurs rather quickly. The only factor in this redistribution is temperature. By definition, diffusion is well described by molecular kinetic theory. Therefore, it is important to take into account not only the contribution of temperature, but also time, since diffusion volumes are directly related to diffusion fluxes. Therefore, one should not consider the first Fick equation, but immediately turn to the second Fick equation, where C is the concentration of the substance, t is the time, x is the depth, and D is the diffusion coefficient. Diffusion coefficient tabular quantitative value of the diffusion rate. In this work, the layer size will be described by the variable x, the deposition rate will correlate with the diffusion rate. Thus, the diffusion coefficient will be D = 3.83 mm/s, and the time for the diffusion flow t = 0.26 s. Thus, the alloying elements that are part of the steel do not have time to diffuse, remain in the steel and do not form secondary phases with copper. But according to literary, possibly dissolution limited quantity copper (≈ 5.8% at temperature 1083 °C) in γ-iron [35] and enough low solubility gland in copper (≈ 2.8% at temperature 1083 °C) [37]. Therefore, in the future, only the effect of copper on iron and iron on copper will be considered without taking into account the contribution of Cr, Ni, and other alloying elements of steel. Thus, the phase composition in polymetallic samples made by the two-wire electro-beam additive technology is “austenitic steel γ-Fe (Cr, Ni)-copper ε-Cu”(Figure 4a) [3]. Moreover, the interphase boundaries of inclusions of steel and copper are sharp without the presence of transitional regions (Figure 4b–e). The block structure observed on the DIC pseudo-images at the last stage (Figure 10c,d), taking into account the SEM images (Figure 20), externally resembles a uniform deformation pattern with uniformly distributed fine shear bands at an angle of 45 degrees, unifomlydistributed over the surface of the sample. It is likely that the emergence of such a deformation structure is due precisely to the microcomposite structure of Cu/Fe, when potentially very ductile copper grains are blocked by reinforcing steel inclusions. As a result, copper grains do not dominate the fracture mechanisms, and deformation occurs without significant accumulation of tensile damage, which leads to less plasticity and relative defect-freeness of the resulting deformation structure.
As it can be seen from Figure 8b, in some areas the flow has an abrupt character. Previously, in the study of metal materials obtained using additive technologies by layer-by-layer growth, a strong localization of deformation was already recorded, spatially correlating with the position of printed (deposited) layers [21,22,38]. One of the reasons for this behavior is believed to be the nucleation of microvoids at potential microstructural discontinuities observed at the boundaries between successive deposited layers [38]. It was noted in [21,39] that such defective interlayers are zones of microcrack initiation when the tension direction is orthogonal to the printing direction, as in our case. The lines in Figure 9, which we refer to as rill current, are likely to be precursors of such microcracks.
On the whole, the comprehensive study carried out in this work allows us to positively characterize the potential performance properties of double wire-feed electron beam additive manufactured “copper-steel” samples. Under the influence of intragranular slip, the processes of intergranular shear are also activated, which determines the nature of the fracture. The main types of fracture micromechanisms with an increase in the content of Fe particles and alloying elements of steel is the evolution from the growth of pores in the grain body or along the boundaries under plasticity conditions to the formation of a plasticity neck and a clear ductile fracture pattern. Thus, with an increase in the content of steel inclusions, the contribution of intergranular fracture from intergranular pores and wedge-shaped cracks to fracture under conditions of pore growth increases.
Probably, the main reason for this is the unique possibility of electron beam additive manufacturing, due to deep vacuum and intense heat supply, to form defect-free, microcomposite interfaces between the deposited layers of copper and steel.

5. Conclusions

  • Tensile tests were carried out on “copper-steel” joints which showed the next mechanical characteristics: UTS = 299 MPa, elastic limit σE = 150 MPa, yield strength σ 0.2 = 183   MPa , the relative elongation is 15.4%.
  • In the strain range ( 0.02 < ε 0.08 ), V-shaped shear lines are referred to neck formation and they firstly form in copper and then spread to steel. In the range of strain ( 0.08 < ε 0.15 ) the formation of longitudinal shear lines becomes a competing deformation mechanism, which leads to the formation of the block structure. At the last, third stage, in the range of strain ( 0.15 < ε 0.21 ), the plasticity resource expires, cracks are formed in central part of the two necks, and main crack is a cause of the joint fracture.
  • The study of the evolutionary curves of average strain revealed that the strain rate of copper is 2–3 orders of magnitude higher than that of steel, since copper has a significantly higher ductility. At 3 % ε < 8 % , steel still competes with copper, where the strain also increases exponentially. In the range 8 % ε < 13 % , the strain rate in steel remains approximately constant, while at, ε > 13 % it decreases by an order of magnitude, which correlates with the appearance of the first macrocracks.
  • Thus, in the present work, it is shown that, when stretched, double wire—feed electron beam additive manufactured samples from dissimilar materials (copper and steel) demonstrate high reliability under loading due to the interface zone between materials (copper and steel) to high degrees of deformation remains almost free of defects. The resulting materials can find their application in areas where high thermal conductivity, corrosion resistance and mechanical strength are required.

Author Contributions

Conceptualization, V.K., K.O., A.C. and N.S. (Nickolai Savchenko).; methodology, V.K. and N.S (Nickolai Savchenko).; software, V.K.; formal analysis, V.K. and N.S. (Nickolai Savchenko); investigation, V.K., A.V., K.O., N.S. (Nikolay Shamarin), A.C., E.M., N.S. (Nickolai Savchenko); resources, V.R. and E.K.; data curation, V.K. and N.S. (Nickolai Savchenko); writing—original draft preparation, V.K., A.V., K.O. and N.S. (Nickolai Savchenko); writing—review and editing, V.K., A.V., K.O., A.C. and N.S. (Nickolai Savchenko); visualization, V.K., A.V., K.O., A.C., E.M., N.S. (Nickolai Savchenko); supervision, V.R.; project administration, A.C., V.R. and E.K.; funding acquisition, V.R. and E.K. All authors have read and agreed to the published version of the manuscript.

Funding

The work was performed according to the government research assignment for ISPMS SB RAS, FWRW-2022-0004.

Data Availability Statement

Not applicable.

Acknowledgments

The analyses (SEM research, EDS analysis) were carried out with the equipment of Tomsk Regional Core Shared Research Facilities Center of National Research Tomsk State University. The center was supported by the Ministry of Science and Higher Education of the Russian Federation.

Conflicts of Interest

The authors declare no conflict of interest.

References

  1. Zhang, C.; Chen, F.; Huang, Z.; Jia, M.; Chen, G.; Ye, Y.; Lin, Y.; Liu, W.; Chen, B.; Shen, Q.; et al. Additive manufacturing of functionally graded materials A review. Mater. Sci. Eng. A 2019, 764, 138209. [Google Scholar] [CrossRef]
  2. Kolubaev, E.A.; Rubtsov, V.E.; Chumaevsky, A.V.; Astafurova, E.G. Scientific Approaches to Micro-, Meso- and Macrostructural Design of Bulk Metallic and Polymetallic Materials by Wire-Feed Electron-Beam Additive Manufacturing. Phys. Mesomech. 2022, in press. [Google Scholar] [CrossRef]
  3. Osipovich, K.; Vorontsov, A.; Chumaevskii, A.; Gurianov, D.; Shamarin, N.; Savchenko, N.; Kolubaev, E. Characterization of a Bimetallic Multilayered Composite “Stainless Steel/Copper” Fabricated with Wire-Feed Electron Beam Additive Manufacturing. Metals 2021, 11, 1151. [Google Scholar] [CrossRef]
  4. Osipovich, K.S.; Astafurova, E.G.; Chumaevskii, A.V.; Kalashnikov, K.N.; Astafurov, S.V.; Maier, G.G.; Melnikov, E.V.; Moskvina, V.A.; Panchenko, M.Y.; Tarasov, S.Y.; et al. Gradient transition zone structure in “steel–copper” sample produced by double wire-feed electron beam additive manufacturing. J. Mater. Sci. 2020, 55, 9258–9272. [Google Scholar] [CrossRef]
  5. Rodrigues, T.A.; Werley Cipriano Farias, F.; Zhang, K.; Shamsolhodaei, A.; Shen, J.; Zhou, N.; Schell, N.; Capek, J.; Polatidis, E.; Santos, T.G.; et al. Wire and arc additive manufacturing of 316L stainless steel/Inconel 625 functionally graded material: Development and characterization. J. Mater. Res. Technol. 2022, 21, 237–251. [Google Scholar] [CrossRef]
  6. Rodrigues, T.A.; Bairrão, N.; Werley Cipriano Farias, F.; Shamsolhodaei, A.; Shen, J.; Zhou, N.; Maawad, E.; Schell, N.; Santos, T.G.; Oliveira, J.P. Steel-copper functionally graded material produced by twin-wire and arc additive manufacturing. Mater. Des. 2022, 213, 110270. [Google Scholar] [CrossRef]
  7. Liu, M. Effect of uniform corrosion on mechanical behavior of E690 high-strength steel lattice corrugated panel in marine environment: A finite element analysis. Mater. Res. Express 2021, 8, 066510. [Google Scholar] [CrossRef]
  8. Liu, M. Finite element analysis of pitting corrosion on mechanical behavior of E690 steel panel. Anti-Corros. Methods Mater. 2022, 28, 7527–7536. [Google Scholar] [CrossRef]
  9. Shukhardin, S.V. Dual and Multi-Component Systems Based on Copper, 1st ed.; Science: Moscow, Russia, 1979. [Google Scholar]
  10. Mai, T.A.; Spowage, A.C. Characterisation of dissimilar joints in laser welding of steel–kovar, copper–steel and copper– aluminium. Mater. Sci. Eng. A 2004, 374, 224–233. [Google Scholar] [CrossRef]
  11. Tan, C.; Chew, Y.; Bi, G.; Wang, D.; Ma, W.; Yang, Y.; Zhou, K. Additive manufacturing of steel–copper functionally graded material with ultrahigh bonding strength. J. Mater. Sci. Technol. 2021, 72, 217–222. [Google Scholar] [CrossRef]
  12. Zhang, X.; Sun, C.; Pan, T.; Flood, A.; Zhang, Y.; Li, L.; Lio, F. Additive manufacturing of copper-H13 tool steel bi-metallic structures via Ni-based multi-interlayer. Addit. Manuf. 2020, 36, 101474. [Google Scholar] [CrossRef]
  13. Shu, X.; Chen, G.; Liu, J.; Zhang, B.; Feng, J. Microstructure evolution of copper/steel gradient deposition prepared using electron beam freeform fabrication. Mater. Lett. 2018, 213, 374–377. [Google Scholar] [CrossRef]
  14. Efstathiou, C.; Sehitoglu, H.; Lambros, J. Multiscale Strain Measurements of Plastically Deforming Polycrystalline Titanium: Role of Deformation Heterogeneities. Int. J. Plast. 2010, 26, 93–106. [Google Scholar] [CrossRef]
  15. DebRoy, T.; Wei, H.L.; Zuback, J.S.; Mukherjee, T.; Elmer, J.W.; Milewski, J.O.; Beese, A.M.; Wilson-Heid, A.; De, A.; Zhang, W. Additive manufacturing of metallic components-Process, structure and properties. Prog. Mater. Sci. 2018, 92, 112–224. [Google Scholar] [CrossRef]
  16. Forsstrom, A.; Bossuyt, S.; Yagodzinskyy, Y.; Tsuzaki, K.; Hanninen, H. Strain localization in copper canister FSW welds for spent nuclear fuel disposal. J. Nucl. Mater. 2019, 523, 347–359. [Google Scholar] [CrossRef]
  17. Forsström, A.; Luumi, L.; Bossuyt, S.; Hänninen, H. Localisation of plastic deformation in friction stir and electron beam copper welds. Mater. Sci. Technol. 2016, 33, 1119–1129. [Google Scholar] [CrossRef]
  18. Bao, J.; Benaarbia, A.; Bao, S.; Guo, X.; Wang, Y.; Sun, W. High temperature strain heterogeneities tracking within hole-specimens of FV566 turbine steel via digital image correlation. Mater. Sci. Eng. A 2020, 777, 139068. [Google Scholar] [CrossRef]
  19. Taniguchi, A.; Maeyama, T.; Uchida, M.; Kaneko, Y. Macroscopic and Microscopic Non-Uniform Deformations of Polycrystalline Pure Copper During Uniaxial Tensile Test with High Stress Gradient. Key Eng. Mater. 2019, 794, 246–252. [Google Scholar] [CrossRef]
  20. Guo, Y.Z.; Li, F.D.; Suo, T.; Tang, Z.B.; Li, Y.L. A close observation on the deformation behavior of bicrystal copper under tensile loading. Mech. Mater. 2013, 62, 80–89. [Google Scholar] [CrossRef]
  21. Balit, Y.; Charkaluk, E.; Constantinescu, A. Digital image correlation for microstructural analysis of deformation pattern in additively manufactured 316L thin walls. Addit. Manuf. 2020, 31, 100862. [Google Scholar] [CrossRef]
  22. Balit, Y.; Guévenoux, C.; Tanguy, A.; Upadhyay, M.V.; Charkaluk, E.; Constantinescu, A. High resolution digital image correlation for microstructural strain analysis of a stainless steel repaired by Directed Energy Deposition. Mater. Lett. 2020, 270, 127632. [Google Scholar] [CrossRef] [Green Version]
  23. Saranarayanan, R.; Lakshminarayanan, A.K.; Venkatraman, B. A combined full-field imaging and metallography approach to assess the local properties of gas tungsten arc welded copper–stainless steel joints. Arch. Civ. Mech. Eng. 2019, 19, 251–267. [Google Scholar] [CrossRef]
  24. Kibitkin, V.V.; Solodushkin, A.I.; Pleshanov, V.S. Measuring the Quantitative Characteristics of Local Vortices on a Plane of a Deformed Material. Optoelectron. Instrum. Data Process. 2018, 54, 600–607. [Google Scholar] [CrossRef]
  25. Kibitkin, V.V.; Solodushkin, A.I.; Pleshanov, V.S. Evolution of the deformation structure for welded joints of low-carbon steel at low-cyclic fatigue. AIP Conf. Proc. 2016, 1783, 020089. [Google Scholar] [CrossRef]
  26. Kibitkin, V.V.; Solodushkin, A.I.; Pleshanov, V.S. Identification of the shear-type displacement vector field and evaluation of its characteristics. Optoelectron. Instrum. Data Process. 2016, 52, 347–353. [Google Scholar] [CrossRef]
  27. Liu, S.C.; Jie, J.C.; Zhang, J.J.; Wang, P.F.; Wang, T.M.; Li, T.J.; Yin, G.M. A surface energy driven dissolution model for immiscible Cu-Fe alloy. J. Mol. Liq. 2018, 261, 232–238. [Google Scholar] [CrossRef]
  28. AlMangour, B.; Grzesiak, D.; Cheng, J.; Ertas, Y. Thermal behavior of the molten pool, microstructural evolution, and tribological performance during selective laser melting of TiC/316L stainless steel nanocomposites: Experimental and simulation methods. J. Mater. Process. Technol. 2018, 257, 288–301. [Google Scholar] [CrossRef]
  29. Osipovich, K.S.; Chumaevskii, A.V.; Gusarova, A.V.; Kalashnikov, K.N.; Kolubaev, E.A. Mechanical properties of “Copper-Steel” polymetal, produced by electron-beam wire-feed additive manufacturing. High Temp. Mater. Process. 2020, 24, 91–98. [Google Scholar] [CrossRef]
  30. Long, Y.; Liao, K.; Huang, X. Microstructure evolution and shear band formation in an ultrafine-grained Ti–6Al–4V alloy during cold compression. Mater. Sci. Eng. A 2022, 856, 144026. [Google Scholar] [CrossRef]
  31. Kibitkin, V.; Solodushkin, A.; Pleshanov, V.; Napryushkin, A. On a choice of input parameters for calculation the vector field and deformation with DIC. Measurement 2017, 95, 266–272. [Google Scholar] [CrossRef]
  32. Guo, S.; Zhou, Q.; Kong, J.; Peng, Y.; Xiang, Y.; Luo, T.-Y.; Wang, K.-H.; Zhu, J. Effect of beam offset on the characteristics of copper/304stainless steel electron beam welding. Vacuum 2016, 128, 205–212. [Google Scholar] [CrossRef]
  33. Liu, Z.H.; Zhang, D.Q.; Sing, S.L.; Chua, C.K.; Loh, L.E. Interfacial characterization of SLM parts in multi-material processing Metallurgical diffusion between 316L stainless steel and C18400 copper alloy. Mater. Charact. 2014, 94, 116–125. [Google Scholar] [CrossRef]
  34. Imran, M.K.; Masood, S.H.; Brandt, M.; Bhattacharya, S.; Mazumder, J. Direct metal deposition (DMD) of H13 tool steel on copper alloy substrate Evaluation of mechanical properties. Mater. Sci. Eng. A 2011, 528, 3342–3349. [Google Scholar] [CrossRef]
  35. Tan, C.; Zhou, K.; Ma, W.; Min, L. Interfacial characteristic and mechanical performance of maraging steel-copper functional bimetal produced by selective laser melting based hybrid manufacture. Mater. Des. 2018, 155, 77–85. [Google Scholar] [CrossRef]
  36. Karnati, S.; Zhang, Y.; Liou, F.F.; Newkirk, J.W. On the Feasibility of Tailoring Copper–Nickel Functionally Graded Materials Fabricated through Laser Metal Deposition. Metals 2019, 9, 287. [Google Scholar] [CrossRef] [Green Version]
  37. Hunt, J.D. Cellular and Primary Dendrite Spacings. In Solidification and Casting of Metals: Proceedings of an International Conference on Solidification, Organized Jointly by the Sheffield Mettallurgical and Engineering Association with the Metals Society; Casting of Metals: Sheffield, UK, 1979; pp. 3–9. [Google Scholar]
  38. Foehring, D.; Chew, H.B.; Lambros, J. Characterizing the tensile behavior of additively manufactured Ti-6Al-4V using multiscale digital image correlation. Mater. Sci. Eng. A 2018, 724, 536–546. [Google Scholar] [CrossRef] [Green Version]
  39. Zhang, K.; Wang, S.; Liu, W.; Shang, X. Characterization of stainless steel parts by laser metal deposition shaping. Mater. Des. 2014, 55, 104–119. [Google Scholar] [CrossRef]
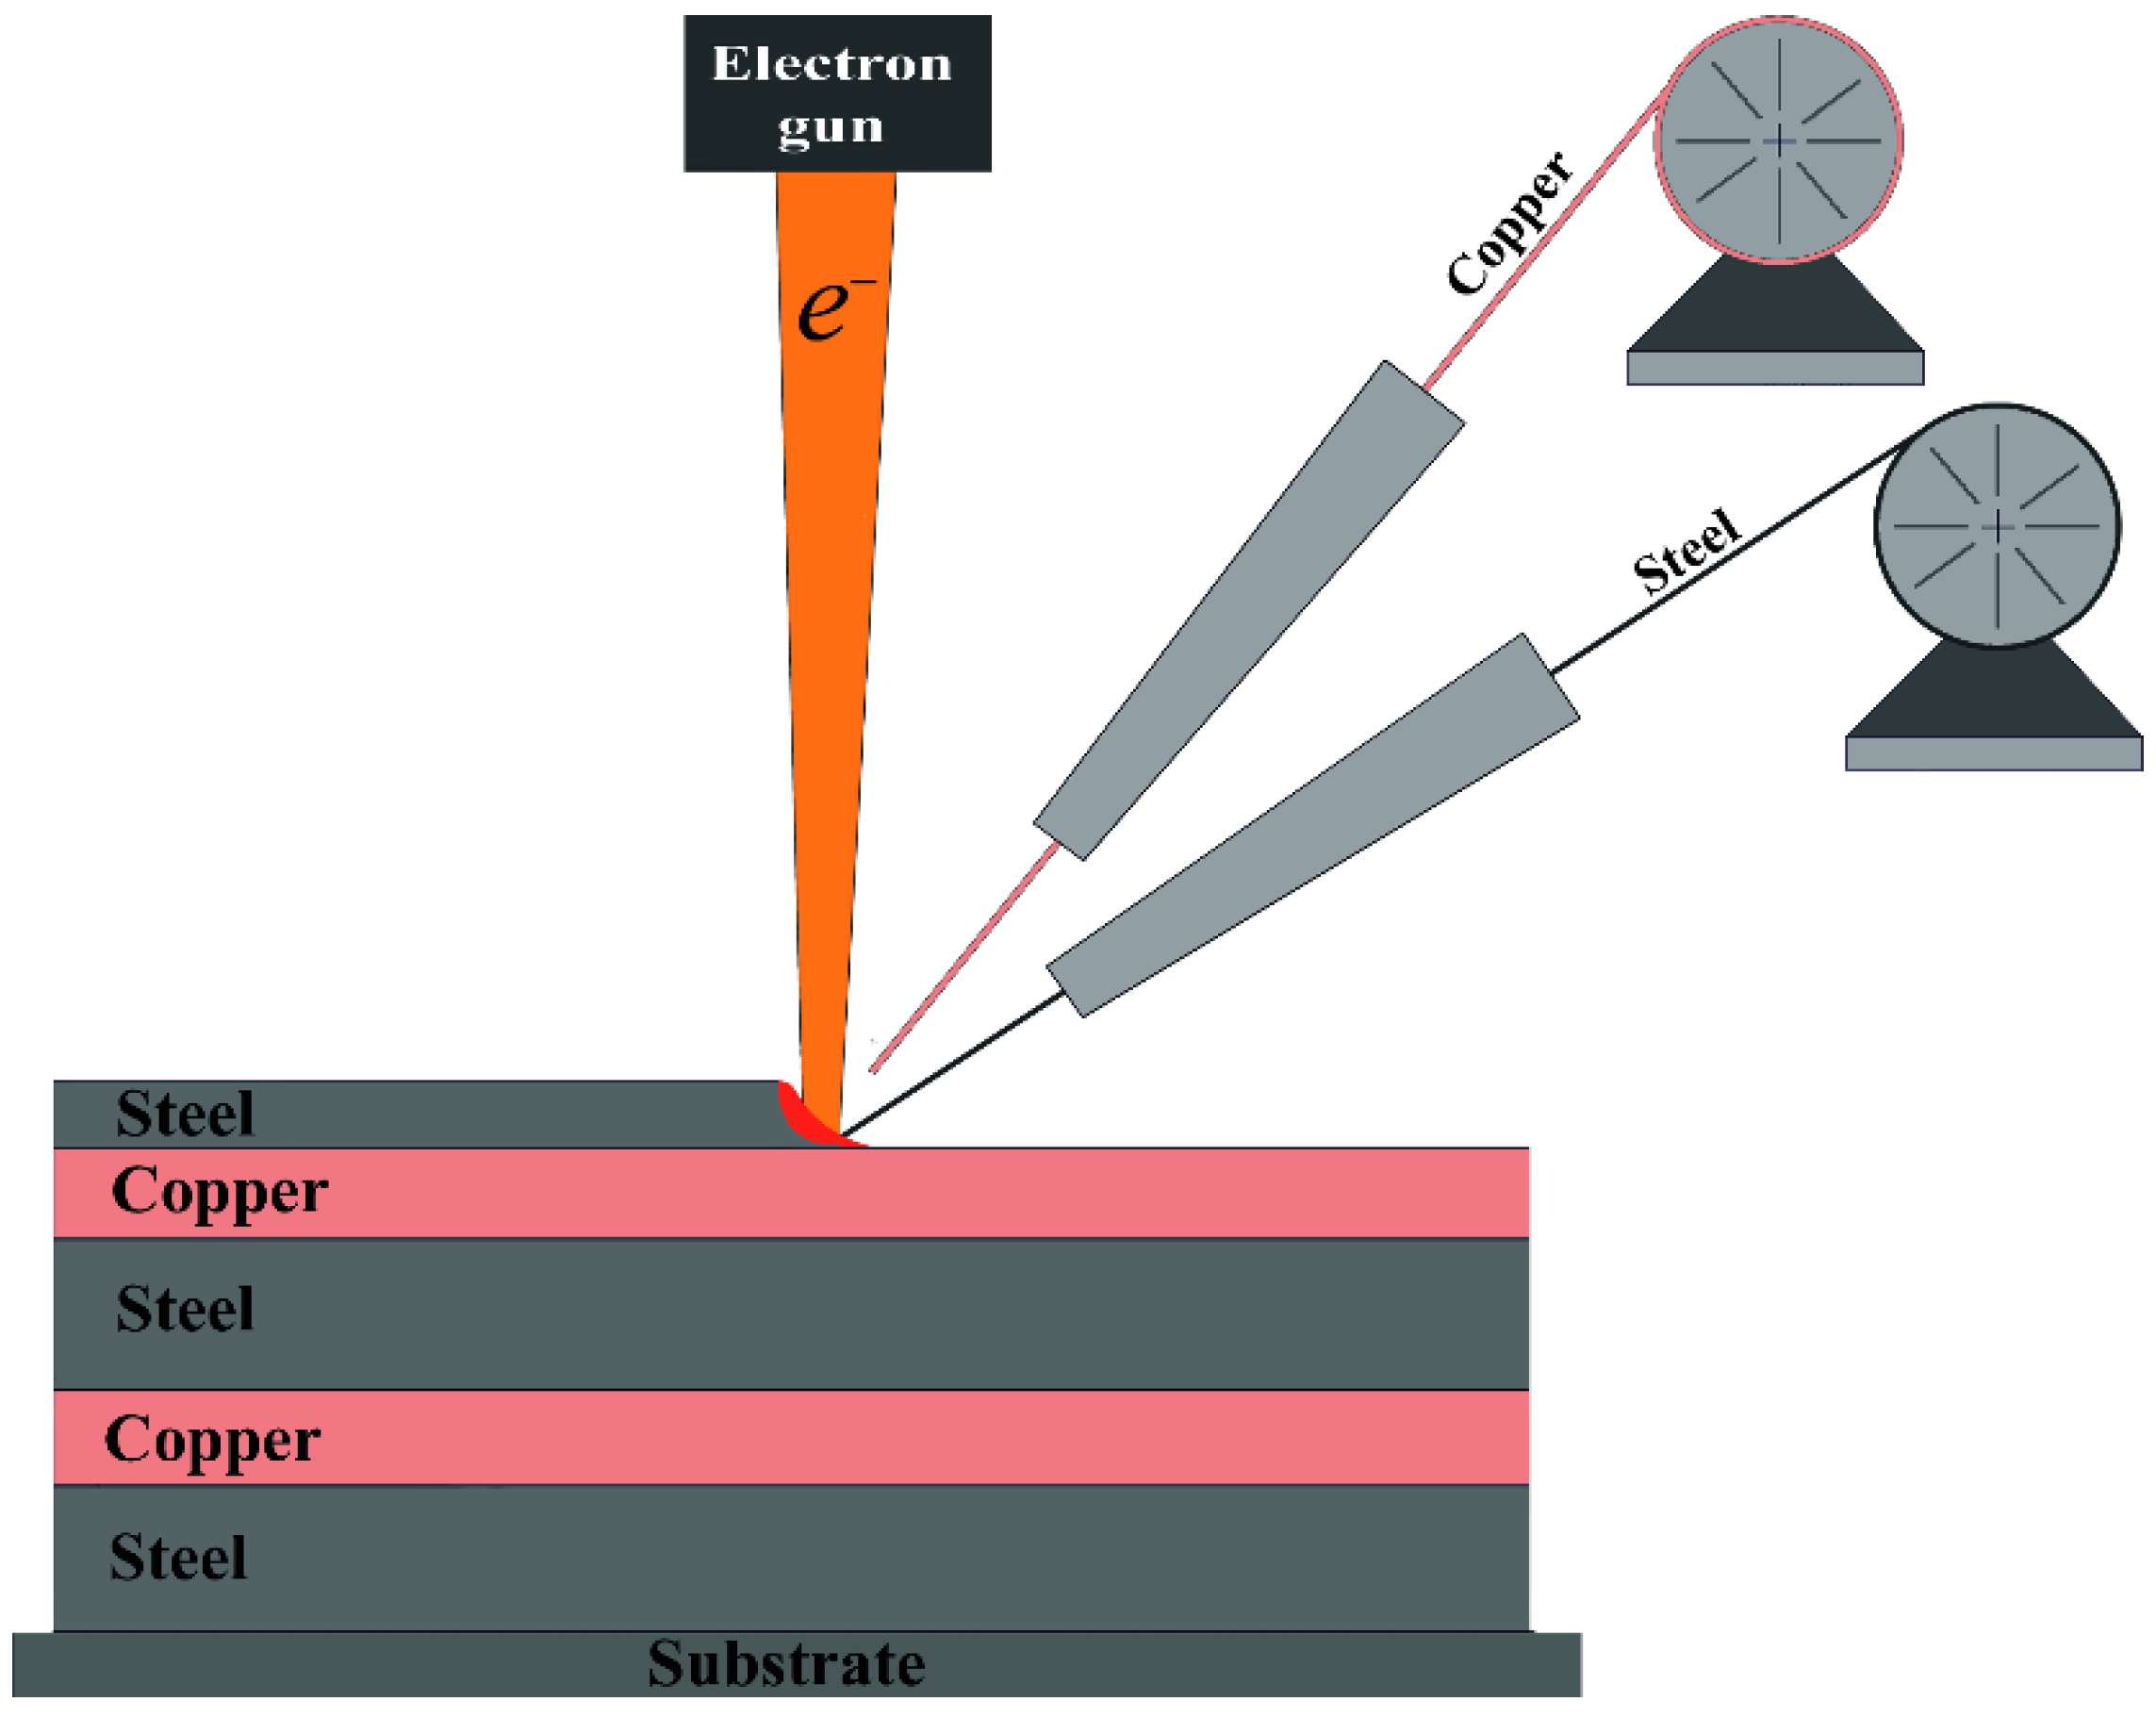
Figure 1. Scheme of a “copper–steel” material building using the electron beam additive manufacturing.
Metals 12 01797 g001
Figure 2. Sectioned “copper-steel” specimens for tensile tests (a). “Copper-steel” specimen for tensile test (b).
Metals 12 01797 g002
Figure 3. Tensile scheme and coordinate system.
Metals 12 01797 g003
Figure 4. The XRD patterns of “copper-steel” sample (a). SEM BSE images of boundaries between copper (light areas) and steel (dark areas) layers in “copper-steel” samples produced by electron beam additive manufacturing (be).
Metals 12 01797 g004aMetals 12 01797 g004b
Figure 5. Stress-strain curve of a “copper-steel” specimen (1) and plot of strain-hardening factor versus strain (2).
Metals 12 01797 g005
Figure 6. Macrophotographs taken under tension of a “copper-steel” specimen at different values of strain: (a) ℇ ≈ 0; (b) ℇ ≈ 0.07; (c) ℇ ≈ 0.15; (d) ℇ ≈ 0.21.
Metals 12 01797 g006
Figure 7. View of the displacement field (a), pseudo images of the deformation structure (b,c), longitudinal displacements (1) along the sample midline U x ( x , y = y m / 2 ) (d) and longitudinal tensor component (2) ε x x ( x , y = y m / 2 ) at ε = 0.013 , Δ ε = 0.012 ,   T = 1 . Zero stage.
Metals 12 01797 g007aMetals 12 01797 g007b
Figure 8. Spatial distribution of longitudinal deformation component along the midline (a) and longitudinal displacement velocity (b) at the first stage.
Metals 12 01797 g008
Figure 9. Evolution of deformation structures at the first stage (ad): (a) ε = 0.025 ,   Δ ε = 0.008 ; (b) ε = 0.029 ,   Δ ε = 0.020 ; (c) ε = 0.037 ,   Δ ε = 0.012 ; (d) ε = 0.029 ,   Δ ε = 0.020 .
Metals 12 01797 g009
Figure 10. Evolution of deformation structures at the second stage: (a) ε = 0.074 ,   Δ ε = 0.024 ; (b) ε = 0.094 ,   Δ ε = 0.016 ; (c) ε = 0.118 ,   Δ ε = 0.020 ; (d) ε = 0.138 ,   Δ ε = 0.024 All pseudo-images on (ad) are obtained at T = 1.
Metals 12 01797 g010
Figure 11. Spatial distribution of longitudinal strain ε x x ( x , y = y m / 2 ) at the second (a) and third (b) stages.
Metals 12 01797 g011
Figure 12. The evolution of deformation structures at the stage of crack propagation (third stage): (a) ε = 0.156 ,   Δ ε = 0.008 ; (b) ε = 0.168 ,   Δ ε = 0.012 ; (c) ε = 0.188 ,   Δ ε = 0.008 ; (d) ε = 0.196 ,   Δ ε = 0.008 . All pseudo-images on (a-d) are obtained at T = 1.
Metals 12 01797 g012
Figure 13. Dependences of the average (1) and maximum (2) of longitudinal deformation component versus strain ε.
Metals 12 01797 g013
Figure 14. Model field of pure shear (a) and scheme for finding the amplitude and angle (b) of shear.
Metals 12 01797 g014
Figure 15. Angular distributions of the local pure shears (a), rupture angles (b) and their vector sum (c). Each first (second) number of the legend on (ac) reflects the number of the first (second) frame.
Metals 12 01797 g015
Figure 16. Pseudo images of shear amplitudes (ac) and angles (df) for the shear components: shear (a,d), rupture (b,e) and their sum (c,f) at the first fracture stage. All pseudo-images on (af) were obtained under the following conditions: ε = 0.037 ,   Δ ε = 0.012 , T = 1 .
Metals 12 01797 g016
Figure 17. Spatial distribution of shear angles, varying within 91°−179° (a) and 0°−90° (b). All pseudo-images on (a,b) were obtained under the following conditions: ε = 0.037 ,   Δ ε = 0.012 ,   T = 1 .
Metals 12 01797 g017
Figure 18. Evolution of the average strain rate γ m e a n in the regions of development of necks in copper (1) and steel (2) and the corresponding standard deviations for copper (3) and steel (4).
Metals 12 01797 g018
Figure 19. Evolution of deformation structures in the neck area for steel: (a) ε = 0.021 ,   Δ ε = 0.020 ; (b) ε = 0.045 ,   Δ ε = 0.016 ; (c) ε = 0.082 ,   Δ ε = 0.020 ; (d) ε = 0.164 ,   Δ ε = 0.040 ; (e) ε = 0.164 ,   Δ ε = 0.020 ; (f) ε = 0.196 ,   Δ ε = 0.040  . All pseudo-images on (af) are obtained at T = 1.
Metals 12 01797 g019
Figure 20. SEM BSE images of the “copper−steel” sample after tensile testing in the neck area: (a) general view of the destroyed part of the sample; (b) image of the forming block structure.
Metals 12 01797 g020
Figure 21. SEM BSE images (a,c) and layered EDS images (b,d) of the “copper−steel” sample after tensile testing in the neck area.
Metals 12 01797 g021
Figure 22. SEM SE (a,c) and BSE (b,d) images of the fracture surface “copper−steel” sample after tensile testing.
Metals 12 01797 g022aMetals 12 01797 g022b
Figure 23. SEM BSE images (a,c) and layered EDS images (b,d) of the fracture surface “copper−steel” sample after tensile testing.
Metals 12 01797 g023aMetals 12 01797 g023b
Table 1. Chemical composition of copper and steel wires.
MaterialFeCuNiCrMnTiSiC
AISI 321Bal.to 0.39–1117–19to 2to 0.8to 0.08
C11000to 0.005Bal.to 0.002
Publisher’s Note: MDPI stays neutral with regard to jurisdictional claims in published maps and institutional affiliations.