Article

Dynamical Models of Plasticity with Nonmonotonic Deformation Curves for Nanomaterials

1
Mathematical and Mechanical Faculty, Saint Petersburg State University, Universitetskiy Prospect 28, 198504 Saint Petersburg, Russia
2
Institute for Problems in Mechanical Engineering, Russian Academy of Sciences, V.O., Bolshoj pr. 61, 199178 Saint Petersburg, Russia
3
Mechanics and Physics of Solids Research Group, Department of MACE, The University of Manchester, Manchester M13 9PL, UK
*
Author to whom correspondence should be addressed.
Metals 2022, 12(11), 1835; https://doi.org/10.3390/met12111835 (registering DOI)
Submission received: 15 September 2022 / Revised: 21 October 2022 / Accepted: 26 October 2022 / Published: 28 October 2022

Abstract

:
Nanomaterials are widely used in different fields, such as microelectronics, industry, and nanocomposites, and they can exhibit unstable deformation behaviour depending on the strain rates. Under strain rates of 10−4–10−1 s−1, the deformation of nanomaterials, unlike the quasi-static deformation of micromaterials, is characterized by the presence of the rate sensitivity as a possible scale phenomenon in dynamic plasticity. In this paper, the relaxation model of plasticity for the prediction of deformation curves at different strain rates is used. It allows us to comprehensively study the effects of strain hardening in a wide range of deformation conditions for coarse-grained materials and nanomaterials. Considering the plastic deformation of the nanosized samples in the early stages, dynamical softening, associated with a generation of new defects, and dynamic hardening, are crucial. The proposed model, using one parameter or the classical hardening law as an example of nanosized gold whisker crystals, tungsten single-crystal pillars, and single-crystalline Au-Ag alloy nanowires, is verified. Calculated sets of parameters of characteristic time, as a parameter of rate sensitivity of a material, and hardening parameters for different nanomaterials are compared. It is shown that the characteristic relaxation times for the single-crystal nanomaterials (100–103 s) are greater than for the nanostructured materials (10−6–10−4 s). Despite the manifestation of dynamics at different strain rates of nanomaterials, single crystal and nanostructured materials, the proposed model can be successfully applied to materials with different degrees of hardening or softening.

1. Introduction

The traditional dynamical effects of stresses at high strain rates of metals [1,2] are well-known, which manifest on the deformation curve as an increase in stresses that significantly exceeds the static yield strength, followed by a sharp drop in yield strength. These effects turn out to be trivial for objects with a critically small size in one or more dimensions, even at quasi-static deformation conditions. One such example is in tensile experiments of metal whiskers [3,4,5], for which the scale effect [4,5,6] is brighter than any others manifested. Their deformation features, which are unusual in terms of mechanical characteristics [2], are often still considered exclusively from a quasi-static point of view as a habitual, dozens-of-times increase in the static yield strength of a material. In some papers [7,8], it has been shown that an alternative dynamical approach to the problem, based on the structural–temporal criterion of plasticity [9,10,11] with the characteristic relaxation time parameter, allows one to predict the increasing dependence of yield stress on strain rate for nano-sized whiskers with a usual set of material characteristics. In this case, the obtained results had good agreement with results found using the dislocation plasticity model [8,12].
Dynamical approaches based on the theory of dislocation [13], which is an alternative to the quasi-static point view on yield stress, have been actively developed [14]. It has been shown that the effects of dislocation starvation are already manifested in whisker nanomaterials [7,13], which normally only contain an insufficient number of mobile dislocations as carriers of plastic deformation. It is interesting to extend the capabilities of the developed approaches to a new region of plasticity of whisker nanomaterials [7], where even more specific deformation mechanisms are considered [15,16]. Nevertheless, according to the molecular dynamics simulation results [17], the plastic flow of nano-sized whiskers is still determined by the dislocation sliding, which may be followed by mechanical twinning with the temperature decrease [13,15].
Equally interesting are the properties of bulk fine-grained metals, such as micro- and nanocrystalline metals [18,19,20]. Although they have rather large macroscopic dimensions, they nevertheless have extremely small internal structural elements of grains, which significantly suppresses plastic deformation inside them and leads to the dominance of new plasticity mechanisms, such as grain boundary sliding [20]. To date, the behaviour of these materials at high strain rates above 102 s−1 has been studied very little [19,21]. A number of models with more complex material rheology [22] proposed in recent years to describe the deformation of nanomaterials, which have replaced numerous “composite” models [19], still mainly concern quasi-static deformation conditions and reflect the effects of different “viscosity” of the grains’ material and their boundaries.
Taking into account the dynamic nature of the deformation process of nanomaterials allows us to develop a unified model for describing nanostructured and nanosized metal samples. Experiments with various single-crystal nanomaterials and nanostructured materials, where both monotonic and non-monotonic deformation dependencies over the range of strain rates are observed, have been actively carried out on various devices: the mini Kolsky bar system [23], the split Hopkinson pressure bar [24,25,26,27], and scanning electron microscopy tests [28].
In this paper, the relaxation model of plasticity [29,30,31] for the prediction of deformation curves of the single-crystal nanomaterials at different strain rates is first used. In our previous research [7,29], the relaxation model of plasticity based on the incubation time for plastic deformation or the characteristic relaxation time was proposed, which is a constant value for the whole range of strain rates and is independent of the details of plastic deformation. This model allowed us to explain and predict the dynamic effects of plasticity, such as the yield drop at strain rates of 102–103 s−1 [29], and to draw the stress–strain relation for both the quasi-static and high-rate loadings. The proposed model, using one parameter or the classical hardening law, as an example of nano-sized gold whisker crystals, tungsten single-crystal pillars, and single crystalline Au-Ag alloy nanowires are verified. For the modelling of our model, we discuss the yield drop effects of nanomaterials at strain rates of 10−4–10−1 s−1 and bulk steel at strain rates of 10−3–103 s−1. Calculated sets of parameters of characteristic time, as a parameter for the rate sensitivity of a material, and hardening parameters for different nanomaterials are compared.

2. Dynamic Models of Plasticity for One-Stage Hardening or Softening Stage

2.1. Relaxation Model of Plasticity

The initiation of plastic flow caused by an arbitrary stress pulse could be determined by the structural–temporal approach [9,10,11,32,33,34] with an integral criterium in the form of:
Y t ,   Σ t 1 , Y t , Σ t = 1 τ t τ t Σ t σ y α d t
Here, Σ(t) is the time function of stresses, τ is the characteristic relaxation time that responds to the strain rate sensitivity of the material, σy is the static yield strength, and α is a dimensionless parameter of the material’s amplitude sensitivity. The independence of the introduced time parameter τ from the deformation process history, Σ(t), and the specific geometry of the sample make it possible to predict, using Equation (1), the material’s yield strength in a large variety of unstable deformation conditions [10]. It is assumed that the incubation time, as a microstructure-dependent characteristic, takes on different values depending on the initial defective structure of the material. Equality by the Equation (1) criterion corresponds to the time t, at which the macroscopic plastic flow begins.
Let us consider the simplest variant of the relaxation plasticity model [7,29,30,31]. Assuming a linear increase in strain during deformation ε(t) = ε ˙  t H(t), where H(t) is the Heaviside step function, we introduce a dimensionless relaxation function 0 < γ(t) ≤ 1 in the form of:
γ t , Σ t = 1 , Y t , Σ t 1 Y t , Σ t 1 / α , Y t , Σ t > 1
The equality γ(t) = 1 in Equation (2) describes the accumulation of elastic energy inside the material in the absence of plastic stress relaxation, which occurs over time, not exceeding the onset time t of the macroscopic plastic flow.
The beginning of the decrease in the relaxation function in the range of 0 < γ(t) < 1 corresponds to the transition process in the material to a new stage of plastic flow. During the plastic deformation time tt, the condition for function γ(t) is satisfied in the following form:
γ t , Σ t Y t , Σ t = 1 .
It is important to note that the amplitude sensitivity parameter α equal to one [8,29] for pure metals and greater than one for alloys, some steels, or materials prone to mechanical twinning [10].
Τhe stress Σtrue(t) acting in the deformable sample at tt is defined as:
σ t r u e t , Σ t = G γ t , Σ t 1 β ε t
where G is the material shear modulus and β is a scalar parameter that allows describing the degree of hardening of the material [7] (0 < β < 1), softening (−1 ≤ β < 0) and perfect plasticity (β = 0). Considering the stages of elastic and plastic deformation separately, we can obtain, using Equations (3) and (4), the general stress–strain dependence at a constant strain rate as
σ t r u e t , Σ t = G ε t , t < t , G ε t γ t , Σ t 1 β , t t .
The two parameters of α and τ are determined from the dependence of the yield stress on the strain rate obtained from a set of deformation curves over a wide range of strain rates. In general concepts of any two deformation curves with different strain rates, there are three measurable quantities: the yield stress, the distance between the curves at the hardening stage, and the hardening angle. A unique set of three parameters of α, τ, and β is optimal (minimal) since, for any two deformation curves with different strain rates, three reactions of a material to a load are observed: amplitude (characterized by α), rate (characterized by τ), and hardening (characterized by β). Three limiting cases, α = 1, τ = 0, and β = 0, for each of the parameters describe three cases of insensitivity to amplitude, velocity, and hardening, respectively. Technical aspects of the selection of the α, τ, and β parameters for plotting strain diagrams are discussed in detail elsewhere [31].
According to Equation (5), the specific form of the relaxation function γ(t), the parameter β, and the onset time of the plastic flow t determine the entire deformation curve. In turn, the relaxation function depends on the stress history Σ(t) and is determined by Equation (2) with a static yield strength Σy, a parameter of characteristic relaxation time τ and, for some materials, an additional stress amplitude sensitivity parameter α; the onset time of plastic flow initiation t is determined by the criterion of Equation (1) with the same set of parameters as in the relaxation function. An explicit analysis of the role of material hardening (β > 0 or Σy = Σy(t)) and softening (β < 0) effects in various cases of dynamic plasticity is discussed below, with a particular focus on the deformation of nanomaterials.

2.2. Relaxation Model of Plasticity with Classical Hardening Law

For most metals, strain hardening can be written in an empirical way using the Ludwik–Hollomon equation [35,36]. Using a power law for the static yield strength:
σ y t , ε p l t = σ y 0 + K ε p l n t
where σ y 0 is the static yield strength at zero plastic deformation and εpl is plastic strain. In our model, the stresses under the integral sign in the plasticity criterion Equation (2) are divided by the value of static yield strength shown in Equation (6). Thus, the increase in the value of Σy during plastic strain leads to a decrease in the value of the integral in the relaxation function:
γ S H t , Σ t = 1 , 1 τ t τ t Σ t σ y 0 α d t 1 1 τ t τ t Σ t σ y 0 + K ε p l n t α d t 1 / α , 1 τ t τ t Σ t σ y 0 α d t > 1
σ t r u e S H t , Σ t = G ε t , t < t , G ε t γ S H t , Σ t , t t .
In this case, it is necessary to select the hardening power parameter n and the coefficient K every time, dependent on the deformation process and the type of material. For most materials, these are tabular data, and this has been found in numerous experiments [35,36].

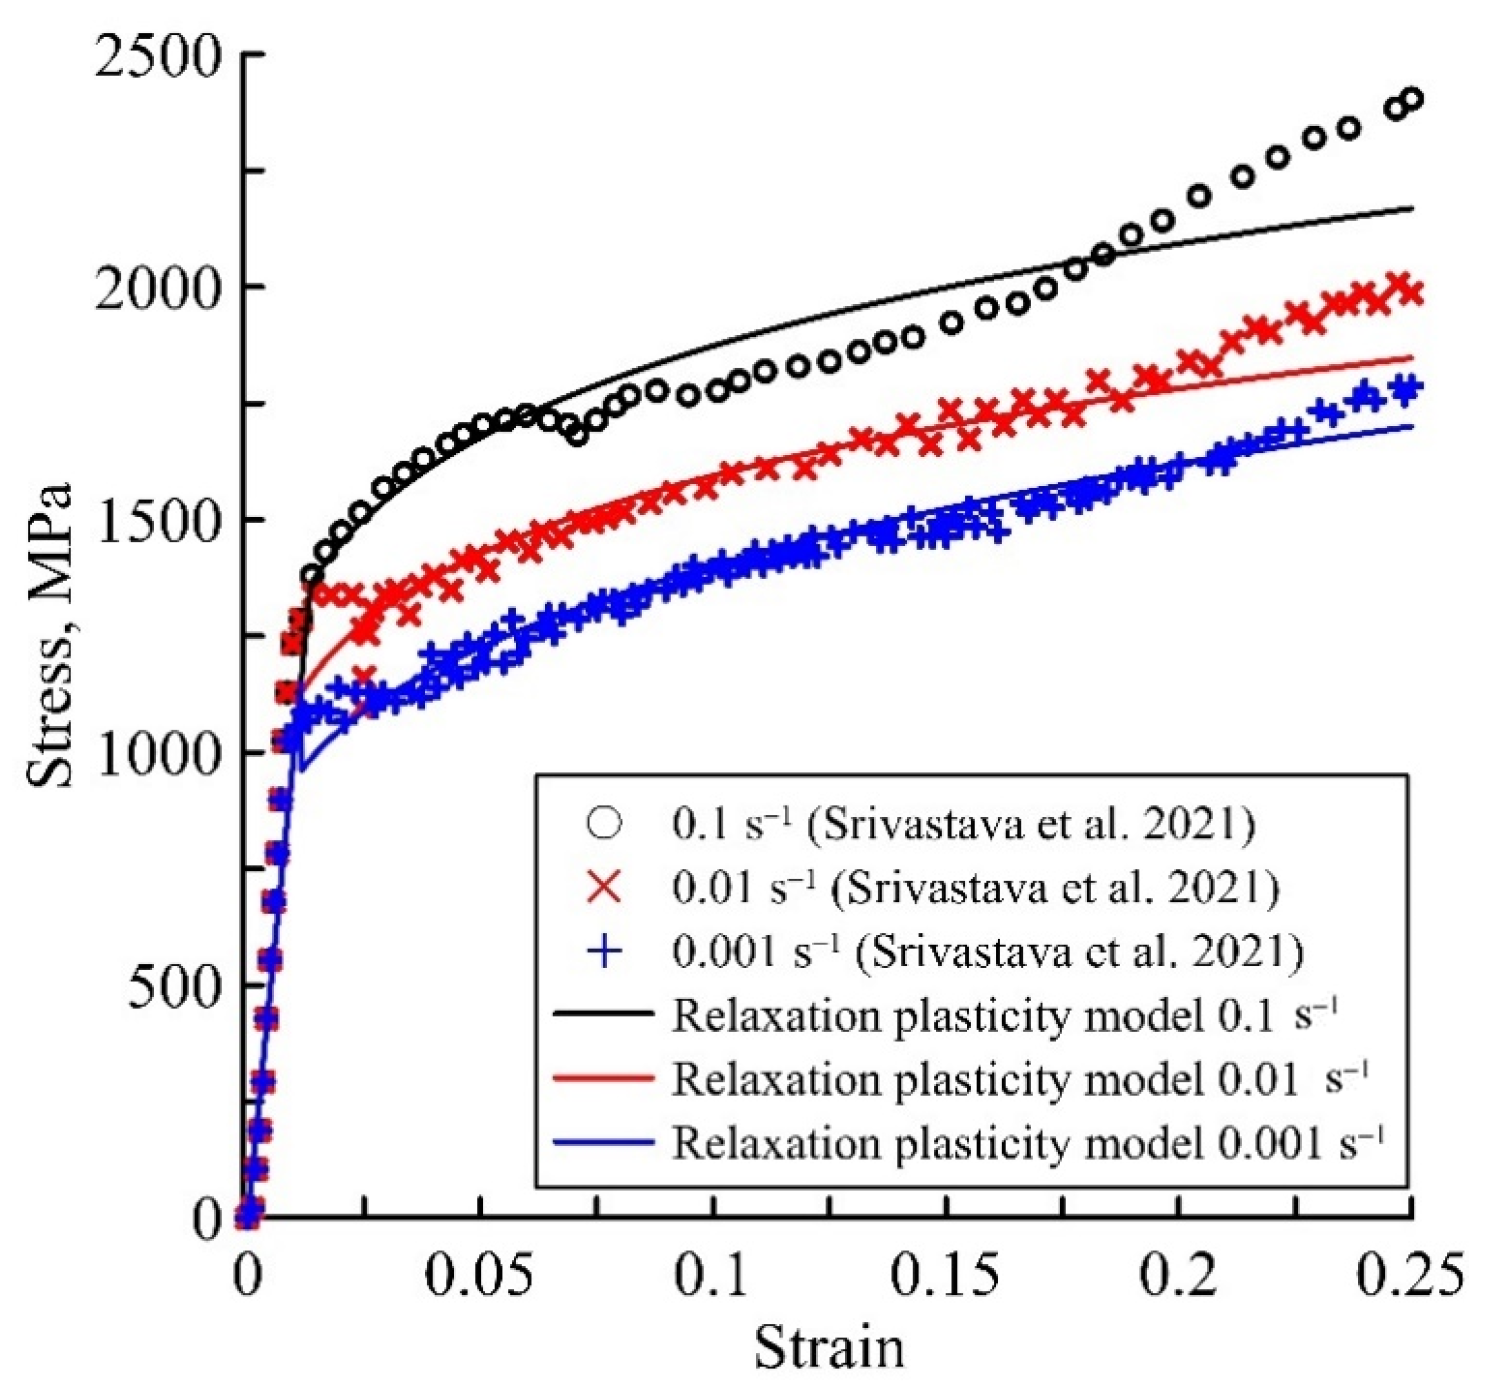
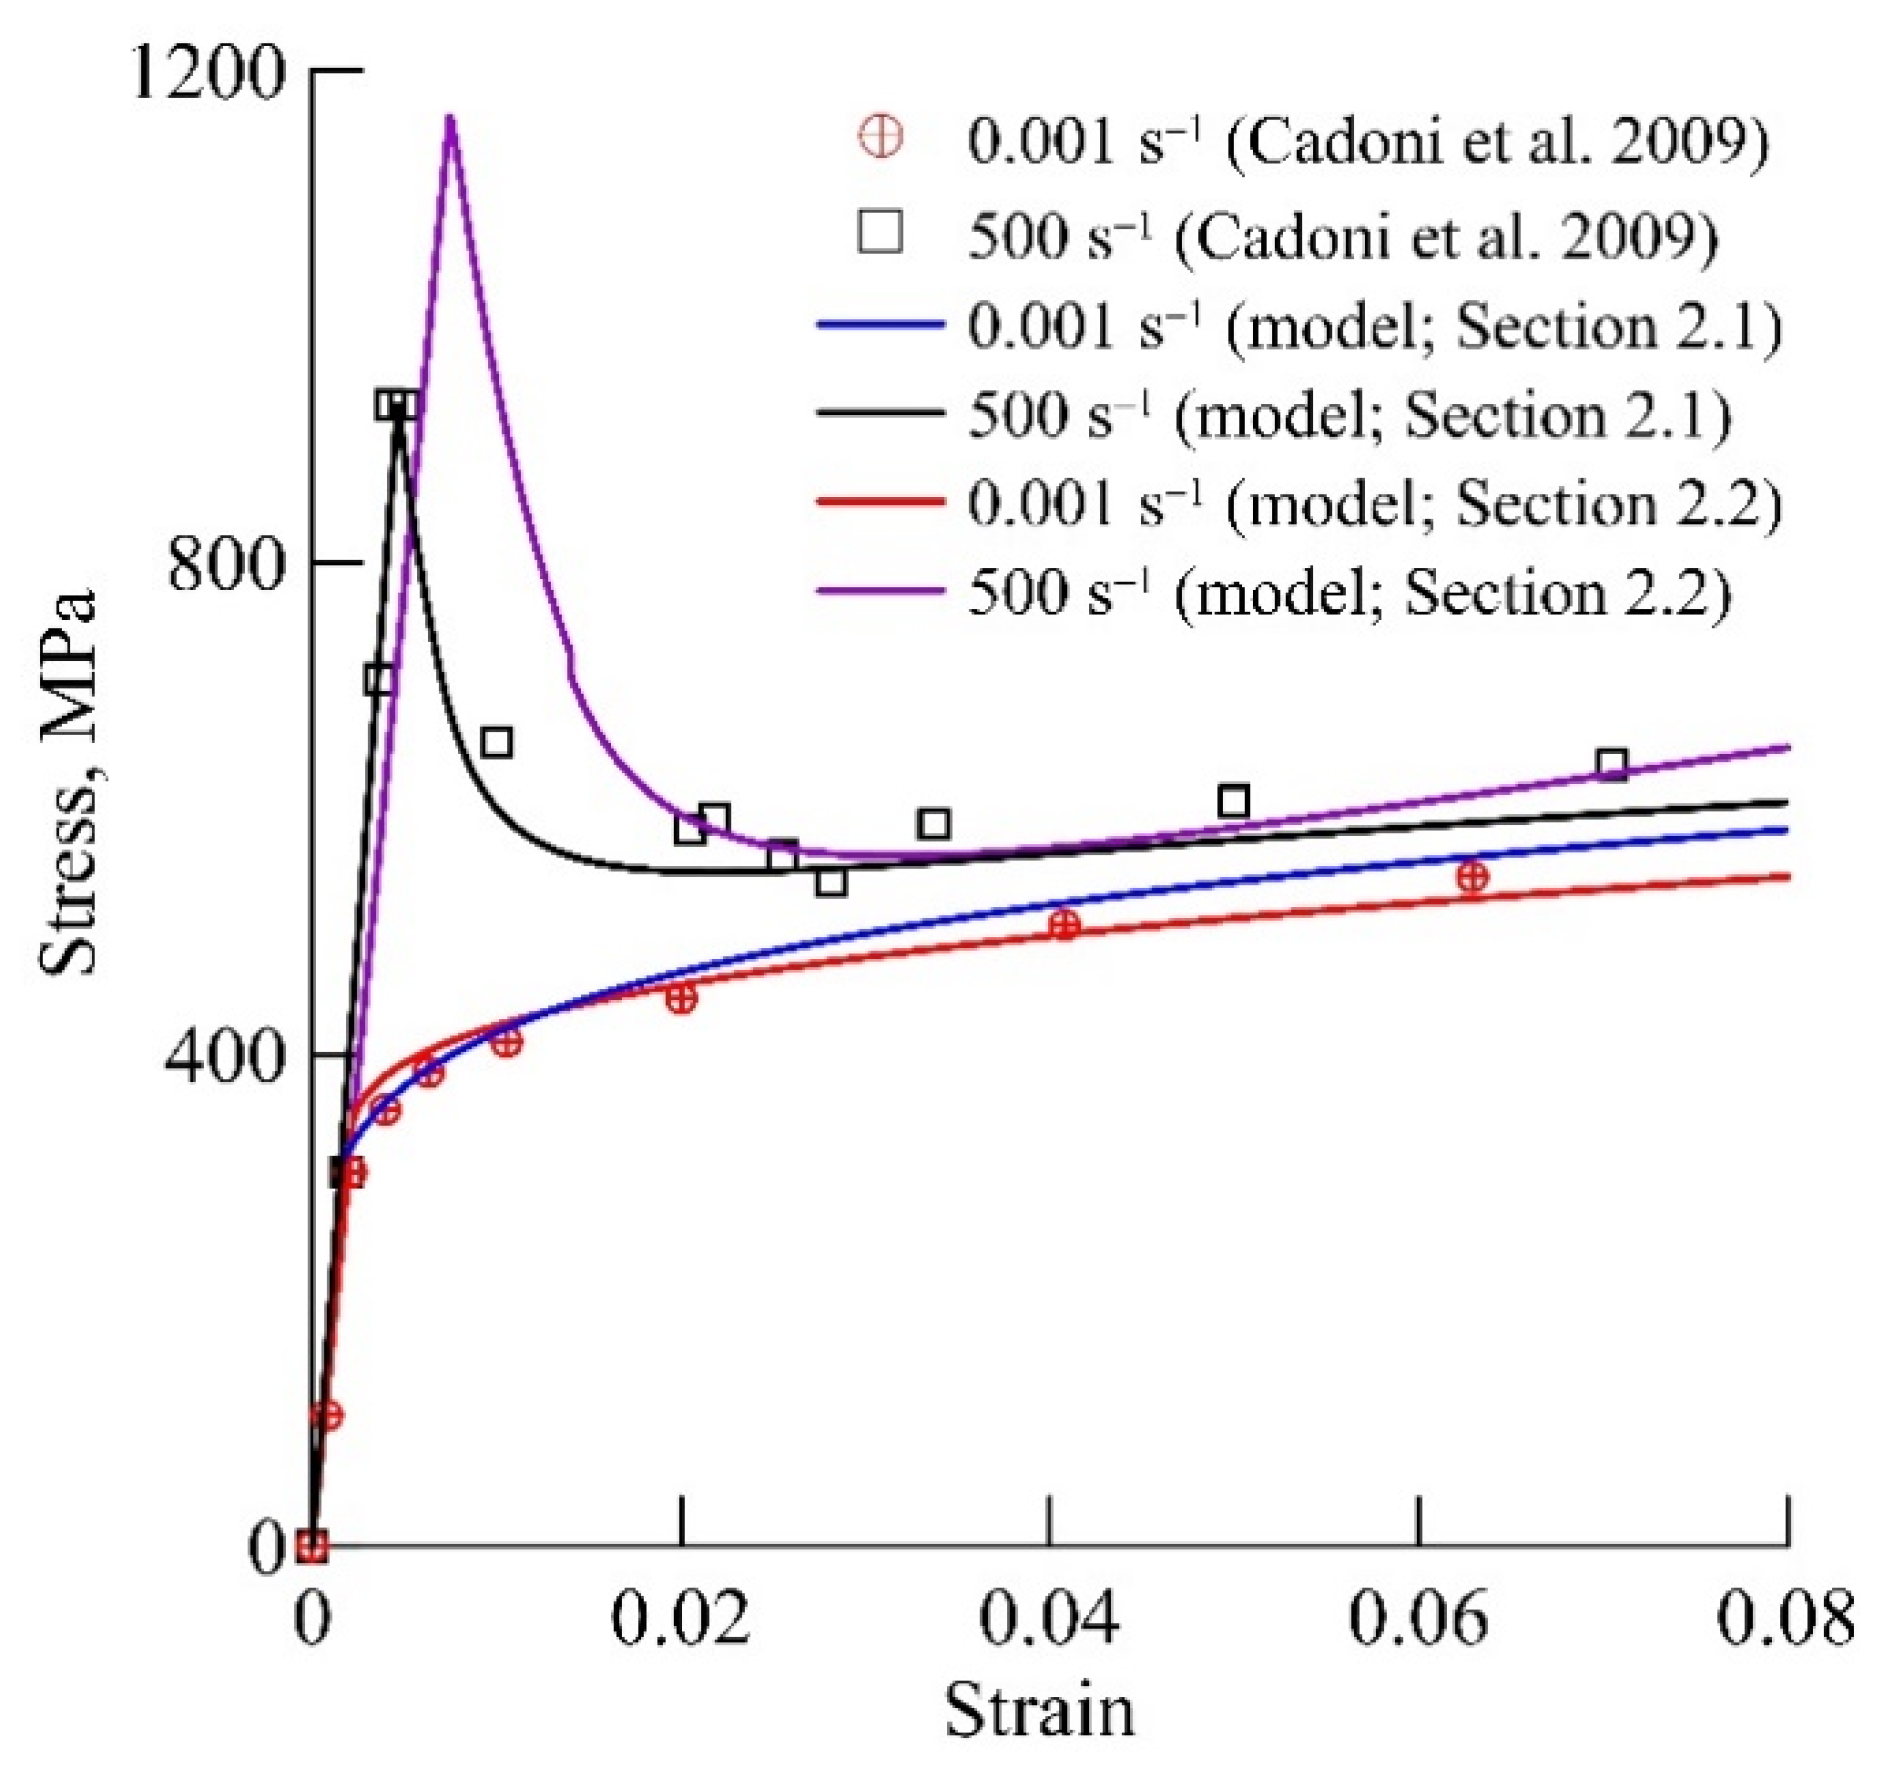
3. Verification of Model with Experiments on Nanomaterials at Strain Rates of 10−4–10−1 s−1

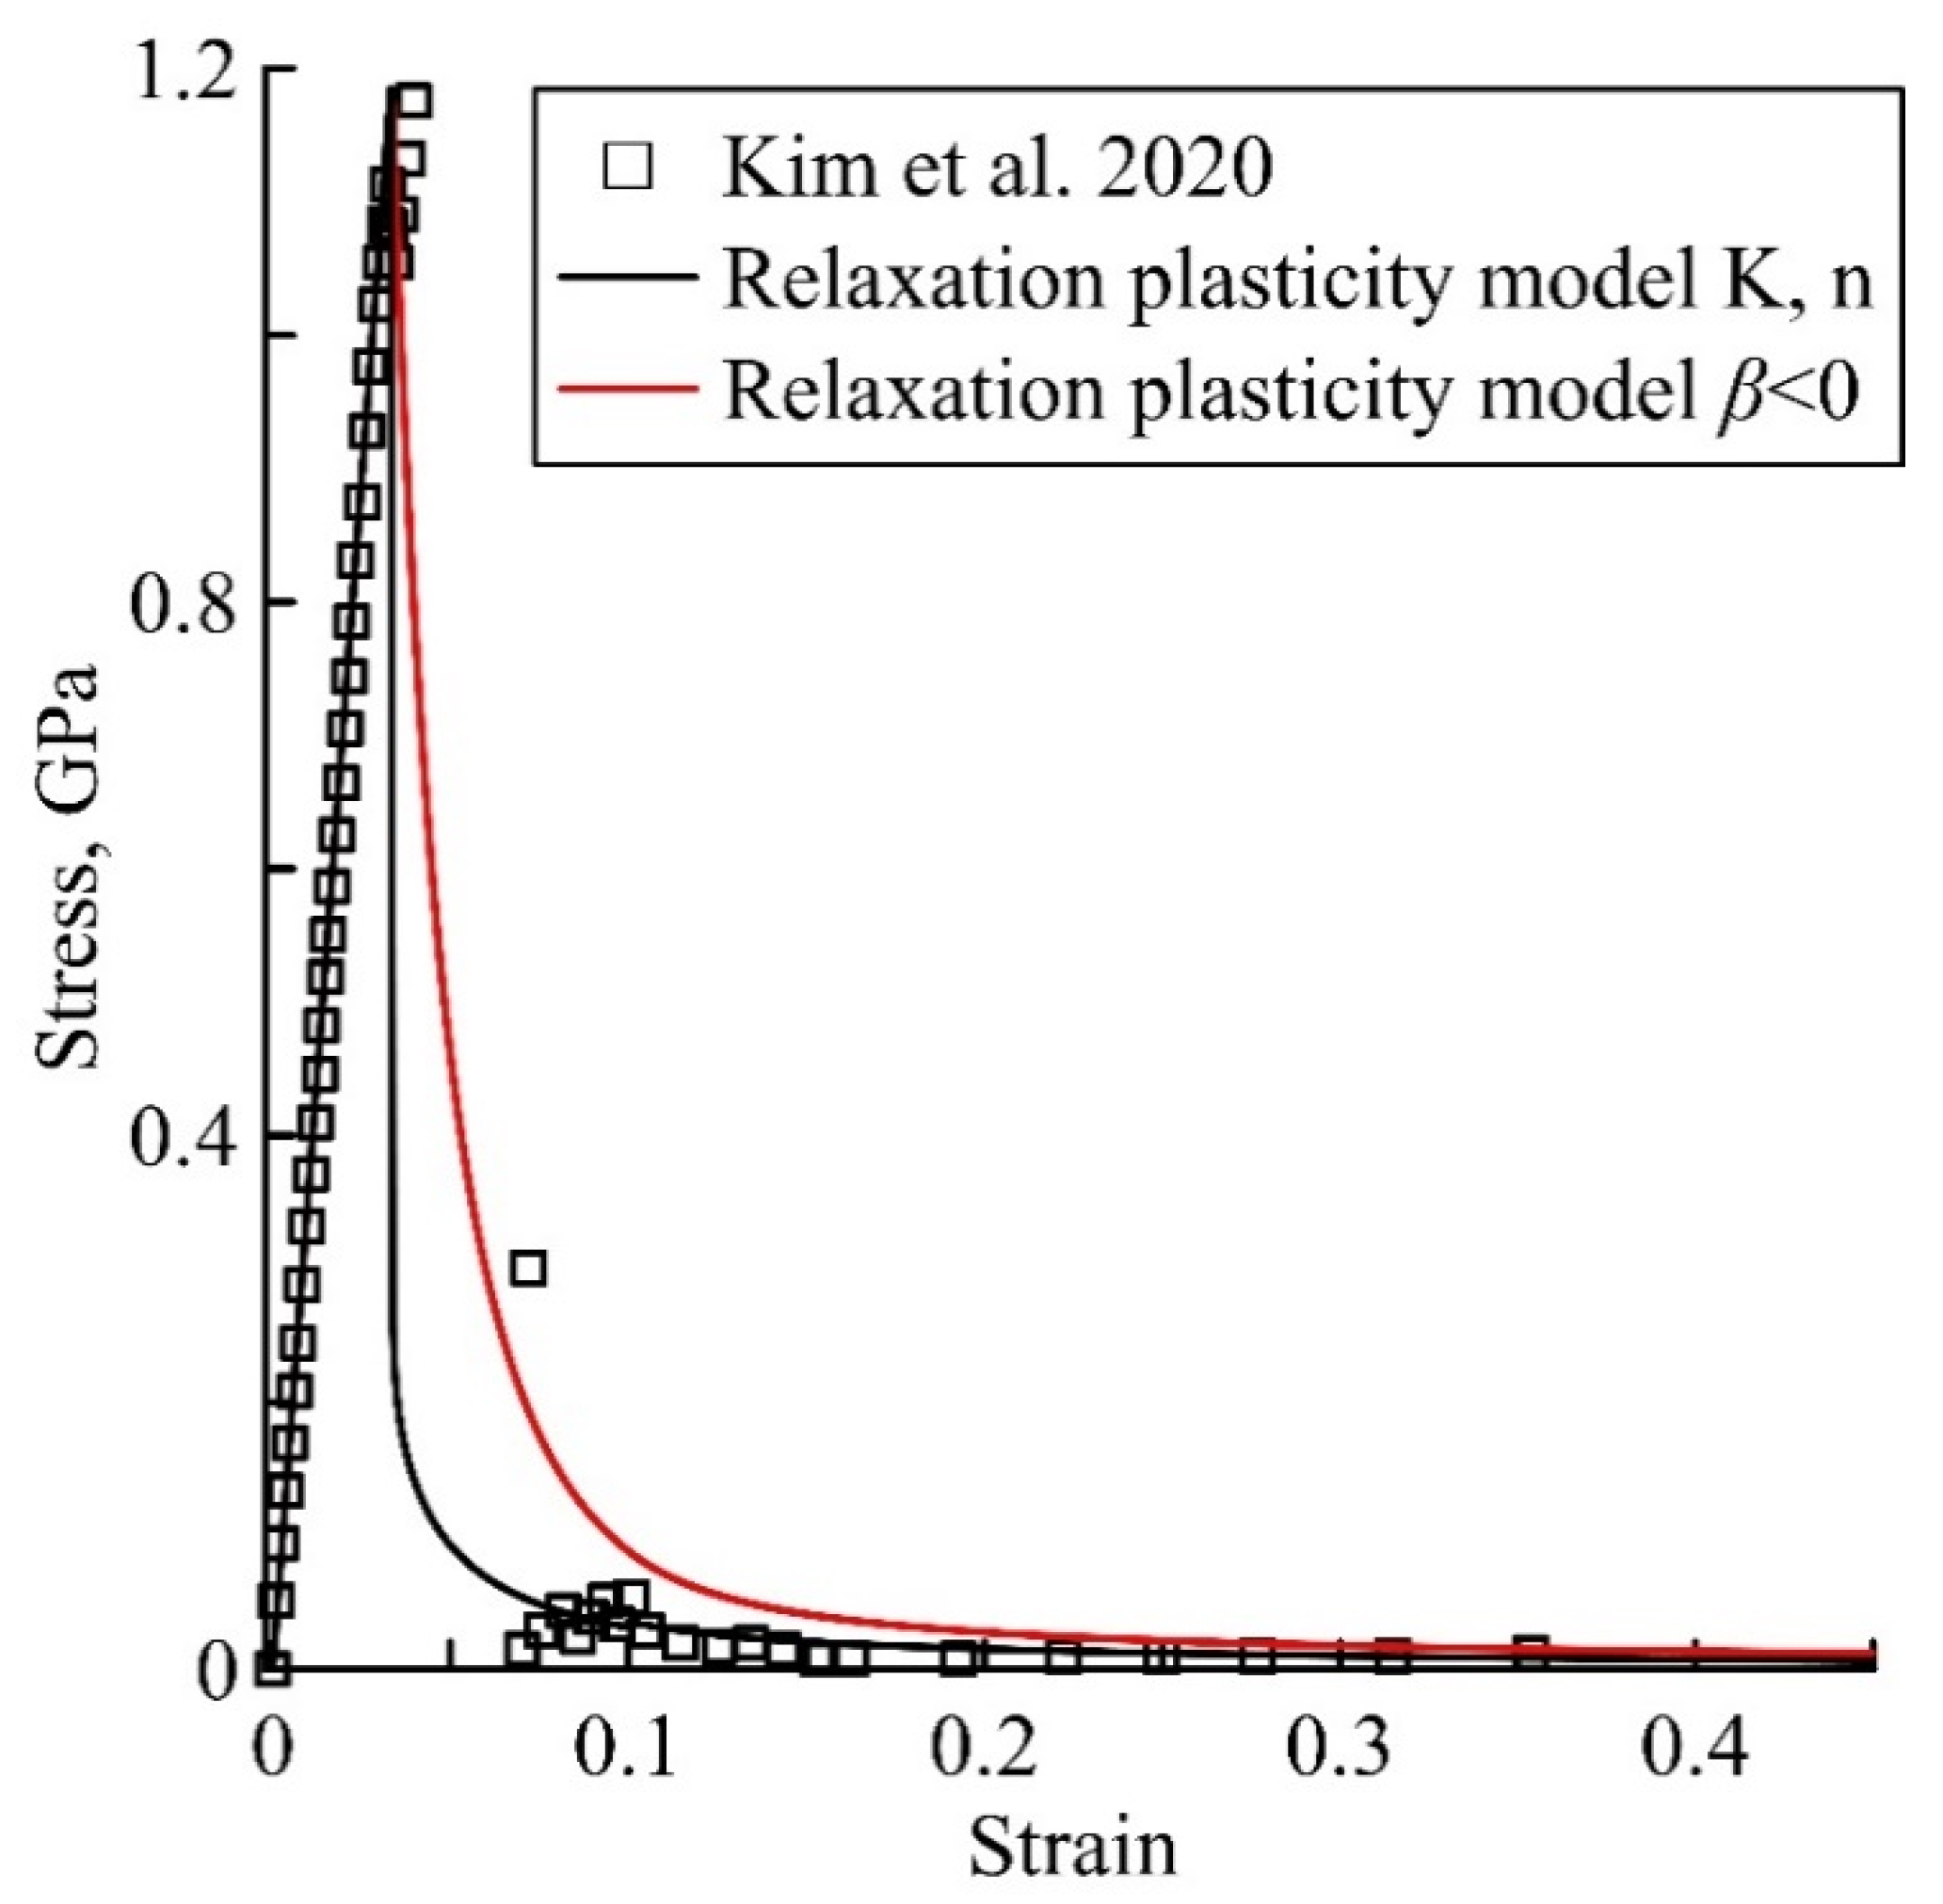
3.1. Non-Monotonic Deformation Curves of Nanomaterials

Let us consider the first results of modelling of the deformation behaviour of nano-sized gold whisker crystals [28] at a strain rate of 10−4 s−1 and tungsten single-crystal pillars [25] at a strain rate of 10−3–10−1 s−1 based on our model (Section 2.1). In this case, the processing times are extremely short, and plasticity is an unsteady process inside the nano-sized volumes of material. The deformation curves of gold whisker nanomaterials [28] for different grain sizes of 55 nm, 85 nm, 44 nm, and 126 nm, plotted on the model (Section 2.1), with the calculated sets of parameters from Table 1 are shown in Figure 1. Tensile experiments [28] at a strain rate of 10−4 s−1 were carried out using scanning electron microscopy. The theoretical monotonic deformation curves of the tungsten single-crystal pillars [25], predicted by the model (Section 2.1) with the set of parameters α = 11, τ = 8 s, and β = 0.23, are shown in Figure 2. The stages of hardening of nano-sized gold whisker crystals at a strain rate of 10−4 s−1 and tungsten single-crystal pillars at a strain rate of 10−3–10−1 s−1 are in good agreement with the experimental data [25,28].
It is interesting to note that the characteristic relaxation times here range from 200 to 600 s for nano-sized gold whisker crystals, which is 9–12 orders of magnitude more than the values usual for ordinary macroscopic metal samples, even under high-strain-rate deformation conditions [8,29]. The calculated characteristic times of gold whiskers are also 1–2 orders of magnitude greater than the characteristic times of tungsten single-crystal pillars. The inflection points for each of the theoretical deformation curves shown in Figure 1 are clearly visible as a transition to the plastic deformation regime. The proposed dynamic model describes the inflection point well, giving the time of plastic yielding onset.
The possibilities of predicting the hardening process in terms of one (Section 2.1) or two parameters (Section 2.2) are compared using examples of bulk steel [37] (Figure 3) and single crystalline Au-Ag alloy nanowires [24] (Figure 4). The theoretical nonmonotonic deformation curves of the bulk steel [37], predicted by the models (Section 2.1 and Section 2.2) with sets of parameters of α = 1, τ = 14 μs, and β = 0.1 for the model in Section 2.1 and α = 1, τ = 14 μs, K = 1.3 GPa, and n = 0.6 for the model in Section 2.2, are shown in Figure 3. Both models successfully predict the hardening at the strain rate ε ˙ = 0.001 s−1 and the softening at the strain rate ε ˙ = 500 s−1. Deformation curves of the single-crystal Au-Ag alloy nanowires plotted on the two models (Section 2.1 and Section 2.2) with the parameter sets of α = 1, τ = 20 s, and β = −0.69 for the model in Section 2.1 and α = 1, τ = 20 s, K = −0.2 GPa, and n = 0.03 are presented in Figure 4. Experimental data [24] of the single-crystal Au-Ag alloy nanowires were obtained during tests in a push-to-pull device.
Using the yield criterion Equation (1) with a known characteristic relaxation time parameter τ, the values of the maximum stress can be determined. The yield drop effects are clearly observed in the dynamic model at a high strain rate of 103 s−1 (upper curve) for steel (Figure 3) and a low strain rate of 0.5 × 10⁻³ s−1 for the single crystalline Au-Ag alloy nanowires. At the same time, the yield drop effect is not observed at a quasi-static strain rate of 5 × 10⁻² s−1 (bottom curve). It is remarkable that the characteristic relaxation time of steel is only 14 µs, which is not down to hundredths or tenths of seconds, like for the single-crystal nanomaterials shown in Figure 1, Figure 2 and Figure 4.
A hardening of the material in the static deformation curve and a softening of the material in the dynamic deformation curve in Figure 3 are observed. Irreversible deformation of the steel, shown in Figure 3, is satisfactorily described by the model (Section 2.2) with parameters K = 1.3 GPa and n = 0.6. The softening process on the dynamic curve, shown in Figure 4, is predicted by the parameters of the model (Section 2.2) with K = −0.2 GPa and n = 0.03. The model in Section 2.2 successfully predicts all stages of the deformation curve, except for the points immediately after the yield drops. In fact, in this case, we only show that the use of the usual hardening law in the relaxation function γSH (t) allows us to consider the model in Section 2.2 with two classical hardening parameters as an alternative approach to the model in Section 2.1 with one hardening parameter.

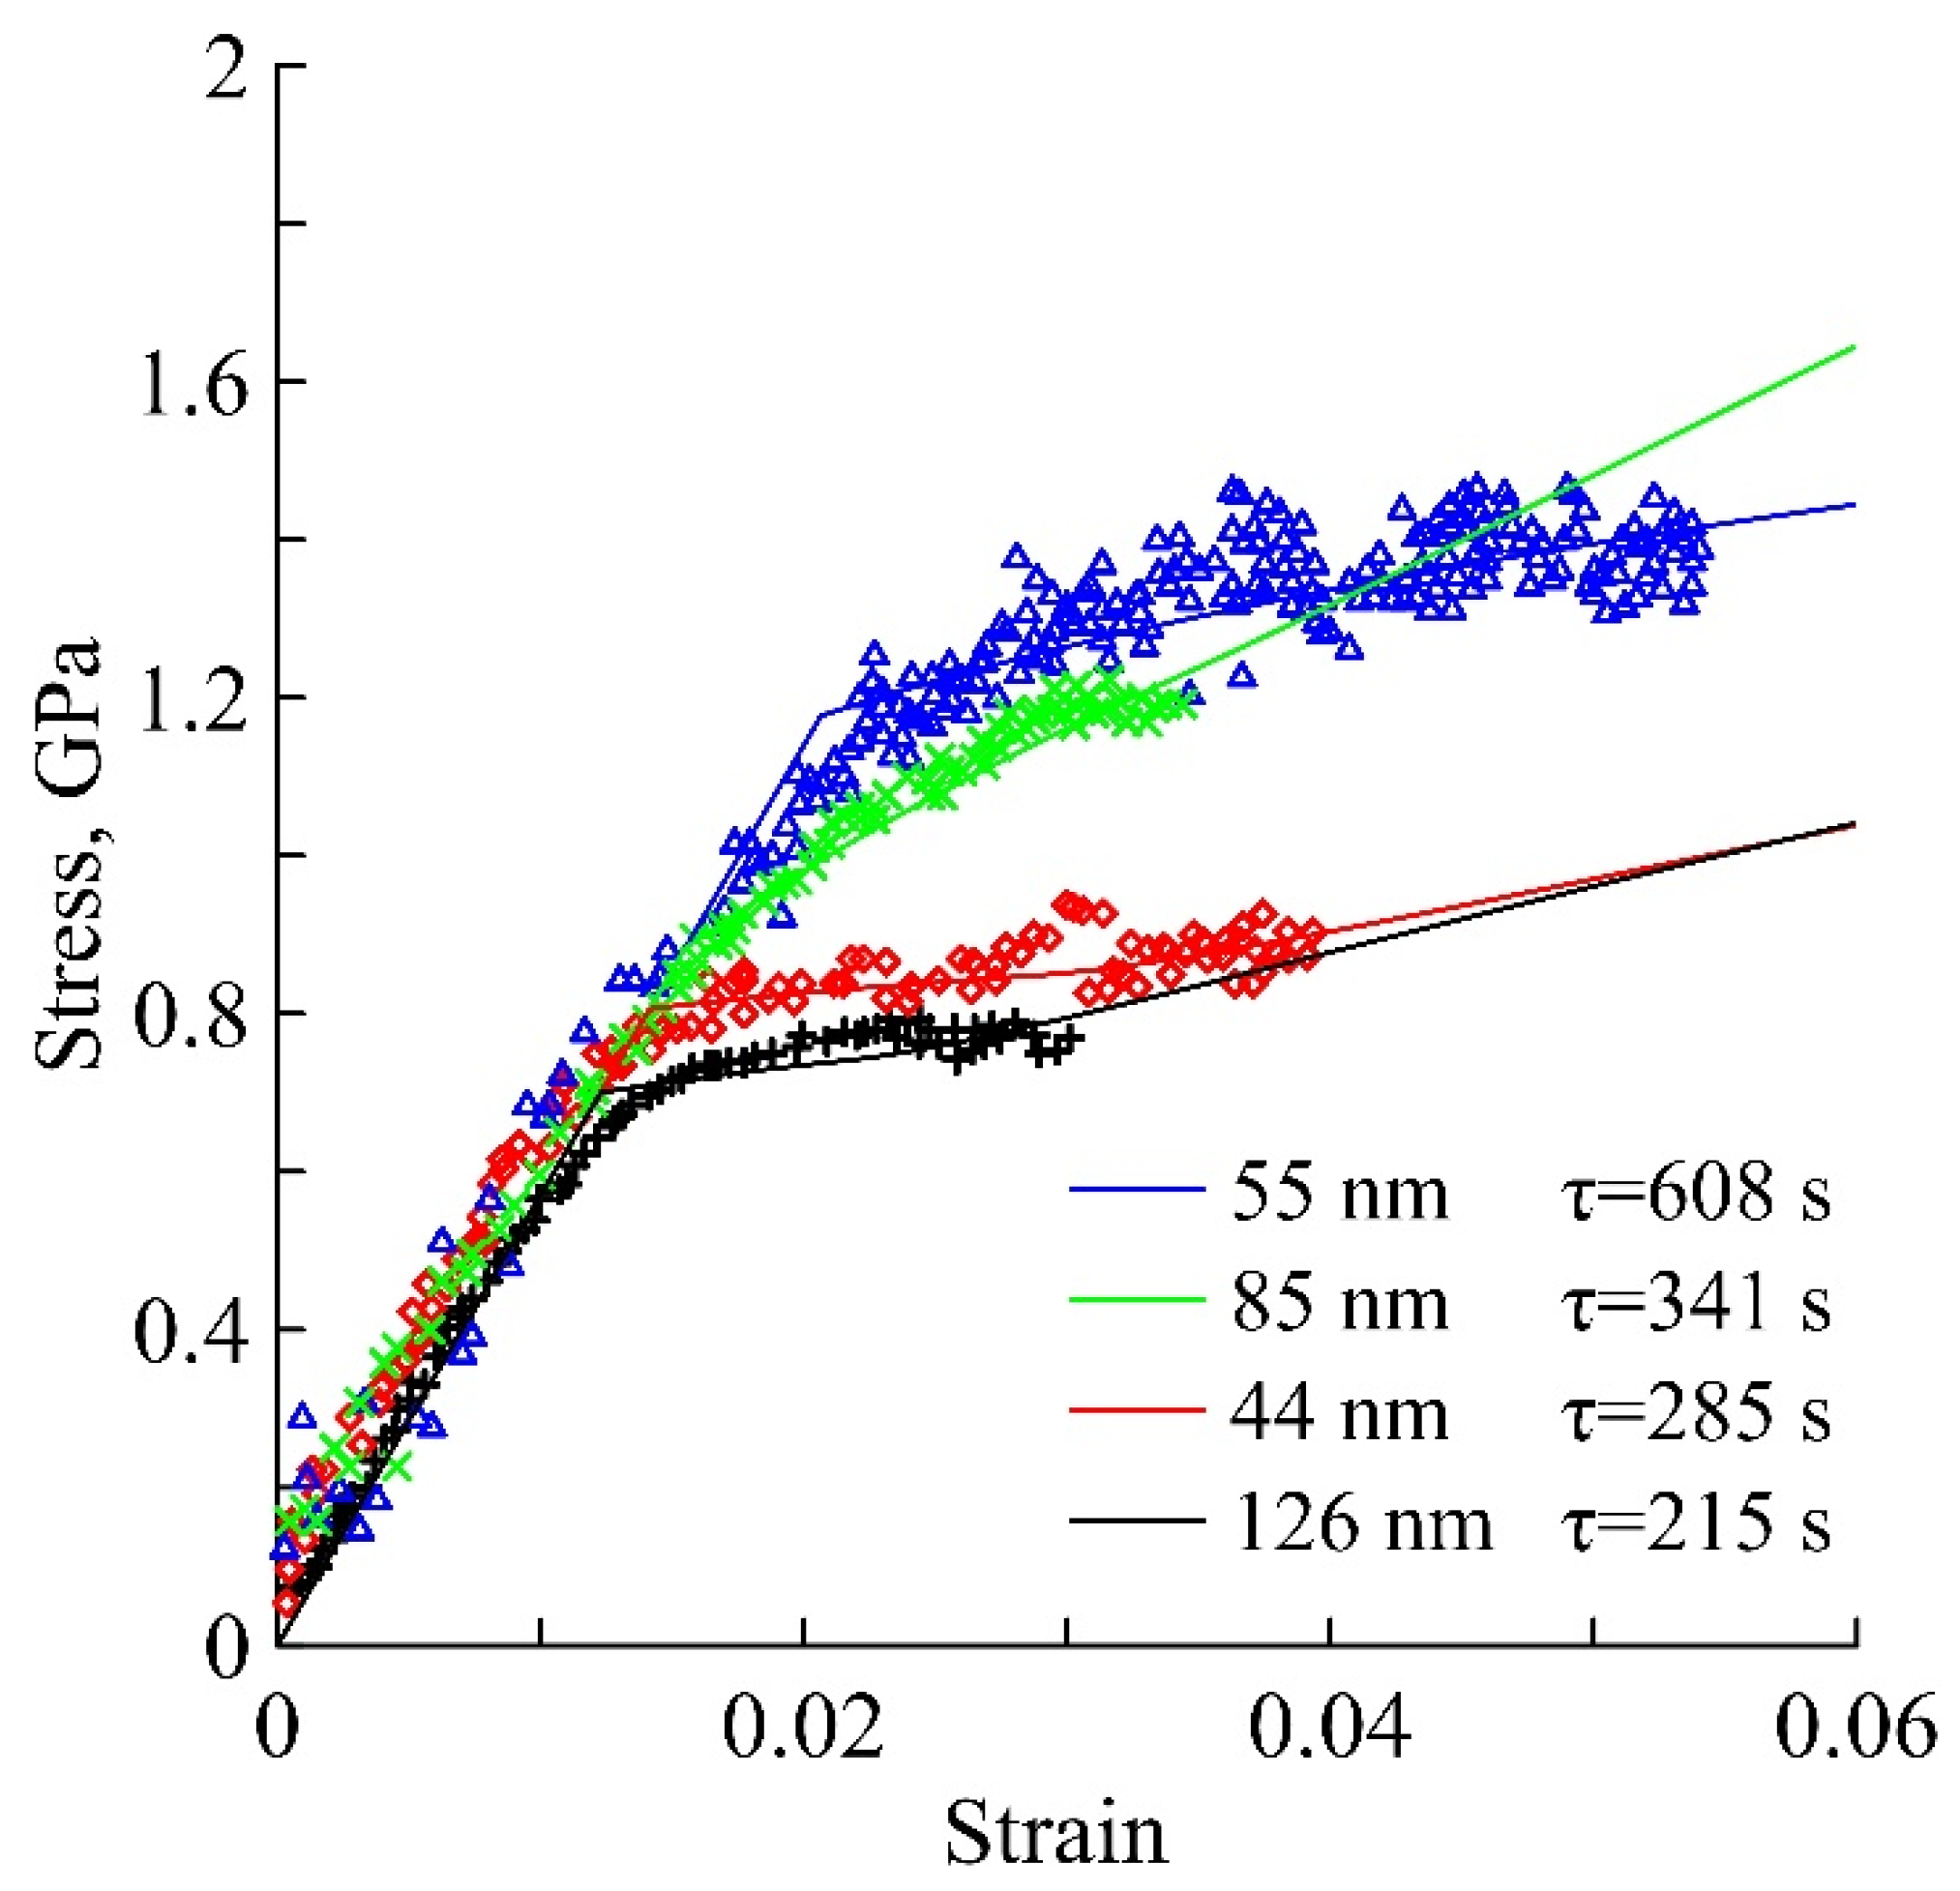
3.2. Characteristic Relaxation Times and Hardening Parameters for Nanomaterials

The influence of sample size on the definition of the dynamic characteristics of materials can be expressed in the differences in the characteristic relaxation times of single-crystal nanomaterials and coarse-grained materials by hundreds and thousands of seconds. This fact contrasts sharply with the mechanical behaviour of bulk nanostructured materials. Their characteristic relaxation times are in the order of microseconds, which is several times greater than that of their coarse-grained counterparts [8]. In Table 2 and Table 3, typical characteristic relaxation times of various single-crystal nanomaterials and nanostructured materials in comparison with sample sizes are listed. Additional calculations of the parameters of the model (Section 2.1) for Table 3 approach were performed based on experimental data of the nanocrystalline tantalum [23] and nanostructured Cu-Al alloy [38]. As a result, the characteristic relaxation times with a sample size are reduced.
The characteristic relaxation time parameter is a structural–temporal parameter. On the one hand, like all model parameters, it does not depend on the strain rate. On the other hand, for materials composed of the same chemical substances but with different structures, the values of the characteristic relaxation times are different. The relationship between the obtained characteristic relaxation times and the relaxation times [29,39] associated with the dominant plasticity mechanisms can be established from the expressions in Appendix A. Unlike the proposed model, the relaxation times in Appendix A can also be applied for certain values of strain rates.
Since the proposed model is phenomenological, no matter what mechanism of plasticity occurs in the material, the characteristic relaxation time can be calculated. In other words, if the material is dominated by not one but two or more plasticity mechanisms, then the determination of the characteristic relaxation times using the model proposed in this work becomes preferable. This is due to the fact that the characteristic relaxation time is responsible for the rate sensitivity of the material to the load, thereby taking into account the unstable nature of the deformation dependence.
In this paper, we only point out the different order of characteristic relaxation times of nanocrystalline (nanostructured) and nanosized materials. Thus, despite the variation in the grain size of nanomaterials in Table 2 and Table 3, the characteristic time can be of the order of ns and μs. This complicates the construction of the dependence of the characteristic relaxation times on the grain size and is more tied to the method of obtaining a nanostructure.
At low and high rates of plastic flow, including the deformation of nano-sized whiskers, a single hardening parameter β may be used (Table 2 and Table 3). In the case of nanoscale whisker crystals, these are deformed at strain rates of 10−4 s−1 at β = 0.6 [28]. At relatively low strain rates of sufficiently bulk metal samples, it seems preferable to use the classical Ludwik-Hollomon equation [35,36] for the material’s hardening, which can also be included in the used model of plasticity. The effects of dislocation kinetics [17] at the initial stages of the deformation process lead to a very abrupt stress decrease immediately after the yield point, which can be described in terms of additional dynamical softening of the material. The parameter β, depending on the features of the deformation process, with its positive or negative values, allows us to describe both strain hardening and softening of the material. Thus, the proposed relaxation model of plasticity allows one to predict all stages of the deformation curve of metals in a wide range of their possible sizes and strain rates.

4. Conclusions

Theoretical deformation curves at strain rates of 10−4–10−1 s−1 for the single-crystal nano-whiskers, nanowires, and nanopillar were predicted by the relaxation model of plasticity. The process of hardening of the nanosized gold whiskers crystals with sizes of 44, 55, 85, and 126 nm at a strain rate of 10−4 s−1 with an average hardening parameter β = 0.6 was modelled. A monotonic increase in the yield stress and subsequent strong hardening of tungsten single-crystal pillars are simulated as a function of strain rates. Verification of the model in Section 2.1 and the model in Section 2.2 showed that both methods can be used to describe the processes of the hardening and the softening for the single-crystal nanomaterials. Based on the analysis of the obtained sets of parameters of the single-crystal nanomaterials with the parameters of nanostructured materials, the following conclusions can be drawn:
  • The relaxation model of plasticity can be applied to single-crystal nanomaterials with different values of characteristic relaxation times in the range of 10–600 s;
  • The value of the hardening parameter for single-crystal nanomaterials is much higher than for nanostructured materials;
  • Characteristic relaxation times of single-crystal nanomaterials were in the order of microseconds, which is several times greater than that of their coarse-grained counterparts;
  • The use of the usual hardening law in the relaxation function γSH (t) allows us to consider the model in Section 2.2 with two classical hardening parameters as an alternative approach to the model in Section 2.1 with one hardening parameter;
  • The characteristic relaxation times with a sample size were reduced;
  • The softening and hardening effects that occur depending on the material at different strain rates are predicted by the proposed model in Section 2.1 with a fixed set of parameters (α, τ, and β).
The revealed features of nonmonotonic irreversible deformation for the various nanomaterials can be used for further theoretical and experimental studies to predict the hardening and softening processes depending on the strain rates.

Author Contributions

Conceptualization, Y.P., N.S. and E.B.; methodology, E.B., N.S. and Y.P.; validation, E.B., N.S. and Y.P.; formal analysis, E.B. and N.S.; data curation, N.S.; writing—original draft preparation, E.B. and N.S.; writing—review and editing, N.S. and E.B.; supervision, Y.P. All authors have read and agreed to the published version of the manuscript.

Funding

The study was supported by the Russian Science Foundation (RSF grant 22-11-00091).

Institutional Review Board Statement

Not applicable.

Informed Consent Statement

Not applicable.

Data Availability Statement

Not applicable.

Conflicts of Interest

The authors declare no conflict of interest.

Appendix A

Consider the examples of the definition of the relaxation time as a function of the plasticity mechanism, which are consistent with characteristic relaxation time. The relaxation time for the dominant dislocation plasticity mechanism [7,8,29,39] at quasi-static loading ~10−4–10−3 s−1 is given as:
τ D P l o w = B D ρ D G b 2
where BD is the phonon dragging force [40] ( B D = ν D / 2 ρ b 2 , ν D ~1013 s−1 is a frequency close to the Debye frequency, ρ is the material density), ρD is the scalar dislocation density, and b is the Burgers vector. The relaxation time for the dominant grain boundary sliding for nanocrystalline materials [8,39] at high strain rates ~107 s−1 is:
τ G B h i g h = k b T d 6 G b ν D V s exp U b k b T
where k b is the Boltzmann constant, T is the temperature, d is the grain size, U b is the activation energy, and V s is the activation volume for the considered process ( V s ~ b 3 ). The relaxation time for the dominant grain boundary sliding for [8,29,39] at medium strain rates ~103–106 s−1 is:
τ G B m e d = k b T d 3 40 G b 3 D c δ
where D c is the diffusion coefficient and δ is the width of field of the grain boundary self-diffusion.

References

  1. Armstrong, R.W.; Walley, S.M. High strain rate properties of metals and alloys. Int. Mater. Rev. 2008, 53, 105–128. [Google Scholar] [CrossRef]
  2. Swegle, J.W.; Grady, D.E. Shock viscosity and the prediction of shock wave rise times. J. Appl. Phys. 1985, 58, 692–701. [Google Scholar] [CrossRef]
  3. Dehm, G. Miniaturized single-crystalline fcc metals deformed in tension: New insights in size-dependent plasticity. Prog. Mater. Sci. 2009, 54, 664–688. [Google Scholar] [CrossRef]
  4. Cui, Y.; Po, G.; Ghoniem, N. Temperature insensitivity of the flow stress in body-centered cubic micropillar crystals. Acta Mater. 2016, 108, 128–137. [Google Scholar] [CrossRef] [Green Version]
  5. Greer, J.R.; De Hosson, J.T. Plasticity in small-sized metallic systems: Intrinsic versus extrinsic size effect. Prog. Mater. Sci. 2011, 56, 654–724. [Google Scholar] [CrossRef]
  6. Colorado, H.A.; Navarro, A.; Prikhodko, S.V.; Yang, J.M.; Ghoniem, N.; Gupta, V. Ultrahigh strain-rate bending of copper nanopillars with laser-generated shock waves. J. Appl. Phys. 2013, 114, 233510. [Google Scholar] [CrossRef]
  7. Petrov, Y.V.; Borodin, E.N. Relaxation mechanism of plastic deformation and its justification using the example of the sharp yield point phenomenon in whiskers. Phys. Solid State 2015, 57, 353–359. [Google Scholar] [CrossRef]
  8. Selyutina, N.S.; Borodin, E.N.; Petrov, Y.V. Structural–Temporal Peculiarities of Dynamic Deformation of Nanostructured and Nanoscaled Metals. Phys. Solid State 2018, 60, 1813–1820. [Google Scholar] [CrossRef]
  9. Gruzdkov, A.; Petrov, Y.V.; Smirnov, V.I. An invariant form of the dynamic criterion for yield of metals. Phys. Solid State 2002, 44, 2080–2082. [Google Scholar] [CrossRef]
  10. Gruzdkov, A.; Sitnikova, E.; Morozov, N.; Petrov, Y. Thermal Effect in Dynamic Yielding and Fracture of Metals and Alloys. Math. Mech. Solids 2009, 14, 72–87. [Google Scholar] [CrossRef]
  11. Petrov, Y.V.; Gruzdkov, A.A.; Sitnikova, E.V. Anomalous behavior of yield stress upon an increase in temperature under high strain rate conditions. Dokl. Phys. 2007, 52, 691–694. [Google Scholar] [CrossRef]
  12. Mayer, A.E.; Khishchenko, K.V.; Levashov, P.R.; Mayer, P.N. Modeling of plasticity and fracture of metals at shock loading. J. Appl. Phys. 2013, 113, 193508. [Google Scholar] [CrossRef]
  13. Chang, H.-J.; Segurado, J.; Molina-Aldareguía, J.M.; Soler, R.; Llorca, J. A 3D dislocation dynamics analysis of the size effect on the strength of [1 1 1] LiF micropillars at 300K and 600K. Model. Simul. Mater. Sci. Eng. 2016, 24, 035009. [Google Scholar] [CrossRef] [Green Version]
  14. Brenner, S.S. Tensile Strength of Whiskers. J. Appl. Phys. 1956, 27, 1484–1491. [Google Scholar] [CrossRef]
  15. Brown, J.A.; Ghoniem, N.M. Reversible–irreversible plasticity transition in twinned copper nanopillars. Acta Mater. 2010, 58, 886–894. [Google Scholar] [CrossRef]
  16. Zhang, N.; Zaeem, M.A. Competing mechanisms between dislocation and phase transformation in plastic deformation of single crystalline yttria-stabilized tetragonal zirconia nanopillars. Acta Mater. 2016, 120, 337–347. [Google Scholar] [CrossRef] [Green Version]
  17. Dutta, A. Compressive deformation of Fe nanopillar at high strain rate: Modalities of dislocation dynamics. Acta Mater. 2017, 125, 219–230. [Google Scholar] [CrossRef]
  18. Klusemann, B.; Bargmann, S.; Estrin, Y. Fourth-order strain-gradient phase mixture model for nanocrystalline fcc materials. Model. Simul. Mater. Sci. Eng. 2016, 24, 085016. [Google Scholar] [CrossRef] [Green Version]
  19. Barai, P.; Weng, G.J. Mechanics of very fine-grained nanocrystalline materials with contributions from grain interior, GB zone, and grain-boundary sliding. Int. J. Plast. 2009, 25, 2410–2434. [Google Scholar] [CrossRef]
  20. Borodin, E.; Mayer, A. A simple mechanical model for grain boundary sliding in nanocrystalline metals. Mater. Sci. Eng. A 2012, 532, 245–248. [Google Scholar] [CrossRef]
  21. Borodin, E.N.; Mayer, A.E. Theoretical interpretation of abnormal ultrafine-grained material deformation dynamics. Model. Simul. Mater. Sci. Eng. 2016, 24, 025013. [Google Scholar] [CrossRef]
  22. Upadhyay, M.; Capolungo, L.; Taupin, V.; Fressengeas, C.; Lebensohn, R. A higher order elasto-viscoplastic model using fast Fourier transforms: Effects of lattice curvatures on mechanical response of nanocrystalline metals. Int. J. Plast. 2016, 83, 126–152. [Google Scholar] [CrossRef]
  23. Wei, Q.; Pan, Z.; Wu, X.; Schuster, B.; Kecskes, L.; Valiev, R. Microstructure and mechanical properties at different length scales and strain rates of nanocrystalline tantalum produced by high-pressure torsion. Acta Mater. 2011, 59, 2423–2436. [Google Scholar] [CrossRef] [Green Version]
  24. Kim, W.; Park, K.; Yoo, S.J.; Matteini, P.; Hwang, B.; Kim, B.; Han, S.M. Deformation twinning in Au30Ag70 alloy nanowires under tensile strain. J. Alloy. Compd. 2020, 816, 152586. [Google Scholar] [CrossRef]
  25. Srivastava, P.; Jiang, K.; Cui, Y.; Olivera, E.; Ghoniem, N.; Gupta, V. The influence of nano/micro sample size on the strain-rate sensitivity of plastic flow in tungsten. Int. J. Plast. 2021, 136, 102854. [Google Scholar] [CrossRef]
  26. Rajaraman, S.; Jonnalagadda, K.N.; Ghosh, P. Indentation and Dynamic Compression Experiments on Microcrystalline and Nanocrystalline Nickel; Conference Proceedings of the Society for Experimental Mechanics Series; Springer: Berlin/Heidelberg, Germany, 2013; Volume 1, pp. 157–163. [Google Scholar] [CrossRef]
  27. Wei, Q.; Schuster, B.; Mathaudhu, S.; Hartwig, K.; Kecskes, L.; Dowding, R.; Ramesh, K. Dynamic behaviors of body-centered cubic metals with ultrafine grained and nanocrystalline microstructures. Mater. Sci. Eng. A 2008, 493, 58–64. [Google Scholar] [CrossRef]
  28. Sedlmayr, A.; Bitzek, E.; Gianola, D.S.; Richter, G.; Mönig, R.; Kraft, O. Existence of two twinning-mediated plastic deformation modes in Au nanowhiskers. Acta Mater. 2012, 60, 3985–3993. [Google Scholar] [CrossRef]
  29. Selyutina, N.; Borodin, E.; Petrov, Y.; Mayer, A. The definition of characteristic times of plastic relaxation by dislocation slip and grain boundary sliding in copper and nickel. Int. J. Plast. 2016, 82, 97–111. [Google Scholar] [CrossRef]
  30. Selyutina, N.; Petrov, Y. Comparative Analysis of Dynamic Plasticity Models. Rev. Adv. Mater. Sci. 2018, 57, 199–211. [Google Scholar] [CrossRef]
  31. Selyutina, N.S.; Petrov, Y.V. Instabilities of Dynamic Strain Diagrams Predicted by the Relaxation Model of Plasticity. J. Dyn. Behav. Mater. 2022, 8, 304–315. [Google Scholar] [CrossRef]
  32. Petrov, Y.; Karihaloo, B.; Bratov, V.; Bragov, A. Multi-scale dynamic fracture model for quasi-brittle materials. Int. J. Eng. Sci. 2012, 61, 3–9. [Google Scholar] [CrossRef]
  33. Petrov, Y.V.; Gruzdkov, A.; Bratov, V. Structural-temporal theory of fracture as a multiscale process. Phys. Mesomech. 2012, 15, 232–237. [Google Scholar] [CrossRef]
  34. Gruzdkov, A.A.; Petrov, Y.V. On temperature time correspondence in high-rate deformation of metals. Dokl. Phys. 1999, 44, 114–116. [Google Scholar]
  35. Meyers, M.A.; Chawla, K.K. Mechanical Behavior of Materials, 2nd ed.; Cambridge University Press: Cambridge, UK, 2009; 882p. [Google Scholar]
  36. Kalpakjian, S.; Schmid, S. Manufacturing Processes for Engineering Materials, 5th ed.; Pearson Education: London, UK, 2007; 1040p. [Google Scholar]
  37. Cadoni, E.; D’Aiuto, F.; Albertini, C. Dynamic behavior of advanced high strength steel used in the automobile structures. DYMAT 2009, 1, 135–141. [Google Scholar]
  38. Li, J.; Li, Y.; Huang, C.; Suo, T. Mechanical responses and dynamic failure of nanostructure Cu–Al alloys under uniaxial compression. Mech. Mater. 2017, 114, 147–160. [Google Scholar] [CrossRef]
  39. Borodin, E.; Mayer, A.; Gutkin, M. Coupled model for grain rotation, dislocation plasticity and grain boundary sliding in fine-grained solids. Int. J. Plast. 2020, 134, 102776. [Google Scholar] [CrossRef]
  40. Krasnikov, V.S.; Mayer, A.E. Influence of local stresses on motion of edge dislocation in aluminum. Int. J. Plast. 2018, 101, 170–187. [Google Scholar] [CrossRef]
Figure 1. Deformation curves of nano-sized gold whisker crystals at a strain rate of 10−4 s−1. Symbols are tensile experiments using scanning electron microscopy [28]. Theoretical dependencies, calculated by the model (Section 2.1), are designated by solid curves.
Metals 12 01835 g001
Figure 2. Deformation curves of tungsten single-crystal pillars with a diameter 2000 nm at a strain rate of 10−3–10−1 s−1. Symbols are uniaxial compression experiments using Hysitron PI 85L PicoIndenter date from [25]. Theoretical dependencies, calculated by the model (Section 2.1), are designated by solid curves.
Metals 12 01835 g002
Figure 3. Quasi-static ( ε ˙ = 0.001 s−1) and dynamic ( ε ˙ = 500 s−1) deformation curves of the bulk steel. Symbols are the experimental data from [37]. Theoretical dependencies, calculated by the model (Section 2.1), are designated by black solid curves. Theoretical dependencies, calculated by the model (Section 2.2), are designated by red solid curves. Parameters hardening are K = 1.3 GPa, n = 0.6 for red curves and β = 0.1 for black curves.
Metals 12 01835 g003
Figure 4. Deformation curves of the single crystalline Au-Ag alloy nanowires. Symbols are tensile experiments using the push-to-pull device data from [24]. Theoretical dependencies, calculated by the model (Section 2.1), are designated by red solid curves. Theoretical dependencies, calculated by the model (Section 2.2), are designated by black solid curves. Parameters of hardening are K = −0.2 GPa and n = 0.03 for black curves and β = −0.69 for red curves.
Metals 12 01835 g004
Table 1. Parameters of model (Section 2.1) for nano-sized gold whiskers data from [25] with different grain sizes.
Grain Size, nmατ, sβ
4412850.54
5516080.6
8513410.71
12612150.55
Table 2. The characteristic relaxation times of various single-crystal nanomaterials, the theoretical deformation curves of which are presented in Figure 1, Figure 2, Figure 3 and Figure 4.
AuAu-AgW
Experimental data[28][24][25]
Structure typeNanowhiskersNanowiresNanopillars
Strain rates, s−110−40.5 × 10−310−3–10−1
Type of curveMonotonicNonmonotonicMonotonic
Hardening typeHardeningSofteningHardening
Sample size, nm553192000
τ, s608208
β0.6−0.70.27
Table 3. The characteristic relaxation times of various nanocrystalline materials, whose nonmonotonic strain curves have been analysed in the previous studies over a wide range of strain rates by the model in (Section 2.1).
TaCu-AlNiFe
Experimental data[23][38][26][27]
Strain rates, s−110−3–10410−2–10410−3–10410−3–104
Type of curve
10−3–10−1 s−1
HardeningHardeningPerfect plasticityPerfect plasticity
Type of curve
103–104 s−1
SofteningSofteningSofteningSoftening
Sample sized < 10 μm3 × 3 × 3 mm3d = 5 mm; l = 2.7 mmd < 1 mm
Grain size, nm43.89317100–500
Calculationthis paperthis paper[29][31]
τ, μs4.85003.3190
β0.260.0400
Publisher’s Note: MDPI stays neutral with regard to jurisdictional claims in published maps and institutional affiliations.

