Article

Corrosion Study of 80S Steel under the Coexistence of CO2 and H2S

School of Chemistry and Chemical Engineering, Xi’an Shiyou University, Xi’an 710065, China
*
Author to whom correspondence should be addressed.
Metals 2022, 12(11), 1923; https://doi.org/10.3390/met12111923
Submission received: 20 September 2022 / Revised: 13 October 2022 / Accepted: 3 November 2022 / Published: 9 November 2022

Abstract

:
The continuous rise in the energy demand has shifted the extraction environment in oil and gas fields towards a more hostile environment, and has ultimately increased the corrosion of extraction and transmission facilities. One of the most effective solutions for mitigating the corrosion problem is the use of corrosion-resistant metals. In this paper, we investigated the corrosion behavior of 80S steel that was being employed in an oilfield underground gathering pipeline at different temperatures and partial pressures of H2S and CO2 using an autoclave. Moreover, the loss-in-weight method was used to simulate the corrosive environment in the oilfield. Electrochemical studies were then carried out to investigate the corrosion mechanism. The results show that: (1) In the corrosive environment of CO2 and H2S coexistence, temperature is a major factor affecting the corrosion rate of 80S steel, and increase in temperature accelerates the corrosion process. (2) Corrosion rate is also affected by the CO2 and H2S partial pressure ratio; high S content at high temperatures will inhibit the corrosion process, and vice versa for low temperature. (3) With an increase in the temperature, the corrosion potential decreases, corrosion current density increases, and polarization curve gradually moves to the right. (4) The shape of the cathodic branch moves in the X-negative direction by increasing S content, and the cathodic reaction is jointly controlled by activation and diffusion processes, when the temperature is 100 °C, whereas the anodic branch of the polarization curve at a 3% concentration of Na2S.9H2O changes significantly and a passivation zone appears. (5) The results of the impedance spectra showed that the impedance radius of the metal decreases significantly at increasing temperatures. In addition, the Warburg impedance showed a more pronounced diffusion phenomenon with the increasement of H2S concentration.

1. Introduction

In recent years, with the advancements in the oil and gas fields, the continuous development of the natural gas industry, and increasing demand for energy, oil pipelines are bound to be affected by the internal and external environments, resulting in severe corrosion situations. Among them, carbon dioxide (CO2) and hydrogen sulfide (H2S) significantly contribute towards the corrosion of oil pipelines [1,2,3,4,5,6]. Corrosion of pipelines not only causes safety concerns, environmental pollution, and effects on people’s health, but also generates huge economic losses, and affects the development of oil and gas fields bringing serious social impacts [7,8,9,10]. However, various anti-corrosion measures have gained much importance nowadays, and have played a tremendous role in the anticorrosion of oil and gas fields. At present, major anti-corrosion measures include the addition of corrosion inhibitors, coatings, and the use of new corrosion-resistant alloys [11,12,13,14,15,16,17,18,19,20,21,22]. Each protection method has its advantages and disadvantages in terms of economic cost, corrosion resistance, long-term maintenance cost, and service life. Among them, the selection and use of corrosion-resistant metals have proven to be a viable solution to corrosion problems because of their operational safety, relatively low cost, excellent performance, and less environmental impact [23,24,25]. In this regard, various corrosion-resistant metals have been developed, and among them, 80S steel has been developed for the underground CO2 and H2S coexistence environment. The main corrosion factors for metal facilities in oil and gas field sites are temperature and CO2 and H2S partial pressures. There are many articles on the corrosion of carbon steel by CO2 [26,27,28,29]. However, there are few reports pertaining to the corrosion behavior of 80S steel under the coexistence of CO2 and H2S. In this paper, we simulated the corrosion environment of an oil and gas field site through high-temperature and high-pressure experimental equipment, and studied the electrochemical behavior of 80S steel under the condition of coexistence of CO2 and H2S, combined with dynamic potential polarization and electrochemical impedance spectroscopy (EIS) to investigate its corrosion behavior and mechanism, and the research outcomes have certain reference values for the safety and security of the oil and gas field and material selection.

2. Materials and Methods

2.1. High Temperature and Pressure Simulation Experiments

80S steel was used for the experiment and some metals content in the material were detected by ICP-AES (Perkin Elmer, Avio 200, Waltham, MA, USA); the results are listed in Table 1.
The metal used for the experiments was prepared with reference to the “Laboratory Test Method for Uniform Corrosion of Metallic Materials by Total Immersion”. 80S steel was physically demonstrated with machining specifications, as shown in Figure 1; instrumentalized with a milling machine; and polished with a grinder to remove the original metal surface layer and improve the surface finish.
Before each experiment, the 80S steel was sanded with 600, 800, and 1200# sandpaper step by step to obtain a smooth metal surface and minimize the error caused by surface roughness. Then, the 80S steel was rinsed with deionized water and acetone to remove oil, and cold air-dried after measuring the size and weight. The ionic components of the experimental corrosion medium for the water extracted from the site, are shown in Table 2.
The metal was fixed to the metal racking apparatus of the autoclave; the lid seal was installed; and, after first making sure that the autoclave was well sealed, the H2S and CO2 partial pressures and temperature were controlled according to the experimental protocol (Table 3). The flow rate was set to 30 rev. per minute and the test period was 168 h. An FCZ3 magnetic drive reactor was selected to be the experimental device.
The metal was removed after the test and washed and blow-dried with anhydrous ethanol. The two parallel metals of each material were washed with the prepared cleaning solution (500 mL 36% HCl, 20 g hexamethylenetetramine, 500 mL distilled water) to remove the corrosion products on the metal surface, washed and blow-dried with anhydrous ethanol, and weighed using an electronic analytical balance with an accuracy of 0.1 mg. The corrosion rate was calculated according to Equation (1). The remaining metal was used to perform the scanning electron microscopy (SEM) in order to observe the corrosion surface morphology and conduct an energy spectrum (EDS) component analysis, and then cleaned to calculate the corrosion rate.
CR = 36,500ΔW/ρSt
where CR is the average corrosion rate, in mm·a−1; ΔW is the weight loss of the metal, in g; ρ is the density of the material, in g · cm−3; S is the area of the metal, in mm2; t is the test time, in d. Refer to the NACE SP 0775-2013 standard to determine the degree of corrosion.

2.2. Electrochemical Experiments

The same 80S material used during the simulation experiment was selected, and the metal element contents are shown in Table 1. The metal was machined into a disk with a diameter of 15 mm and a thickness of 2 mm, and sanded with 600, 800, and 1200# sandpapers step by step prior to the experiment in order to obtain a smooth metal surface. Then, the surface was degreased with acetone, cleaned with distilled water, and dehydrated with anhydrous ethanol. The experimental medium solution was 1 L of field-harvested water, and its ionic component is shown in Table 2. Before testing, N2 (flow rate 60 mL min−1) was passed into the medium to deoxidize for 30 min, CO2 gas continued to be added for 30 min, and an oil bath was used to maintain the temperature of the test solution. During the electrochemical test, the CO2 gas was continuously introduced to keep the medium in a CO2-saturated state. In this test, a certain amount of Na2S.9H2O was added to the test solution instead of H2S; the experimental protocol is shown in Table 4 and Table 5.
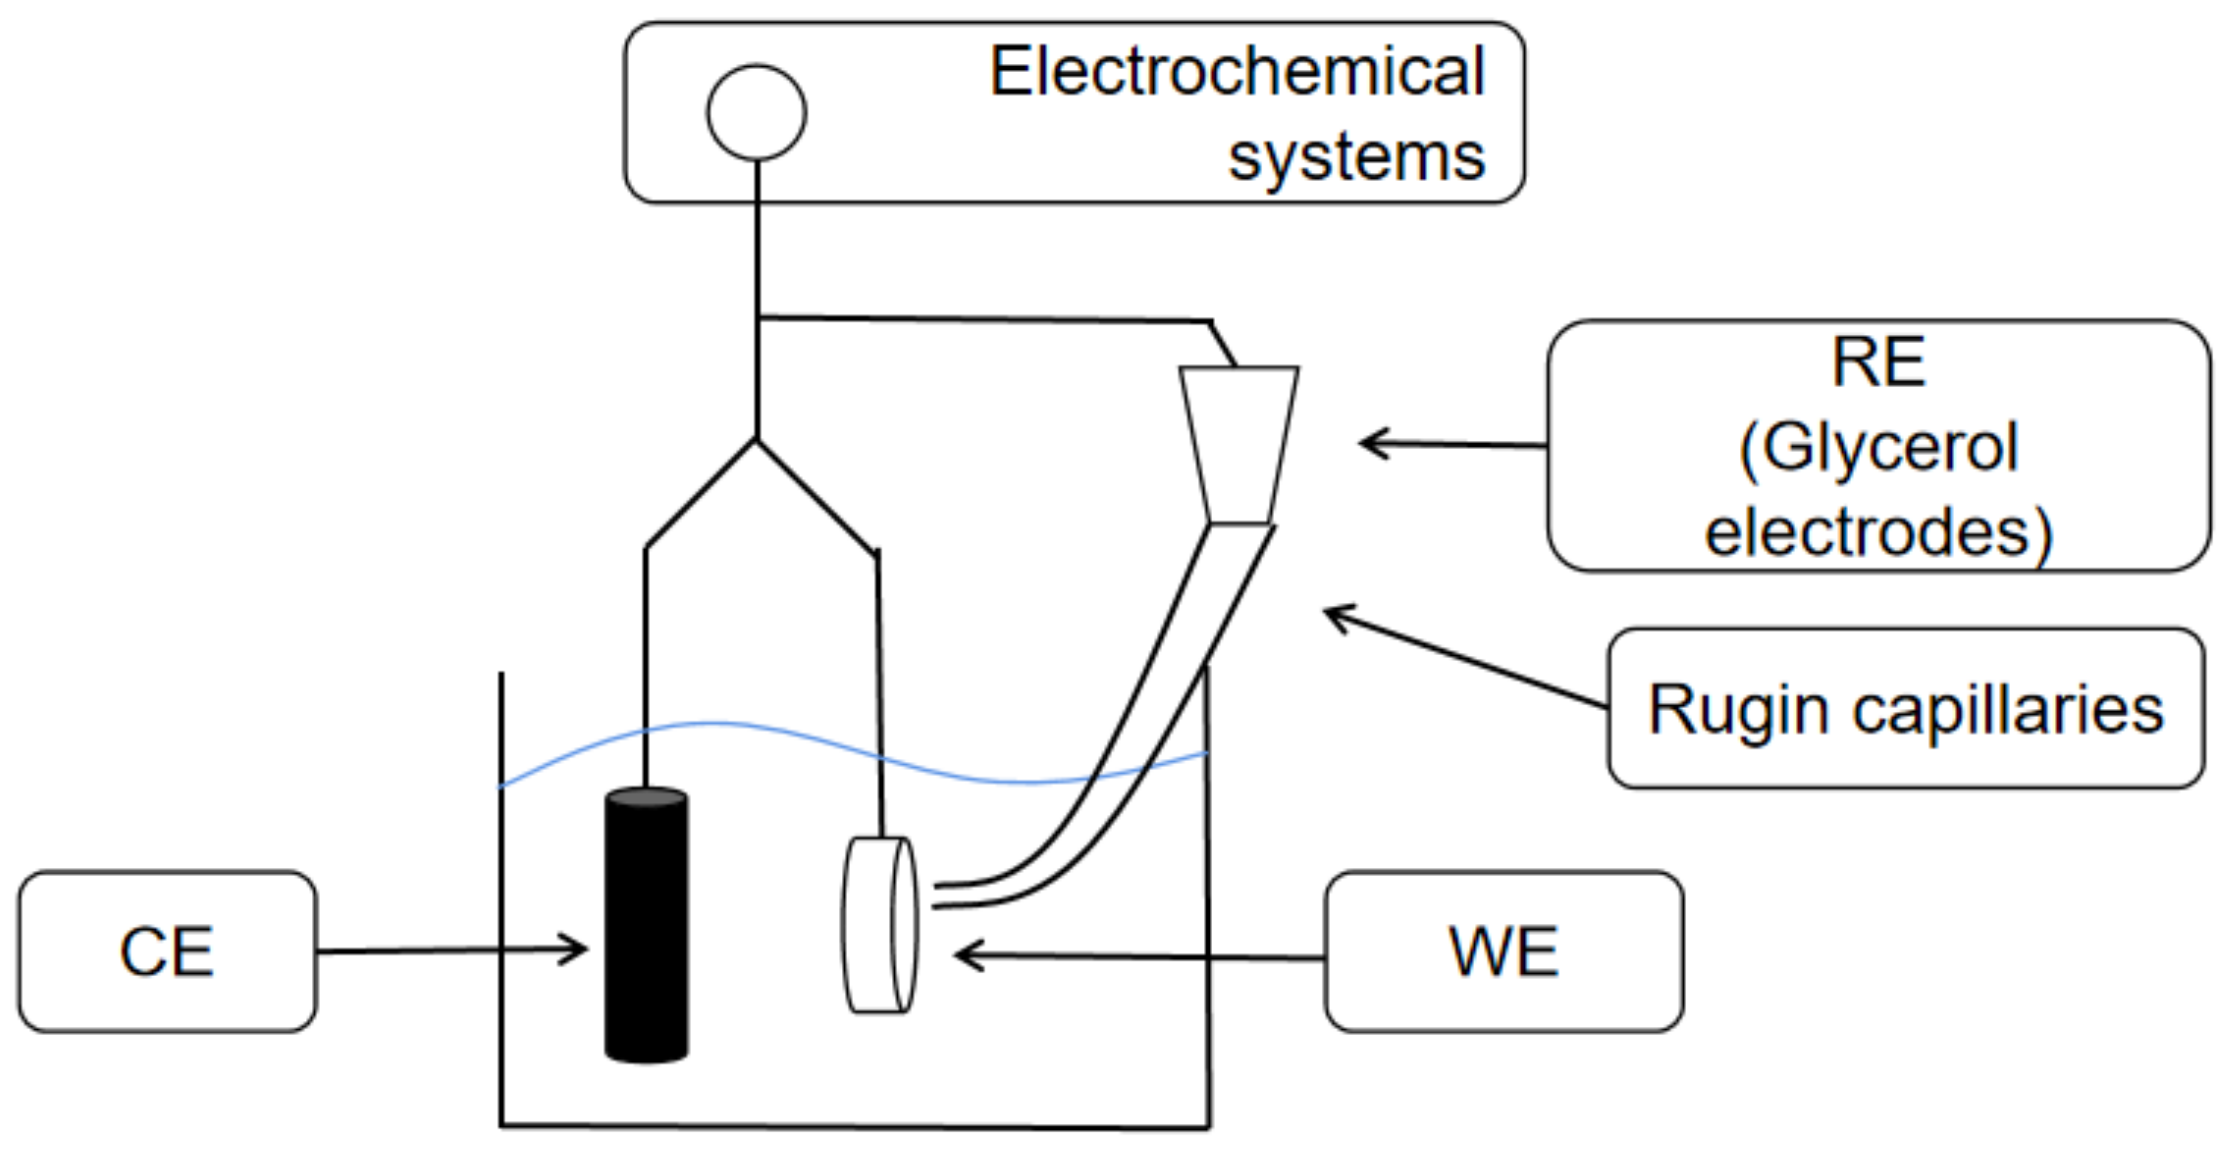
The instrument used for the experiments was a Princeton PARSTAT 4000 electrochemical workstation manufactured in the US. The electrochemical tests were performed using an electrochemical system with a typical three-electrode system, with a saturated glycerol electrode as the reference electrode (SCE) and in contact with the solution through a Login capillary; the counter electrode was a graphite rod electrode. The test metal was embedded in the holder as the working electrode, and the actual working area was 1 mm2. The metal was left for about 30 min, and then the open circuit potential was stabilized for the dynamic potential polarization and impedance test. A schematic diagram of the device is shown in Figure 2. The WE was the main object of electrode research and manipulation, the RE was the standard of comparison for potential electrodes, and CE was mainly based on the polarization of electrodes using polarizing currents.
The AC impedance (EIS) test was set at a frequency of 100 to 10 MHz, the test signal was a sine wave with an amplitude of 10 mV, and the AC impedance spectrum was fitted for analysis. The scanning range for the dynamic potential polarization test was −0.4 to 0.4 V(vsOC), and the scanning speed was set to 0.25 Mv s−1. The test results were then fitted with CView software.

2.3. SEM Analysis

The instrument used for the analysis was a field emission scanning electron microscope, and the samples used comprised the metals that were not processed after the high-temperature and high-pressure simulation experiment (see Figure 1 for the sample parameters). The test conditions were a voltage of 10 kV, a distance between the image surface of the sample and the objective lens of 12.79 mm and a magnification of 1000 times, and the detector type was In Beam SE.

3. Results and Discussion

3.1. High-Temperature and High-Pressure Simulation Experiments

3.1.1. Experimental Results

The SEM scans were performed at the end of the experiments, and the microscopic morphology was measured at different temperatures, with total pressure at 8 MPa and 0.4 MPa and 8 × 10⁻⁴ MPa partial pressures of CO2 and H2S, respectively (Figure 3). Local corrosion occurred on the metal surface at 60 °C, with a mild degree of corrosion and a certain amount of corrosion products covering it. The corrosion products on the surface fell off and produced a certain amount of micro-corrosion pits, which were associated with a very small amount of H2S (partial pressure 8 × 10⁻⁴ MPa), and contained a high concentration of Cl ions (about 90 g L−1) medium, whereas the surface faced increased corrosion at 100 °C, and its hanging sheet surface was observed to have corroded off.
Figure 4 shows the microscopic morphology at different temperatures, total pressures (20 MPa), partial pressures of CO2 (0.6 MPa), and partial pressures of H2S (0.12 MPa). The condition of the proportion of H2S was high, where the surface experienced a slight corrosion at 30 °C, and there were no corrosion products attached, and no formation of corrosion pits was found. In contrast to this, the surface experienced local corrosion at 60 °C, resulting in the formation of some micro-corrosion pits, while the surface showed some serious corrosion at 100 °C, resulting in the formation of large number of corrosion pits, which was related to the high content of H2S.
Figure 5 shows the microscopic morphology at different temperatures, total pressures (32 MPa), partial pressures of CO2 (0.96 MPa), and partial pressures of H2S (3.2 × 10⁻³ MPa). We observed that the metal surface underwent local corrosion at 30 °C, which was not uniform, but that there was an obvious large portion of uncorroded table-like areas on the surface, indicating that, in the presence of lower CO2 and H2S concentrations, the metal was subject to less erosion. Similarly, the metal surface was affected by more serious corrosion along with the presence of uncorroded table-like areas at 60 °C, indicating the limited erosion of the metal. However, the metal surface experienced severe corrosion, and corrosion products were deposited less uniformly but more densely at 100 °C. At the same time, the metal surface also experienced a certain amount of product shedding, and the surface product layer also faced a certain amount of cracking, which was related to the elevated concentrations of ions in the medium.
The results of the elemental analysis after the scanning and EDS energy spectrum analysis are shown in Table 6. The main elements of the corrosion products were observed to be carbon (C), oxygen (O), sulfur (S), and iron (Fe), which, upon combination with the corrosion conditions, suggested that the main corrosion products were FeCO3, along with a small amount of iron sulfide FexSy, such as FeS and Fe9S8.

3.1.2. Analysis of Results

The corrosion rate was calculated using the weight-loss method, and the results are shown in Figure 6.
From the result of the corrosion rate–temperature curve, it was estimated that, under different conditions, the corrosion rate of 80S steel increased with the increase in temperature, indicating a positive correlation between the temperature and metal corrosion rate. Moreover, the corrosion rate of 80S steel was found to be significantly higher under conditions of 30 and 60 °C temperatures, a total pressure of 20 MPa, a CO2 partial pressure of 0.6 MPa and a H2S partial pressure of 0.12 MPa, compared to other two conditions. In addition, the corrosion rate was observed to be the lowest at 100 °C due to the more dense production of FeS precipitates, which cover the metal surface and, thus, prevent the corrosion from proceeding. This shows that, in addition to temperature, the partial pressure ratio of CO2 to H2S also has a profound impact on the corrosion rate. At a low temperature, a high content of H2S accelerates the corrosion process and vice versa for high temperatures. At the same time, the change in total pressure has a smaller effect on the metal corrosion rate than the effects brought by the temperature and partial pressure ratio of CO2 and H2S.

3.2. Electrochemical Experiments

3.2.1. Dynamic Potential Polarization

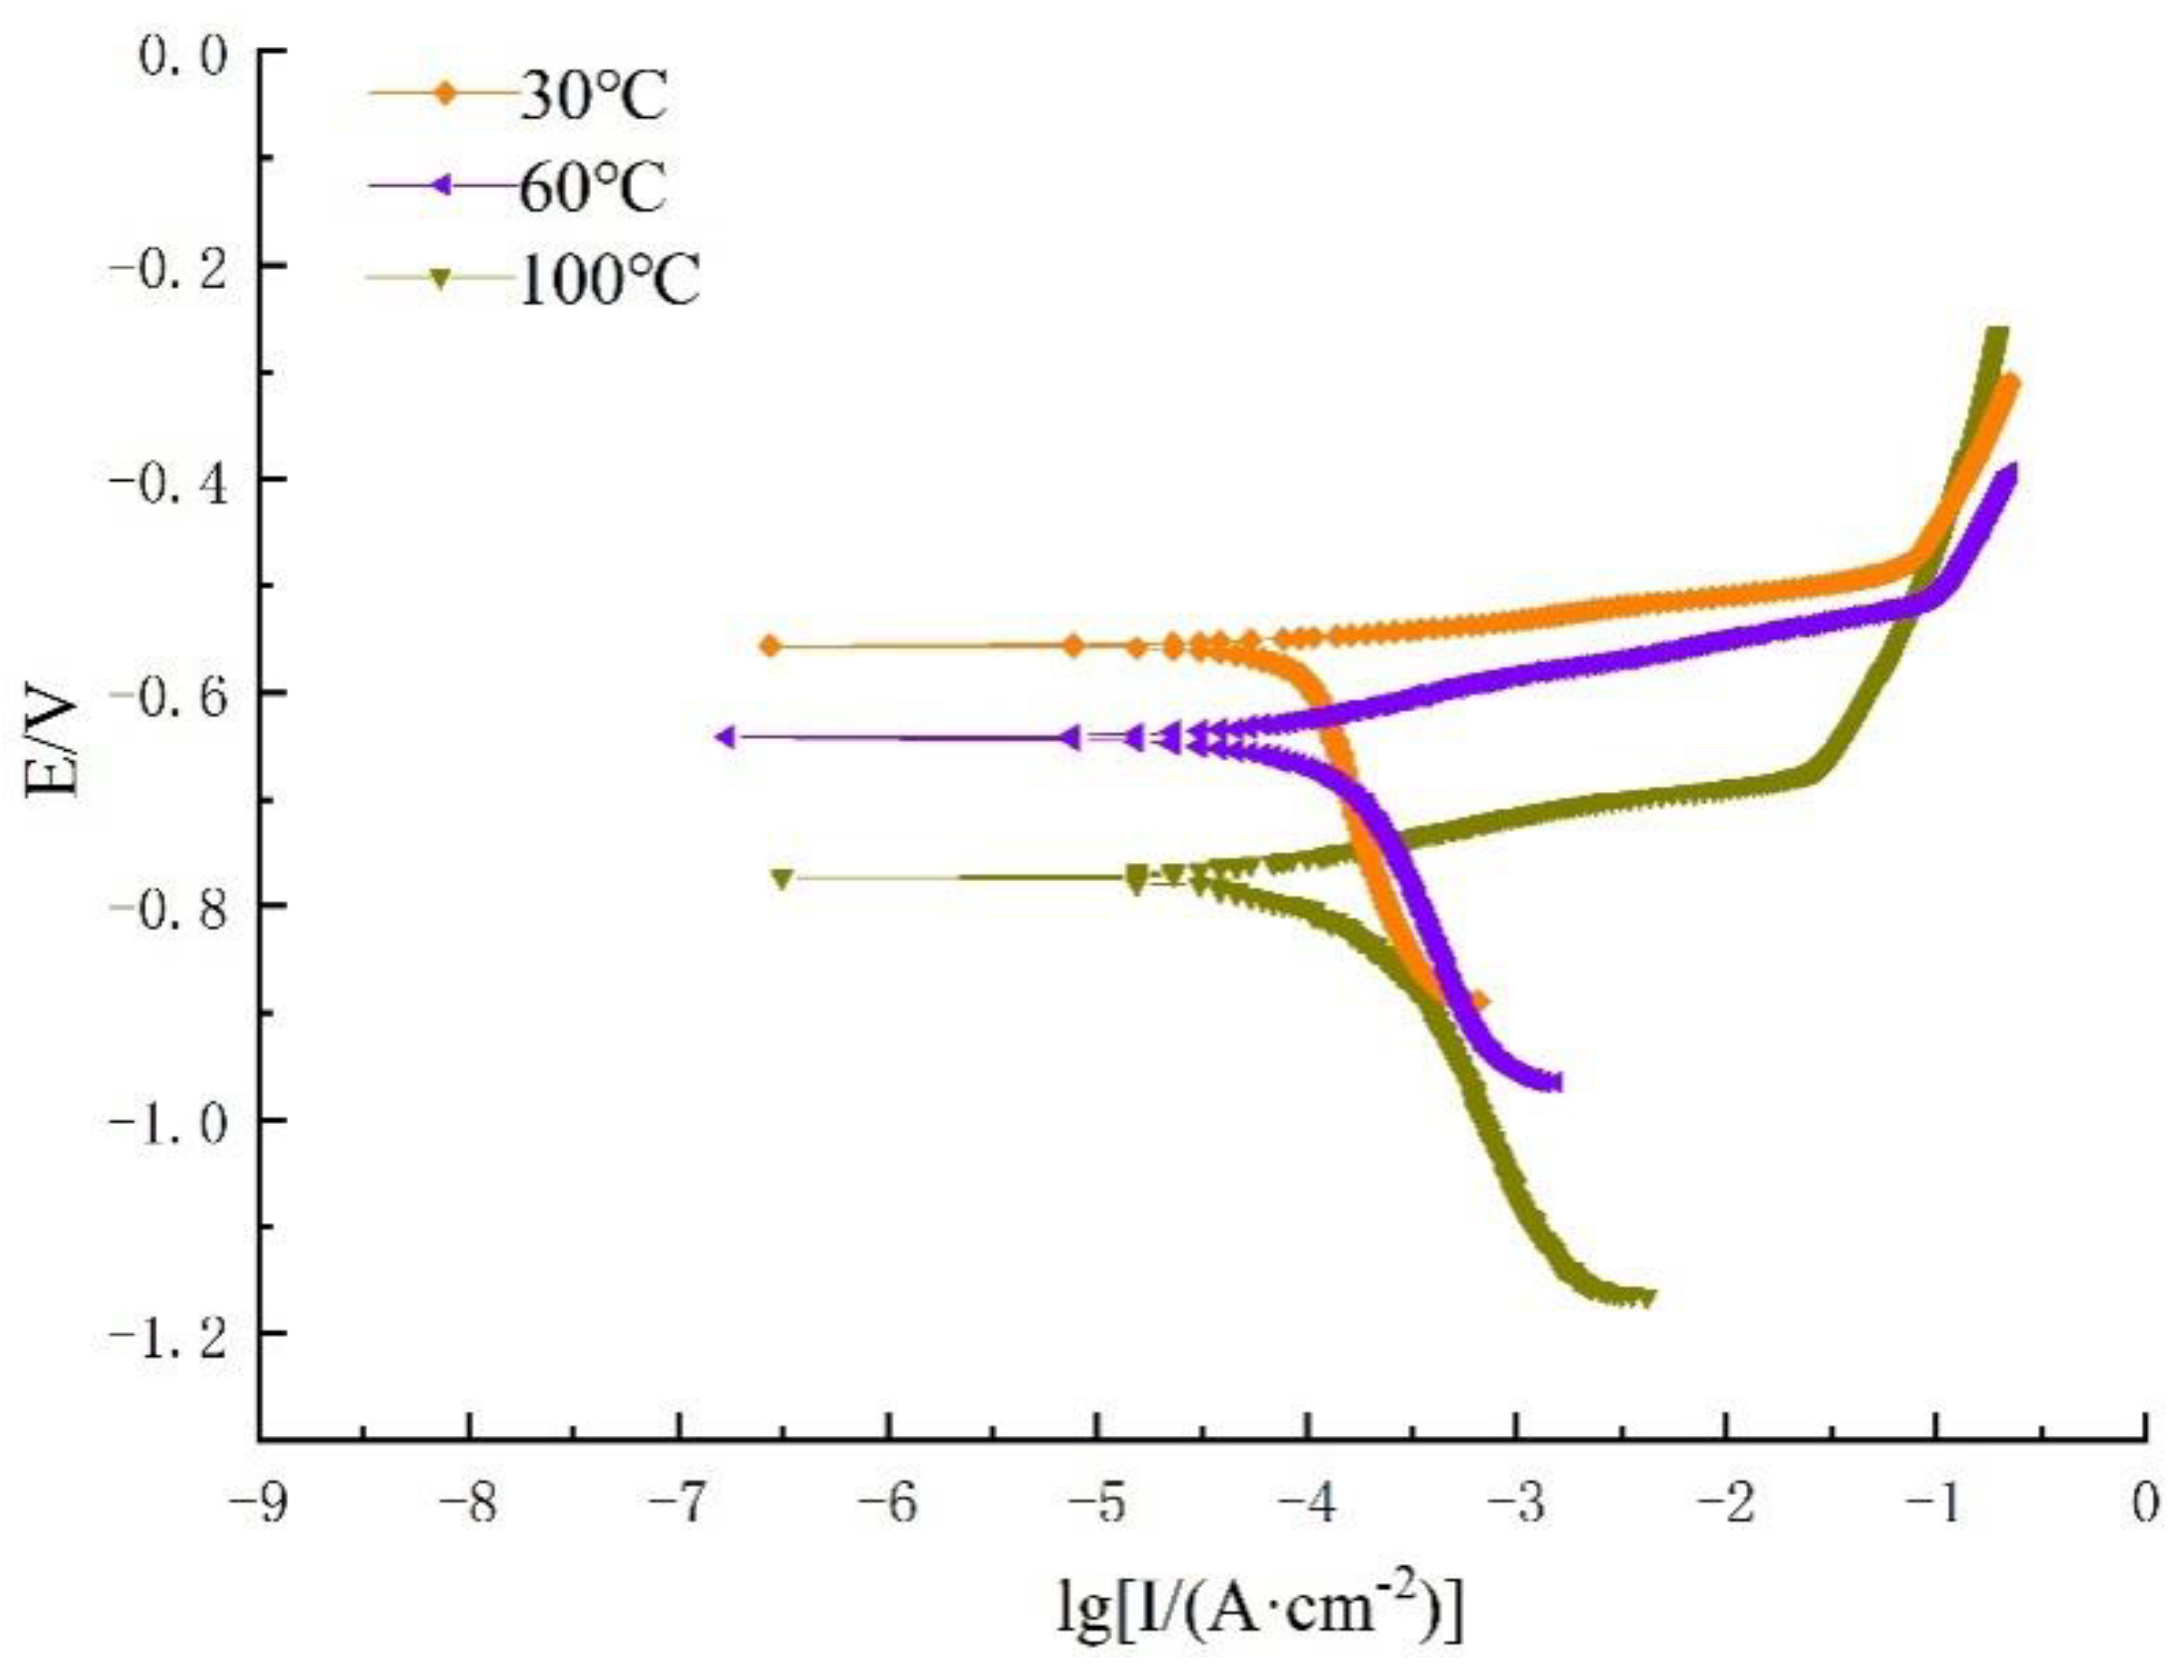
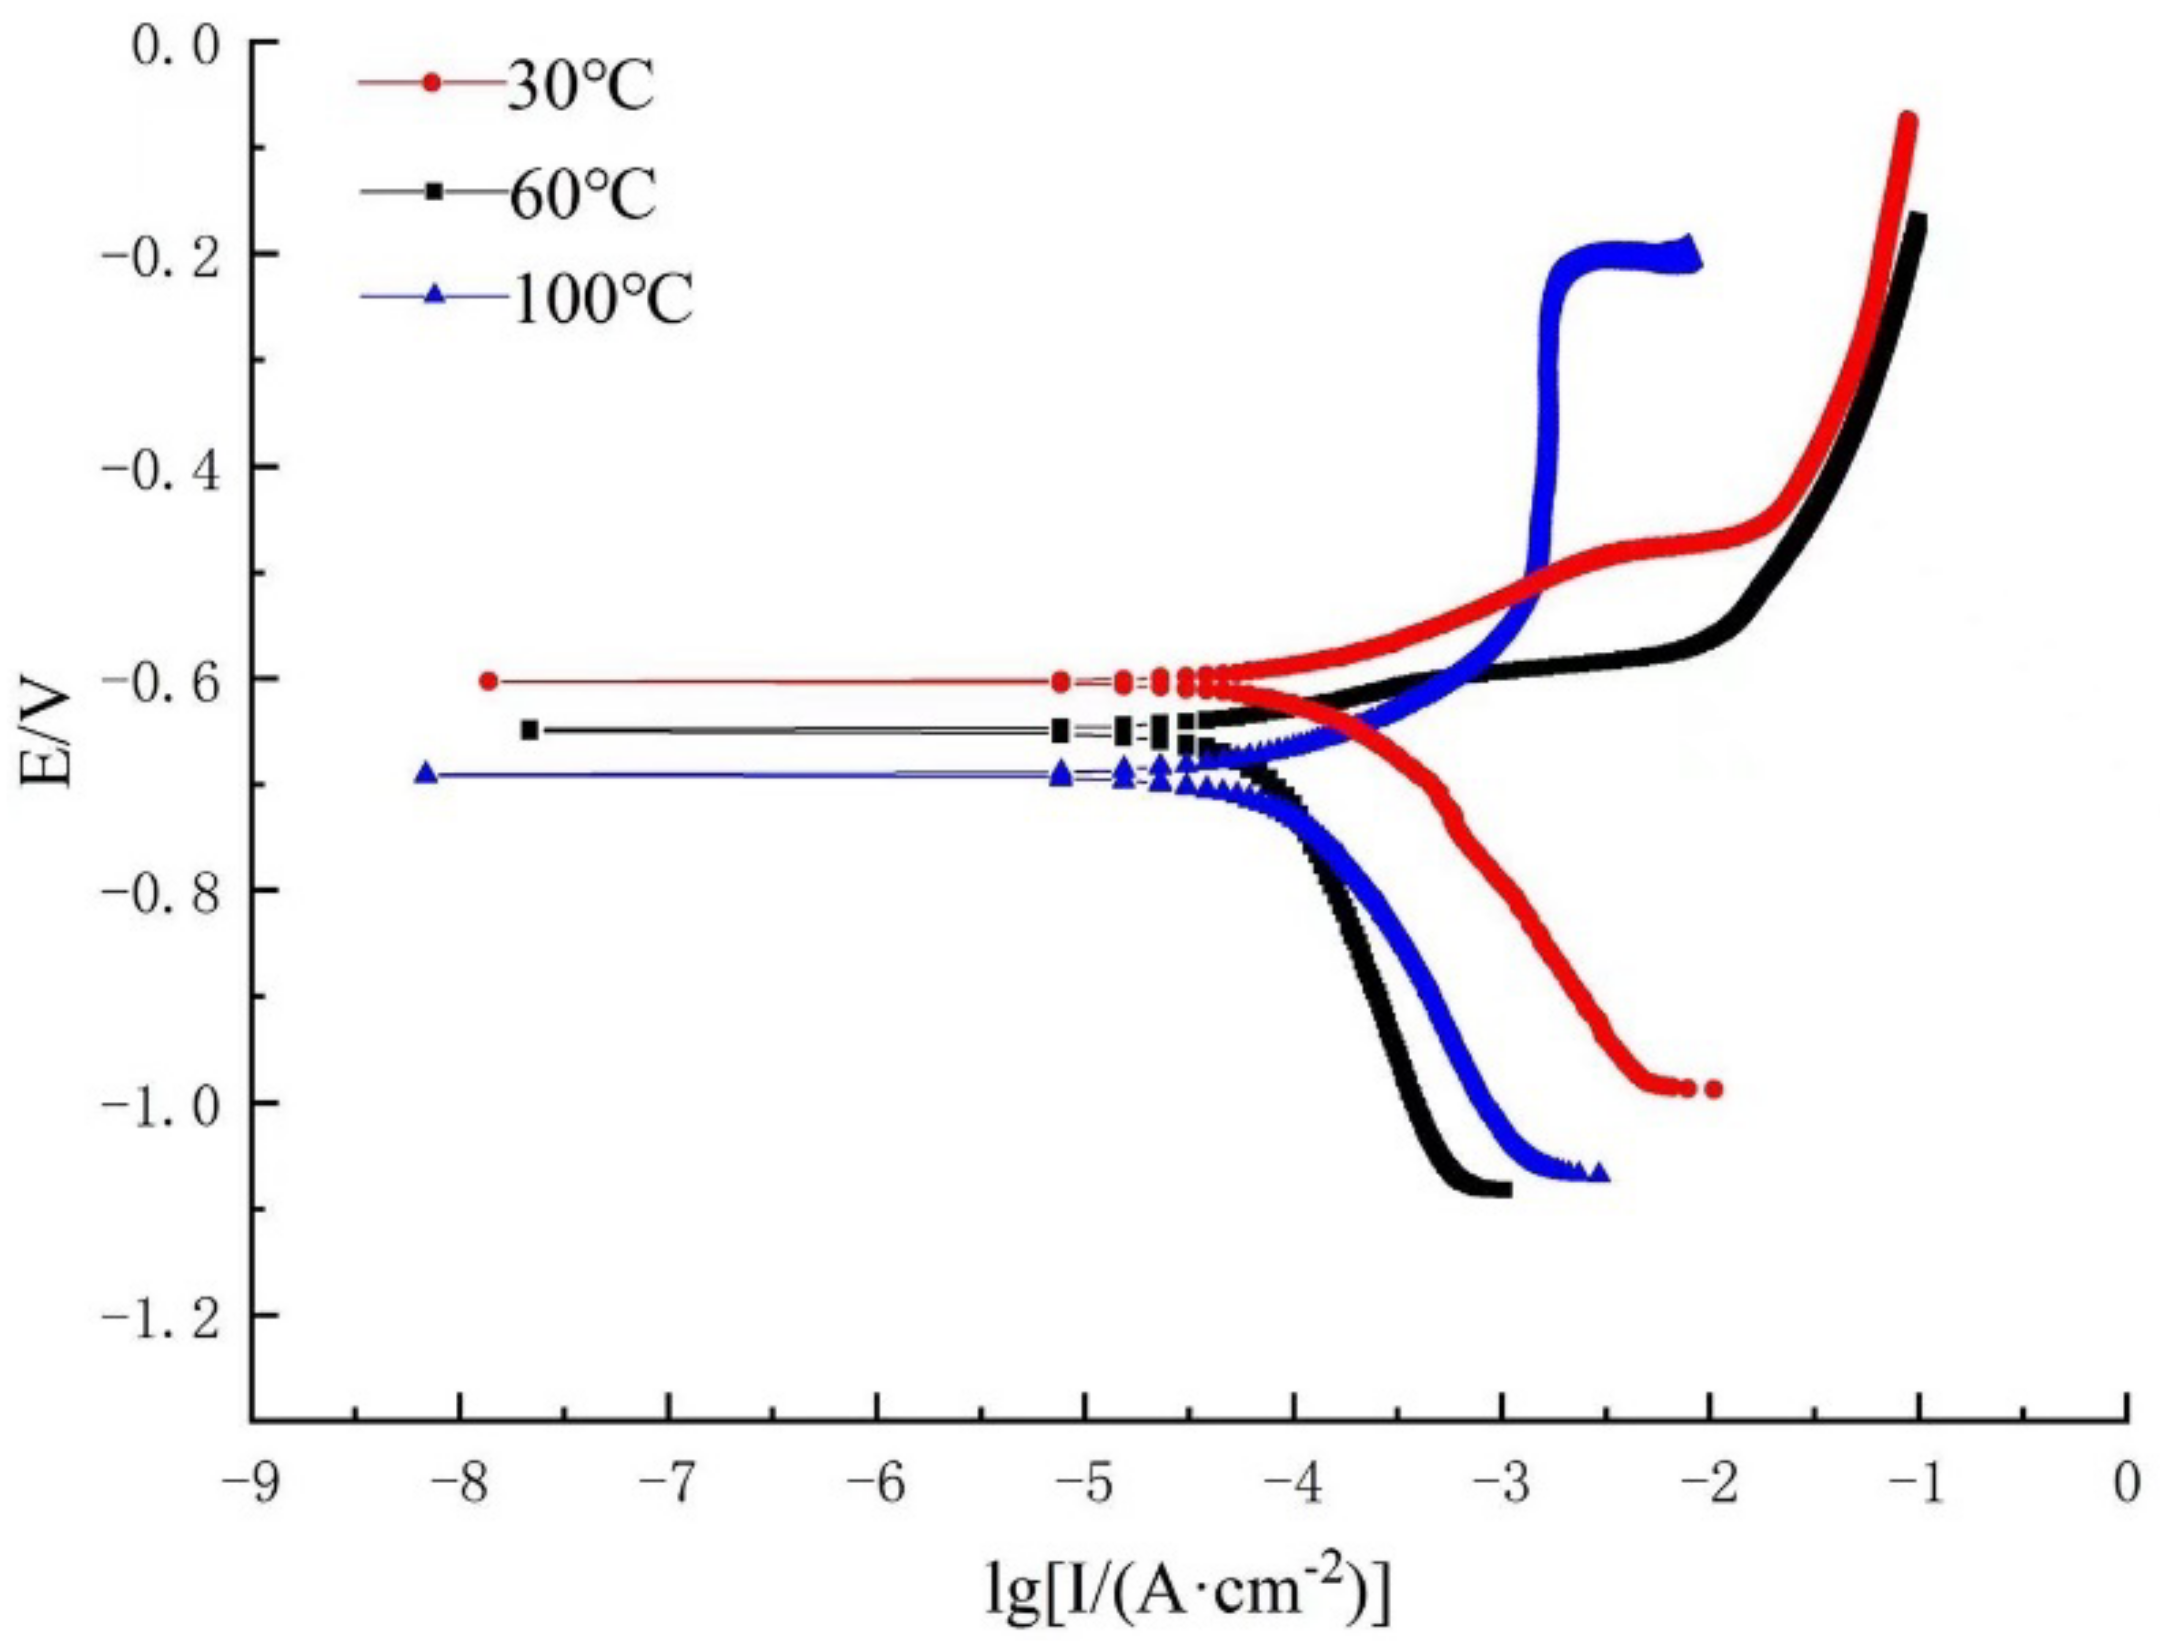
Figure 7 and Figure 8 show the dynamic potential polarization curves of the effects of different sulfur contents and different temperatures on the properties of 80S steel in a corrosive environment containing CO2 and H2S coexisting in a simulated oilfield site.
As can be seen in Figure 7, the polarization curves at different temperatures in the medium containing 0.3% Na2S.9H2O were similar, indicating that the polarization behavior was not significantly influenced by temperature. With the increase in temperature, the corrosion potential decreased from −556 to −773 mV (Figure 7). There was a weaker charge transfer caused by the direct reduction of H2O at the beginning of the cathodic polarization scan zone. Therefore, it can be judged that the cathodic reaction under this condition is controlled by a combination of activation and diffusion effects. This is consistent with the previous reference [30]. For the anodic polarization reaction, the anodic branch shape did not change significantly with the temperature change, indicating that there is no obvious passivation zone. At this time, the corrosion rate was mainly affected by the temperature.
As can be seen in Figure 8, when the content of Na2S.9H2O in the medium was 3%, the cathodic branch of the polarization curve had a similar shape, and the overall movement was in the negative direction of the X-axis, compared with Figure 7, when the medium contained 0.3% Na2S.9H2O, which mainly involved the effect of the reduction reaction between H2CO3 and H2S (Figure 8). For the anodic polarization reaction, the anodic polarization branches at 30 and 60 °C had similar shapes, and the current density increased with the increase in potential. When the temperature increased to 100 °C, the anodic branch of the polarization curve underwent a significant change and an obvious passivation zone appeared, at which time the change of current density with potential was extremely small, which was because HS in solution was instantaneously adsorbed on the metal surface to form a dense corrosion product, thus reducing the rate of corrosion.
According to the polarization curves, the corrosion kinetic parameters under two different conditions can be obtained by fitting (see Table 7).
According to the fitted parameters in Table 7, it can be seen that, in the electrochemical experiments containing 0.3 and 3% Na2S.9H2O, the corrosion potential of 80S steel decreased with the increase in temperature, and corrosion current density increased with the increase in temperature, indicating that the effect of temperature on the corrosion rate plays an important role at both concentrations of Na2S.9H2O. At the same temperature, the corrosion current density increased with the increase in H2S content; however, at 100 °C, the corrosion current density decreased with the increase in Na2S.9H2O content. This was because, in the corrosive environment, where CO2 and H2S co-exist, the effect of H2S on the corrosion rate was more complicated. Hence, at lower temperatures, high concentrations of H2S accelerate the corrosion process, while at higher temperatures, H2S forms dense corrosion products on the metal surface and covers the metal surface, thus slowing down the corrosion process, at which point H2S has a corrosion inhibition effect. In addition, the cathodic Tafel slope bc was greater than the anodic Tafel slope at different Na2S.9H2O contents, and temperatures, indicating that corrosion in this environment was dominated by the cathodic reaction.

3.2.2. Electrochemical Impedance Spectroscopy

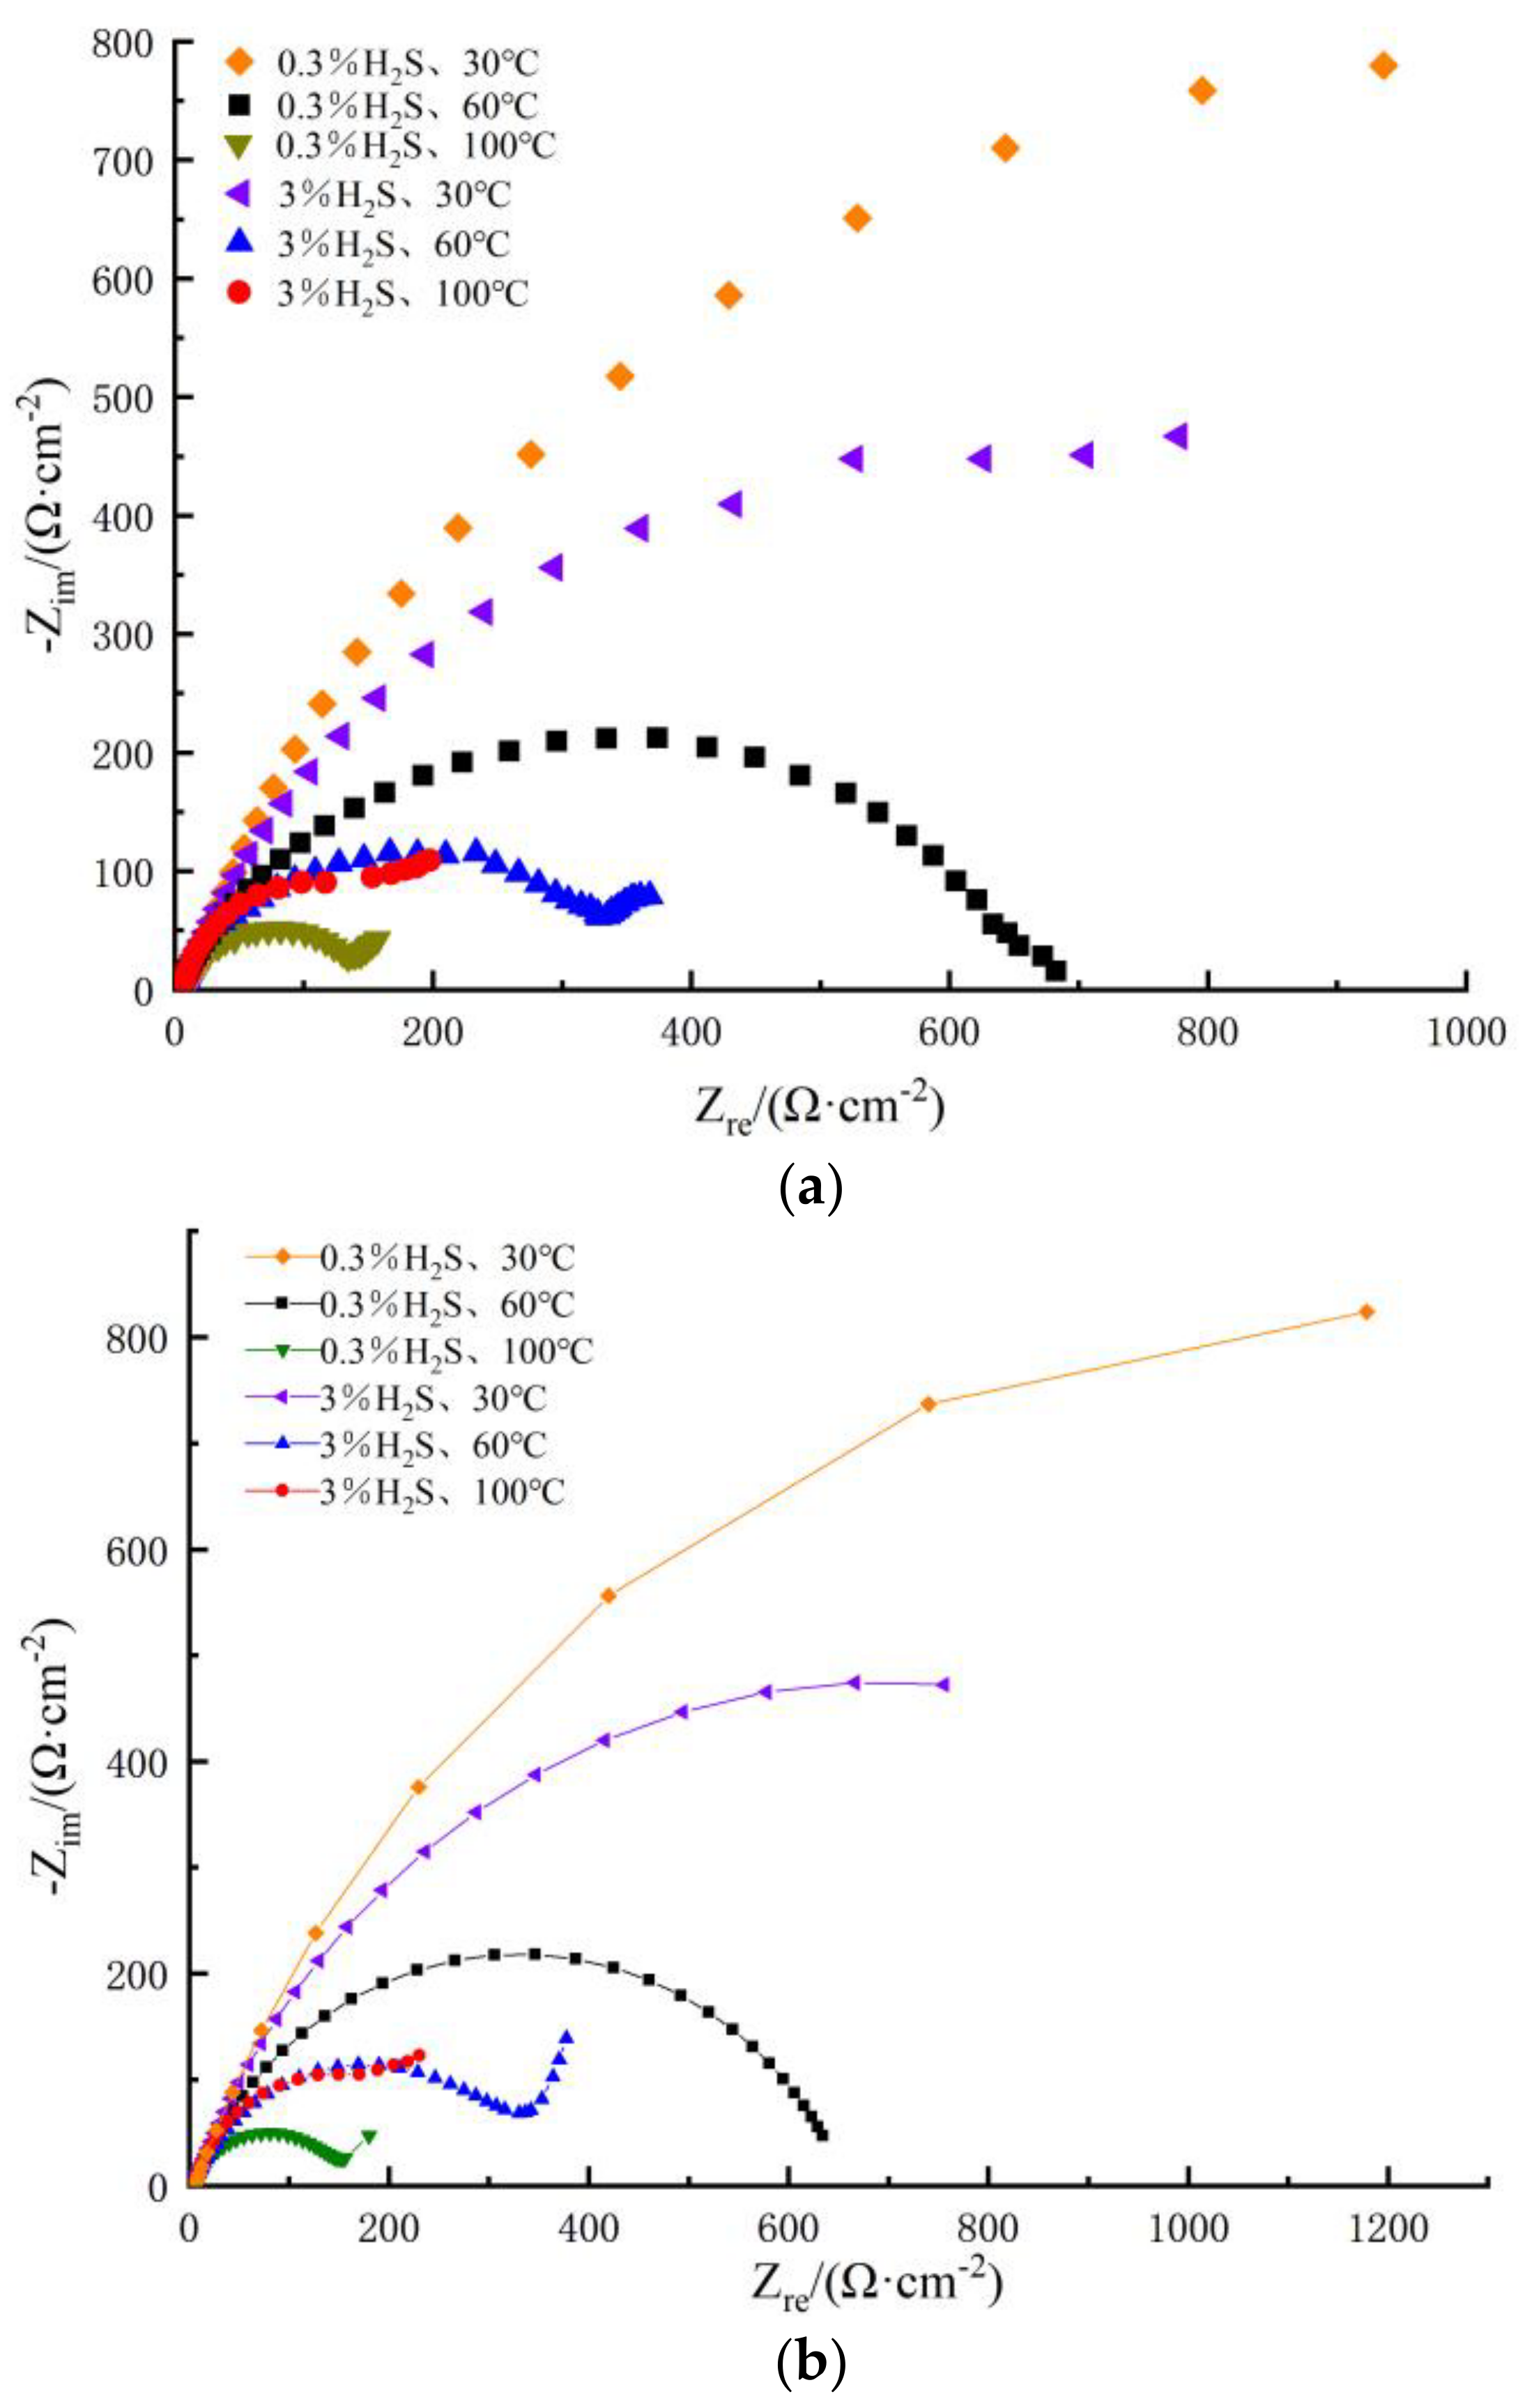
Figure 9 shows the AC impedance spectra for different S contents and different temperatures in the simulated oilfield field production in a corrosive H2S and CO2 coexistence environment. As can be seen in the impedance spectrum, the shape characteristics were similar under different test conditions. Each had two time constants, namely, the capacitive arc in the medium-high frequency region, and the Warburg impedance in the low-frequency region. The capacitive arc in the mid-high frequency region increased with the increasing temperature, and the Warburg impedance in the low-frequency region showed more obvious diffusion characteristics with increasing sulfur content. The radius of the impedance arc decreased with increasing Na2S.9H2O concentration at temperatures of 30 and 60 °C, and at the same time, it increased with the increasing Na2S.9H2O concentration at 100 °C. This indicated that temperature change, as well as H2S, affected the activity of the 80S steel surface and shifted the rate of electron exchange at the interface between the metal and the solution medium, thus affecting the corrosion rate.
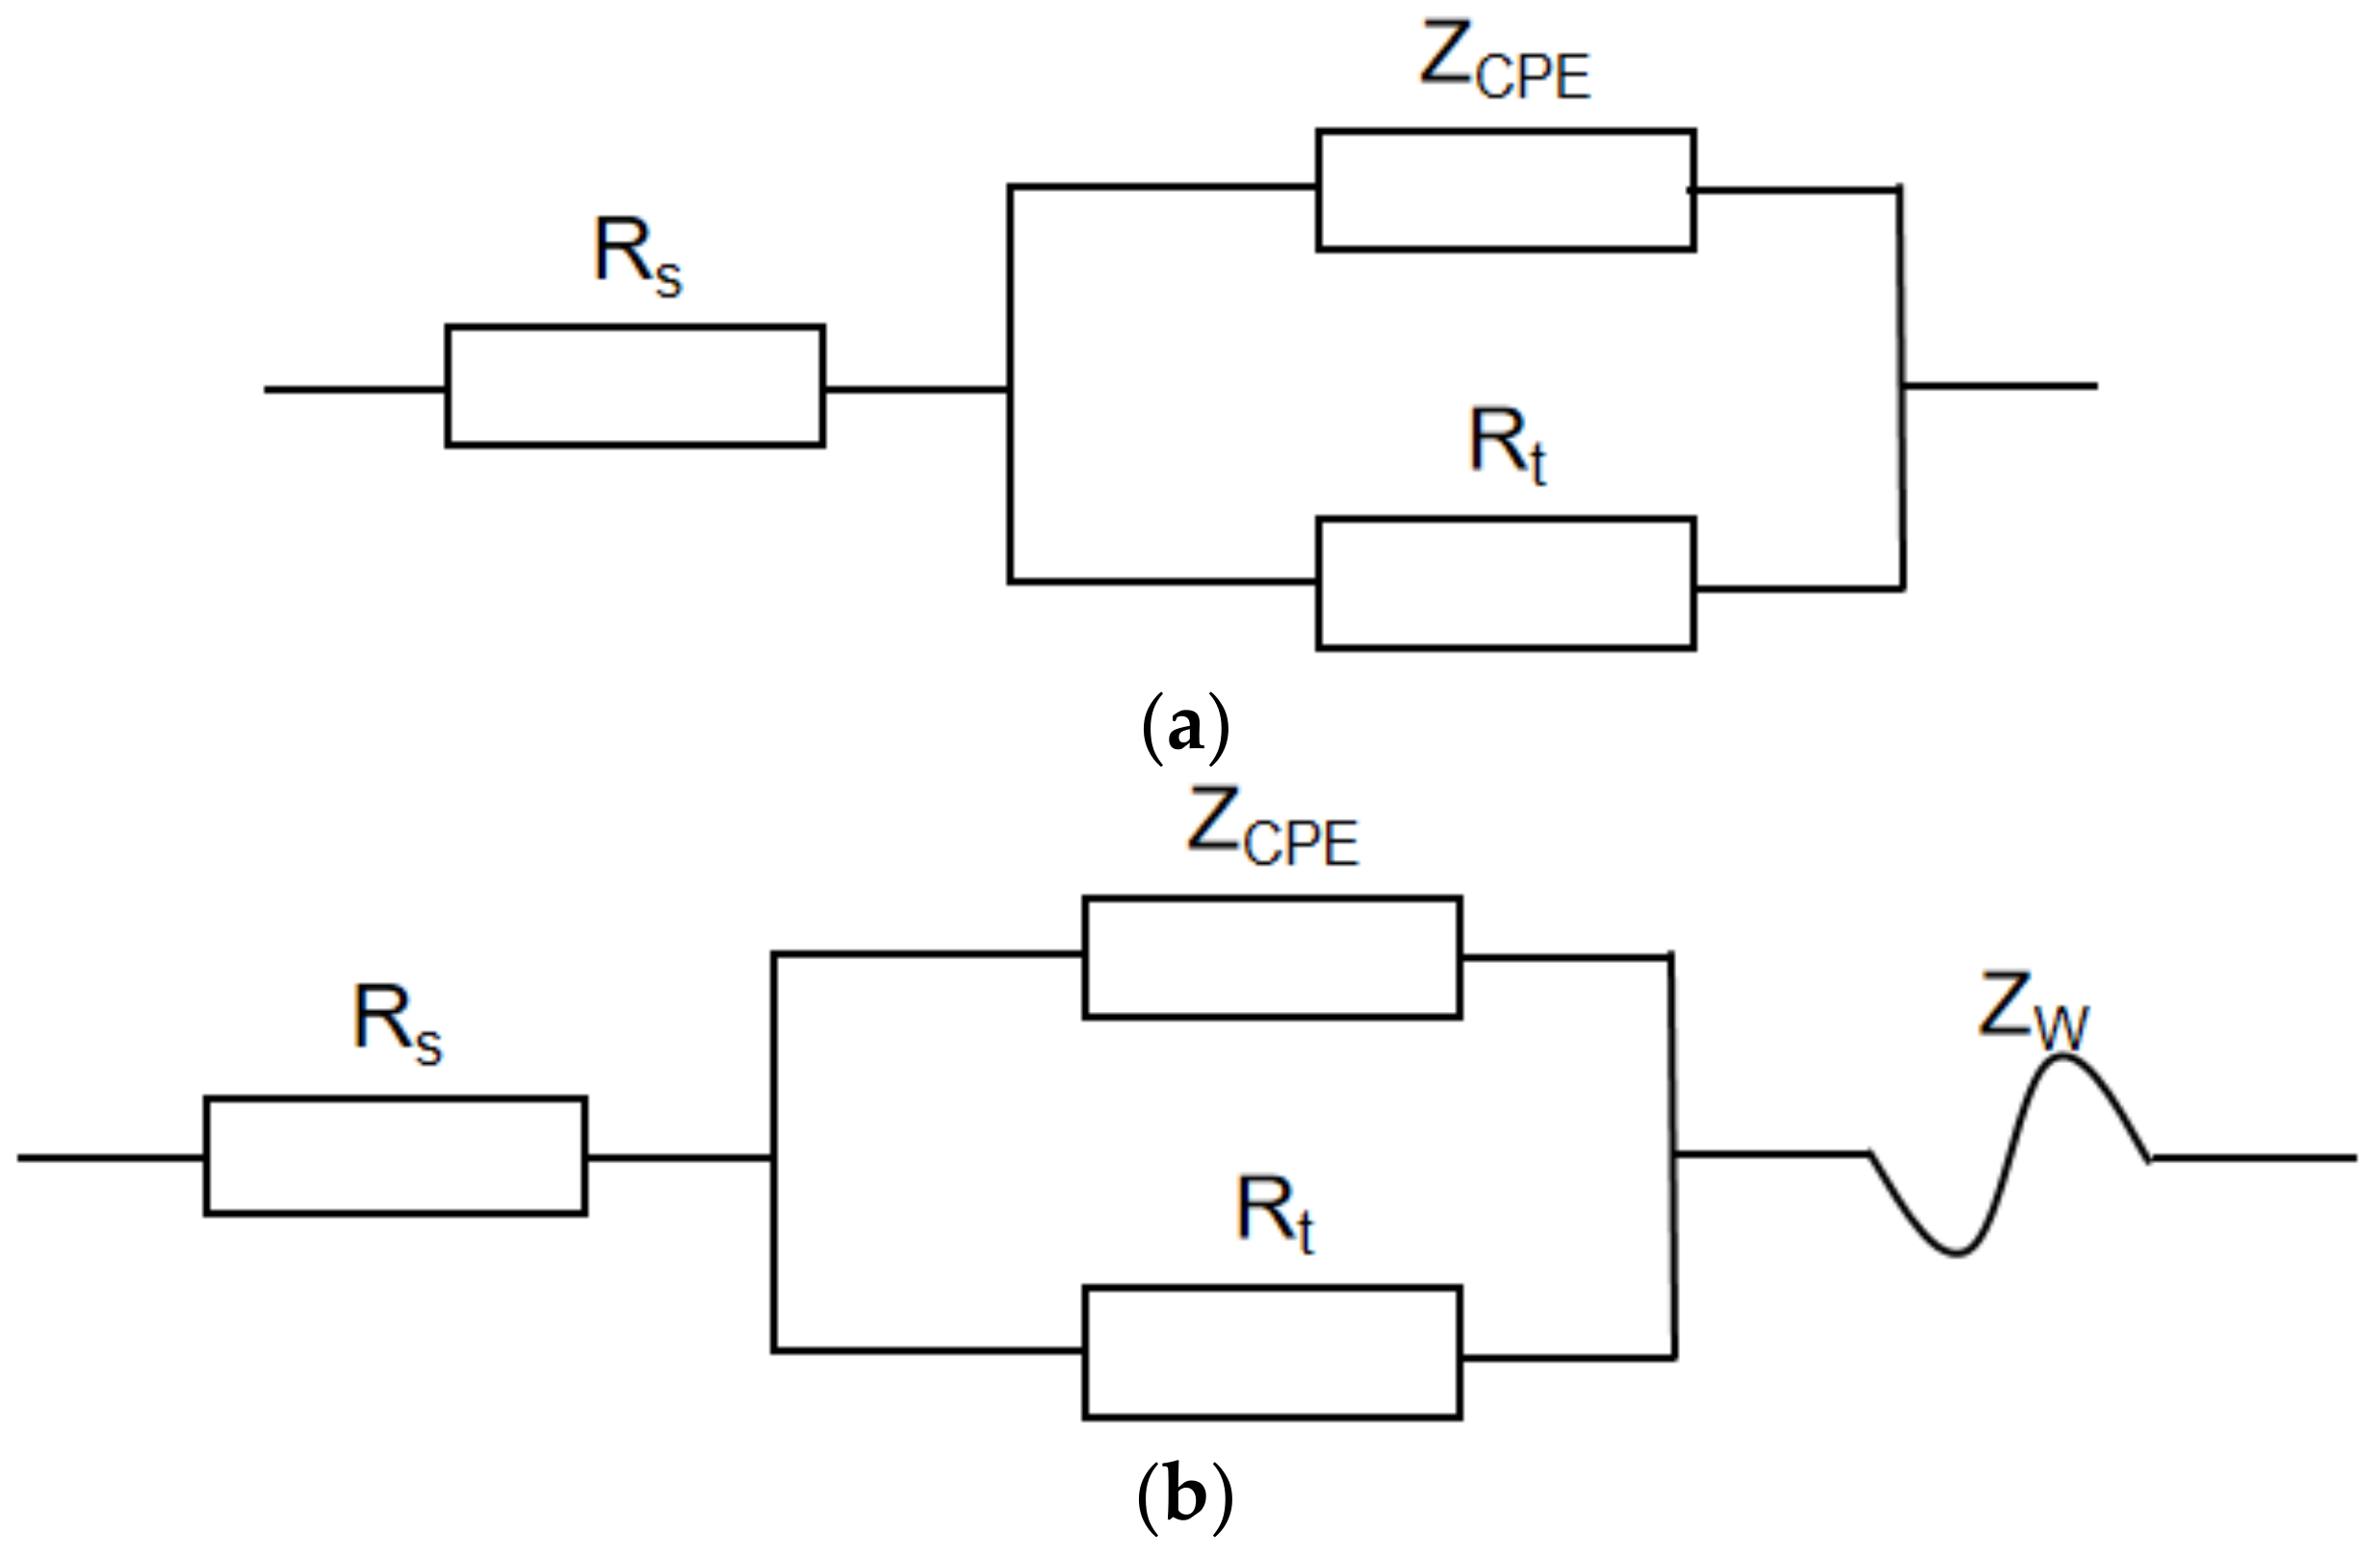
To further investigate the performance of 80S steel at different temperatures, the impedance corrosion parameters were obtained by fitting the AC impedance spectrum by ZSimpWin software according to two different equivalent circuit models in Figure 10 (see Table 8). In the equivalent circuit model, ZCPE was the constant phase angle original, Y0 denoted the value of CPE, n was the exponent of CPE, RS was the solution resistance between the working and reference electrodes, Rt was the charge transfer resistance, and ZW was the Warburg impedance [31]. The n of the double-layer equivalent primary was generally 0.6 < n < 1. According to Cao [32], if n equals 1, it is equivalent to pure capacitance C; if n equals 0, it is equivalent to pure resistance R; if n equals −1, it is equivalent to inductance L.
As can be seen in Table 8, the Rt value of 80S steel decreased as the temperature increased, while at the same temperature, the Rt value decreased as the S content increased, indicating that increasing the temperature and S content of the medium reduced the corrosion group resistance, which was consistent with the corrosion current density in response to the dynamic potential polarization curve. At 100 °C, ZW decreased with increasing S content, reflecting the formation of more protective iron sulfide corrosion products at high S concentrations, which inhibited the corrosion of the metal.
In a corrosive environment where CO2 coexists with H2S, corrosion products such as H2S, HS, H2CO3, HCO3, and H+ are formed in the solution medium. The chemical reactions occurring at the electrochemical cathode can be represented by Equations (2)–(7) [33]:
2H2S + e→HS + H2
2HS + 2e→2S2− + H2
2H2CO3 + 2e→2HCO3 + H2
HCO3 + 2e→2CO32− + H2
2H2O + 2e→2OH + H2
2H + 2e→H2
The reactions occurring at the electrochemical anode can be expressed in Equations (8)–(11) [34]:
Fe + 2OH→Fe(OH)2 + 2e
Fe + H2O→Fe(OH)2 + 2H+ + 2e
Fe + H2S→FeS1−X + xHS + (2 − x)H+ + 2e
Fe + HS→FeCO3 + H+ + 2e
The H2S corrosion is usually the first electrochemical corrosion process on the metal surface, which leads to the formation of FeS1−X and other iron sulfide corrosion products. The prevalence of different concentrations of S on the metal surface also forms Fe (OH)2, FeCO3, and other corrosion products. Since H2S and metal surface contact generate corrosion products, FeS solubility is less than FeCO3 corrosion products. The corrosion product film generated under a low-temperature state is loose and has poor protective properties, so it cannot be completely isolate CO2 from the metal surface, whereas the protective film generated under a high-temperature state has better performance, and with the increase in S content, effectively blocks CO2 from coming into contact with the metal surface, so there will be a significant passivation zone in the anodic polarization scan, and an obvious Warburg impedance characteristic appearance at the end of the AC impedance. The results of the dynamic potential polarization curves and electrochemical impedance spectra are consistent with the corrosion rates obtained from the high-temperature and high-pressure simulation experiments.

4. Conclusions

(1)
In the corrosive environment of CO2 and H2S coexistence, temperature is a major factor affecting the corrosion rate of 80S steel, and an increase in temperature accelerates the corrosion process.
(2)
The corrosion rate is also affected by the CO2 and H2S partial pressure ratio; high S content at high temperatures inhibits the corrosion process, and vice versa for low temperature.
(3)
With an increase in the temperature, the corrosion potential decreases, corrosion current density increases, and polarization curve gradually moves to the right.
(4)
The shape of the cathodic branch moves in the X-negative direction by increasing S content, and the cathodic reaction is jointly controlled by activation and diffusion processes, when the temperature is 100 °C, whereas the anodic branch of the polarization curve at a 3% concentration of Na2S.9H2O significantly changes and a passivation zone appears.
(5)
The results of the impedance spectra showed that the impedance radius of the metal decreases significantly at increasing temperatures. In addition, the Warburg impedance showed a more pronounced diffusion phenomenon with the incerase in H2S concentration.

Author Contributions

Writing—original draft preparation, P.S.; writing—review and editing, W.W. and X.J. All authors have read and agreed to the published version of the manuscript.

Funding

This research was funded by Shaanxi Yanchang Petroleum (Group) Co., Ltd. (Xi’an, China).

Data Availability Statement

Not applicable.

Conflicts of Interest

The authors declare no conflict of interest.

References

  1. Choi, Y.S.; Nesic, S.; Ling, S. Effect of H2S on the CO2 corrosion of carbon steel in acidic solutions. Electrochim. Acta 2011, 56, 1752–1760. [Google Scholar] [CrossRef]
  2. He, W.; Diplas, S.; Knudsen, O.Ø. Corrosion of stainless steel 316L in simulated formation water environment with CO2–H2S–Cl. Corros. Sci. 2009, 12, 2811–2819. [Google Scholar] [CrossRef]
  3. Fierro, G.; Ingo, G.M.; Mancia, F. XPS investigation on the corrosion behavior of 13Cr-Martensitic stainless steel in CO2-H2S-Cl environments. Corrosion 1989, 10, 814–823. [Google Scholar] [CrossRef]
  4. Sun, C.; Zeng, H.; Luo, J.L. Unraveling the effects of CO2 and H2S on the corrosion behavior of electroless Ni-P coating in CO2/H2S/Cl–environments at high temperature and high pressure. Corros. Sci. 2019, 148, 317–330. [Google Scholar] [CrossRef]
  5. Sun, J.; Sun, C.; Lin, X.; Cheng, X.; Liu, H. Effect of chromium on corrosion behavior of P110 steels in CO2-H2S environment with high pressure and high temperature. Materials 2016, 3, 200. [Google Scholar] [CrossRef] [Green Version]
  6. Asadian, M.; Sabzi, M.; Anijdan, S.H.M. The effect of temperature, CO2, H2S gases and the resultant iron carbonate and iron sulfide compounds on the sour corrosion behaviour of ASTM A-106 steel for pipeline transportation. Int. J. Press. Vessel. Pip. 2019, 171, 184–193. [Google Scholar] [CrossRef]
  7. Shabarchin, O.; Tesfamariam, S. Internal corrosion hazard assessment of oil & gas pipelines using Bayesian belief network model. J. Loss Prev. Process Ind. 2016, 40, 479–495. [Google Scholar]
  8. Prasad, A.R.; Kunyankandy, A.; Joseph, A. Corrosion inhibition in oil and gas industry: Economic considerations. Corros. Inhib. Oil Gas Ind. 2020, 135–150. [Google Scholar]
  9. Yin, Z.; Zhang, Y.; Chang, G. Corrosion Behavior and Characteristics of 3Cr Steel in Coexisting H2S and CO2 Containing Solutions. J. Mater. Eng. Perform. 2020, 29, 5442–5457. [Google Scholar] [CrossRef]
  10. Bueno, A.H.S.; Moreira, E.D.; Gomes, J.A.C.P. Evaluation of stress corrosion cracking and hydrogen embrittlement in an API grade steel. Eng. Fail. Anal. 2014, 36, 423–431. [Google Scholar] [CrossRef]
  11. Hu, K.; Zhuang, J.; Ding, J.; Ma, Z.; Wang, F.; Zeng, X. Influence of biomacromolecule DNA corrosion inhibitor on carbon steel. Corros. Sci. 2017, 125, 68–76. [Google Scholar] [CrossRef]
  12. Heakal, F.; Elkholy, A. Gemini surfactants as corrosion inhibitors for carbon steel. J. Mol. Liq. 2017, 230, 395–407. [Google Scholar] [CrossRef]
  13. Farsak, M.; Keleş, H.; Keleş, M. A new corrosion inhibitor for protection of low carbon steel in HCl solution. Corros. Sci. 2015, 98, 223–232. [Google Scholar] [CrossRef]
  14. Alvarez, P.E.; Fiori-Bimbi, M.V.; Neske, A.; Brandán, S.A. Rollinia occidentalis extract as green corrosion inhibitor for carbon steel in HCl solution. J. Ind. Eng. Chem. 2018, 58, 92–99. [Google Scholar] [CrossRef]
  15. Zhang, B.; He, C.; Wang, C.; Sun, P.; Li, F.; Lin, Y. Synergistic corrosion inhibition of environment-friendly inhibitors on the corrosion of carbon steel in soft water. Corros. Sci. 2015, 94, 6–20. [Google Scholar] [CrossRef]
  16. Wang, Q.; Tan, B.; Bao, H.; Xie, Y.; Mou, Y.; Li, P.; Chen, D.; Shi, Y.; Li, X.; Yang, W. Evaluation of Ficus tikoua leaves extract as an eco-friendly corrosion inhibitor for carbon steel in HCl media. Bioelectrochemistry 2019, 128, 49–55. [Google Scholar] [CrossRef]
  17. Mobin, M.; Rizvi, M. Polysaccharide from Plantago as a green corrosion inhibitor for carbon steel in 1 M HCl solution. Carbohydr. Polym. 2017, 160, 172–183. [Google Scholar] [CrossRef]
  18. Yang, D.; Ye, Y.; Su, Y.; Liu, S.; Gong, D.; Zhao, H. Functionalization of citric acid-based carbon dots by imidazole toward novel green corrosion inhibitor for carbon steel. J. Clean. Prod. 2019, 229, 180–192. [Google Scholar] [CrossRef]
  19. Ayukayeva, V.N.; Boiko, G.I.; Lyubchenko, N.P.; Sarmurzina, R.G. Polyoxyethylene sorbitan trioleate surfactant as an effective corrosion inhibitor for carbon steel protection. Colloids Surf. A Physicochem. Eng. Asp. 2019, 579, 123636. [Google Scholar] [CrossRef]
  20. Zafari, S.; Shahrak, M.N.; Ghahramaninezhad, M. New MOF-based corrosion inhibitor for carbon steel in acidic media. Met. Mater. Int. 2020, 26, 25–38. [Google Scholar] [CrossRef]
  21. Zhao, J.; Duan, H.; Jiang, R. Synergistic corrosion inhibition effect of quinoline quaternary ammonium salt and Gemini surfactant in H2S and CO2 saturated brine solution. Corros. Sci. 2015, 91, 108–119. [Google Scholar] [CrossRef]
  22. Roy, K.; Ho Lau, H.; Fang, Z.; Masood, R.; Ting, T.C.H.; Lim, J.B.P.; Lee, V.C.C. Effects of corrosion on the strength of self-drilling screw connections in cold-formed steel structures-experiments and finite element modeling. Structures 2022, 36, 1080–1096. [Google Scholar] [CrossRef]
  23. Ningshen, S.; Sakairi, M.; Suzuki, K.; Ukai, S. The corrosion resistance and passive film compositions of 12% Cr and 15% Cr oxide dispersion strengthened steels in nitric acid media. Corros. Sci. 2014, 78, 322–334. [Google Scholar] [CrossRef]
  24. Ye, Z.; Yang, H.; Huang, J.; Yang, J. A novel Zn-Al-Si corrosion resistant filler metal for Cu/Al brazing. Mater. Lett. 2017, 206, 201–204. [Google Scholar] [CrossRef]
  25. Mishra, A. Performance of corrosion-resistant alloys in concentrated acids. Acta Metall. Sin. (Engl. Lett.) 2017, 30, 306–318. [Google Scholar] [CrossRef] [Green Version]
  26. Abbas, M.H.; Norman, R.; Charles, A. Neural network modelling of high pressure CO2 corrosion in pipeline steels. Process Saf. Environ. Prot. 2018, 119, 36–45. [Google Scholar] [CrossRef] [Green Version]
  27. Hatami, S.; Ghaderi-Ardakani, A.; Chamkalani, R.; Niknejad, M.; Ganjiazad, E.; Rasaei, M.R.; Mohammadi, A.H. On the prediction of CO2 corrosion in petroleum industry. J. Supercrit. Fluids 2016, 117, 108–112. [Google Scholar] [CrossRef]
  28. Abd, A.A.; Naji, S.Z.; Hashim, A.S. Failure analysis of carbon dioxide corrosion through wet natural gas gathering pipelines. Eng. Fail. Anal. 2019, 105, 638–646. [Google Scholar] [CrossRef]
  29. Barker, R.; Hua, Y.; Neville, A. Internal corrosion of carbon steel pipelines for dense-phase CO2 transport in carbon capture and storage (CCS)–A review. Int. Mater. Rev. 2017, 62, 1–31. [Google Scholar] [CrossRef]
  30. Qi, J.; He, M.; Yin, Z.; Hui, H. Study on the performance of 80S and 80S -3Cr sulfur-resistant oil pipe materials under corrosive environment containing H2S/CO2. Mater. Prot. 2021, 54, 63–68, 78. [Google Scholar]
  31. Wang, J.; Lin, Y.; Zhang, Q.; Zeng, D.; Fan, H. Effect of treatment time on the microstructure of austenitic stainless steel during low-temperature liquid nitrocarburizing. Metall. Mater. Trans. A 2014, 45, 4525–4534. [Google Scholar] [CrossRef]
  32. Cao, C.N. Principles of Corrosion Electrochemistry; Chemical Industry Press: Beijing, China, 2008. [Google Scholar]
  33. Xu, X.; Yu, Z.; Cui, L.; Niu, X.; Cai, T. Microstructural characteristics of plasma nitrided layer on hot-rolled 304 stainless steel with a small amount of α-ferrite. Metall. Mater. Trans. A 2016, 47, 801–810. [Google Scholar] [CrossRef]
  34. Zhao, X.H.; Feng, Y.R.; Tang, S.W.; Zhang, J.X. Electrochemical Corrosion Behavior of 15Cr-6Ni-2Mo Stainless Steel with/without Stress under the coexistence of CO2 and H2S. Int. J. Electrochem. Sci. 2018, 13, 6296–6309. [Google Scholar] [CrossRef]
Figure 1. (a) Specimen after polishing; (b) the size of 80S steel.
Metals 12 01923 g001
Figure 2. Device Diagram.
Metals 12 01923 g002
Figure 3. Surface microscopic corrosion profiles of 80S steel at different temperatures at a total pressure of 8 MPa.
Metals 12 01923 g003
Figure 4. Surface microscopic corrosion profiles of 80S steel at different temperatures with pressure of 20 MPa.
Metals 12 01923 g004
Figure 5. Surface microscopic corrosion profiles of 80S steel at different temperatures with a pressure of 32 MPa.
Metals 12 01923 g005
Figure 6. Corrosion rate–temperature curve.
Metals 12 01923 g006
Figure 7. Polarization curve containing 0.3% Na2S.9H2O.
Metals 12 01923 g007
Figure 8. Polarization curve containing 3% Na2S.9H2O.
Metals 12 01923 g008
Figure 9. AC impedance spectra of 80S steel at different sulfur contents and different temperatures. (a) Measured curves (b) Fitting the curves.
Metals 12 01923 g009
Figure 10. Equivalent circuit diagram for fitting the AC impedance spectrum at different temperatures and different sulfur contents. (a) 0.3%Na2S.9H2O @ 30 and 60 °C; 3%Na2S.9H2O @ 30 °C; (b) 0.3%Na2S.9H2O @ 100 °C; 3%Na2S.9H2O @ 60 and 100 °C.
Metals 12 01923 g010
Table 1. Metal element content of 80S steel (%).
IngredientsCSiMnPSCrMoNiCu
Content0.260.180.560.0160.0020.930.170.0770.012
Table 2. Ionic fraction of extracted water media on site.
IonsNa+ + K+Ca2+Mg2+ClHCO3−SO42−
Concentration (mg/L)28,51820,739152190,657932378
Table 3. High temperature and pressure simulation experimental scheme.
Gas Pressure (MPa)Total Pressure 8 MPa
CO2
Partial Pressure 0.4
H2S Partial Pressure 8 × 10⁻⁴
Total Pressure 20 MPa
CO2
Partial Pressure 0.6
H2S Partial Pressure 0.12
Total Pressure 32 MPa
CO2
Partial Pressure 0.96
H2S Partial Pressure 3.2 × 10⁻³
Temperature (°C)30, 60, 10030, 60, 10030, 60, 100
Other conditionsCycle time 168 h, Produced water on site
Table 4. Electrochemical experimental protocol.
Temperature (°C)Experimental ConditionsTest Content
300.3%Na2S.9H2O with saturation CO2Dynamic potential polarization and electrochemical impedance
60
100
Table 5. Electrochemical experimental protocol.
Temperature (°C)Experimental ConditionsTest Content
303%Na2S.9H2O with saturation CO2Dynamic potential polarization and electrochemical impedance
60
100
Table 6. EDS energy spectrum elements.
ConditionsTemperature (°C)C (%)O (%)S (%)Fe (%)
Test A304.7019.520.3174.72
6015.0826.335.4253.81
100/52.772.4344.80
Test B3023.4814.813.1658.55
6015.3665.714.6314.92
1007.129.4325.0858.36
Test C303.422.80.273.5
604.221.30.174.1
10010.2720.427.9653.84
Table 7. Parameters for fitting the dynamic potential polarization curve of 80S steel.
Temperature (°C)Na2S.9H2O
Concentration (%)
Ecorr (V)Icorr (A·cm−2)Ba (mV·dec−1)Bc (mV·dec−1)Corrosion Rate (mm/a)
300.3−0.5563.01 × 10−534.362152.013.53 × 10−4
60−0.6021.09 × 10−478.245227.541.27 × 10−3
100−0.7735.02 × 10−4143.21301.755.89 × 10−3
303−0.6036.04 × 10−557.1161.317.09 × 10−4
60−0.6502.11 × 10−489.6203.72.48 × 10−3
100−0.6923.28 × 10−4121.6209.13.85 × 10−3
Table 8. AC impedance spectrum fitting parameters for 80S steel.
Parameters0.3%Na2S.9H2O3%Na2S.9H2O
30 °C60 °C100 °C30 °C60 °C100 °C
RS5.683.751.943.923.212.95
Rt23716551461391288194
Y01.02 × 10−43.57 × 10−44.02 × 10−41.89 × 10−43.89 × 10−49.56 × 10⁻³
n0.770.750.750.760.780.93
ZW//28.6 × 10−2/41.4 × 10−27.2 × 10−2
Publisher’s Note: MDPI stays neutral with regard to jurisdictional claims in published maps and institutional affiliations.