Article

The Effect of Direct Strip Casting on the Kinetics of Phase Transformation of a Dual Phase Steel

Future Industries Institute, University of South Australia, Adelaide 5001, Australia
*
Author to whom correspondence should be addressed.
Metals 2022, 12(2), 170; https://doi.org/10.3390/met12020170
Submission received: 2 December 2021 / Revised: 8 January 2022 / Accepted: 11 January 2022 / Published: 18 January 2022
(This article belongs to the Section Metal Casting, Forming and Heat Treatment)

Abstract

:
A dual phase steel has been produced directly from the liquid under conditions that simulate direct strip casting and thin slab casting. The kinetics of polygonal ferrite formation during the inter-critical anneal were quantified using the JMAK approach, and this revealed significantly retarded transformation kinetics in the strip cast samples compared to the commercial steel that was processed through the conventional hot rolling approach. The transformation rate in the strip cast samples were as much as three orders of magnitude slower compared to the commercial steel. It was found that the kinetics of the ferrite formation were retarded principally by the large prior austenite grain size in the strip cast samples, and this hypothesis was tested experimentally by both coarsening of the prior austenite grain size, and by refinement of the prior austenite grain size. However, even after grain size normalization, small differences in transformation kinetics between the direct strip cast and commercial steel specimens were observed. These differences were explained by investigation of MnS precipitation in the steels. It was found that the transformation rate is high when the solutes are in solid solution, and that the rate of transformation slows significantly when precipitation of nano-precipitates occurs.

1. Introduction

Dual phase steels (DP steels) have a microstructure containing a mixture of soft ferrite grains and hard martensite islands. Consequently, the mechanical behaviour of DP steels have an appealing balance of strength and formability [1]. The mechanical properties of DP steels are controlled by the martensite volume fraction, morphology, grain size, and the carbon content. It is known that higher martensite volume fractions increase the strength but decrease ductility in DP steels, but that, in general, coarser microstructures do not markedly affect the mechanical behaviour in tension [2,3,4,5]. It may therefore be possible to produce dual phase steels by different processing routes such as thin slab and direct strip casting, rather than the more energy intensive conventional processes.
Strip casting and thin slab casting are both receiving significant research and industrial interest because of their potential to reduce the energy required to convert liquid metal into sheet products [6]. However, there are significant metallurgical challenges associated with the implementation of these technologies, and most of these challenges arise from the rapid cooling rates experienced, and the restrictions in secondary processing. In the case of dual phase steels, the microstructures that will develop during rapid cooling are not known, and their behaviour during secondary processing has only been studied briefly [7]. The key processing step required to produce a DP steel is the inter-critical annealing step. For the case of strip cast material, the most energy efficient method to make a DP steel is to perform the inter-critical annealing step immediately after casting. This avoids the energetic expense of reheating the steel. It is experimentally challenging to simulate this process: the steel must be rapidly solidified, liberated from its casting, and then placed into the inter-critical annealing furnace before the specimen cools to the ferrite transformation temperature. The entire procedure, therefore, must occur in seconds. There has been limited research on this topic because of these experimental challenges. Therefore, in the present work, direct strip casting and thin slab casting of a dual phase steel is simulated, and the specimens placed into the inter-critical annealing furnace before the beginning of ferrite transformation. The microstructure of these specimens, specifically their ferrite transformation rate, are compared to a commercially available steel of the same composition.

2. Materials and Methods

2.1. Steel Production

A commercial steel, DP780, was chosen for this study. The chemical composition of the steel is given in Table 1. ThermoCalc predictions of the A1 and A3 temperatures for this steel are 668 °C and 825 °C.
To simulate strip casting and thin slab casting of this steel, a melt of the same composition was produced. Samples of the melt were taken with two different techniques to provide two different cooling rates. To simulate thin slab casting (TSC), samples were taken from the liquid steel melt in 12 mm thick discs. The specimens were broken out of their sand mold immediately after being removed from the melt, and placed under an optical pyrometer (Micro-Epsilon ThermoMETER, Micro-Epsilon Japan K.K., Osaka, Japan). This took less than 2 s and, at this time, the specimens typically had a temperature of ~1200 °C. The specimens were allowed to cool to just above the inter-critical annealing temperature, this took several seconds, they were then placed into the furnace at the required temperature.
The direct strip cast (DSC) specimens were produced using the immersion apparatus [8]. The samples solidify on the substrate when the paddle is immersed into the melt, and when the paddle is retracted from the melt the samples were immediately removed from the substrate and put into a muffle furnace for the inter-critical annealing step. This took ~2 s. The two different cooling rates are shown in Figure 1c.

2.2. Heat Treatment Equipment

For inter-critical annealing heat treatment, two tube furnaces were located next to each other and preheated to different temperatures, one was set at the austenitizing temperature (920 °C) and the other at the inter-critical annealing temperature.
Re-austenitizing was carried out at 920 °C using a Split Tube Furnace (MTI corporation, Richmond, CA, USA) equipped with an alumina tube. The furnace was pre-heated to 920 °C and the experiment was carried out under flowing argon atmosphere to prevent any oxidation. The samples were then removed from the first furnace and immediately placed into the second furnace, which was a Horizontal Tube Furnace (Labec, Marrickville, Australia) with a quartz tube under flowing argon atmosphere. This second furnace was preheated at the required inter-critical annealing temperature, which was between 630 °C and 850 °C. Rapid transfer of specimens between tube furnaces was achieved by attaching them to a steel rod using an envelope of stainless-steel foil. This method also allowed rapid quenching in water after removal from the second tube furnace.

2.3. Heat Treatment Schedules

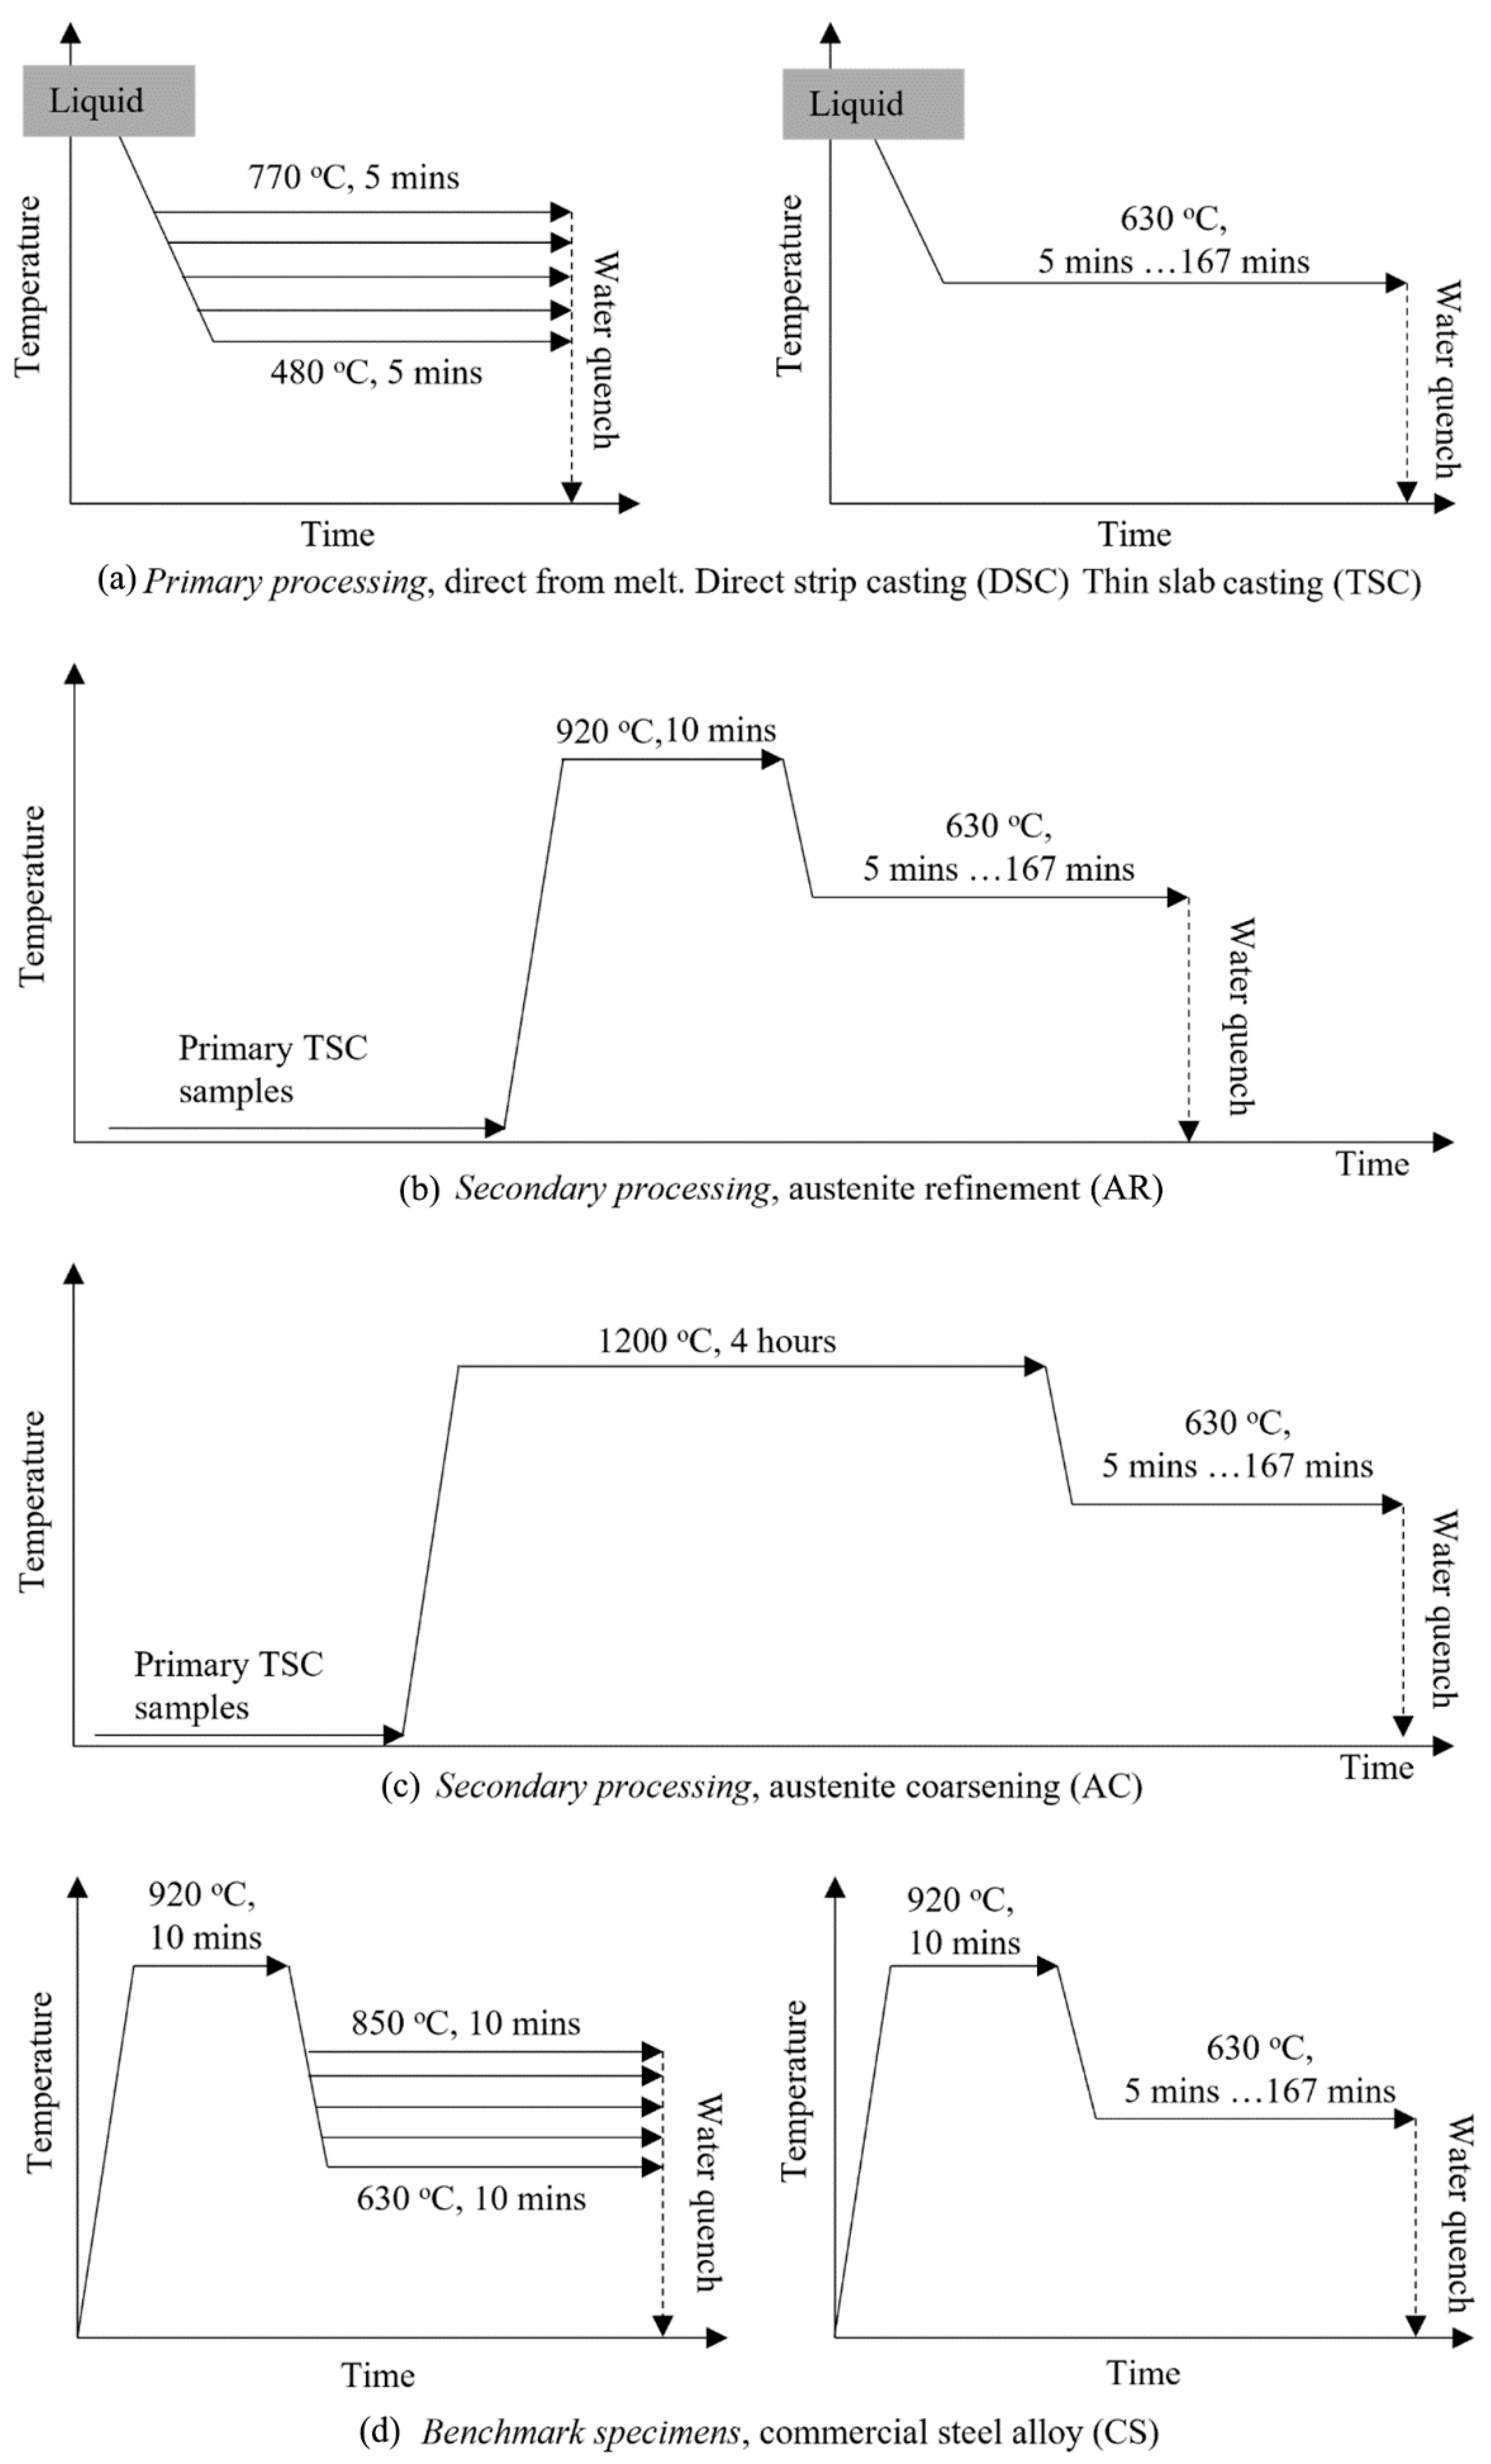
Four types of heat treatments were carried out, as shown in Figure 2. Primary heat treatments, which were carried out directly from the melt. Secondary heat treatments, where samples were cooled to room temperature after being cast, and then re-heated into the austenite phase field to either coarsen or refine the austenite grain size (referred to here as austenite coarsened, AC, or austenite refined, AR, specimens). Benchmark heat treatments were identical to the secondary heat treatments, but carried out on a commercial steel of the same composition as the one made in the laboratory for the casting experiments. The difference between these treatments is summarized below, and described in more detail in the following paragraphs.

2.3.1. Primary Processed Specimens

The primary heat treated samples are those that were obtained directly from the melt. As described above, these specimens were placed into the heat treatment furnace while still at high temperature, and were not allowed to cool below the transformation temperature between extraction form the furnace and entry into the heat treatment furnace. Two specimen types were examined: specimens of ~1.5 mm thickness that were made with the dip caster which simulated direct strip casting (DSC); and 12 mm thick disc specimens that simulate thin slab casting (TSC). For both DSC and TSC specimen types, a full series of isochronal heat treatments (5 min at temperatures between 480 °C and 770 °C) and isothermal heat treatments (between 5 min and 176 min at 630 °C) were carried out.

2.3.2. Secondary Processing—Austenite Refinement (AR)

Secondary heat treatments were carried out only on TSC samples because these were larger than the DSC samples and allowed for more specimens to be made. As will be described later in this manuscript, the microstructure of DSC and TSC sample were found to be similar, so the use of TSC samples was sufficient to describe the behaviours being investigated.
The starting materials for the secondary heat treatments were TSC samples. The two specific sample types chosen for secondary treatment were TSC samples that had been given a primary heat treatment of 480 °C and 770 °C. The secondary treatment was carried out by heating specimens from room temperature to 920 °C for 5 min, this austenitized the microstructure. The specimens were then placed immediately into a second furnace at the inter-critical annealing temperature of 630 °C and held for times between 5 min and 167 min (10,000 s).

2.3.3. Secondary Processing—Austenite Coarsening (AC)

The secondary heat treatment for austenite coarsening was carried out by heating the specimens from room temperature to 1200 °C for 240 min, this austenitized the microstructure and coarsened the austenite grains to approximately 200 μm. The specimens were then immediately placed into an adjacent furnace at the inter-critical annealing temperature of 630 °C and held for times between 5 min and 167 min (10,000 s).

2.3.4. Benchmark Commercial Steel (CS)

Heat treatments the same as those carried out on the laboratory specimens were also carried out on a commercially purchased DP steel of the same composition as the DSC and TSC samples. In this case, the samples were austenitized at 920 °C for 5 min, then immediately placed in an adjacent furnace at inter-critical annealing temperature. Specimens were given both isochronal (5 min) inter-critical annealing treatments between 630 °C and 850 °C, as well as isothermal treatments (630 °C) for between 5 min and 167 min (10,000 s).

2.4. Microstructural Analysis

All samples were examined using optical microscopy. The samples were metallographically prepared by cold mounting in acrylic Technovit power and hardener, grinding with abrasive paper, and then polishing with diamond paste. The final preparation step was polishing with 1 μm diamond paste. For optical microscopy, samples were etched with 3% Nital (3% nitric acid in ethanol). For Scanning Electron Microscope (SEM) analysis, the samples were given an additional preparation step of 2–5 min polishing with colloidal silica. SEM was carried out on a Zeiss Merlin FEG SEM (Carl Zeiss AG, Oberkochen, Germany) at 15 kV. For Transmission Electron Microscope (TEM) analysis, samples were prepared by ion polishing system version 2.0 (PIPS II, Gatan, Inc., Pleasanton, CA, USA), 5 keV at 8° angle was used to create a small hole for 1.5 h. The hole was then refined with 2.5 keV followed by 1 keV and lastly 400 eV all at 5° for 30 min. TEM analysis was carried out on JEOL JEM-2100F-HR TEM (JEOL Ltd., Tokyo, Japan) at 200 kV. The point counting method was used to measure the volume fraction of ferrite in each specimen.

3. Results

3.1. Microstructural Characterisation

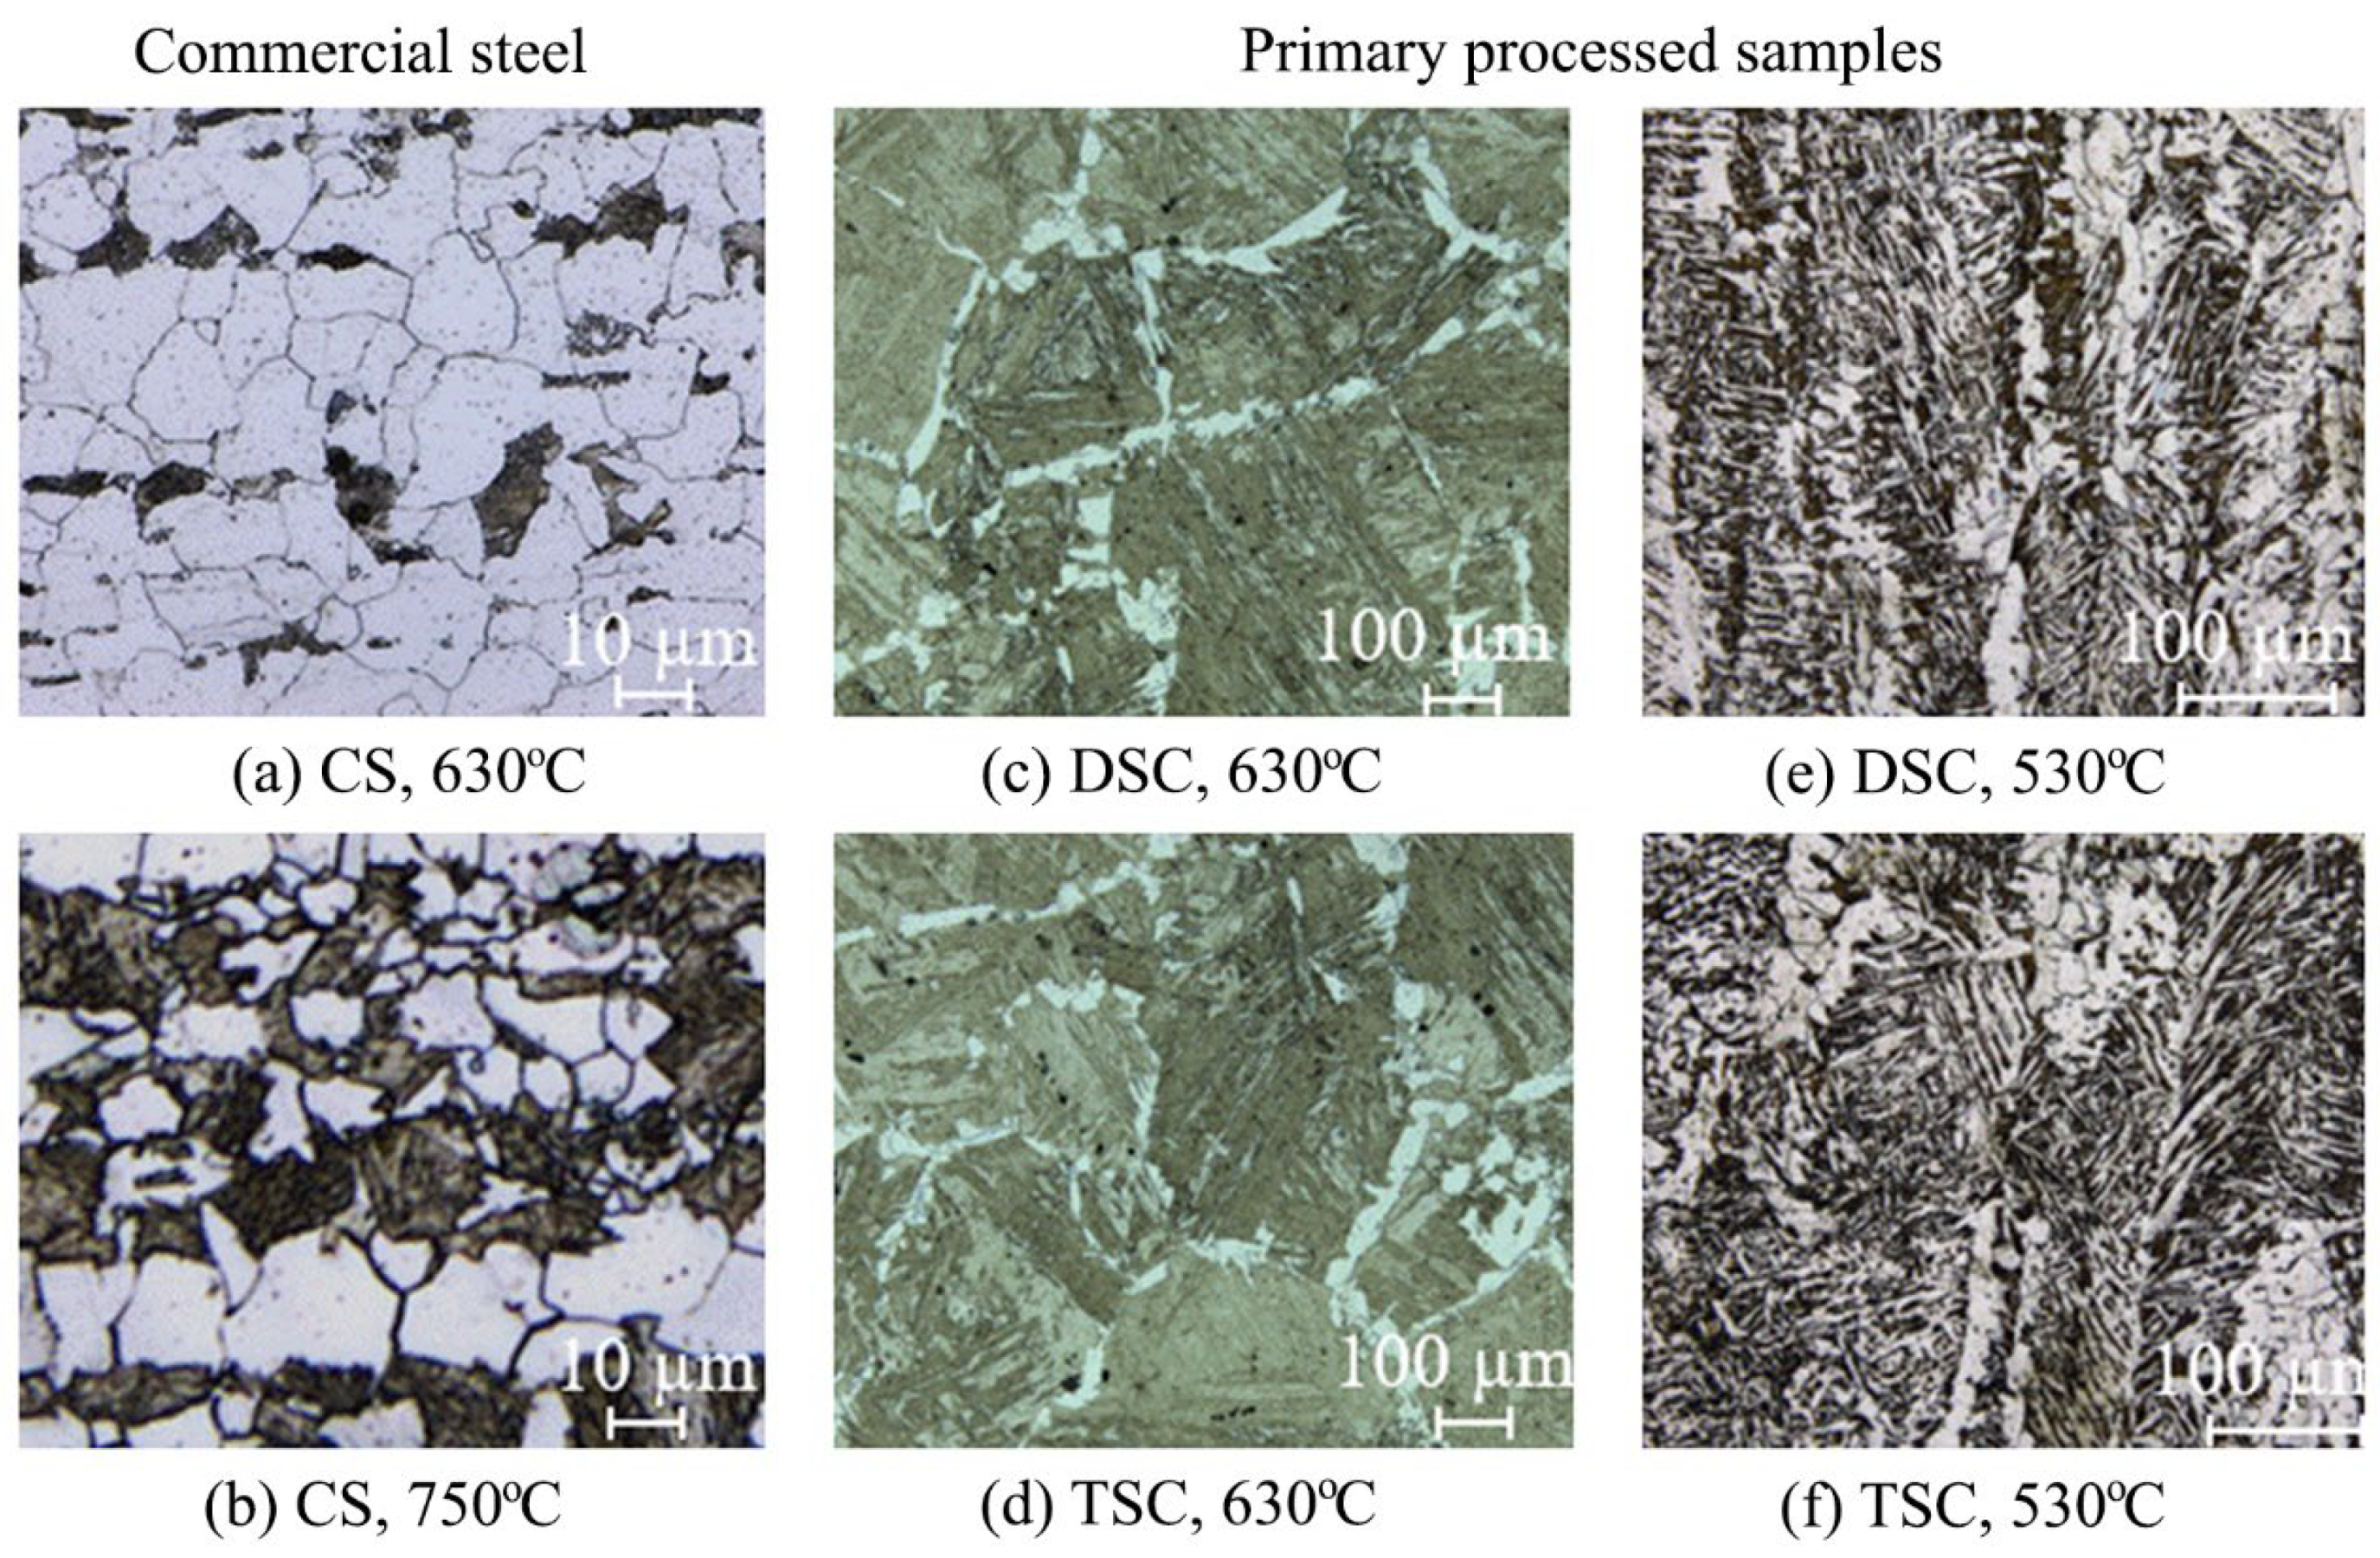
The microstructures observed from the commercial steel after inter-critical annealing and shown in Figure 3a,b. The microstructures consist of a mixture of ferrite and martensite, and have a morphology and scale consistent with those previously reported in the literature, for example [9,10,11,12]. Additionally, shown in Figure 3 are typical examples of the microstructures observed in specimens after primary heat treatment, those that were all rapidly solidified from the melt, Figure 3c–f. Two different microstructures were observed. For those samples that were isothermally held at temperatures above 550 °C, polygonal ferrite formed at the prior austenite grain boundaries during the inter-critical annealing, and upon water quenching the remaining austenite transformed to martensite. For samples isothermally heat treated below 550 °C, heat treatment allowed the transformation of only small volumes of polygonal ferrite at the austenite grain boundaries. The remainder of the microstructure transformed to bainite during the heat treatment. None of the TSC or DSC samples held at different temperatures showed the high volume fractions of ferrite that are evident in the commercial steel materials, such as that shown in Figure 3a.
The microstructures were used to estimate the prior austenite grain size, and was found to be 32 ± 7 μm for the commercial steel, 309 ± 50 μm and 292 ± 62 μm for the TSC and DSC samples, respectively. It is also worth noting that the microstructure of the TSC and DSC samples is very similar for a given heat treatment schedule. For this reason, the secondary heat treatments were only carried out on the TSC samples.
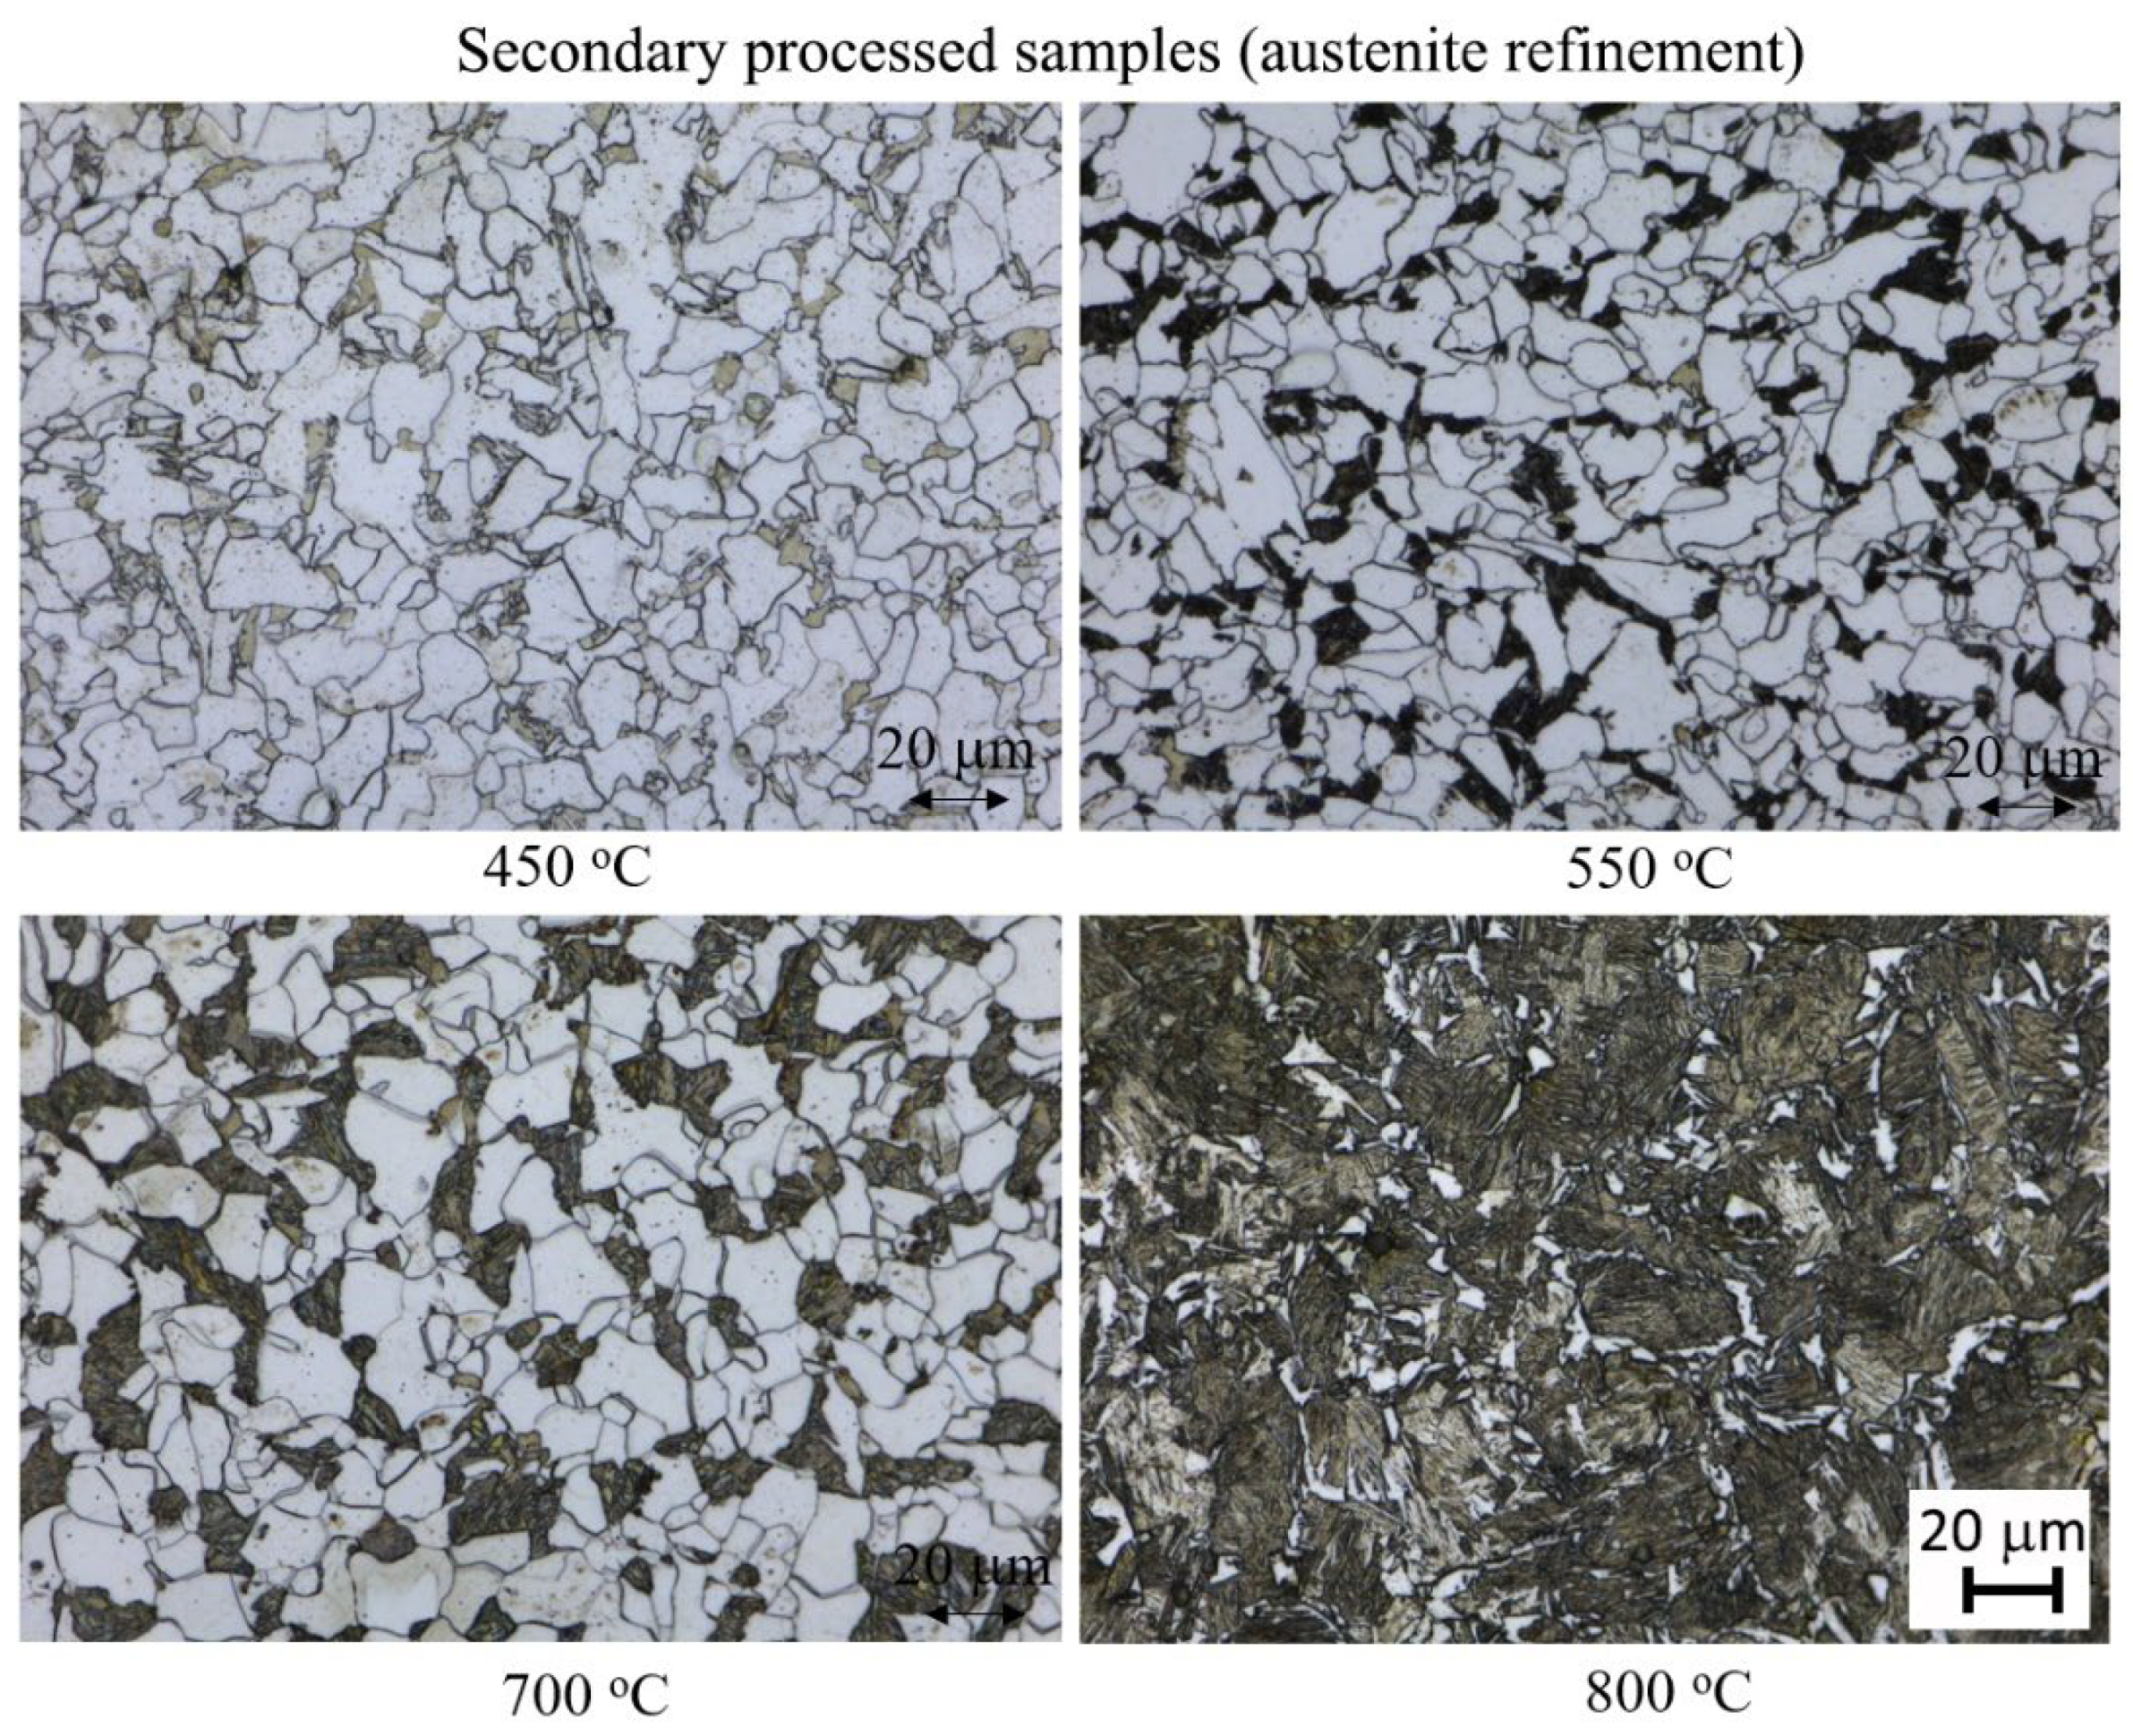
Microstructures from specimens subject to secondary heat treatment are shown in Figure 4. These specimens were heated in the austenite phase field and then given different inter-critical annealing treatments. The microstructure of specimens after secondary heat treatment produced only two phases: dark etching regions of martensite, and light etching regions of polygonal ferrite. These specimens look similar to the commercial steel shown in Figure 3a,b. As the heat treating temperature increased, the amount of martensite also increased, with the amount of martensite at 450 °C being negligible, but increasing to be nearly fully martensitic at 800 °C. The microstructures of the quenched specimens were used to estimate the prior austenite grain size, and was found to be 21 ± 4 μm. This indicates that the prior austenite grain size has been significantly reduced by the primary heat treatment.
The microstructures formed after the higher temperature secondary heat treatment, 1200 °C, during which the austenite grain size was coarsened, are shown in Figure 5. In these specimens the ferrite formation was relatively slow, with incomplete ferrite formation continuing to times greater than 3000 s, Figure 5. The microstructures of the quenched specimens were used to estimate the prior austenite grain size, and was found to be 195 ± 57 μm.

3.2. Kinetics of Transformation during Inter-Critical Annealing

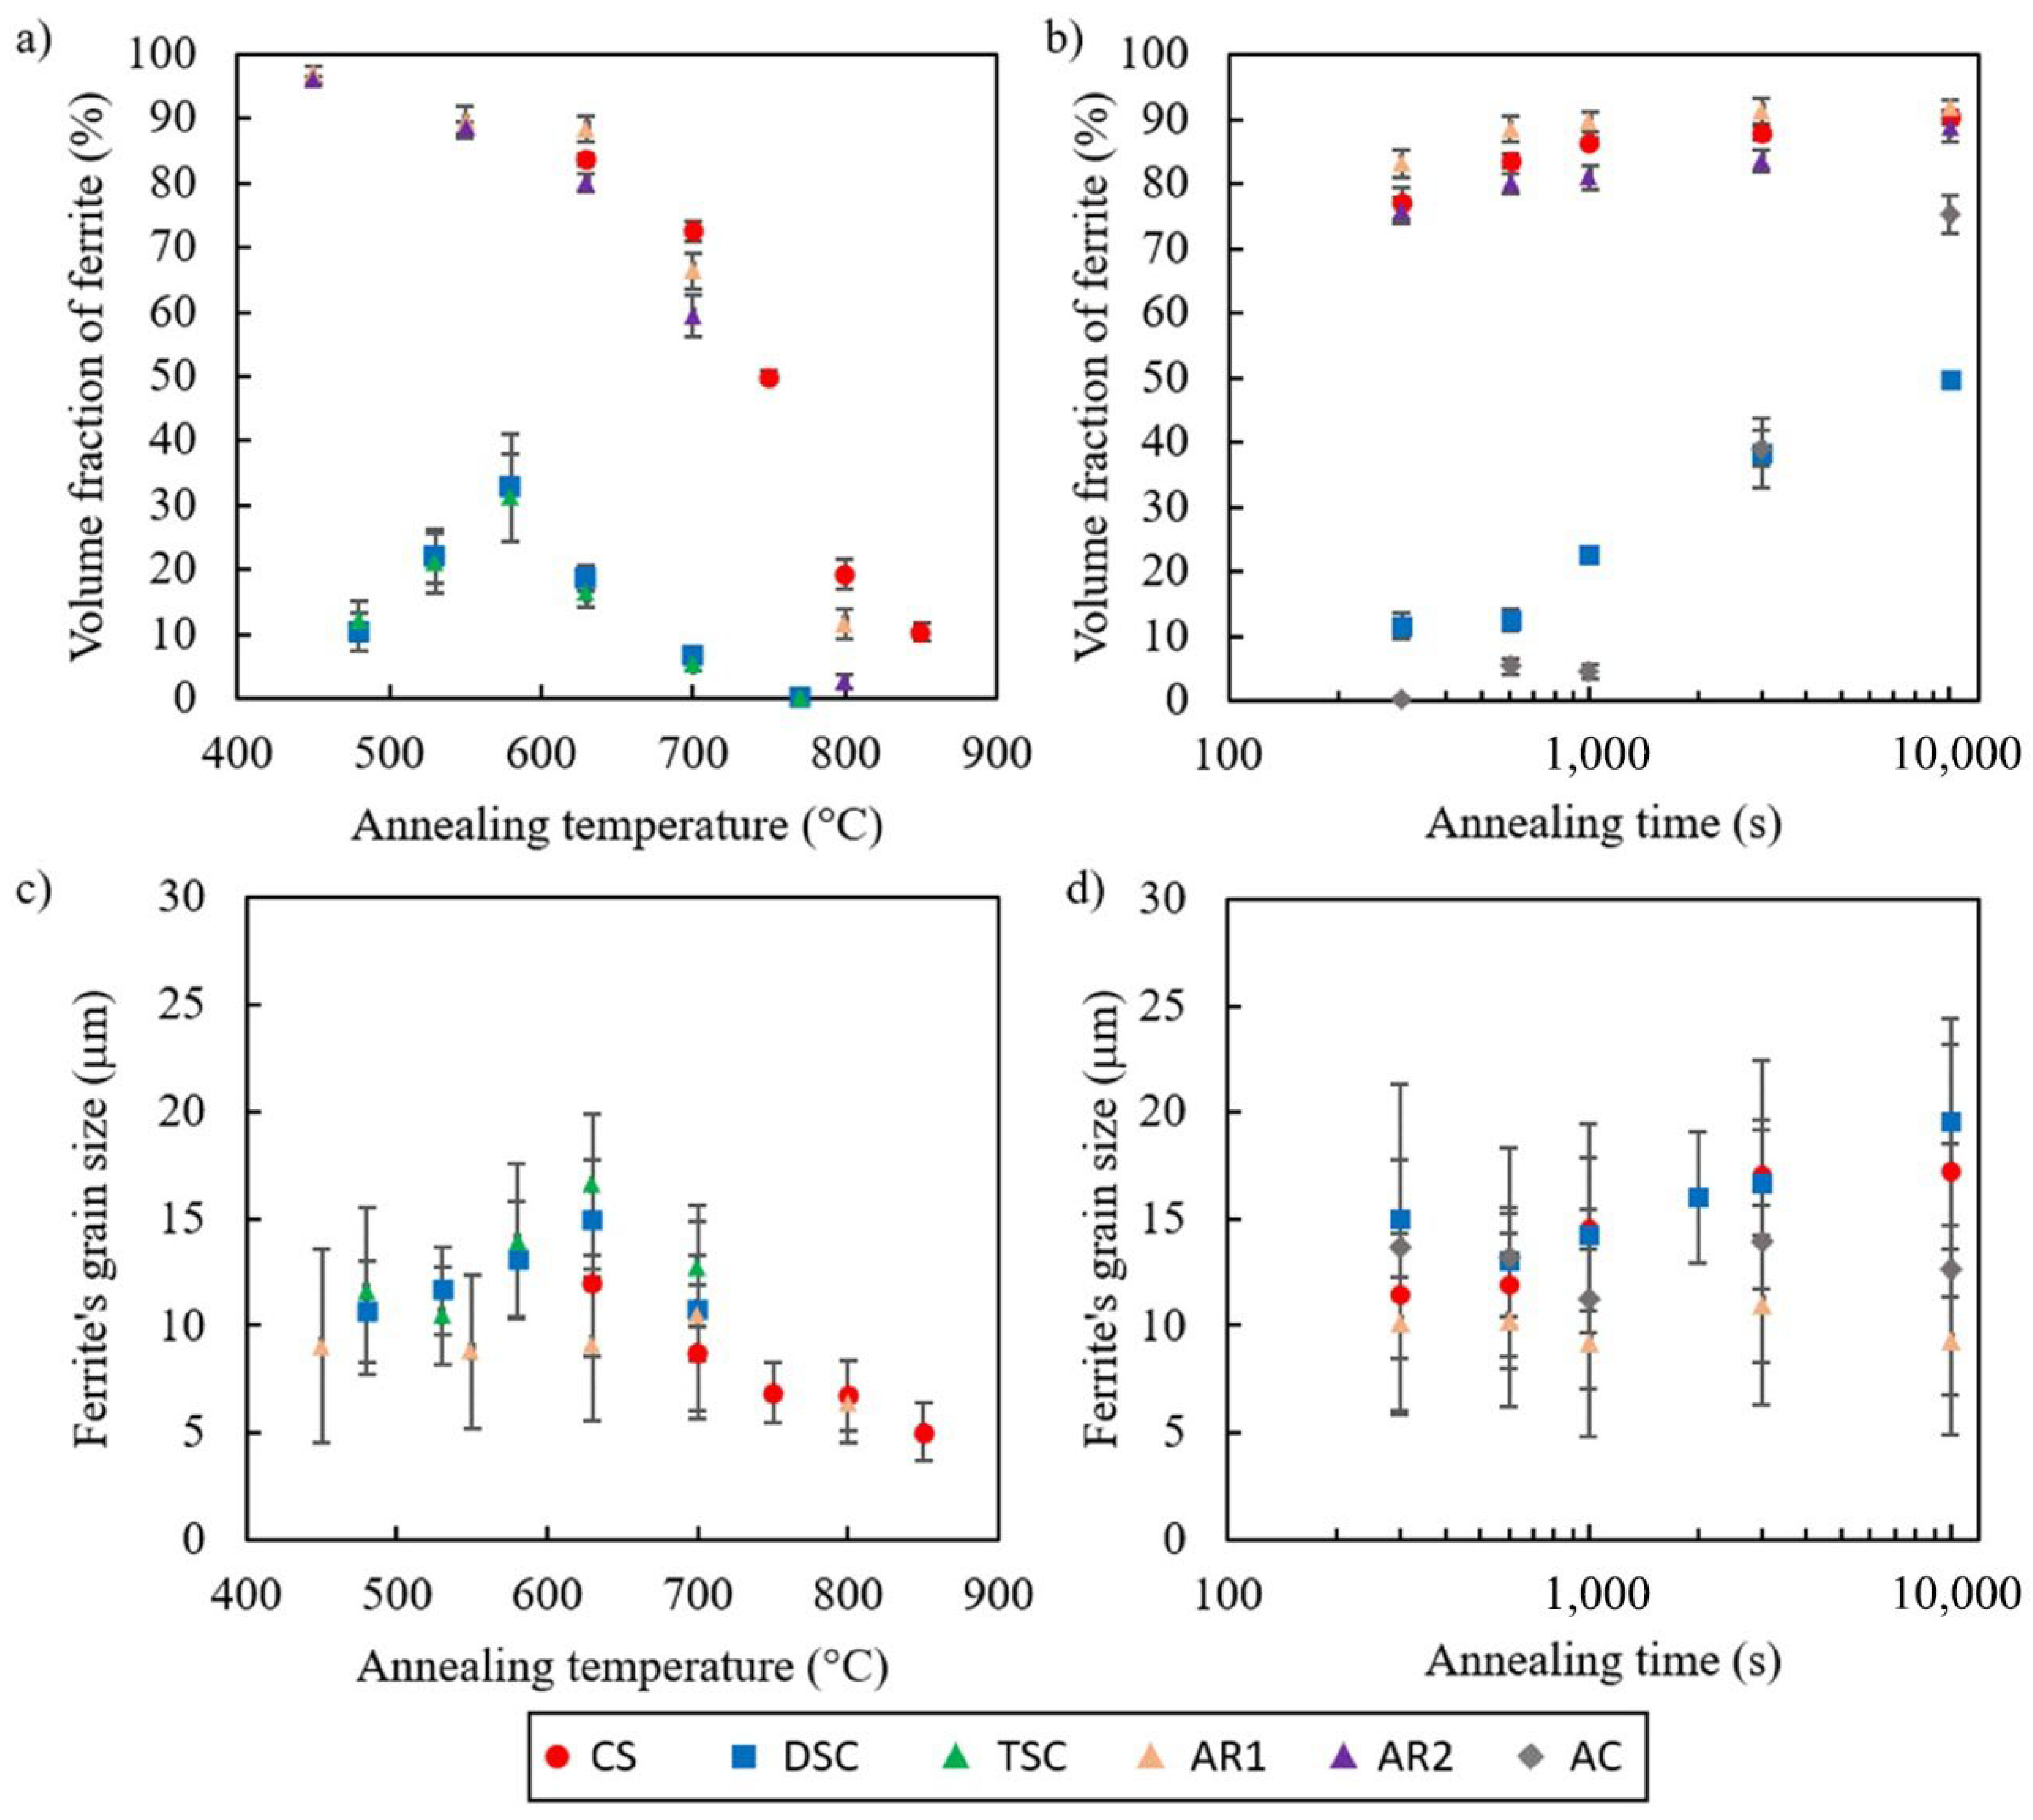
The size and volume fraction of polygonal ferrite was quantified for each specimen, Figure 6. Examining the volume fraction data in Figure 6a,b, it can be seen that there are two distinct groupings. The commercial steel, along with the secondary processed samples (AR1 and AR2) show much higher volume fractions of ferrite compared to the DSC, TSC and AC (austenite coarsened) samples. This is most evident in Figure 6b where the increase in volume fraction with time has been plotted. The commercial steel shows nearly full transformation to ferrite after about 300 s, while the DSC samples have only transformed by ~10%. Even after 10,000 s of extended inter-critical annealing time, the transformation remains incomplete for the DSC sample (Figure 6b).
With regard to the ferrite grain size, there was little difference between specimens. The grain size measurements have relatively large error bars due to the inhomogeneity of grain sizes and grain shapes observed, particularly in the primary process specimens (see Figure 3).

3.3. Electron Microscopy

Selected specimens were examined by SEM, and an example is shown in Figure 7. Nano-precipitates were observed in the DSC samples after extended inter-critical annealing times. Nano-precipitates were observed at the boundaries between polygonal ferrite grains, and between polygonal ferrite and prior austenite grains (which transformed to martensite upon quenching). Since the precipitates were sub-micron in size, chemical analysis was carried out in the TEM. TEM analysis showed that there were two populations of particles. Larger spherical particles ~1–2 μm in diameter were found to be enriched in Mn and S (Figure 7b). The second population of particles were smaller, and had a size range of 0.1 to 0.5 μm. These smaller particles were enriched in Mn, Si, and O, and were observed to form clusters around the grain boundaries (Figure 7c).

4. Discussion

4.1. The Kinetics of Transformation during Isothermal Holding

During isothermal holding at 630 °C, two distinct groupings could be observed in the data (Figure 6b), one group of specimens (including the commercial steel) transformed rapidly, while the other group (including the DSC samples) showed slow transformation which remained incomplete even after 10,000 s of inter-critical annealing. The following discussion will quantify this difference in behaviour.
The kinetics of phase transformations can be described in terms of the nucleation rate and growth rate of the newly formed phase. A simple method to do this is to use the Johnson–Mehhl–Avrami–Kolmogorov (JMAK) model. Although commonly used for recrystallisation, Jia, Lusk, Soleimani, Ashrafi, and Xiong [10,11,12,13,14,15] have successfully applied the JMAK model in phase transformation of steels. Due to its simplicity, the JMAK model is utilised here to describe the kinetics of the phase transformation. The JMAK equation is [16]:
X v = 1 exp   ( f N ˙ G 3 ˙ t 4 4 )
Or
X v = 1 exp ( k t n )  
where Xv is the volume fraction of transformed polygonal ferrite.
f is the shape factor (4π/3 for spheres);
t is the time;
N ˙ is the nucleation rate;
G ˙ is the grain growth rate.
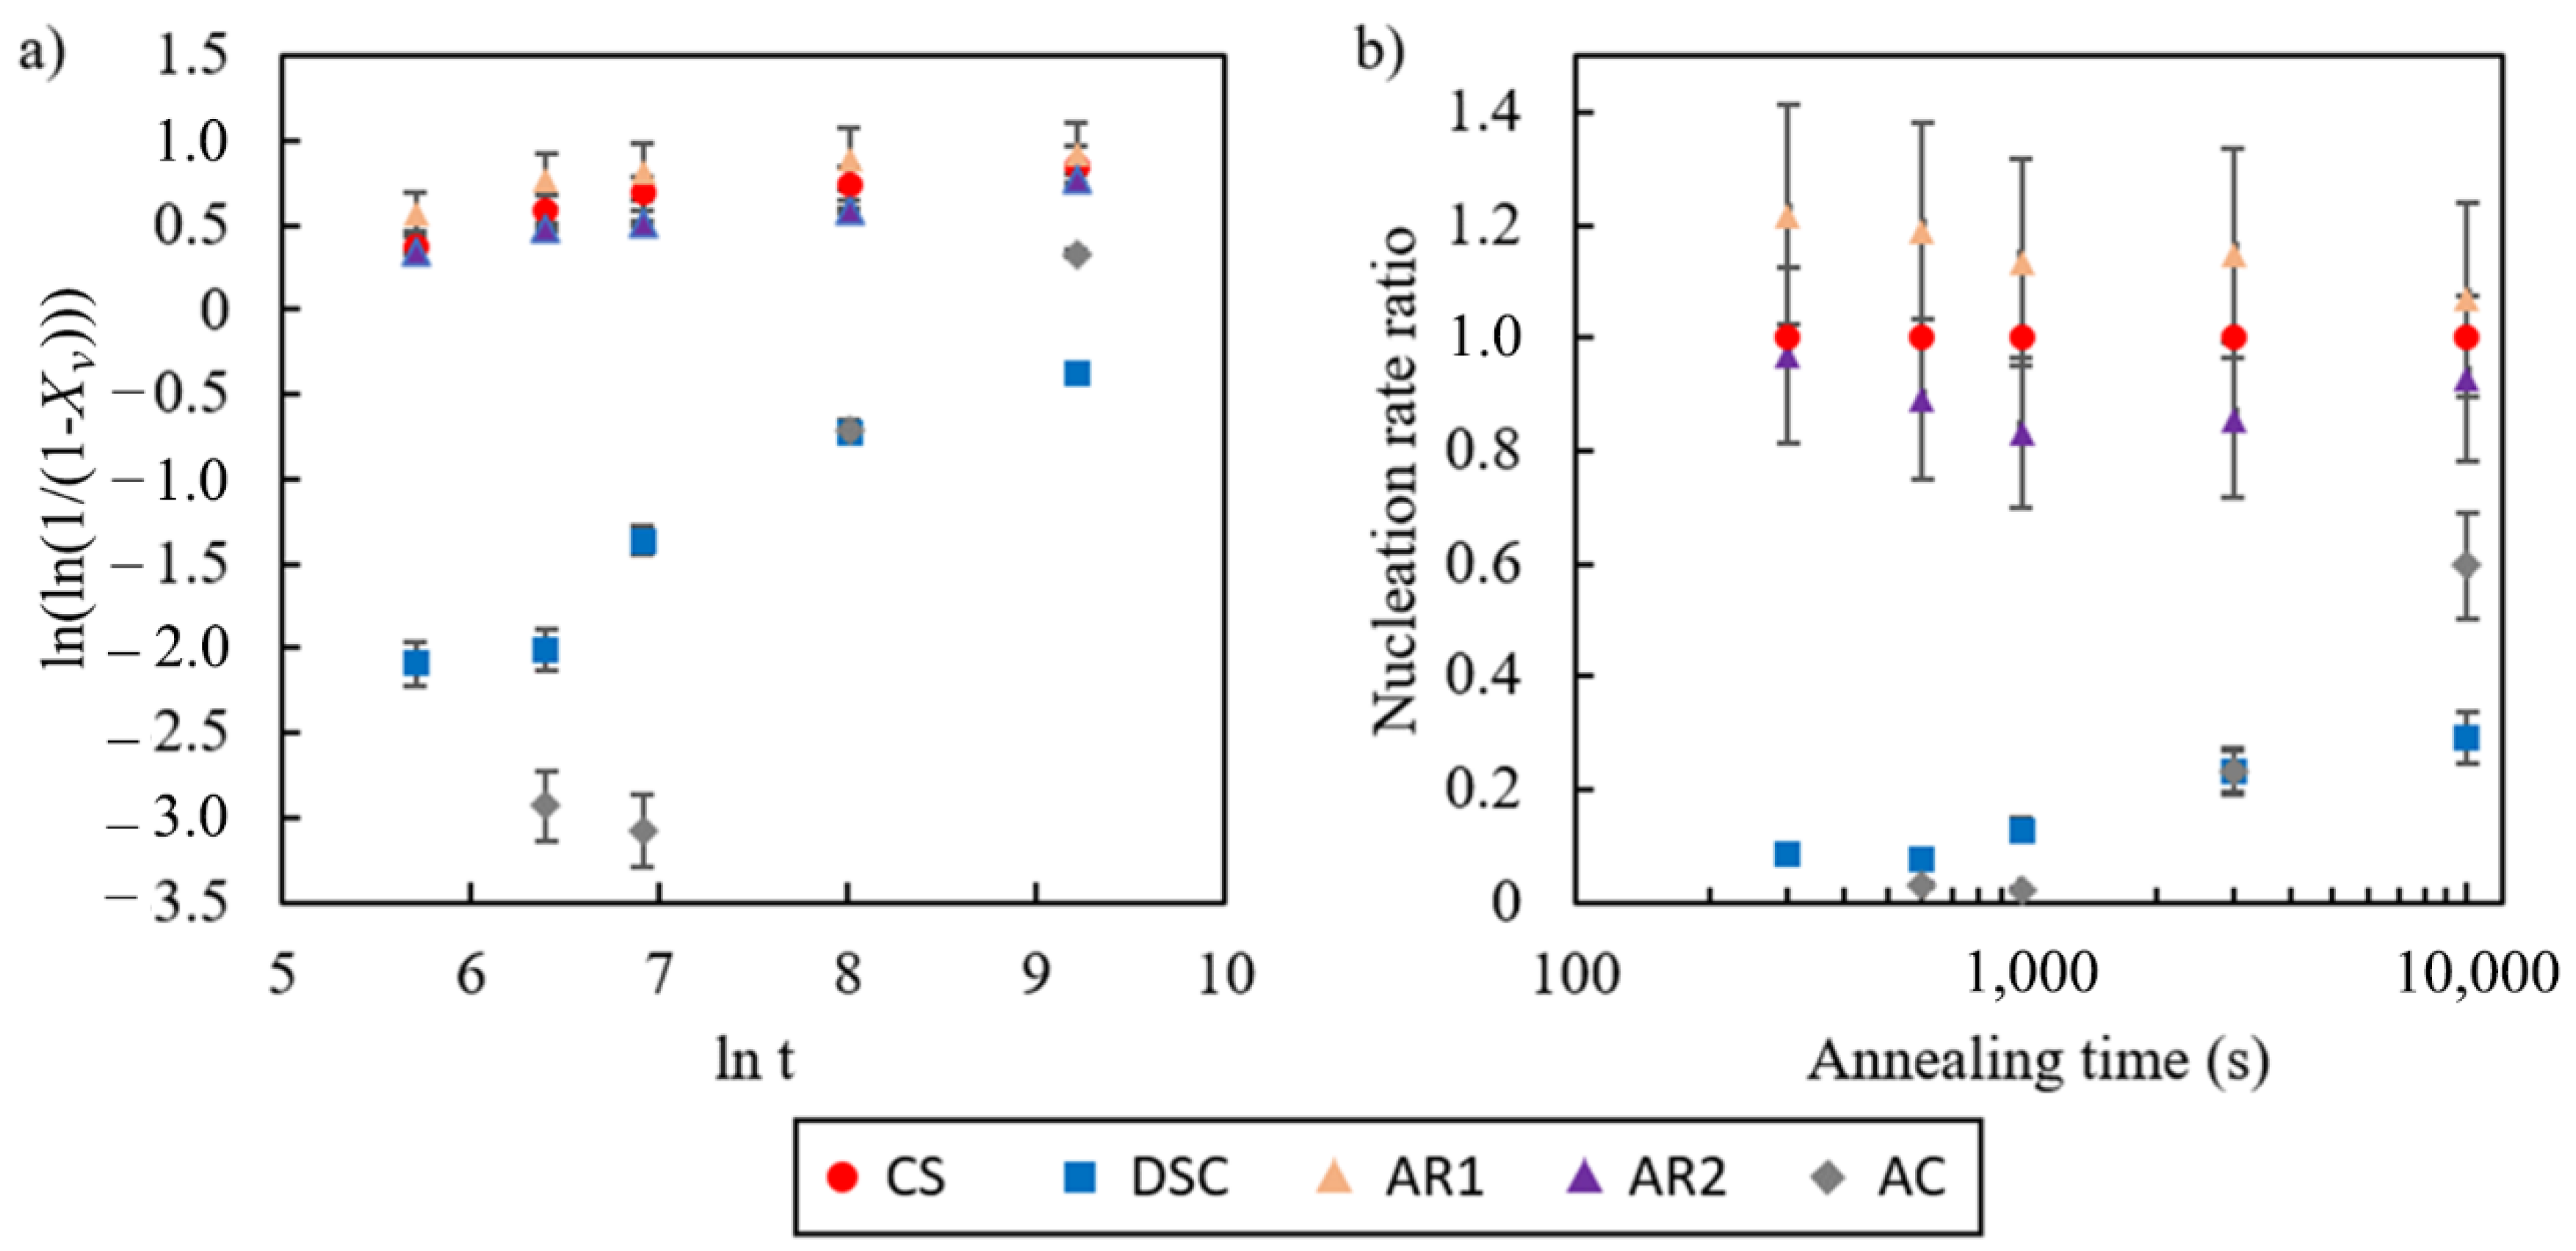
The JMAK plot for all experimental data is shown in Figure 8a. Consistent with the data shown in Figure 6, it can be seen that the commercial and secondary processed steels have a similar transformation kinetics, and that the DSC specimen is an outlier.
To further interrogate the difference in transformation kinetics, the exponent k was used to examine the nucleation rate N ˙ . Since it was found that all specimens have a similar grain size (Figure 6d), indicative of all specimens having a similar ferrite growth rate, it was assumed that G ˙ was a constant for all specimens. The nucleation rate is expressed here as a ratio, normalised by the nucleation rate for the commercial steel, N R ˙ = N ˙ N C S ˙ . A ratio of 1 indicates that the nucleation rate of the ferrite is similar to the nucleation rate in a commercial steel, while a ratio less than one indicates that the rate of nucleation is less than is observed in the commercial steel. The experimentally determined values of N R ˙ are shown in Figure 8b. It can be seen that the nucleation rate of the two secondary processed steels is close to that of the commercial steel, but the nucleation rate of the DSC sample is significantly less than 1. This indicates that the significantly reduced reaction kinetics in the DSC sample are a result of reduced nucleation rate. The austenite coarsened (AC) specimen also shows a much reduced nucleation rate compared to the commercial steel.
The decrease in nucleation density is explained by the coarse prior austenite grain size in the primary processed and austenite coarsened samples—nucleation of ferrite was only observed at the prior austenite grain boundaries. Classical stereology can be used to estimate the difference in grain boundary area between the different sample sets by considering the average grain size [17]:
S v = 2 D AVE
Sv = grain boundary surface area per unit volume;
DAVE = average grain size from the linear intercept method.
With a prior austenite grain size of ~300 μm, the samples subject to primary processing have a grain boundary surface area of 0.007 μm2/μm3, compared to 0.07 μm2/μm3 in the commercial steel which has a prior austenite grain size of ~30 μm. This ten times difference in the grain boundary area between samples supports the notion that the delayed kinetics in the primary processed specimens, and the austinite coarsened specimens, that are inter-critically annealed directly from the melt is the result of the larger prior austenite grain size in this case. If the nucleation rate ratio is plotted as a function of the prior austenite grain size, a linear relationship can be found, Figure 9b.

4.2. Comparision with Literature

An analysis using the JMAK equation was carried out to determine the parameters k and n for all of the specimens examined here, see Equation (2). The results from the current study are detailed Table 2. The data from similar studies have also been used to compare with the present results, as shown in Table 2. Soleimani et al. [12] have also pointed out that exponent n and k are dependent on annealing temperature. Therefore, in order to compare these studies to the current work, JMAK parameters were extrapolated to compare with the temperature used in the present work, 630 °C.
From the microstructural results shown by Ashrafi et al. [11], Soleimani et al. [12], Xiong et al. [15], and Xiong et al. [10], the prior austenite grain sizes can be measured to be 15 µm, 40 µm, 100 µm, and 120 µm, respectively. Using Equation (3), the grain boundary area (GBA) was calculated for these studies, and the data collated in Figure 10. It can be seen that for most datum points there is a linear relationship between k and the GBA. The one outlier was the dataset from reference [11]. It is unclear why this steel should be so far from the others found in the literature. The microstructures are comparable, and the ferrite grain sizes and morphologies are not too dissimilar to those measured here. It is possible that the prior austenite grain size (PAGS) estimated by the present authors from the published micrographs in reference [11] was incorrect. Apart from this one outlier, the remainder of the data show consistent behaviour. This is indicative that the steel composition examined here is a good representation of similar dual phase steel compositions.

4.3. Effect of Nano-Precipitates

As discussed, the prior austenite grain size is found to be the main factor in determining the kinetics of transformation in this steel. However, the transformation kinetics for the DSC and austenite coarsened (AC) specimens were not identical, Figure 11. These specimens had similar prior austenite grain sizes, but the differences in transformation kinetics require further analysis. The difference between the DSC specimen, which was made directly from the melt, and the austenite coarsened specimen, which was produced by extended annealing the austenite phase field, is the behaviour of the interstitials. It has been shown that interstitial elements, such as N [18] and S [19], remain in the solid solution after direct strip casting due to the rapid cooling conditions. During subsequent heat treatments, such as inter-critical annealing [20,21,22], these solutes form precipitates, preferentially located along the grain boundaries and phase boundaries. This is consistent with the observations made here, as shown in Figure 7a, where sulphur-enriched precipitates were observed along the boundary regions after extended annealing at 630 °C. In previous literature, it has been speculated that these precipitates may inhibit the transformation of austenite to ferrite after strip casting [23]. Most notably, a paper by Dorin et al. [24] shows that during a coiling treatment the polygonal ferrite develops a morphology that mirrors the shape of the dendrites that formed during solidification. In some samples in the present experiments, a similar observation was made, as shown in Figure 12b. It might be possible that these precipitates contribute to the delay in transformation kinetics observed here.
The composition of the precipitates observed here are complex (Figure 7b,c), but we can examine their behaviour by looking at the behaviour of MnS as a benchmark for precipitation kinetics. Studies by Sun et al. [25,26] showed that at approximately 600 °C, MnS precipitation begins at ~1000 s and is complete by ~10,000 s. Therefore, those samples that were inter-critically annealed at 630 °C for 5 min (300 s) would not have MnS precipitates, and the S and Mn would be retained in solid solution. For this reason, the strip cast specimen in Figure 11 produced a larger transformed fraction for the first 1000 s of annealing compared to the AC specimen. After 1000 s, MnS precipitation begins, and this has a retarding effect on the rate of transformation. Consequently, after 10,000 s, the DSC sample shows a lower transformed fraction than the AC specimen.

4.4. The Kinetics of Transformation during Isochronal Treatment

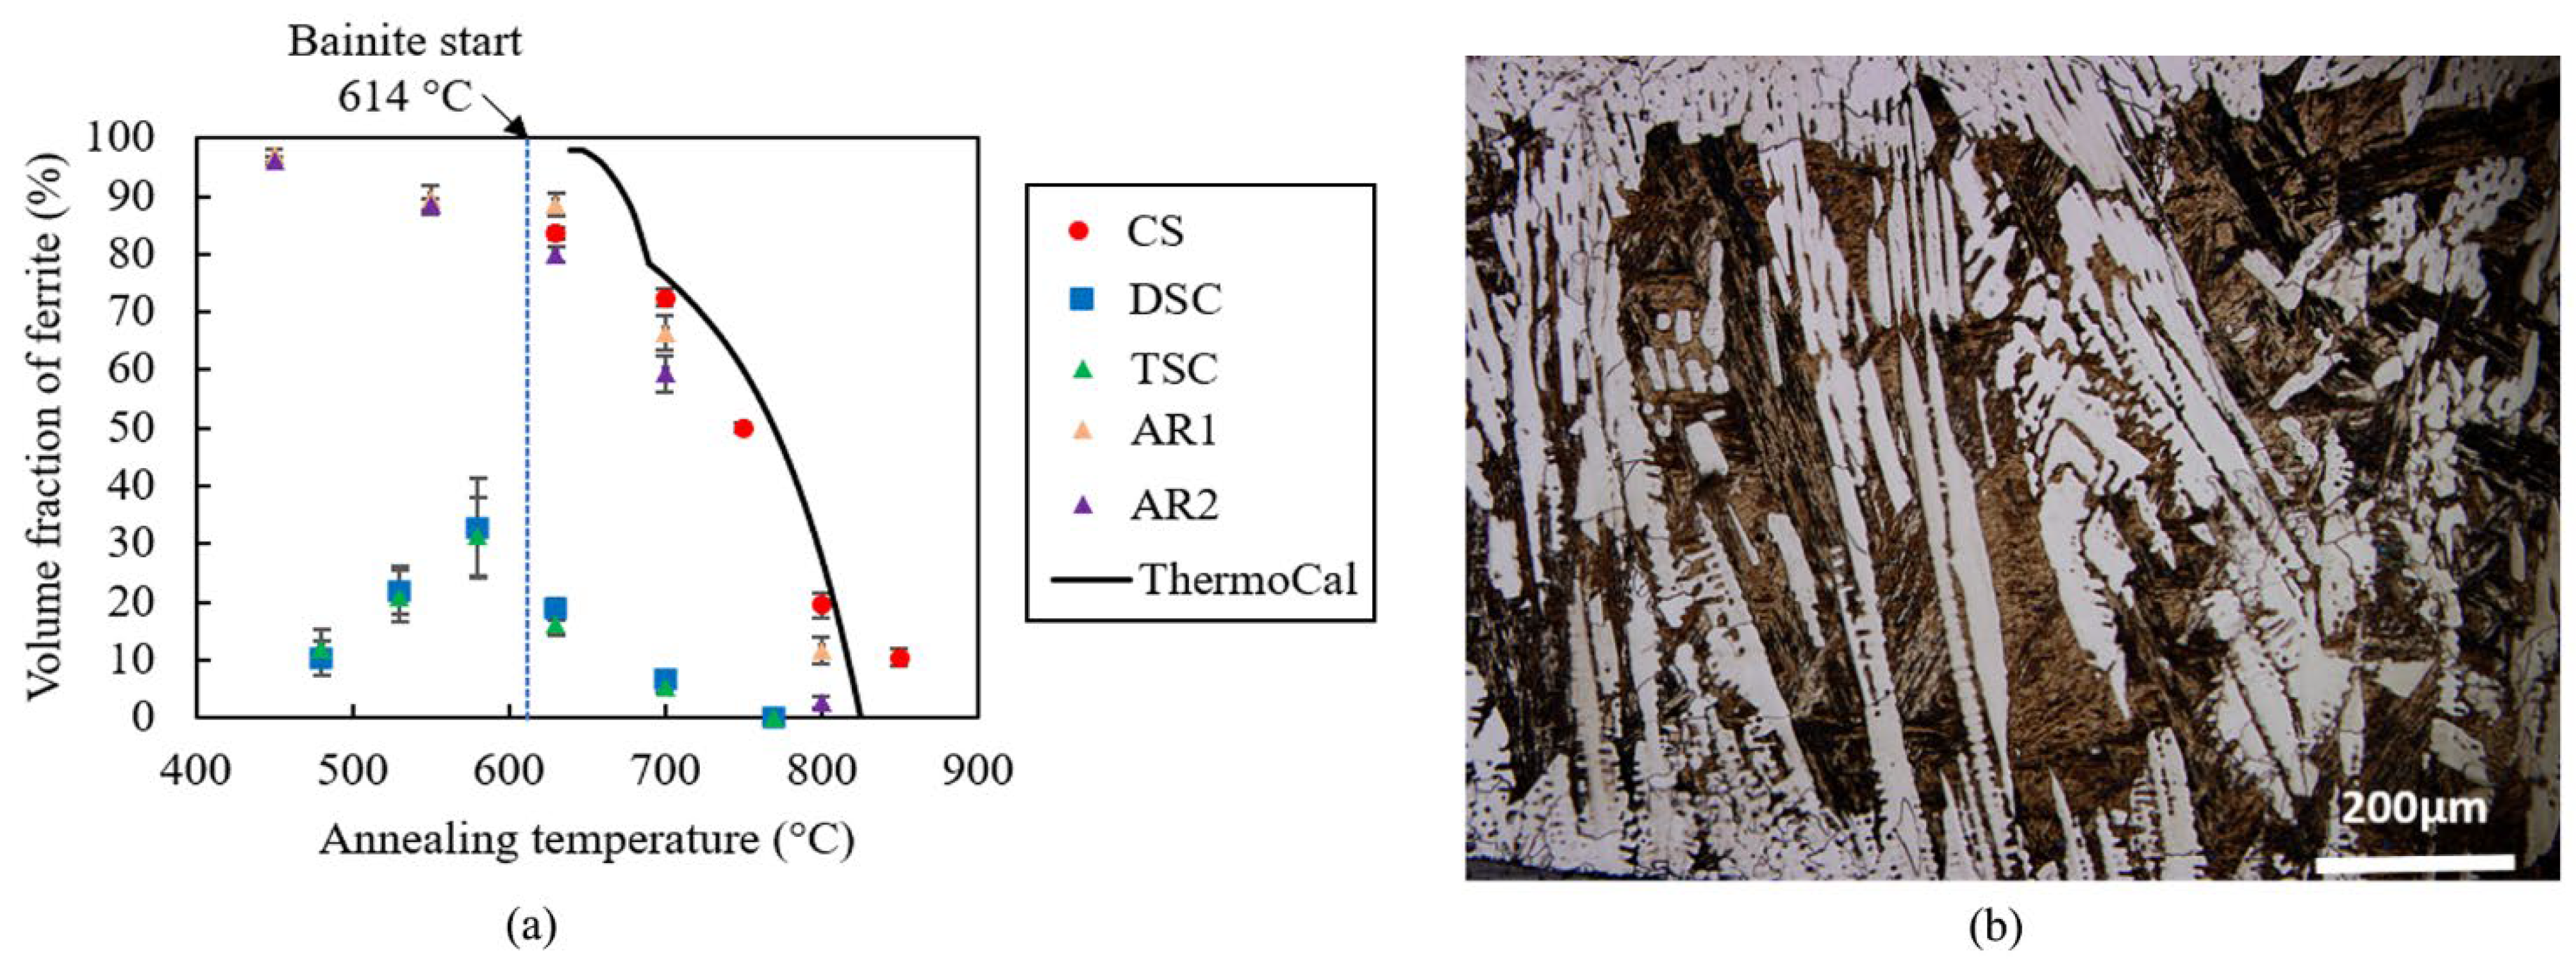
Whereas the previous two sections discuss the transformation kinetics as a function of time, there were also some unusual results observed when we examine the transformation rate as a function of temperature, as shown in Figure 12. Although those specimens with a fine prior austenite grain size show transformation rates close to the equilibrium fraction predicted by ThermoCalc, the coarse grained DSC and TSC specimens do not. At temperatures above 600 °C, the TSC and DSC specimens show a lower transformed fraction due to their larger PAGS, and the trend of decreasing volume fraction with increasing temperature is consistent with the dataset from the fine grained specimens and the thermodynamic prediction. However, at temperatures below 600 °C the transformed volume decreases with decreasing temperature, a trend that opposes the equilibrium prediction. This behaviour can be explained by the preferential formation of bainite.
Microstructural analysis (Figure 3) showed that specimens heat treated below 550 °C developed bainite during annealing. The Bainite start temperature can be calculated by the equation described by Bhadeshia et al. [27] and is calculated to be 614 °C for the present composition. The Bs is shown in Figure 12a. In fine grained samples, where the nucleation of ferrite at the austenite grain boundaries is prolific, polygonal ferrite will form during inter-critical annealing. However, in coarse grained samples, the ferrite formation is slow due to a lack of nucleation sites. In these cases, such as in the TSC and DSC samples, heat treatment below the Bs will result in the formation of bainite during inter-critical annealing, and this will occur in preference to the formation of polygonal ferrite.

4.5. Summarizing Discussion

In summary, it was observed that the simulated direct strip DSC and thin slab cast steel TSC has slower transformation kinetics than the conventionally processed steel. The effect of prior austenite grain size was examined as the cause of this delay, and this was found to only partially explain the observed kinetics. In the case of the rapidly solidified DSC and TSC specimens taken directly from the melt, there will be sulphur and other solutes retained in solid solution [18] prior to the beginning of the inter-critical annealing cycle. These solutes have a preference for precipitation as Manganese sulphides, but prior work [25,26] has shown that the precipitation process only occurs after 1000 s. Thus, for the first 1000 s of the inter-critical annealing cycles, the speed of transformation is faster than samples with a similar PAGS after full MnS precipitation. After 1000 s, nanoprecipitates start to form along the grain boundaries, resulting in the austenite to ferrite transformation becoming slow. The transformation will now be slower compared to specimens of a similar PAGS because the nanoprecipitates have a stronger pinning effect than the larger MnS particles that are present in the comparative microstructure.
Initial data from Figure 6 indicated that DSC steels would require holding at the inter-critical annealing temperature for several hours to complete the transformation from austenite to ferrite that is required to produce a DP steel. This is clearly not an industrially viable processing route to produce DP steel from strip cast products. The present study has shown that a simple re-austenitisation produces a sufficiently small austenite grain size to markedly increase the rate of transformation. This may be a commercially viable processing route to produce DP steels from strip cast products. After this process, the microstructures (Figure 4), ferrite formation kinetics (Figure 8), all become consistent with the conventionally processed DP steel that was used here as a benchmark.

5. Conclusions

The microstructure and mechanical properties of dual phase steel produced by simulated thin slab casting (TSC) and direct strip casting (DSC) have been compared with those from a commercially sourced steel of the same composition. The following conclusions have been drawn:
(1)
There was a significant delay in ferrite formation in the direct strip cast and thin slab cast samples, with the delay resulting in incomplete transformation after extended annealing times of 10,000 s;
(2)
The kinetics of phase transformation was quantified using the JMAK model. The growth rate was found to be similar for all specimen examined, but the nucleation rate of strip and thin slab cast steels were significantly slower than commercial steel by about one order of magnitude;
(3)
The effect of prior austenite grain size was interrogated by producing specimens with both coarsened and refined prior austenite grain sizes. Results show that the large prior austenite grain is the main factor for slow transformation kinetics in DSC and TSC samples;
(4)
Small differences in reaction kinetics between the DSC and austenite coarsened specimens were observed. These were explained by investigation of MnS precipitation in the steels. It is suggested that the transformation rate is high when the solutes are in solution, and that the rate of transformation slows significantly when precipitation occurs. This results in two stages of transformation speed corresponding to the two stages of the precipitation process. In samples annealed for less than 1000 s, DSC samples show a slightly faster transformation because the sulphur (and other elements) are in solid solution. After 1000 s of annealing, nano-precipitation at the grain and phase boundaries begins and the ferrite formation is slowed. The kinetics of MnS precipitation available in literature support this hypothesis.

Author Contributions

Conceptualization and Methodology, N.S., C.S. and N.M.; Investigation and experimental work, N.M.; Writing—original draft, N.M.; Writing—review and editing, N.S., C.S. and N.M.; Supervision, N.S. and C.S.; Funding acquisition, N.S. All authors have read and agreed to the published version of the manuscript.

Funding

The work reported in this paper was co-funded by the University of South Australia and by the Australian Research Council (Grant number DP160101540).

Data Availability Statement

The data presented in this study are available on request from the corresponding author.

Acknowledgments

The authors would like to thank: Dave Gray, Adam Taylor, and Thomas Dorin for their help with the casting experiments; James Maxwell and Yuqin Wu who carried out the preliminary experiments during internships; the technical team at the Future Industries Institute; (especially Nobuyuki Kawashima, Susie Ritch and Scott Abbott); and the UniSA node of Microscopy Australia. Enlightening discussion with Peter Hodgson, whose continued interest in strip casting is indefatigable, is also gratefully acknowledged.

Conflicts of Interest

The authors declare no conflict of interest.

References

  1. Paul, S.K. Effect of martensite volume fraction on stress triaxiality and deformation behavior of dual phase steel. Mater. Des. 2013, 50, 782–789. [Google Scholar] [CrossRef]
  2. Bag, A.; Ray, K.K.; Dwarakadasa, E.S. Influence of martensite content and morphology on tensile and impact properties of high-martensite dual-phase steels. Metall. Mater. Trans. A 1999, 30, 1193–1202. [Google Scholar] [CrossRef]
  3. Zhang, J.; Di, H.; Deng, Y.; Misra, R.D.K. Effect of martensite morphology and volume fraction on strain hardening and fracture behavior of martensite–ferrite dual phase steel. Mater. Sci. Eng. A 2015, 627, 230–240. [Google Scholar] [CrossRef]
  4. Pierman, A.-P.; Bouaziz, O.; Pardoen, T.; Jacques, P.; Brassart, L. The influence of microstructure and composition on the plastic behaviour of dual-phase steels. Acta Mater. 2014, 73, 298–311. [Google Scholar] [CrossRef]
  5. Calcagnotto, M.; Adachi, Y.; Ponge, D.; Raabe, D. Deformation and fracture mechanisms in fine-and ultrafine-grained ferrite/martensite dual-phase steels and the effect of aging. Acta Mater. 2011, 59, 658–670. [Google Scholar] [CrossRef]
  6. Ferry, M. Direct Strip Casting of Metals and Steels; Woodhead Publishing: Sawston, UK, 2006. [Google Scholar]
  7. Xiong, Z.; Saleh, A.; Kostryzhev, A.; Pereloma, E. Strain-induced ferrite formation and its effect on mechanical properties of a dual phase steel produced using laboratory simulated strip casting. J. Steels Compd. 2017, 721, 291–306. [Google Scholar] [CrossRef] [Green Version]
  8. Stanford, N.; Phelan, D. The formation of randomly textured magnesium steel sheet through rapid solidification. Acta Mater. 2010, 58, 3642–3654. [Google Scholar] [CrossRef]
  9. Ramajayam, M.; Stanford, N. Static recrystallisation of steels produced by direct strip casting–The effect of carbon and vanadium concentration. Mater. Sci. Eng. A 2016, 671, 147–157. [Google Scholar] [CrossRef]
  10. Xiong, Z.; Kostryzhev, A.; Stanford, N.; Pereloma, E. Microstructures and mechanical properties of dual phase steel produced by laboratory simulated strip casting. Mater. Des. 2015, 88, 537–549. [Google Scholar] [CrossRef]
  11. Ashrafi, H.; Shamanian, M.; Emadi, R.; Saeidi, N. Examination of phase transformation kinetics during step quenching of dual phase steels. Mater. Chem. Phys. 2017, 187, 203–217. [Google Scholar] [CrossRef]
  12. Soleimani, M.; Mirzadeh, H.; Dehghanian, C. Phase transformation mechanism and kinetics during step quenching of st37 low carbon steel. Mater. Res. Express 2019, 6, 1165f2. [Google Scholar] [CrossRef]
  13. Jia, T.; Militzer, M. General method of phase transformation modeling in advanced high strength steels. ISIJ Int. 2010, 50, 583–590. [Google Scholar] [CrossRef] [Green Version]
  14. Lusk, M.; Jou, H.-J. On the rule of additivity in phase transformation kinetics. Metall. Mater. Trans. A 1997, 28, 287–291. [Google Scholar] [CrossRef]
  15. Xiong, Z.; Kostryzhev, A.; Stanford, N.; Pereloma, E.V. Effect of Holding Temperature and Time on Ferrite Formation in Dual Phase Steel Produced by Strip Casting. Mater. Forum 2014, 38, 44–48. [Google Scholar]
  16. Humphreys, F.J.; Hatherly, M. Recrystallization and Related Annealing Phenomena, 1st ed.; Elsevier Science: Oxford, UK, 1995; pp. 281–325. [Google Scholar]
  17. Underwood, E.E. Quantitative Stereology for Microstructural Analysis. In Microstructural Analysis: Tools and Techniques; McCall, J.L., Mueller, W.M., Eds.; Springer US: Boston, MA, USA, 1973; pp. 35–66. [Google Scholar]
  18. Lückl, M.; Wojcik, T.; Povoden-Karadeniz, E.; Zamberger, S.; Kozeschnik, E. Co-Precipitation Behavior of MnS and AlN in a Low-Carbon Steel. Steel Res. Int. 2018, 89, 1700342. [Google Scholar] [CrossRef]
  19. Lückl, M.; Zamberger, S.; Kozeschnik, E. Kinetics simulation of MnS precipitation in electrical steel. Steel Res. Int. 2016, 87, 271–275. [Google Scholar] [CrossRef] [Green Version]
  20. Liu, Z.; Kobayashi, Y.; Nagai, K.; Yang, J.; Kuwabara, M. Morphology control of copper sulfide in strip casting of low carbon steel. ISIJ Int. 2006, 46, 744–753. [Google Scholar] [CrossRef] [Green Version]
  21. Liu, Z.; Kobayashi, Y.; Nagai, K. Crystallography and precipitation kinetics of copper sulfide in strip casting low carbon steel. ISIJ Int. 2004, 44, 1560–1567. [Google Scholar] [CrossRef]
  22. Frawley, L.; Priestner, R. The effects of Ti and S in Direct rolled Thin Slab cast low carbon steel. Mater. Sci. Forum 1998, 284–286, 485–492. [Google Scholar] [CrossRef]
  23. Badji, R.; Bouabdallah, M.; Bacroix, B.; Kahloun, C.; Bettahar, K.; Kherrouba, N. Effect of solution treatment temperature on the precipitation kinetic of σ-phase in 2205 duplex stainless steel welds. Mater. Sci. Eng. A 2008, 496, 447–454. [Google Scholar] [CrossRef]
  24. Dorin, T.; Wood, K.; Taylor, A.; Hodgson, P.; Stanford, N. Effect of coiling treatment on microstructural development and precipitate strengthening of a strip cast steel. Acta Mater. 2016, 115, 167–177. [Google Scholar] [CrossRef]
  25. Sun, W.; Militzer, M.; Jonas, J. Strain-induced nucleation of MnS in electrical steels. Metall. Mater. Trans. A 1992, 23, 821–830. [Google Scholar] [CrossRef]
  26. Sun, W.P. Measurement and Analysis of MnS Precipitation in Electrical Steels. Ph.D. Thesis, McGill University, Montreal, QC, Canada, 1991. [Google Scholar]
  27. Bhadeshia, H.; Honeycombe, R. Steels: Microstructure and Properties; Butterworth-Heinemann: Oxford, UK, 2017. [Google Scholar]
Figure 1. Schematic of strip casting and thin slab casting simulator. (a) Strip casting simulator; (b) Thin slab casting simulator. Note that (a,b) are not shown to the same scale. (c) The cooling rate of specimens that simulate direct strip casting and thin slab casting, measured using an optical pyrometer.
Metals 12 00170 g001
Figure 2. Schematic of heat treatment procedure for (a) primary processed steel for samples taken directly from the melt; (b) secondary processed specimens that had a refined austenite grain size; (c) secondary processed specimens that had a coarsened austenite grain size; and (d) commercial steel specimens that were given comparable heat treatments to benchmark transformation kinetics.
Metals 12 00170 g002
Figure 3. Typical microstructure for (a,b) benchmark processing study on commercial steel (c,d) primary processing treatment on direct strip cast and thin slab cast inter-critically annealed at 630 °C, (e,f) direct strip cast and thin slab cast heat treated at 530 °C. Heat treatment time is 300 s for primary treatment and 600 s for secondary treatments. Note higher magnification in (a,b).
Metals 12 00170 g003
Figure 4. Microstructure of samples after secondary processing at different heat treatment temperatures as indicated. Heat treatment time was 5 min. All micrographs shown at the same magnification.
Metals 12 00170 g004
Figure 5. Microstructure of austenite coarsen (AC) samples at different inter-critical annealing times at a temperature of 630 °C. All micrographs shown at the same magnification.
Metals 12 00170 g005
Figure 6. (a,b) Volume fraction and (c,d) grain size of ferrite with respect to annealing conditions (legend applies to all graphs).
Metals 12 00170 g006
Figure 7. (a) SEM image showing precipitates in direct strip cast (DSC) specimen annealed at 630 °C for 10,000 s; (b,c) TEM chemical mapping of a thin slab cast (TSC) specimen annealed at 630 °C for 10,000 s. Particle shown in (b) is from the population of larger Mn and S enriched particles. Particle cluster shown in (c) is from the population of smaller particles that cluster at the grain boundaries. Note that the SEM image shown in (a) is from a different specimen to those shown in (b,c).
Metals 12 00170 g007
Figure 8. (a) JMAK plot and (b) nucleation rate ratio with respect to annealing time. (CS = commercial steel, DSC = simulated direct strip cast steel, AR1 and AR2 = austenite refined specimens from secondary heat treatment, AC = austenite coarsened specimen from secondary heat treatment). Note that some error bars are smaller than the height of the datum points, and cannot be seen.
Metals 12 00170 g008
Figure 9. (a) Transformation kinetics grouped by prior austenite grain size; (b) Relationship between nucleation ratio and the prior austenite grain size (PAGS).
Metals 12 00170 g009
Figure 10. JMAK parameters for the current results, along with data obtained from the literature. (a) linear relationship between k and the GBA; (b) one outlier from Reference [11]. Note that some datasets from the literature have been extrapolated to an equivalent heat treatment temperature of 630 °C. Carbon content from literature data shown in brackets.
Metals 12 00170 g010
Figure 11. Ferrite volume fraction comparison between strip cast (DSC) specimens and austenite coarsen (AC) specimens with respect to annealing time.
Metals 12 00170 g011
Figure 12. (a) Effect of annealing temperature on polygonal ferrite formation. Heat treatment time is 300 s for primary treatment and 600 s for secondary treatments; (b) Microstructure of DSC specimen after inter-critical annealing at 630 °C for 10,000 s.
Metals 12 00170 g012
Table 1. Chemical composition (wt%) of DP780 steel measured using ICP-OES.
CSiMnCrAlNPS
0.130.871.980.0350.0140.0140.005<0.0005
Table 2. Prior austenite grain size (PAGS) and grain boundary area (GBA) with JMAK parameters n and k. Parameters n and k have been normalised to an annealing temperature of 630 °C.
Specimen/StudyPAGS (µm)GBA (μm2/μm3)nk
Commercial Steel benchmark300.070.120.80
DSC3000.0070.530.005
Secondary processed (austenite refined)200.10.091.18
Secondary Processed (austenite coarsened)2000.011.39.8 × 10−6
Ashrafi et al. [11]150.130.680.47
Soleimani et al. [12]400.050.20.58
Xiong et al. [15]1000.020.70.07
Xiong et al. [10]1200.0171.80.001
Publisher’s Note: MDPI stays neutral with regard to jurisdictional claims in published maps and institutional affiliations.