Abstract
A novel combined process of Cold Stamping (CS) and Hot Stamping (HS) with Quenching and Partitioning (Q&P) treatment applied to advanced TRIP-assisted steel has been conducted by thermomechanical simulation to evaluate the influence of CS or HS in the Q&P processing. With this purpose, Q&P, CSQ&P, and HSQ&P cycles were designed to obtain multiphase microstructures containing ferrite, martensite, bainitic-ferrite, and the maximum retained austenite (RA) fraction after the processes. The objective was to investigate the effects of the variables involving the heat treatments, such as the intercritical austenitization temperature, the isothermal and non-isothermal deformation, the amount of deformation, and the temperature and partitioning times, and to analyze their influence on the microstructural and mechanical responses. Time-resolved X-ray diffraction using synchrotron radiation was undertaken in a thermomechanical simulator coupled to the synchrotron light source to understand the influence of time, temperature, and strain on the level of carbon enrichment in austenite. In addition, the in situ austenite transformation kinetics and lattice parameter evolution were tracked, making it possible to optimize the RA fraction at room temperature after Q&P processing. The newly developed combined process is promising as the transformation-induced plasticity phenomenon during deformation can contribute to the formability and energy absorption. The results also indicate that the deformation of austenite promotes the ferrite transformation while suppressing the bainite transformation. It was possible to plot the results in an elongation-mechanical strength diagram, coupled to material property charts, also known as, ‘banana curve’, allowing us to identify and correlate the thermal or thermomechanical treatment conditions that led to an increase in ductility or strength according to the volume fractions of the resulting phases. Comparing the results for the HSQ&P treatments, it was observed that isothermal strains at higher temperatures (≥800 °C) are more advantageous to increase mechanical strength, while non-isothermal strains (starting at 750 °C) are suggested if the objective is the increase in ductility, with mechanical strength being slightly sacrificed.
1. Introduction
There is a continuous industrial demand for new steels that present better combinations of ductility and mechanical properties without increasing production costs. This demand meets the needs of vehicle weight reduction, CO2 emission reduction, and increasing passengers and pedestrians safety. Improving mechanical resistance without loss of ductility leads to reductions in weight, CO2 emission, and fuel consumption by decreasing the thickness of the sheets. However, it is essential to protect the safety of passengers during a car crash. Then, the current energy crisis and global warming make lightweight designs gain more attention in the automotive industry [1]. The challenge to be faced to optimize the vehicle structure weight is the development of steels with high mechanical strength without compromising their formability. In this context, the ULSAB (Ultra-Light Steel Auto Body) project explored new opportunities for weight reduction in automotive components, resulting in the development of an automotive body with 90% high strength steels (HSS), reducing ≈25% of the mass, and improving the torsional stiffness (up to 80%), and bending stiffness (up to 52%) [2]. With the ULSAB-AVC (Advanced Vehicle Concept) project, there was a significant increase in fuel consumption efficiency due to the reduction in vehicle weight (≈17%), with higher levels of resistance in components that need forming operations in its manufacture [3]. Research indicates that a 10% weight reduction in vehicles reduces fuel consumption by 6 to 10% and CO2 emissions by ≈4% [4,5]. Since steels account for about 60% of the total vehicle’s body weight, it is effective to achieve lighter weights using a thinner steel sheet with higher strength instead of common steel [6]. Therefore, to meet the requirements in terms of crash-safe designs, impact resistance, and fuel consumption reduction, the most viable alternative to construct thinner structural components is the development of high and ultra-high-strength-steels with adequate formability [4]. Thanks to the formability that high-strength steels exhibit at elevated temperatures, the final martensitic microstructure produced by hot stamping, and the reduced springback, thinner and more complex sheet metal parts (A and B pillars, side-impact protection, roof rails, bumpers) can be produced with a high strength-to-mass ratio and high geometrical accuracy [7]. Currently, it is estimated that hot-stamped components contribute to ≈25% of vehicle weight reduction without affecting their performance [8]. Therefore, lightweight vehicles technology is the key to success in developing a low-carbon economy (energy saving) [9,10], which forces the automotive industry to manufacture lightweight cars [11] while enhancing strength, particularly of safety-relevant parts. In this regard, several types of microstructures and heat treatments have been proposed to face this challenge, such as refined DP microstructures [12,13,14], modified TRIP [15,16,17,18], bainitic [19,20,21,22], and nanobainitic [23,24,25], quenching and partitioning—Q&P [26,27,28], TWIP with lower levels of Mn [29,30,31], etc. The presence of ductile retained austenite in the hard martensite and bainitic matrix contributes to the appropriate plasticity and toughness [32,33,34,35]. The volume fraction, homogeneous distribution, and stability of the retained austenite are essential to ensure its contribution to the TRIP effect (Transformation Induced Plasticity) not only during forming but also when called to absorb energy in the event of a collision. Consequently, TRIP-assisted steels are being increasingly used in the automotive industry because of their combined lightweight and high energy absorption capabilities [36]. Although considerable improvements to these steels have been achieved, their constant demands have made the automotive sector continue this progress.
The main mechanism for improving the balance of mechanical strength and ductility in TRIP steels (Transformation-Induced Plasticity) is by the presence of retained austenite [37,38]. This austenite might transform into martensite in stress and/or strain situations, although this retained austenite has a higher carbon content (stable at room temperature without stress) [39,40]. This martensitic transformation and its consequent shear deformation and volumetric expansion, related to the formation of dislocations in adjacent ferrite and around newly formed martensite regions, change the state of inner stresses, increasing the mechanical strength of the steel [13,41].
The industrial advantage of high-temperature deformation is producing thinner structural components with complex geometries with reduced springback. Deformation at high temperatures also involves the formation of DIFT ferrite (Deformation-Induced Ferrite Transformation), which contributes to the carbon enrichment of austenite and, therefore, its stability [42]. Additionally, deformation-induced ferrite transformation coupled with continuous dynamic recrystallization of proeutectoid ferrite and austenite enhances the mechanical properties due to grain refinement [43]. It is reported that bainitic transformation is suppressed in the partition stage during the Q&P process due to the stability of ultrafine untransformed austenite [44]. Thus, a multiphase microstructure would be formed containing mainly martensite, ferrite (DIFT and intercritical), and retained austenite, simultaneously increasing the strength and the ductility [42,45].
This study aims to investigate the effect of Q&P and previous high-temperature deformation to establish the proper microstructure to guarantee excellent combinations of mechanical strength and ductility in 1.5 mm thick sheets of high-strength TRIP steel. The retained austenite lattice parameter variation during the partition stage was measured using synchrotron diffraction so as to evaluate the effect of previous hot deformation on the carbon enrichment in retained austenite.
2. Materials and Methods
The chemical composition of the investigated commercial TRIP-assisted steel is described in Table 1. The chemical composition was determined using plasma emission spectrometry following the ASTM E350 and ASTM E1019 standards. In the initial state of the samples, after cold rolling, the steel was heated to the inter-critical field (austenite + ferrite) and rapidly cooled to a temperature above the martensitic transformation, maintaining this temperature for a certain period in order to induce the bainitic transformation. At the end of the isothermal bainitic holding temperature, a new accelerated cooling to room temperature was applied, producing a microstructure composed of ferrite, bainite, and retained austenite (a small portion of martensite can also be formed). As the bainitic transformation that occurs during the isothermal holding is the incomplete reaction phenomenon, the microstructure shows retained austenite at the end of the treatment. The heat treatment applied generates a material with yield and strength limits of 504 MPa and 778 MPa, respectively, with a total elongation of ≈35%. After the initial processing, AlSi coating is commonly used in these materials because it provides corrosion protection through barrier protection between the oxidizing environment and the bare steel. However, most of the car body components are already zinc coated. A similar level of oxidation protection may also be required in hot-stamped components. Here, a zinc coating was applied to 1.5 mm thick sheets using an electrolytic plating (electrogalvanizing) process.

Table 1.
Chemical composition (in wt.%) of the investigated steel.
Heat and thermomechanical treatments, such as quenching and partitioning (Q&P) and hot stamping process coupled with subsequent quenching and partitioning (HSQ&P) were carried out to study the microstructural and mechanical properties changes. In addition, thermodynamic simulations using Thermo-Calc® (manufactured at the Royal Institute of Technology in Stockholm, Sweden) were carried out to determine the intercritical temperature, to obtain a higher carbon content in austenite, the carbon solubility limit in austenite and ferrite, the phase chemical composition, and the phase volume fraction, as depicted in Figure 1.
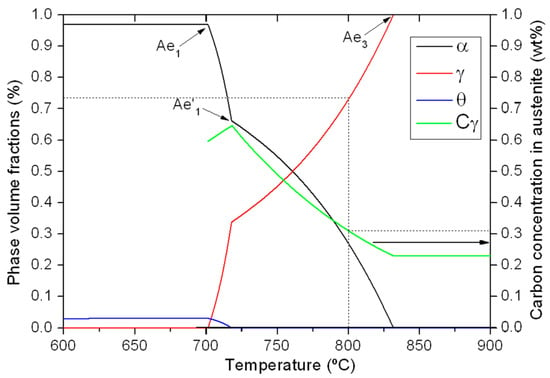
Figure 1.
Phase volume fractions and carbon concentration in austenite as a function of temperature.
The samples were homogenized at 1000 °C for 5 min to ensure the dissolution of the precipitates then intercritically austenitized at 800 °C for 5 min, where 33.55% proeutectoid ferrite and 66.45% austenite coexisted, with the carbon concentration in austenite around 0.31 wt.%, as determined by thermodynamic simulations. Heating and cooling rates were 15 °C/s and 60 °C/s, respectively. The HSQ&P samples were subjected to two different hot stamping paths; (i) isothermal deformation, where the heat level during deformation stays the same, at 800 °C and (ii) nonisothermal deformation, starting at 750 °C and ending at 714 °C, up to a 0.3 true strain at a constant strain rate of 0.5 s−1, emulating the strain rate found during an actual hot stamping process [46]. Additionally, a cold stamped process was performed, straining at room temperature prior to the Q&P process.
Quenching and partitioning (Q&P) and hot stamping experiments followed by quenching and partitioning (HSQ&P) were performed using the Gleeble3S50TM thermomechanical simulator. The Gleeble 3S50TM simulator was developed in cooperation between the American company Dynamic Systems Inc. (DSI) and the technical-scientific staff of the Brazilian Nanotechnology National Laboratory (LNNano), with the purpose of carrying out thermomechanical tests controlling temperature and mechanical stresses/strains on macroscopic samples, while simultaneous X-ray diffraction acquisitions are obtained. This system has a unidirectional symmetric stroke system to ensure that the sample position illuminated by the X-ray beam does not change in the load application direction due to deformation, as well as a different chamber design so that the incident beam can reach the sample and diffracted beams are accessible to detectors [47]. Inside the chamber of the Gleeble simulator, the specimens are held by copper clamps, through which electrical current is conducted to heat the samples by the Joule effect. The power control is performed by a proportional derivative integral algorithm, and the temperature response can be obtained through K-type thermocouples, Cromel/Alumel, welded to the samples. The uncertainty in controlling the temperature reached was less than 1 °C. The experiments were carried out in a vacuum, with a chamber pressure of ≈6 × 10⁻³ Torr. Specimen geometry used in Advanced Gleeble 3S50 can be found in [44].
Experiments using synchrotron radiation consisted of evaluating the deformation processes, including a partitioning step with a quenching temperature of 318 ± 10 °C, according to the optimum quenching temperature calculated considering the constrained carbon equilibrium between martensite and austenite as proposed by Speer et al. [26]. The dwell time at the quenching temperature (QT) was 5 s in all treatments. The short maintenance time used aimed to avoid isothermal transformation products below the Ms temperature (such as carbide precipitation and bainitic transformation) [48]. The partition temperature (PT) was performed at 400 °C with an incubation time of 100 and 500 s. Short partition times might be favorable in industrial processes for thinner steel components to ensure excellent energy absorption, formability, and toughness under deformation and impact loading. Figure 2 schematically shows all described conditions: (a) isothermal hot stamping experiments followed by quenching and partitioning called I-HSQ&P and (b) non-isothermal hot stamping experiments followed by quenching and partitioning called NI-HSQ&P sample.
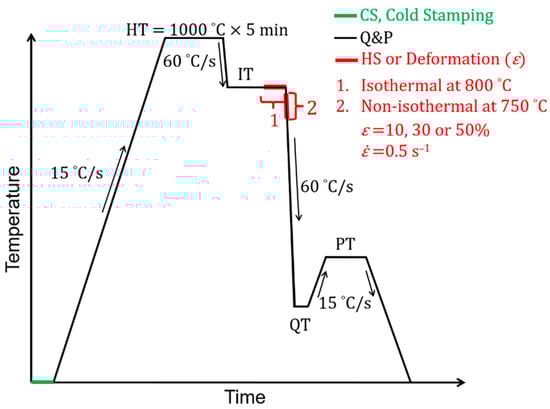
Figure 2.
Schematic representation of the thermomechanical treatments of quenching and partitioning (Q&P), cold stamping (CS), isothermal hot stamping, HS, (1) experiments followed by quenching and partitioning (I-HSQ&P), and non-isothermal hot stamping (2) experiments followed by quenching and partitioning (NI-HSQ&P) specimens. HT, IT, QT, PT are homogenization, intercritical, partitioning, and quenching temperatures; and ε and are true strain and strain rate, respectively.
In situ high-temperature X-ray diffraction (XRD) was performed on Q&P and HSQ&P samples, providing real-time lattice parameter changes during the partitioning step. The experiments were carried out at the experimental station XTMS (X-ray Scattering and Thermo-Mechanical Simulation), installed in a custom-built hutch at the LNLS (Brazilian Synchrotron Light Laboratory) XRD-1 synchrotron beamline [49]. The experimental setup consists of a customized Gleeble®3S50 thermomechanical simulator integrated with a monochromatic synchrotron X-ray beam at 12 keV (λ = 0.10332 nm) incident on the sample. Although steel, which possesses relatively high density, requires a very high energy X-ray for large interaction volume, lower energy is still effective for investigating the local structure of nanoconstituents [50]. Scattered X-ray intensities were measured by two solid-state linear detector arrays (silicon microstrip multichannel system, each Mythen-1K with 1280 channels, 50 μm wide, distributed in a row). The sample was positioned at 361 mm from the linear detectors, in a fixed position tilted at 15° related to the incident X-ray beam. In situ diffraction scans, covering angles in the range of 26° < 2θ < 46° were recorded at 3 s intervals during the partitioning stage. A custom least squares multiple simultaneous peak-fitting algorithm for these diffraction profiles was used for the Igor Pro® program [51]. To collect the diffraction peaks for quantification of the phases present, at the end of each heat treatment, XRD patterns in the range of 26° < 2θ < 86°, with an exposure time of 10 s, were collected. The austenite volume fraction Vγ was calculated according to the method proposed by Gnaupel-Herold and Creuziger [52] for TRIP steels using the integrated intensities of the (110)α and (200)α peaks, and those of the (111)γ and (200)γ diffraction peaks. Using multiple peaks can minimize the influence of any textural effects upon the [53,54]. The austenite lattice parameters, aγ in nm, were calculated from the 2θ positions of the diffraction peaks using Bragg’s law (Equation (1)), based on the positions of the (200) austenite peaks:
where λ is the wavelength of the synchrotron radiation; h, k, and l are the Miller indices of the lattice planes; and θhkl is the Bragg angle for the (h k l) planes, which was calculated fitting a Gaussian distribution for each scan at the partitioning stage. The calculated temperature history of the sample was used to subtract thermal expansion effects from lattice parameter data to reveal evidence of carbon migration between the different phases present. For this purpose, the measured austenite lattice parameters at PT were extrapolated to the correspondent values at room temperature using the van Bohemen equation, adapted from van Bohemen [55]:
where T is the partition temperature (in Kelvin), is the lattice parameter at the reference temperature, and the constants = 24.8 × 10⁻⁶ K−1 and = 280 K. The van Bohemen equation was first proposed to predict the macroscopic dilation of austenite. Therefore, Equation (2) is valid under the assumption that only lattice distortion is responsible for the macroscopic dilation. Subsequently, the carbon content of the face-centered cubic austenitic phase () at room temperature was estimated using the formula suggested by Dyson and Holmes [56]:
Dyson and Holmes [56] stated that silicon has a negligible effect on the austenite lattice distortion and, therefore, its contribution is not incorporated into their equation. Substitutional atom diffusion is very slow at temperatures involved in the Q&P processing. The slow diffusion allows identifying carbon as the only element responsible for the lattice parameter variations [57]. Additionally, the possible effect of internal stresses on the lattice parameter of austenite is neglected. Nevertheless, in order to estimate the austenite lattice parameter, aγ, free from systematic and random errors, aγ was estimated from the calculated lattice parameter for each reflection against cos 2θ/sin θ, thereby accounting for possible sample shift (or displacement on the diffractometer) and X-ray penetration [58,59]. For easy comparison, this function was extrapolated to 3.6092 Å (the calculated value of the non-deformed austenite lattice parameter). Metallographic analyses were conducted by light microscopy (LMLM), scanning electron microscopy (SEM), and electron back-scattered diffraction (EBSD). The metallographic observation samples were prepared using conventional mechanical grinding, using abrasive SiC sandpapers, then polishing, using diamond suspensions until 1 µm, and final polishing using a 0.05 µm colloidal silica suspension, etched with 2% Nital solution. The samples were then observed by light microscopy using a Philips XL30 model microscope and SEM. The FEG-SEM microstructural examination was performed using an FEI- Inspect F50 field emission gun SEM operating at 15 kV. The EBSD samples were polished with a final electropolishing step of 0.05 µm using an OPS suspension for 1 h. The EBSD analysis was performed at 20 keV, and the specimen tilt angle was 70° with a 15 mm working distance and a step size of 0.1 μm. Orientation imaging microscopy (OIM) functions of the electron backscatter diffraction patterns, such as the image quality (IQ), Phase Identification, Schmid factor, and kernel average misorientation (KAM), were used to evaluate the different thermomechanical processed samples. The volume fractions of ferrite, bainite, and martensite were measured by the point count method with a square mesh of 391 points superimposed on the microstructures, and the fraction of points were manually counted according to the ASTM E562-02 standard [60]. At least five SEM micrographs were analyzed per condition. Microhardness measurements were performed at room temperature with a Vickers indenter under 500 g loads and a loading time of 10 s. Nanohardness measurements were carried out on samples previously prepared for EBSD analysis using a Triboindenter Hysitron TI 950. The equipment was operated in load control testing mode, with a maximum and minimum load of 15 mN and 1.5 mN, respectively.
3. Results and Discussion
3.1. Optimal Quenching Temperature
Determination of optimum initial quenching temperature (QT) is essential to set the proper fraction of martensite and untransformed austenite, to stabilize untransformed austenite at room temperature by carbon partitioning from martensite to untransformed austenite during the partition stage. The volume fraction of untransformed austenite as a function of the quenching temperature was calculated by the lever rule on the dilatometry curves in the martensitic transformation region, as presented in Figure 3. The experimental data were adjusted by the least squares method to the model proposed by Koistinen and Marburger (K&M) [61] considering the intercritical austenitization regions, as follows:
where is the volume fraction of untransformed austenite, and QT represents the quenching temperature.
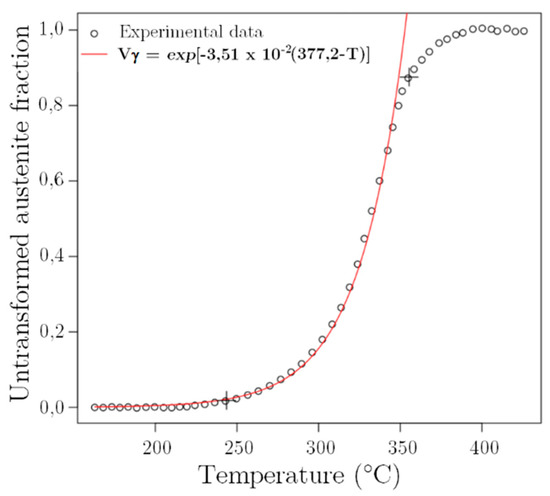
Figure 3.
Fraction of untransformed austenite as a function of the quench temperature determined by the dilatometry experiment data K&M model adjustment in the quenched sample.
It can be seen in Figure 3 that the K&M equation fits well, especially at low temperatures (high supercooling) with the experimental values. In contrast, there is a deviation between the experimental results and the adjusted equation at higher temperatures, possibly due to the beginning of the bainitic transformation [62].
Figure 4 predicts the volume fraction of retained austenite after quenching from the intercritical austenitization temperature according to Speer’s model [26,63] and the constrained equilibrium thermodynamic model [64]. The dashed curves exhibit the untransformed austenite and martensite after initial quenching. In addition, the secondary martensite formed (fresh martensite) could be transformed in the final quenching stage [65]. The black line corresponds to the final fraction of stable retained austenite after the quenching and partition step as a function of the quenching temperature. The result indicates an optimal quenching temperature (TQ ≈ 318 °C) that offers the highest possible percentage of retained austenite (≈21%) after the final quenching, calculated according to the K&M ratio (Equation (1)). Notably, the calculation was performed under some simplifications, such as stationary interfaces, the ideal partition of carbon from martensite to austenite, and suppressed competitive reactions (such as carbide formation). From Figure 4, the final microstructure is composed of retained austenite, martensite (formed after the initial quench), and possible fresh martensite formed during the final cooling from the unstable untransformed austenite during the partition step.
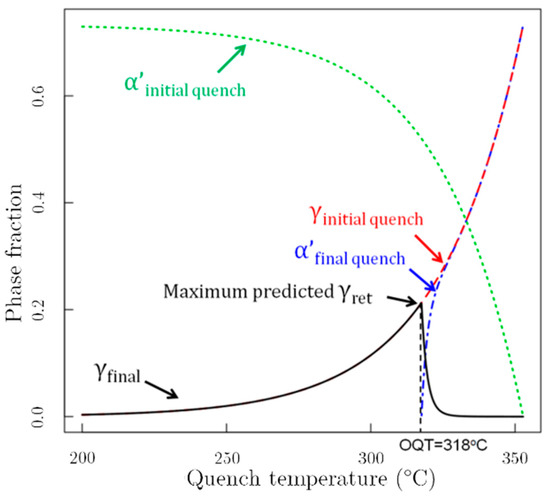
Figure 4.
Prediction of the volume fraction of retained austenite (γret) after intercritical austenitization, assuming total carbon partitioning according to the model of Speer et al. [26]. OQT indicates the “optimal” quenching temperature.
Quenching above the optimum QT (OQT) generates a greater amount of retained austenite. This austenite has low stability due to its low carbon enrichment; thereby, it can easily be transformed into fresh martensite during final quenching [66]. However, quenching below the optimal quenching temperature results in the formation of a large amount of martensite during the first quenching stage. As a result, a smaller amount of retained austenite remains before partitioning, increasing the carbon availability to be partitioned. In this case, the carbon enrichment of the austenite during the partitioning process may be much greater than necessary, making it more stable during the partitioning process, which does not favor the TRIP effect as no transformation occurs during stressing. Therefore, the optimum quenching temperature allows the setting of proper microstructure combinations to obtain excellent mechanical properties.
3.2. In Situ X-ray Diffraction
Figure 5 shows the 2D diffraction patterns obtained by the Rayonix detector of the as-received material and in the initial and final stage of the partitioning process at 400 °C for 100 s of the Q&P sample. The diffraction patterns were integrated azimuthally to be converted into one-dimensional intensity values as a function of the 2θ angle. The intensities of the diffraction peaks (111)γ, (200)γ, and (220)γ corresponding to austenite were considerably reduced during the partition stage. The austenite fractions at the beginning and end of the partition stage were calculated as 17.2% and 8.4%, respectively. This reduction in the austenite fraction can be associated with the bainitic transformation during the partitioning process. Notably, the intensity variation of the (110)α peaks (including ferrite, bainite, and martensite) could be related to the crystallographic orientation relationship with prior and current austenite atomic configuration. In the BCC structure, the {110} planes have the higher close-packed density which enhances the slippage mechanism, especially at T (K) > 0.5 Tm [67]. The development of (110) grains parallel to the rolling direction has been reported in advanced high-strength steels during the DIFT induced grain refinement [45,68,69]. Thus, more readily, plastic deformation is expected in I-HSQ&P specimens. Estimating the volume fraction of austenite in steels with non-random crystallographic orientation requires several diffraction peaks to minimize the influence of preferential orientations on the results [53,54].
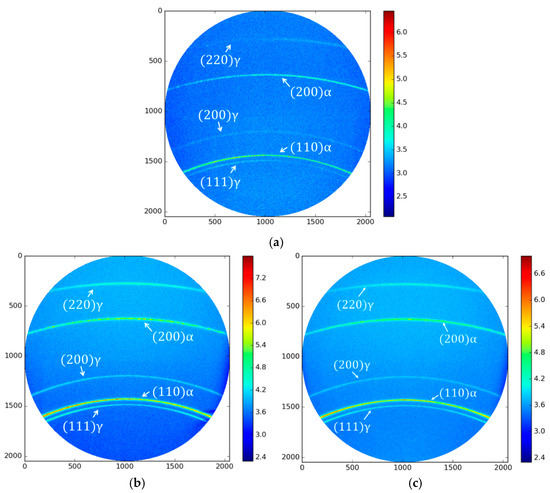
Figure 5.
In situ synchrotron X-ray diffraction patterns obtained with a 2D detector showing the evolution of austenite (γ) and ferrite (α) diffraction peaks, collected at room temperature before treatment and at 400 °C as a function of partition time (100 s). (a) as-received (Vγ = 3.1%); (b) the initial stage of the partition (Vγ = 17.2%); (c) final stage of the partition (Vγ = 8.4%).
Furthermore, the results show austenite peaks shifted to lower 2θ values in all specimens. According to Bragg’s law, shifting the austenite peaks to lower 2θ values indicates an increase in interplanar distances, as a result of larger lattice parameters due to the carbon enrichment of the residual austenite phase.
The results also revealed that the volume fraction of retained austenite reached 10.3% in I-HSQ&P and 7.8% in NI-HSQ&P samples. In addition, the (200)γ diffraction peak intensity reduced gradually with the increase in the partitioning time due to the decomposition of residual austenite by bainitic transformation. This result confirmed that the samples deformed at high temperatures showed higher retained austenite stability, produced by the higher carbon enrichment, caused by the acceleration of carbon diffusion in austenite produced by the DIFT ferrite. Moreover, bainitic transformation can also promote carbon enrichment of retained austenite, increasing the retained austenite stability.
Figure 6 presents the variation of the austenite lattice parameter as a function of time during the partition stage (400 °C for 100 s and 500 s). From the comparison between the Q&P with I-HSQ&P, and NI-HSQ&P thermomechanical treatments, it is observed that the hot deformation promotes a smaller increment of the austenite lattice parameter during the partitioning stage, leading to less carbon enrichment in untransformed austenite with the increase of deformation. Additionally, the samples deformed at 800 °C (with an 800 °C intercritical annealing temperature, I-HSQ&P) showed a slightly higher carbon enrichment than those deformed at 750 °C. Deformation increases lattice rotations and the number of crystallographic defects in the soft residual austenite, increasing the stored energy compared to a perfect lattice [70]. This stored energy decreases the activation energy for carbon diffusion and accelerates carbon segregation on the distorted residual austenite lattice. Moreover, the deformation at high temperatures induces the diffusion of carbon and retransformation of ultrafine DIFT ferrite into residual austenite [71]. It exceeds the stability of residual austenite, which is favorable for industrial applications.
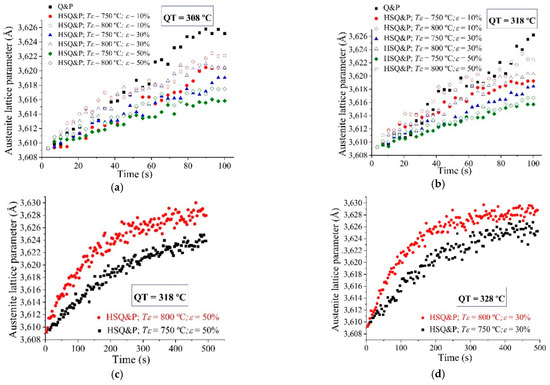
Figure 6.
In situ synchrotron X-ray diffraction analysis of the evolution of the austenite lattice parameter during the partition stage. Q&P with I-HSQ&P (Tε = 800 °C) and NI-HSQ&P (Tε = 750 °C). (a) Quenching Temperature (QT) at 308 °C, (b) QT at 318 °C by 100 s, (c) QT at 318 °C by 500 s, (d) QT at 328 °C by 500 s.
The results revealed that the deformation increased the lattice distortion at the prior austenite grain boundaries, increasing misorientation and stored energy. Higher stored energy between neighboring grains implies a higher driving force to nucleate fine DIFT ferrite grains and promote carbon depletion in this region. In other words, deformation at the intercritical region (at 750 °C) promotes the transformation of the diffusional phase (DIFT ferrite) and accelerates the carbon enrichment of residual austenite. Thereby, the Ms temperature at the final quenching stage can be reduced significantly compared to the first Ms temperature, leading to increased retained austenite stability. On the other hand, the Ms temperature increased when the deformation at 800 °C increased from 30% to 50%. Since austenite has deformed, a component of mechanical free energy (∆Gm) is accommodated to change the chemical-free energy (∆Gq), increasing the variation of the total free energy (∆GT) necessary for the transformation. This increase in total free energy in the ferrite induced by the deformation implies an increase in the Ms temperature, as shown in Figure 7.
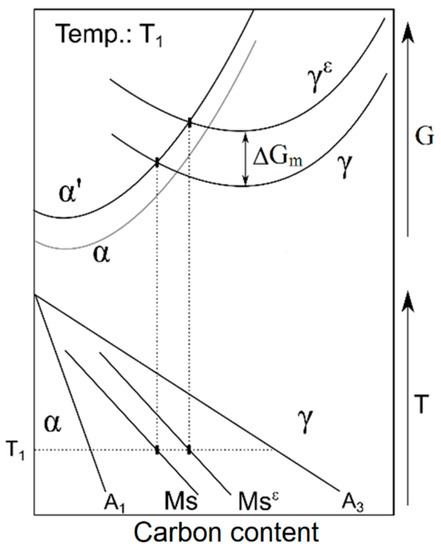
Figure 7.
Schematic representation of the variation of the Gibbs free energy (G) and temperature (T) for martensite (α’), ferrite (α) and austenite with deformation (γε) and without deformation (γ), depending on the carbon content. Ms and Msε represent the starting temperatures of the martensitic transformation without deformation and with deformation, respectively.
Additionally, as suggested by Nikravesh et al. [72] and Wang et al. [73], a higher density of crystallographic defects in softer austenite can attract more carbon atoms to reduce internal energy. Huang et al. [74] propose that accumulated dislocations close to the austenite grain boundaries contribute to the increase in Ms temperature. In contrast, intragranular dislocations (which can be rearranged to form subgrains inside the grains, causing their refinement) have an opposite effect, decreasing Ms temperature. However, there are other factors, in addition to chemical composition or dynamic recrystallization, that can influence the change of Ms temperature values, as it can also be influenced by cooling and deformation rates, grain size, elastic-plastic stresses, microstructural defects, and even certain types of austenite grain boundaries [75,76]. Therefore, from the results of the temperature Ms obtained, it is possible to conclude that even though different phenomena that imply the change of this temperature may coexist, the enrichment of austenite in carbon seems to be the predominant phenomenon for low strains (≤30%). In comparison, the increase in total free energy by creating a mechanical driving force caused by the deformation seems preponderant for high deformation percentages (30 and 50%).
The XRD results showing a carbon enrichment of retained austenite (see Figure 6) are essential due to the importance of the mechanical stability of austenite in TRIP steels. This mechanical stability is related to the retardation of the martensitic transformation in the early stages of plastic deformation [77,78]. In mechanical stability, the movement of the martensite/austenite interface is blocked mainly by the tangles of deformed austenite dislocations [79] or by the intersection between transformation dislocations and the high density of dislocations caused by austenite deformation at high temperature [80]. Since higher dislocation densities accumulated at prior austenite boundaries impose a constraint on martensite growth, the beginning of mechanical stabilization can be predicted by the balance between the force that activates the movement of the interface against the resistance imposed by the dislocation tangle. Therefore, just as the dislocation tangles hamper slip, any obstacle in the trajectory of the interface will prevent its movement.
As it is known, the martensitic transformation occurs through the movement of a semi-coherent interface, formed by dislocations with Burgers vectors normal to the interface plane that can then move by slipping. Thus, mechanical stabilization has been found in plate-like phases or phases created by transformations with “displacive” shear, as is the case with martensite or Widmanstätten ferrite [81]. Mechanical stabilization of austenite also explains the decrease in the temperature Ms because of the higher enrichment in the carbon content of austenite caused by the diffusive transformation.
3.3. Microstructural Characterization
3.3.1. Light Microscopy
In steels, isothermal treatments applied to austenite at temperatures lower than perlite formation generate bainite. Morphologically, bainite is in the form of ferrite laths (or needles, as seen in a two-dimensional section) containing dispersed carbides either between each ferrite unit (upper bainite) or on its interior (lower bainite) [82]. On the other hand, TRIP-assisted steels contain an equiaxed ferrite structure produced by partial austenitization in the intercritical field and carbide-free bainite interspersed with retained austenite produced by an austempering treatment. The bainitic transformation from intercritical austenite is decisive in the TRIP-steels processing since bainite formation allows austenite carbon enrichment, which can be retained after quenching step to room temperature to obtain the TRIP effect [78]. In Q&P treatments, bainite formation is also possible because the partitioning step takes place at a temperature above martensitic starting. The morphology and phase fractions of austenite and ferrite resulting from the intercritical annealing strongly affect the microstructural development in the further steps of the Q&P process [83]. This morphological difference between bainite laths and equiaxed or quasi-polygonal ferrite grains allows their differentiation in the microstructures obtained by light and scanning electron microscopy. Additionally, by EBSD (Section 3.3.3), the bainite presents higher dislocation density due to the fact that the bainitic transformation occurs under a significant shape and volume change and is, therefore, associated with shear and hydrostatic stresses leading to increased creation of dislocations [84]. In the case of bainite and acicular ferrite (non-equiaxial shape highly substructured) promoted by hot deformation, the main differences are the nucleation sites and growth directions. Bainite nucleates at austenite grain boundaries and grows as a sheaf of parallel plates in the same growth direction within the austenite grains, whereas acicular ferrite generally nucleates intragranularly and grows as primary plates in the same or different [85]. Since bainite is harder than ferrite, the variation of micro and nanohardness measurements is also a complementary technique for this differentiation, as conducted in Section 3.3.4.
Images obtained by light microscopy of some of the experiments are shown in Figure 8 and Figure 9. Figure 8 shows some micrographs of the sample after quenching (Q), quenching and partitioning (Q&P), and hot stamping (HS) treatments, while Figure 9 shows those corresponding to some of the experiments in the combined hot stamping process and quenching and partitioning (HSQ&P). These figures mainly distinguish martensite regions, with dark brown tint, bainite, in light tint films, and epitaxial ferrite (formed at intercritical temperature) or DIFT (produced by deformation at high temperature) with white tint in polygonal shapes. One can see an evident increase in the ferrite formation in the samples that suffered deformation because the kinetics of ferrite nucleation is accelerated by austenite deformation due to the increase of the driving force caused by the stored deformation energy, the acceleration of carbon diffusion in austenite, and the increase in nucleation sites within the grains of austenite [86]. These defects locally increase Gibbs’ free energy, destabilizing austenite and accelerating the kinetics of ferritic transformation [71]. This increase in ferrite is due to an increase in the deformation percentage and a decrease in the deformation temperature. According to Ghosh et al. [71], with the deformation temperature increasing, there could be a decrease in the net driving force for the γ → α transformation. Furthermore, the deformation temperature affects the nature and density of intragranular defects [87] and the refinement of the ferrite grains.
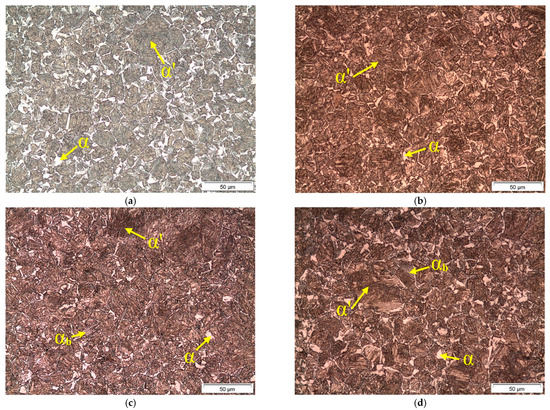
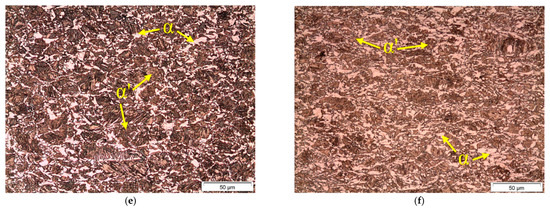
Figure 8.
Microstructure (LM) of TRIP steel, after the quenching (Q), quenching and partitioning (Q&P) and hot stamping (HS) treatments, with previous intercritical austenitization at 800 °C: (a) Q; (b) Q&P, with Q at 308 °C; (c) Q&P, with Q at 318 °C; (d) Q&P, with Q at 328 °C; (e) HS, with deformation at 30% at 750 °C and (f) HS, with deformation at 50% at 750 °C. α ‘, αb, α, and γ indicate martensite, bainitic-ferrite, ferrite, and austenite, respectively; 2% Nital etchant.
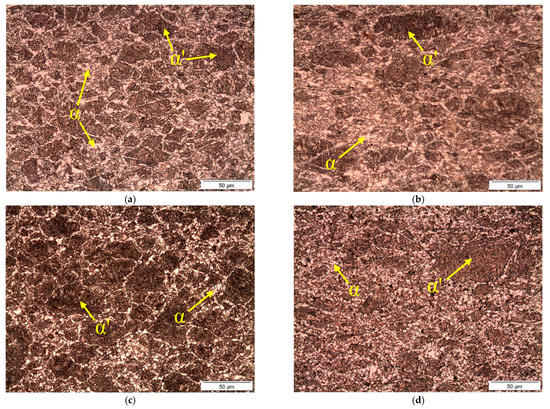
Figure 9.
Microstructure (LM) of TRIP steel after combined treatments of hot stamping followed by quenching and partitioning (HSQ&P) with a quenching temperature of 318 °C. (a) HSQ & P, with 30% deformation at 750 °C; (b) HSQ&P, with 50% deformation at 750 °C; (c) HSQ & P, with 30% deformation at 800 °C and (d) HSQ&P, with 50% deformation at 800 °C. α’ and α indicate martensite and ferrite, respectively; 2% Nital etchant.
Several attempts to identify retained austenite using different metallographic etchants (LePera, Klemm, and Picral with variations in concentration and proportion of their components), dwell times, combinations of etchants, and polarized light were performed. However, these tests were not successful, resulting in uncertainties for the interpretation. Therefore, the decision to use scanning electron microscopy and backscattered electron diffraction was made to obtain a more objective characterization of this retained austenite and further analyze the phases by quantitative stereology. Using only light microscopy it was challenging to distinguish austenite in the form of blocks and films-like. However, the technique was useful to visualize the microstructural distribution and homogeneity after the heat and thermomechanical treatments performed thanks to its smaller magnification and larger field.
3.3.2. Scanning Electron Microscopy
Images obtained by scanning electron microscopy (SEM) of some of the experiments performed are presented in Figure 10, Figure 11, Figure 12 and Figure 13. Figure 10 shows some sample micrographs after quenching (Q) and quenching and partitioning (Q&P) treatments, with previous intercritical austenitization at 800 and 820 °C and partition times of 100 and 500 s. The images in Figure 11 correspond to the micrographs of the samples subjected to the hot stamping treatment (HS). In Figure 12 and Figure 13, we can see the images of some experiments of the combined process of cold or hot stamping with subsequent quenching treatment and partitioning (CSQ&P and HSQ&P). In general, in these images, the ferrite (α) is observed in low relief and a darker shade, located in the grain contours of the former austenite grain, now martensite (α’). Additionally, it is possible to clearly distinguish the bainitic ferrite (αb) characterized in the form of alternating laths with films of retained austenite (γf) and some blocks of retained austenite (γb) adjacent to the allotriomorphic ferrite. According to the Q&P treatment, martensite grains are expected to have retained austenite between the laths in the form of films; however, by SEM, it is difficult to confirm this identification.
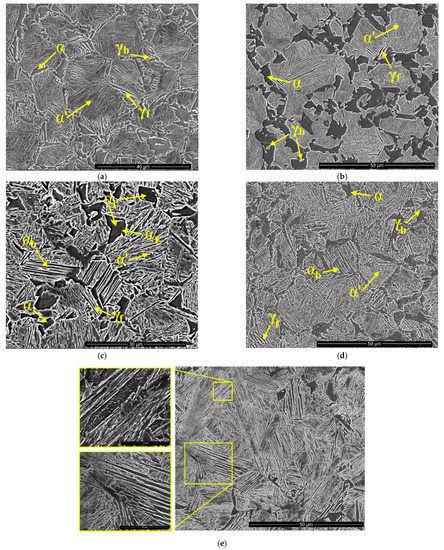
Figure 10.
Microstructure (SEM) of TRIP steel: (a) quenching (Q), with intercritical austenitization (IT) at 800 °C; (b) Q, with IT = 820 °C; (c) quenching and partitioning (Q&P), with IT = 800 °C, quenching temperature (QT) of 308 °C and partition time (Pt) of 100 s; (d) Q&P, with IT = 820 °C, QT = 328 °C and Pt = 100 s; (e) Q&P, with IT = 800 °C, QT = 328 °C, Pt = 500 s. α’, αb, αI, αE, γb, and γf are martensite, bainitic-ferrite, intercritical ferrite, epitaxial ferrite, retained austenite as a block-type and film-like, respectively; 2% Nital etchant.
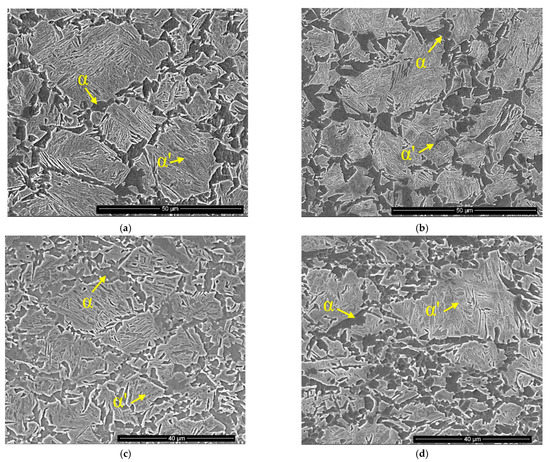
Figure 11.
Microstructure (SEM) of TRIP steel samples after hot stamping (HS) processes with previous intercritical austenitization at 800 °C. (a) HS with 10% deformation at 750 °C; (b) HS with 10% deformation at 800 °C; (c) HS with 30% deformation at 750 °C; (d) HS with 50% deformation at 750 °C. α’ and α represent martensite and ferrite, respectively; 2% Nital etchant.
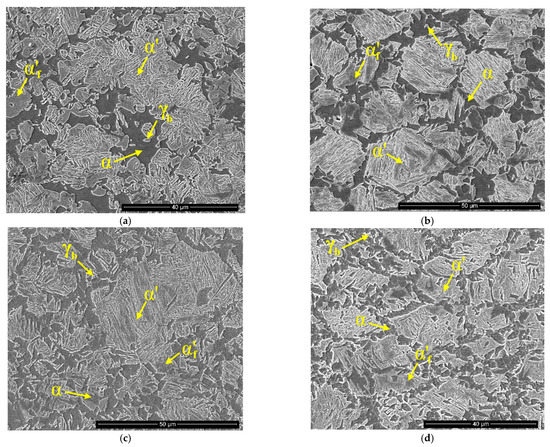
Figure 12.
Microstructure (SEM) of TRIP steel samples after combined cold stamping (CS) or hot (HS) treatments, followed by quenching and partitioning (CSQ&P or HSQ&P). (a) CSQ&P, with 10% cold deformation, intercritical austenitization (IT) at 800 °C and quenching temperature (QT) of 328 °C; (b) HSQ&P with IT = 800 °C, 10% deformation at 800 °C and QT = 328 °C; (c) HSQ&P with IT = 820 °C, 10% deformation at 750 °C and QT = 328 °C; (c) HSQ&P with IT = 820 °C, (d) deformation at 30% at 750 °C and QT = 328 °C. All samples were partitioned at 400 °C for 100 s. α′, α′f, αb, α, γb and γf represent tempered martensite, fresh martensite, bainitic-ferrite, ferrite, retained austenite as a block-type and film-like, respectively; 2% Nital etchant.
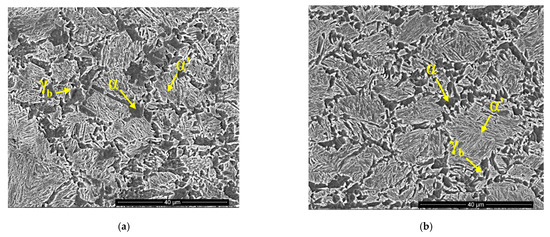
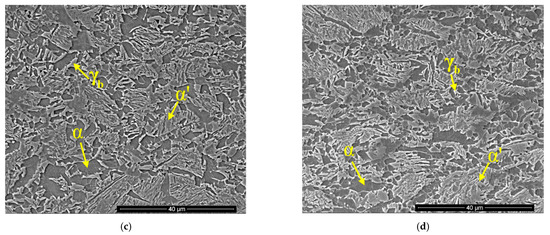
Figure 13.
Microstructure (SEM) of TRIP steel samples after the combined hot stamping treatments, followed by quenching and partitioning (HSQ & P). (a) HSQ & P, with 30% deformation at 800 °C and quenching temperature (QT) of 328 °C; (b) HSQ & P with 50% deformation at 800 °C and QT = 328 °C; (c) HSQ & P with 30% deformation at 750 °C and QT = 328 °C; (d) HSQ&P with 50% deformation at 750 °C and QT = 318 °C. All samples were austenitized intercritically at 800 °C and partitioned at 400 °C for 100 s; 2% Nital etchant.
Although the Q and Q&P samples have been austenitized at different intercritical temperatures, the microstructures do not present considerable differences in the distribution, morphology, and microconstituents, as shown in Figure 10. The multiphase microstructures are constituted by: (a) martensite laths presented in sheaves (α’) grouped in bundles or packets; (b) ferrite-bainite (αb); (c) primary ferrite (proeutectoid) or intercritical with polygonal morphology (α); (d) epitaxial ferrite (αE), which grew from intercritical ferrite (αI) during rapid cooling; (e) retained austenite in the form of blocks (γb), mainly located in the contours of martensite and ferrite and austenite in the form of films (γf). In Figure 10e, corresponding to the Q&P sample intercritically austenitized at 800 °C and partitioned at 400 °C for 500 s, two regions (yellow frames) were enlarged, a lath of martensite that indicates the presence of precipitates aligned in its interior and a region of bainitic ferrite (αb). In this sample, it is observed, qualitatively, a greater presence of αb when compared to the Q&P sample intercritically austenitized at 800 °C and partitioned at 400 °C for 100 s, probably associated with the longer partition time, allowing bainitic transformation. On the other hand, it is expected that in this sample, the martensite has completely partitioned its carbon to austenite, as suggested by the results of in situ synchrotron radiation, which showed that during the partition stage for partition times of 500 s after 180 s there was an apparent stabilization in carbon enrichment of austenite (Figure 6). This higher enrichment could stabilize austenite so that it could decrease the presence of fresh martensite at room temperature. Some authors [88] have suggested that the presence of fresh martensite deteriorates the mechanical properties (embrittle) of the material.
From the images in Figure 11, corresponding to samples submitted to the HS treatment, it can be observed that with increasing deformation, a higher quantity of ferrite is generated in the former austenite grain boundaries and a decrease in the grain sizes of both ferrite (α) and martensite (α′) is observed. Figure 11 shows that the 10% deformation carried out at 750 °C or 800 °C does not result in considerable changes in the formation of ferrite nor in the refinement of the grains.
Figure 12 and Figure 13 show the microstructures of the combined process of CSQ&P and HSQ&P, carried out after intercritical austenitization at 800 and 820 °C, respectively, deformations at 10, 30, or 50% and quenching temperatures (QT) of 318 or 328 °C. Comparing the samples submitted to the CSQ&P and HSQ&P processes deformed at 10%, both quenched at 328 °C and partitioned at 400 °C for 100 s (Figure 12a,b), it is observed that the cold deformed sample presents larger grains of ferrite and higher formation of fresh or non-tempered martensite. This indicates that the high-temperature deformation favors grain refinement (possibly caused by recrystallization at the deformation temperature). On the other hand, the lower formation of fresh martensite is perhaps because the high-temperature deformation favors the segregation of carbon to austenite or for lattice defects.
As already pointed out for samples treated by HS, in HSQ&P samples, it is also possible to observe that with the increase in the amount of deformation, there is a more intense formation of α in the former austenite grain boundaries, now α′, and a decrease in grain sizes both of α and α′. Differently from the observed for the samples deformed 10% at 800 and 750 °C, whose microstructures did not show considerable changes, the samples deformed at 30% and 50% at 800 °C produce less α than when deformed at 750 °C.
Figure 14 shows the results of the 800 °C intercritical austenitized HSQ&P samples, deformed 30%, with quenching temperatures (QT) of 318 and 328 °C, and partitioned at 400 °C for 500 s. As seen in the yellow rectangular regions of this figure, even though the samples have undergone deformation at high temperature, bainitic ferrite (αb) was formed in the microstructures due to the longer maintenance time in the partition stage, as predicted by the in situ results of the variation of the austenite lattice parameter.
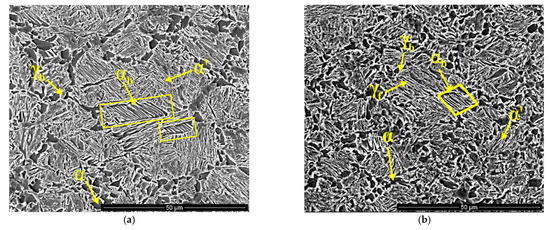
Figure 14.
Microstructure (SEM) of TRIP steel samples after the combined hot stamping treatments followed by quenching and partitioning (HSQ&P) of the samples partitioned at 400 °C for 500 s. (a) HSQ&P, with 30% deformation at 800 °C and quenching temperature (QT) of 328 °C; (b) HSQ&P, with 30% deformation at 800 °C and quenching temperature (QT) of 318 °C.
Thus, from the microstructural analysis by light and scanning electron microscopy, it is evident that polygonal ferrite forms at the grain boundaries of the deformed metastable austenite grains, and its amount changes depending on the amount and temperature of deformation, both directly related to the deformation energy stored in the austenite, which facilitates the nucleation of ferrite and reduces the incubation period [89,90].
3.3.3. Backscattered Electron Diffraction (EBSD)
The EBSD combining the phase identification tools and grain orientation maps (IPF, Inverse Pole Figure) is a powerful tool for microstructural characterization and analysis of crystalline materials, whereby retained austenite (FCC, Face-Centered Cubic) and ferrite (BCC, Body-Centered Cubic) can be easily distinguished. EBSD analyses were performed to obtain information on the microstructure, morphology, and quantification of the phases after the Q&P and HSQ&P processes. Figure 15 shows the results of the Q&P and HSQ&P samples (deformed at 750 °C or 800 °C by 30%), quenched at 308 °C, and partitioned at 400 °C for 100 s. Figure 16 presents the results of EBSD of phase identification and IPF obtained for sample Q&P (Figure 16a,b), quenched at 318 °C, and partitioned at 400 °C for 100 s, and the samples with the same Q&P treatment, but with a previous deformation of 30% at 750 °C (Figure 16c,d) and 800 °C (Figure 16e,f). In these figures, it is possible to clearly distinguish the different morphologies of the retained austenite (γ, in red color), which is presented in the form of equiaxial blocks (pre-existing grains of austenite), distributed along with the martensite packages and close to the ferrite boundaries; in the form of films, between the martensite laths (α’) and between the bainitic-ferrite plates (αb); and embedded in the ferrite grains. The formation of embedded γ was clearly explained by Sun et al. [91]. The concentration of γ at grain boundaries can be explained because the nucleation occurs preferentially on crystal defects, thus grain boundaries are preferred.
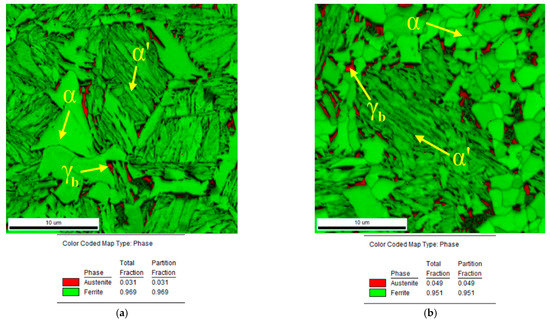
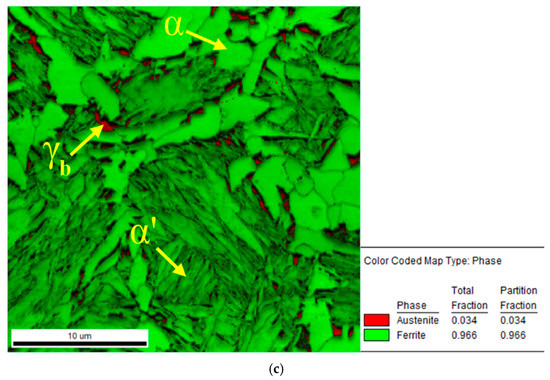
Figure 15.
EBSD images of TRIP steel samples after combined quenching and partitioning (Q&P) and hot stamping treatments followed by quenching and partitioning (HSQ&P) of austenitized samples intercritically at 800 °C, quenched at 308 °C and partitioned at 400 °C for 100 s. (a) Q&P; (b) HSQ&P with 30% deformation at 750 °C; (c) HSQ&P with 30% deformation at 800 °C.
Figure 16.
Images obtained by EBSD combining the tools for phase identification and grain orientation maps (IPF, images b,d,f) of the TRIP steel samples after quenching and partition treatments (Q&P) and hot stamping followed by quenching and partition (HSQ&P) of the austenitized samples intercritically at 800 °C, quenched at 318 °C and partitioned at 400 °C for 100 s. (a,b) Q&P with 3.3% of γ; (c,d) HSQ&P with 30% deformation at 750 °C with austenite with 7.8% of γ; (e,f) HSQ&P with 30% deformation at 800 °C with 5.0% of γ. α’, α, αb, α’f and γ represent martensite, ferrite, bainitic-ferrite, fresh martensite, and austenite, respectively.
Comparing the Q&P and HSQ&P microstructures, it is possible to observe that, with high-temperature deformation, the ferrite and martensite blocks are considerably refined. This microstructure may be favorable due to the increased resistance to impact and fracture, related to the effect of the refined grains making it difficult for the progress of crack propagation [92].
The use of EBSD also allowed estimation of retained austenite for each treatment, which was 3.1% for the Q&P sample, 4.9% for the HSQ&P deformed at 750 °C, and 3.4% for the sample deformed at 800 °C, all quenched at 308 °C. While for a sample quenched at 318 °C, the percentages of austenite were 3.3% for the Q&P sample, 8.0% for the HSQ&P deformed at 750 °C, and 5.0% for the sample deformed at 800 °C.
Figure 17 shows the combination of the image quality with the grain orientation map for austenite of the HSQ&P sample, deformed at 750 °C and quenched at 318 °C. From this map, it is possible to observe that the austenite islands belonging to the same grain have the same crystallographic orientation, as shown in the regions delimited by the outlines in yellow. It indicates that this retained austenite probably originated from the same previous grain of austenite [28].
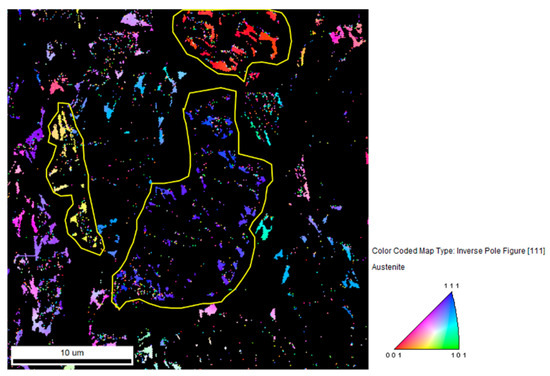
Figure 17.
Image obtained by combining the phase identification tools (for austenite) and grain orientations of the HSQ&P sample, austenitized intercritically at 800 °C, deformed by 30% at 750 °C, quenched at 318 °C, and partitioned at 400 °C for 100 s.
Figure 18 shows the grain size area for the Q&P and HSQ&P treatments of the samples quenched at 318 °C. This figure shows how, due to high-temperature deformation, there was a considerable refinement of the grain size area, with the average value for the Q&P sample being 28 μm2, while the HSQ&P samples had average values around 16 μm2. This reduction in the grain size area (also seen in the images obtained by SEM and EBSD) in the HSQ&P samples may have been caused by the occurrence of dynamic recrystallization associated with the generation of a large number of defects during hot deformation.
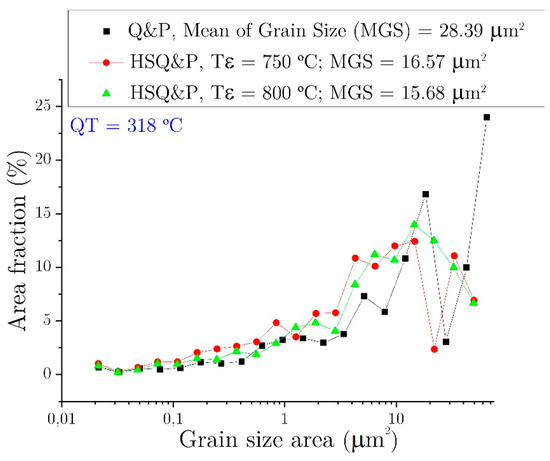
Figure 18.
Grain size area of the Q&P and HSQ&P samples quenched at 318 °C, with deformation of the HSQ&P samples of 30% at 750 °C and 800 °C.
The main thermodynamic potential for recrystallization (migration of high-angle boundaries) is the energy stored during plastic deformation in the form of crystalline defects. In the vast majority of hot deformation conditions, the nucleation of the dynamic recrystallization occurs preferably at the grain boundaries [93], especially at the highly deformed boundaries. This mechanism is characterized by the formation of successive necklaces, consisting of the nucleation of the new grains in stages, which advance sequentially into the grain [94]. This behavior is more easily observed in the results by light microscopy in Figure 9, where ferrite grains have undergone intense refining and surround some of the former austenite (martensite) grains in the form of necklaces. The grains dynamically recrystallized stop growing and remain small since the thermodynamic potential is equalized with the rest of the deformed matrix through the generated dislocations [94]. An energetic balance is created between the introduction of new grain boundaries (increase in free energy) and the elimination of crystalline defects (decrease in free energy). Thus, in microstructures in which dynamic recrystallization occurs, there is generally a considerable refinement of the grains. Zheng et al. [60] highlighted that the dynamic recrystallization of ferrite grains subdivides the ferrite grains previously formed by high-temperature deformation (DIFT or DSIT effect, dynamic strain-induced transformation), maintaining their equiaxial morphology. However, during the DIFT (or DSIT) effect due to the plastic deformation of the metastable austenite, intragranular ferrite nucleation occurs quickly and extensively in the different substructures, which causes the refinement of the ferrite grains [87]. Therefore, both the transformation of austenite into ferrite that occurs due to deformation (DIFT effect) and dynamic recrystallization would be the primary mechanisms that contribute to the formation of refined ferrite grains.
The orientation maps obtained by EBSD can also be used to investigate the distribution of the deformation between grains, which is essential to understand the behavior of the global deformation of the material. The Kernel approximation can characterize the misorientation (change in local orientation) between grains caused by plastic deformation [95]. In this approach, each pixel on the map is colored according to the change in the degree of orientation with respect to neighboring pixels. For this, the local misorientation distribution component calculates the average misorientation between each pixel and the neighboring pixels and assigns the average value to that pixel; a restriction regarding disorientations that exceed the tolerance value (maximum disorientation value that the user defines) implies the exclusion of these data from the calculation of the average. In this way, local misorientation distribution maps were obtained to evaluate the local deformation gradient and the small-scale localized plastic deformation distribution. Thus, Kernel misorientation, which is a measure closely related to the density of dislocations [39], was used to identify the gradient of orientations between martensite, ferrite-bainite and ferrite in TRIP steel treated by Q&P or HSQ&P. Figure 19 shows the Kernel Average Misorientation (KAM) for the Q&P sample (Figure 19a) quenched at 318 °C and partitioned at 400 °C for 100 s and samples with the same Q&P treatment, but with the previous deformation at 750 °C (Figure 19b) and 800 °C (Figure 19c). The tolerance of the misorientation angle for the identification of grains was 5°; therefore, the blue color represents misorientations less than 1°, the green color disorientations between 2° and 3°, the orange color between 3° and 4°, and red misorientations between 4° and 5°. The 5° threshold angle can be considered to eliminate the effect of other crystallographic defects, such as sub-grains boundaries. Low KAM values (<1°), representing the negligible storage energy, can be associated with intercritical and DIFT ferrite phases. Moderate KAM values grains (between 1° and 3°) represented by green areas could be associated with the distorted BCC ferrite parameter or martensite with low tetragonality. While the freshly formed martensite, produced during the last quenching due to the lower retained austenite stability, generates a significant lattice distortion, as indicated in red regions by KAM values greater than 3°. Thus, in the analyzed microstructures, it is observed that martensite presents the highest gradients of local misorientation because of its higher density of dislocations, caused by the martensitic transformation shear, while ferrite contains comparatively fewer dislocations, and less carbon, which also explains its lower hardness values.
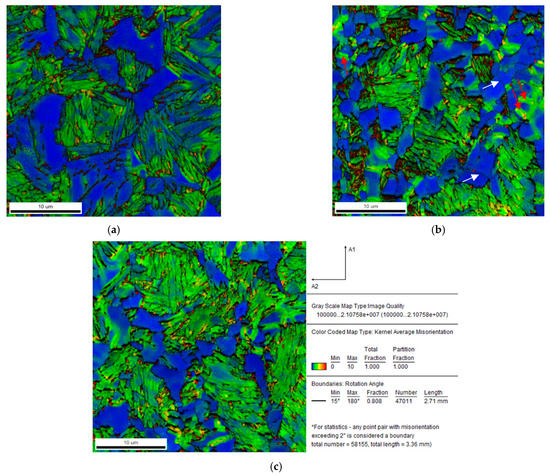
Figure 19.
Characterization of the Kernel Average misorientation using EBSD of TRIP steel after Q&P and HSQ&P treatments. The samples were quenched at 318 °C and partitioned at 400 °C for 100 s. (a) Q&P, (b) HSQ&P deformed by 30% at 750 °C (c) HSQ&P deformed by 30% at 800 °C.
Because of the similarities between the crystalline structures of martensite and ferrite (body-centered tetragonal and body-centered cubic, respectively), martensite is not distinguished from ferrite by indexing the diffraction patterns. However, it was possible to distinguish martensite from ferrite by the regions with the lowest quality index, resulting from the high dislocation density of martensite. Two types of martensite are generated during the quenching and partitioning processes: (a) the tempered or partitioned martensite during the partitioning stage, which has a low carbon content, and (b) fresh or unpartitioned martensite, generated in the last cooling, after the partitioning process, from the least stable austenite, and, therefore, with higher carbon content and dislocation density, when compared to the tempered martensite. A distinction could be made between the two types of martensite through EBSD and KAM misorientation results.
As the local magnitude of the misorientation is related to the dislocation density and the amount of plastic deformation, it was possible to evaluate the magnitude and distribution of misorientations between the different phases in samples treated by Q&P and HSQ&P. Additionally, in the HSQ&P samples, higher KAM values are observed in some ferrite/ferrite interfaces (red arrows). Ferrite/ferrite interfaces are also observed with low KAM values (white arrows), similar to those observed in the Q&P condition. These results can be explained by the formation of two types of ferrite: the ferrite generated by the DIFT effect, which has lower KAM values, and the ferrite formed during the intercritical step, which was deformed mainly at grain boundaries [96] and has higher KAM values.
Figure 20 shows a region selected to assess fresh martensite by misorientation. The high local misorientation in the fresh martensite blocks is identified by the dark green regions in the image quality map (IQ) (Figure 20a). The fresh martensite is located in the vicinity of the retained austenite grains, which makes the distinction between fresh and tempered martensites reliable through the image of quality [97]. Figure 20b shows the point-to-origin misorientation along the micrograph arrow in Figure 20a. This path allows the analysis of the orientation relationship within the grains defined by the image quality, which showed misorientations between 15° and 55°. The results with degrees of misorientation greater than 50° are identified in this micrograph as fresh martensite, which is the typical misorientation between blocks within a single martensite package [97]. In this result, it is also observed that fresh martensite consists of blocks smaller than 0.5 µm wide.
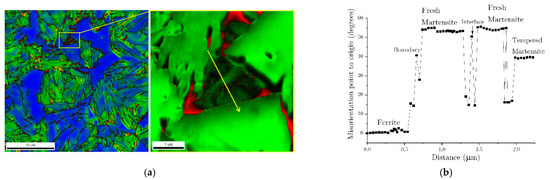
Figure 20.
(a) Kernel disorientation map (KAM) with degree outlines with disorientations higher than 15°, the 5 closest neighbors (or borders) were evaluated, and the maximum disorientation limit was 10° and EBSD combining the quality image and the identification of the phases of the region indicated in the yellow box of the region on the left. The arrow represents the evaluated path of disorientation. (b) Point-to-origin misorientation of the path assessed in figure (a) identified as fresh martensite.
Figure 21 shows the analysis of the misorientation of the regions identified by EBSD as ferrite. Figure 21a shows the four paths used to analyze the misorientation, and Figure 21b the result of the average misorientation of the paths depicted in Figure 21a. The results clearly show that for the regions identified as ferrite, the disorientation does not exceed 2°.
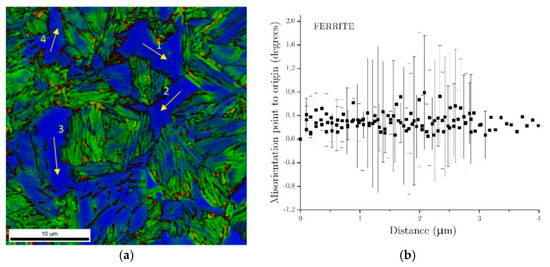
Figure 21.
(a) Kernel average misorientation map with degree outlines with disorientations higher than 15° for ferrite identification; (b) average values of point-to-origin disorientation of paths 1 to 4 identified as ferrite.
Figure 22 shows the misorientation analysis of the regions identified by EBSD as tempered martensite and bainitic ferrite for the Q&P sample austenitized intercritically at 800 °C, quenched at 318 °C, and partitioned at 400 °C for 100 s. In Figure 22a the selected region (yellow outline) is observed for the analysis of the tempered martensite, and the misorientation map of the enlarged region, indicating with the arrow the path used to analyze the KAM, and in Figure 22c the result of the misorientation of that path. Figure 22c shows the EBSD maps identifying the phases (BCC in green and FCC in red) and the selected region (yellow outline) for the analysis of bainitic-ferrite. This figure indicates the path used to analyze and obtain the result (Figure 22d) of the point-to-origin misorientation. The results of these analyses clearly show that for the regions identified as tempered martensite, the misorientation does not exceed 50°, and the contours of the blocks have misorientation that exceeds 45°, which leads to considering them as high-angle boundaries. For the regions identified as bainitic-ferrite, the KAM is around 20°. Therefore, from the points-to-origin misorientation results, it is observed that misorientations are less than 2° for ferrite, between 10° and 20° for bainitic-ferrite, and above 20° for tempered and fresh martensites. This represents a new approach for identifying microconstituents using KAM based on EBSD results.
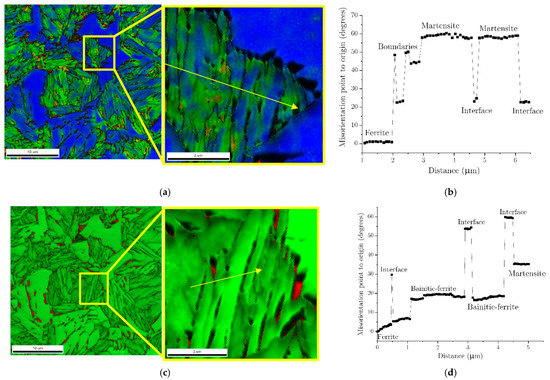
Figure 22.
Average kernel disorientation and phase identification by EBSD of the Q&P sample austenitized intercritically at 800 °C, quenched at 318 °C and partitioned at 400 °C for 100 s. (a) KAM map with degree contours with misorientations greater than 15° for the evaluation of a tempered martensite region (yellow outline) and an enlarged map of KAM of a tempered martensite region; (b) average values of the point-to-origin disorientation of the path indicated by the arrow in figure (a); (c) EBSD of the phase identification map of the enlarged region (yellow box), indicating through the yellow arrow the path used for the analysis of KAM; (d) mean values of the point-to-origin disorientation of the path indicated by the yellow arrow in figure (c).
Thus, the magnitude of the local plastic deformation can be analyzed by evaluating the misorientation gradient on the map of local disorientation components. This approach allows a qualitative assessment of small local deformation gradients that are intrinsically linked to orientation gradients. In the same way, plastic deformation is physically associated with the movement of dislocations and the rotation of the crystalline lattice [93]. The comparison of the results shows that the rotation of the local structure is greater in the deformed samples. Therefore, an average increase in misorientation for a specific pixel concerning its neighbors allows the identification of microconstituents in complex microstructures treated by the Q&P and HSQ&P processes.
3.3.4. EBSD and Nanoindentation
In this research, a microstructural and mechanical characterization approach was proposed on a local and global scale, based on the combination of EBSD and instrumented nanoindentation. The main idea was to correlate the microstructures and phases of the samples treated by Q&P and HSQ&P to their respective nanoindentation curves.
Figure 23 shows a mesh of 10 × 10 μm nanoindentations, superimposed on the image obtained by EBSD, corresponding to the Q&P sample, intercritically austenitized at 800 °C, quenched at 318 °C and partitioned at 400 °C for 100 s. This approach can help relate the dependence of nanohardness with crystallographic orientation and grain size and distribution.
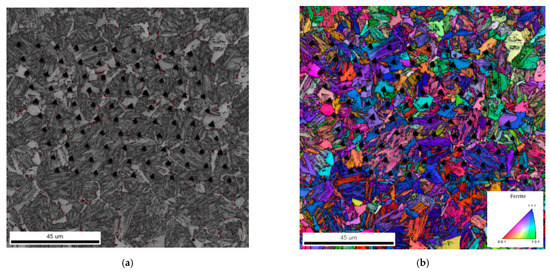
Figure 23.
The Q&P sample austenitized intercritically at 800 °C, quenched at 318 °C and partitioned at 400 °C for 100 s. (a) 10 × 10 mesh of the nanoindentations superimposed on a phase identification map (BCC in gray and FCC in red); (b) grid grain map for the nanoindentations mesh.
Figure 24 shows some of the microconstituents identified by correlating the nanohardness results with the phase identification combined with the image quality and using the Kernel Average Misorientation in the EBSD. In this figure, the white, yellow, and red circles represent the regions of martensite, bainitic-ferrite, and ferrite, respectively. The results indicate nanohardness ranges between 5.0 and 5.9 GPa for martensite, 2.6 and 4.0 GPa for ferrite, and between 3.1 and 5.0 GPa for bainitic ferrite. Moreover, the results confirm that the misorientation is above 20° for martensite, between 10° and 20° for bainitic ferrite, and less than 2° for ferrite. The reduction in nano-hardness and misorientation in the ferritic regions can be attributed to the possible reduction in the density of dislocations [98].
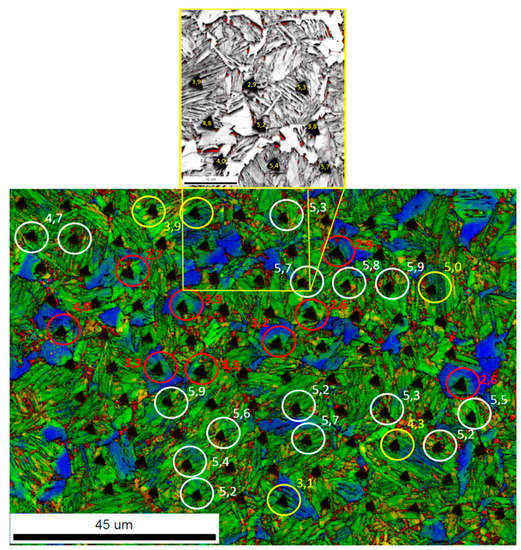
Figure 24.
Kernel Average Misorientation of the Q&P sample austenitized at 800 °C, quenched at 318 °C, and partitioned at 400 °C for 100 s. The white, yellow, and red circles identify regions of martensite, bainitic-ferrite, and ferrite, respectively—results in GPa.
As noted, there is a superposition of the nanohardness values for ferrite and bainitic ferrite between approximately 3 and 4 GPa, which can be attributed to the influence on nanohardness of factors, such as grain size, crystallographic orientation, increase or decrease in density of dislocations, stresses generated by the surrounding phases, etc. However, the distinction between the two constituents is possible thanks to their morphological differences observed by the image quality index combined with the Kernel misorientation. Additionally, martensite presents a more considerable Kernel misorientation when compared to bainitic ferrite, which allows its distinction.
It should be noted that the regions identified as bainitic ferrite (Figure 25a) showed variations (staggered changes) in the loading curves known as pop-ins, as shown in Figure 25c. This region corresponds to the bainitic ferrite identified at the bottom of Figure 24, with a nanohardness value of 3.9 GPa. Figure 25b shows that the ferrite plates (green color) contain films of retained austenite (red color). Therefore, these pop-ins may be related to the phase transformation of retained austenite to martensite induced by deformation [99,100]. Other researchers point out that these pop-ins have been detected due to geometric softening when an external tension is applied, and a specific variant of martensite is selected [101], which minimizes the total energy during the deformation-induced transformation from austenite to martensite [100,102].
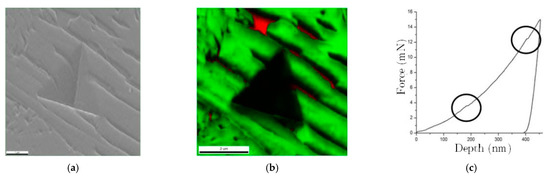
Figure 25.
Indentation in a region identified by Kernel disorientation as bainitic ferrite. (a) Scanning electron microscopy image; (b) identification of phases by EBSD. The green regions represent the BCC structure, and the red regions represent the FCC structure, in this case, austenite; (c) nanoindentation loading-unloading curve, and the circles indicate the regions with the pop-ins.
EBSD analysis and nanoindentation measurements were also used to correlate the microconstituents and their characteristics (such as grain size and distribution) to the nanohardness results for the HSQ&P samples. In Figure 26, the results are presented for the HSQ&P samples austenitized intercritically at 800 °C, deformed at 750 °C (Figure 26a), and 800 °C (Figure 26b), both quenched at 318 °C and partitioned at 400 °C for 100 s. Figure 27 shows the nanoindentation results, EBSD image quality, phase identification, and KAM for the HSQ&P samples austenitized intercritically at 800 °C, quenched at 328 °C and partitioned at 400 °C by 100 s. The red regions, corresponding to the FCC austenitic phase, indicate the size and distribution of this phase in the microstructure. The regions of ferrite and martensite (BCC structure) appear in green. The darker green regions, with a lower Band-Contrast (BC), are martensite regions with a high density of dislocations. The high values of nanohardness can confirm this in these regions. Thus, with the nanoindentation technique combined with EBSD, it was possible to validate the hypotheses of phase identification using the KAM previously presented (Figure 19, Figure 20, Figure 21 and Figure 22).
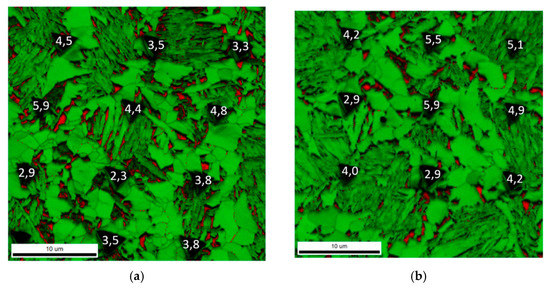
Figure 26.
EBSD map and nanoindentations of the HSQ&P sample, austenitized intercritically at 800 °C, quenched at 318 °C and partitioned at 400 °C for 100s. The samples were 30% deformed at: (a) 750 °C, (b) 800 °C. Results of nanohardness in GPa. The green regions indicate the BCC (ferrite or martensite) phases and the red regions of the FCC (austenite) phase.
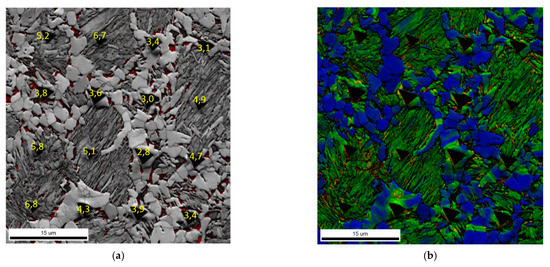
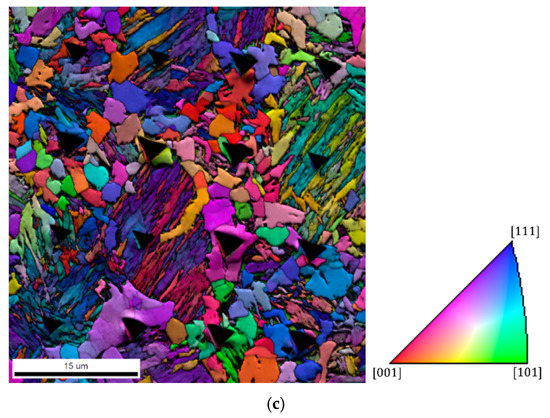
Figure 27.
Superposition of nanoindentation marks on (a) phase identification map (in red austenite); (b) kernel misorientation, and (c) grain orientation map. Sample HSQ&P, austenitized intercritically at 800 °C, deformed at 800 °C by 30%, quenched at 328 °C and partitioned at 400 °C for 100 s.
Figure 27 shows the results of the phase identification, KAM, and the grain orientation map of a region with a 4 × 4 nanoindentation mesh of the HSQ&P sample austenitized intercritically at 800 °C, deformed at 750 °C by 30%, quenched at 328 °C, and partitioned at 400 °C for 100 s. In Figure 27a, the red regions indicate the FCC phase (austenite), and the gray regions indicate the BCC phase (ferrite or martensite). In the BCC regions, martensite and ferrite can be clearly distinguished by the shape of the grains. While the ferrite presents grains with equiaxial shape in grayscale with lighter gray shades, the martensite regions, constituted mainly of packets of laths, present darker shades of gray, probably caused by the high density of dislocations. The distinction between ferrite and martensite based on comparing the shape of the grains and the shades of gray is validated by nanohardness and Kernel misorientation data (Figure 27b) in these regions. As noted, the martensite packets have a considerable higher misorientation (expressed in green on the kernel map) and are surrounded by the ferrite grains (grains in blue), due to the smaller misorientation within the grain formed at the intercritical temperature and during deformation. In the martensite regions, the size of the indentations is slightly smaller than in the ferrite. In the HSQ&P sample (deformed at 800 °C by 30%), the martensite nano-hardness ranges between 4.9 and 6.8 GPa, while the ferrite grains nano-hardness ranges between 2.8 and 3.9 GPa. The carbon content of martensite is mainly responsible for its high hardness and mechanical strength. When comparing these results with those of the Q&P sample, an increase of ≈15% in the martensite nanohardness is observed. This increase may be related to an increase in the density of defects, such as dislocations or twinning, or a decrease in the grain size caused by deformation at high temperatures. Therefore, from a microstructural point of view, martensite will have higher hardness and mechanical strength than ferrite, even though it is a very low carbon martensite [103]. Comparing the results of nano hardness in the grain orientation map (Figure 27c), it is observed that the nanohardness is slightly higher in the grains with a trend to orientate in the [111] direction, than in grains oriented in the [001] and [101] directions, which could be associated with a greater effort required to activate slipping of dislocations in the [111] direction.
The nanoindentation characterization carried out with the 15 mN load was not helpful to characterize the mechanical behavior of the small grains of retained austenite and fresh martensite. Therefore, to evaluate the nanohardness of fresh martensite and to correlate the behavior of retained austenite under the effect of deformation (TRIP effect) with the crystallographic orientation, nanoindentations were conducted with a reduced applied load of 1.5 mN, so the sizes of the indents were reduced, as shown in Figure 28.
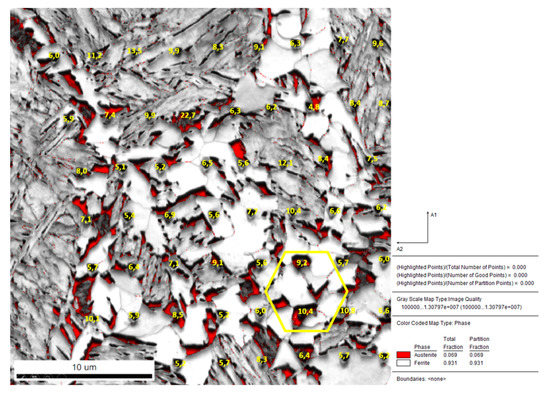
Figure 28.
Phase identification map (austenite in red) and nanohardness results. HSQ& P sample, intercritically austenitized at 800 °C, deformed at 800 °C by 30%, quenched at 318 °C, and partitioned at 400 °C for 100 s.
Figure 28. Phase identification map (austenite in red) and nanohardness results. HSQ& P sample, intercritically austenitized at 800 °C, deformed at 800 °C by 30%, quenched at 318 °C, and partitioned at 400 °C for 100 s.
The region delimited by the hexagon in Figure 28 shows two indented regions of fresh martensite. This region, together with the two nanoindentation curves, is shown in Figure 29. This figure clearly shows the behavior of pop-ins during the loading stage, associated with the large-scale nucleation of dislocations at the beginning of plastic deformation [98]. The observed pop-ins may be the result of the activation of pre-existing dislocations [99], the TRIP effect of austenite present within the grain [100], or as already mentioned, as a result of a geometric softening when an external stressor is applied and, a specific variant of martensite is selected [101]. In the case of the first hypothesis, the beginning of the nucleation of dislocations in the austenite grains can be observed based on the deviation of the Hertzian solution, the blue dotted curve, indicated by the red arrow in Figure 29. Before the start of pop-ins, that is, before ≈40 nm of penetration depth, the indented grain is likely to be free of dislocations, and the first pop-in observed during loading is likely to be a consequence of the start of dislocation nucleation [101]. The subsequent pop-ins of metastable austenite grains observed in the loading-displacement curve during the nanoindentation correspond to the beginning of the deformation-induced martensitic transformation [104]. Therefore, since the first pop-in represents the transition from elastic deformation to elastoplastic during indentation [99], the stresses in pop-ins during indentation can be estimated from the mechanics of Hertzian elastic contact [99]. It should be noted that these pop-ins were observed mainly in regions containing austenite blocks, which could indicate less stability in this type of retained austenite. However, the results of indentation 2 in Figure 29 did not show the pop-ins behavior. This may be due to the high density of pre-existing dislocations [105] in the indented volume of fresh martensite.
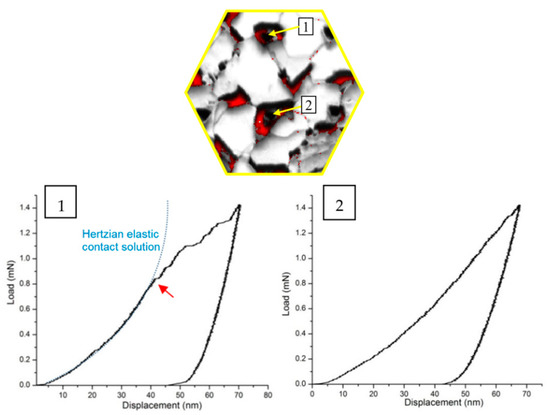
Figure 29.
Hexagon shown in Figure 28 and nanoindentation curves for regions identified as fresh martensite.
The size (depth and width) of the marks made by the nanoindenter with smaller loads seemed appropriate for assessing individual phases’ nano-hardness since the indentations were clearly located in areas of martensite and ferrite, thus avoiding the contributions of the grain boundaries between the phases.
Figure 30 shows the results of the nanoindentations superimposed on the results of EBSD combining the quality image, the grain orientation map (Figure 30a), and the Schmid factor (Figure 30b,c), for HSQ&P sample, intercritically austenitized at 800 °C, deformed at 800 °C by 30%, quenched at 318 °C and partitioned at 400 °C for 100 s. The Schmid factor [106] was calculated since this criterion indicates the deformation resistance of a particular region for a specific state of stress. Similar to the observations in Figure 27, ferrite and martensite grains oriented in the [107] direction show higher nanohardness than the grains oriented in the [001] and [101] directions. In Figure 30b,c, the grains with the highest Schmid factor are red, while the grains with the lowest Schmid factor are blue. By comparing the results of Schmid’s factors, it can be seen that the vast majority of ferrite grains close to the orientation [111] have a lower Schmid factor than the grains with other types of orientation. This means that for this orientation, greater stress is necessary for plastic deformation by dislocations slipping in the sliding system with maximum atomic density (110) for the BCC structure. In the case of grains oriented in the [001] and [101] directions, the Schmid factors are similar and have the highest in the microstructure.
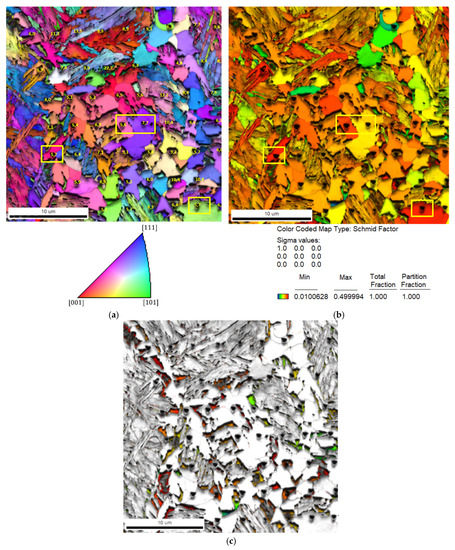
Figure 30.
Superposition of nanoindentations to the EBSD results of the HSQ&P sample, austenitized intercritically at 800 °C, deformed at 800 °C by 30%, quenched at 318 °C and partitioned at 400 °C for 100 s. (a) Grain orientation map combined with an image quality (IQ); (b) Schmid factor combined with IQ for the FCC and BCC phases; (c) Schmid factor combined with IQ for the FCC phase.
According to Schmid’s theory, grains with a higher Schmid factor are about to deform or undergo mechanically induced phase transformation more quickly and are, therefore, less stable [110], as the resolved critical (shear) stress for the occurrence of plastic deformation or martensitic transformation, is achieved more quickly. This is because the sliding planes in these grains do not need to undergo much rotation before the resolved shear stress reaches a critical value [54] since the dislocations are distributed much more evenly among the sliding planes [111]. Within each grain (or crystal structure), the different atomic densities of the planes, depending on the sliding direction, may be related to the activation of a greater or lesser number of sliding systems. Thus, in cubic structures, sliding occurs predominantly in planes of higher atomic density and in the close-packed direction. Thus, grains oriented in the [001] or [101] directions can more easily activate a higher number of sliding systems and, therefore, require lower stress values to undergo plastic deformation, which would explain the lower resistance to plastic deformation during nanoindentation. Accordingly, the lowest nano-hardness values (compare the indentations delimited by the yellow rectangles and squares in Figure 30b,c) are associated with these directions, as shown in Figure 31.
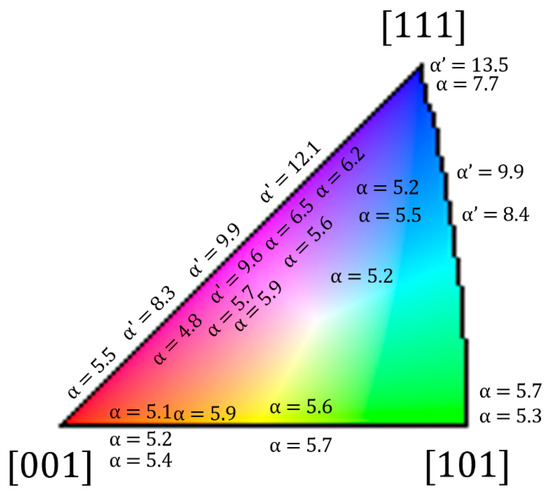
Figure 31.
Nanohardness values (GPa) superimposed on the unitary reference triangle for the BCC phase orientations, indicating the planes [111], [001], and [101] by the colors blue, red, and green, respectively. α and α ‘represent ferrite and martensite, respectively. The load value in the nanoindentations was 1.5 mN.
Figure 30c shows the Schmid factor relationship for the regions identified as austenite (FCC). It is interesting to note that the austenite grains that are embedded within the ferrite grains have a higher Schmid factor and, therefore, could reach the critical resolved stress (Schmid’s law) more quickly, thus having a higher chance of plastically deforming than the grains that are at the boundaries between ferrite and martensite. In other words, the austenite grains identified with the lowest Schmid factor (grains in light yellow, green, or blue) could be much more stable (in this case, stability would depend on the crystallographic orientation). According to Tirumalasetty et al. [108], during deformation, rotation occurs, preferably, in austenite grains (which can cause variation in the orientation of the planes and sliding directions), having greater Schmid factors. As the deformation progresses, there may be a reduction in Schmid’s factors in these grains and, therefore, a decrease of the critical resolved shear stress for martensitic transformation. Therefore, the rotation of the austenite grains, which are transformed into martensite in the last stages of deformation, is an additional factor in the contribution of the mechanical stability of austenite, which may disrupt the bainite formation and/or impede the martensitic transformation, in low carbon TRIP steels [44,108].
However, it should be noted that the mechanical properties (and grain stability) of phases also depend, in addition to the Schmid factor (i.e., the crystallographic orientation), on the chemical composition (mainly the carbon content), the grain volume, and the restrictions imposed by the surrounding microconstituents. On the other hand, in these analyses, the depths of the indented areas and the subsurface sizes of the grains are unknown, so the nano-hardness measurements may be affected by the presence of soft or hard phases under the indented region. One way to clarify the depth of the indentation and the subsurface behavior of the grains (including the analysis on the density of dislocations and the extent of the plastic deformation) would be to carry out the transversal preparation by FIB (Focused Ion Beam) of the indentation profile and make the subsequent analysis by transmission electron microscopy.
3.4. Stereology and Hardness
From the SEM results, the amount of ferrite was quantified by stereology in at least three micrographs for each treatment, using a 391-point mesh. In Table 2 and Table 3, these quantification results are related to the amount of retained austenite obtained by XRD and to microhardness. Table 2 presents the results of the samples treated by quenching and partitioning (Q&P), while Table 3 presents those of the samples previously deformed, both cold (CS) and hot (HS).
Table 2.
Results of microhardness (HV0.5) and percentages of ferrite (α) and austenite (γ) for the samples treated by quenching and partition (Q&P) for intercritical austenitization (IT) temperatures of 800 °C and 820 °C and partitioned at 400 °C.
Table 3.
Results of microhardness (HV0.5), percentages of ferrite (α) and austenite (γ) for samples treated by quenching and partitioning (Q&P) with previous cold (CSQ&P) or hot (HSQ&P) deformation, and intercritical austenitization (IT) temperatures of 800 °C and 820 °C and partitioned at 400 °C.
For the Q&P treated samples (Table 2), the increase in partitioning time increases the amount of ferrite (≈18%, ) and decreases the amount of austenite and hardness. The decrease in the amount of austenite during the partitioning stage was also observed in the in situ synchrotron radiation experiments, most probably associated with decomposition to bainitic-ferrite. The increase in hardness for shorter partitioning times may be associated with the lesser formation of ferrite but also with a more significant presence of fresh martensite, which originated in the final quench from austenite which was not stabilized enough during the partitioning stage. In these results, it is also clearly observed that, for both partitioning times (Pt) of 100 s and 500 s, there was a decrease in hardness with the increase of the quenching temperature (QT), which would be related to the lower formation of martensite as the QT increases. In turn, the percentage of retained austenite showed (in both cases, Pt equal to 100 or 500 s) the highest values for the temperature predicted by the constrained carbon equilibrium model (CCE) model (QT of 318 °C). This indicates that the calculation of the optimum quenching temperature using the CCE can be used as an initial parameter to obtain the highest values of retained austenite at room temperature. However, additional analyses would be necessary, mainly with higher quenching temperatures, to confirm this premise. On the other hand, it was observed that the increase in QT caused an apparent increase in the amount of ferrite. The quantification of ferrite by stereology included both ferrites formed at high temperatures (intercritical and DIFT) and the bainitic-ferrite that forms during the partitioning stage. Thus, the slight increase in the fraction of ferrite with the increase in QT in the Q&P samples can be explained considering that at higher quenching temperatures, a lower fraction of martensite is formed; therefore, when the QT is 328 °C, the highest fraction of austenite available to be stabilized at the partitioning stage is obtained. Increasing the quenching temperature decreases the fraction of martensite and leads to the formation of less stable austenite, with a lower carbon content available to be partitioned from martensite. This austenite transforms to bainitic-ferrite during the partitioning stage thus explaining the increase in ferrite volume fraction.
In the case of samples that underwent partition treatment with the previous deformation at high temperature (HSQ&P) or at room temperature (CSQ&P), it is observed that, depending on the conditions (QT and amount and temperature of deformation) of thermomechanical treatment, there were considerable variations both in the results of microhardness, as well as in the results of phase fractions (α, ferrite, and γ, austenite).
Furthermore, it was observed that, for both deformations at 750 °C and 800 °C, the amount of retained austenite at room temperature increases when the deformation increases from 10% to 30%. When the deformation at 750°C increased from 30% to 50%, the amount of austenite decreased, while for the samples deformed at 800 °C this decrease was only observed for the QT of 318 °C. On the other hand, the behavior of the percentage of ferrite in the case of HSQ&P treatments did not have the same trend as in the Q&P samples (increase in the amount of α, with increasing QT). In this case, it is observed that with 10% previous deformation, at high temperature, there was a decrease in the amount of α, as the QT increases, both for the deformation at 750 °C and 800 °C, while for the deformations of 30% and 50% this variation is not significant. In the dilatometry results [44] it was observed that during the Q&P tests, there was an expansion of the BCC lattice parameter during the partition stage, possibly associated with the formation of bainite. For the HSQ&P samples, on the other side, there was a considerable reduction in this expansion. Therefore, the decrease in the amount of ferrite for the 10% deformation with increasing QT allows concluding that the deformation causes mechanical stabilization of the austenite, the formation of dislocation forests hindering the growth of the bainite [109] during the partition stage.
As a result, the change in the ferrite fraction could be mainly related to its growth kinetics, controlled by the carbon diffusion range, which strongly depends on the quenching temperature. The same change was not so evident for the 30% or 50% deformation (at the deformation temperature of 750 °C), where the ferrite did not show significant changes (1.2% and 8.4%, respectively). Additionally, when the deformation temperature was 750 °C, it was observed that when the quenching temperature changes from 308 °C to 318 °C, the microhardness increased approximately 2%, 4%, and 10% for the 10%, 30%, and 50% strains, respectively. Additionally, it was observed that when the deformation increased from 10% to 30% at 750 °C there was an increase (5.3%, 11.0%, and 32.5%, for the QT of 308 °C, 318 °C, and 328 °C, respectively) in the amount of ferrite, while for deformation at 800 °C the amount of ferrite decreased (34.9%, 46.9%, and 5.1%, for the QT of 308 °C, 318 °C and 328 °C, respectively). In the case of an increase in deformation from 30% to 50%, for the deformation temperature of 750 °C there was a decrease in ferrite by 18.5% and 6.5% for the QT of 308 °C and 318 °C, respectively; while, for the deformation temperature of 800 °C, an increase in the amount of ferrite of 33% and 88% was observed for the QT of 308 °C and 318 °C, respectively.
In general, the samples deformed at 750 °C show higher amounts of ferrite, which could be related, as pointed out by Ghosh et al. [71], to the reduction of the γ → α transformation driving force, with increasing deformation temperature. For the 328 °C quenching temperature, the ferrite changes are not significant (≈2%). In general, the hardness results for both deformation temperatures are compatible with the amounts of martensite and ferrite: the samples with the highest amounts of ferrite showed the lowest hardness and vice versa. Additionally, the 820 °C intercritically austenitized HSQ&P sample, deformed by 10% and 30%, showed an increase in hardness of 1%, increase in the amount of ferrite of 4%, and increase in the amount of austenite of 80%. Therefore, it is evident that the hardness not only depends on the percentage of ferrite but can also vary with the grain refinement, the presence of carbides [110,111] (due to their influence on the decrease in martensite carbon supersaturation), the austenite fraction, or the dislocation density present in the microstructure.
Table 4 presents the mechanical strength and ductility relationships, proposed by Matlock and Speer [112]. Data were obtained by numerical modeling for hypothetical mixtures of ferrite and martensite, corresponding to the first generation of Advanced High Strength Steels (AHSS) steels, and a prediction of the mechanical properties of steels with hypothetical variations of austenite and martensite fractions located in the region determined as the third generation of AHSS. This proposal suggests that the intermediate properties between the first and second generation of AHSS can be filled by complex microstructural combinations between high strength phases (such as martensite, fine-grain ferrite, or bainite) and the deformation hardenable austenite. Consequently, this combination may show higher deformation energies than steels consisting of combinations of ferrite and martensite. The good agreement between the predicted and observed tensile properties obtained by [113,114] and Ojima et al. [115] verified and suggests that simple composite modeling, as the Mileiko model [116] proposed, can be useful for guiding AHSS development.
Table 4.
Mechanical properties data for the constituents considered as input to the Mileiko model [116] to predict the relationships of mechanical strength and ductility of AHSS steels.
Relating the values in Table 4 with the various amounts of the phases obtained experimentally in this research (Table 1 and Table 2) for TRIP processed steel, it was possible to build an elongation-mechanical strength diagram using the rule of mixtures, as shown in Figure 32. Even though we know that the rule of mixtures is a very simplified approach for predicting mechanical properties, it works and has been used by several researchers as an initial approach to predict the mechanical strength and ductility properties of multiphase microstructures, aiming at the development of AHSS steels.
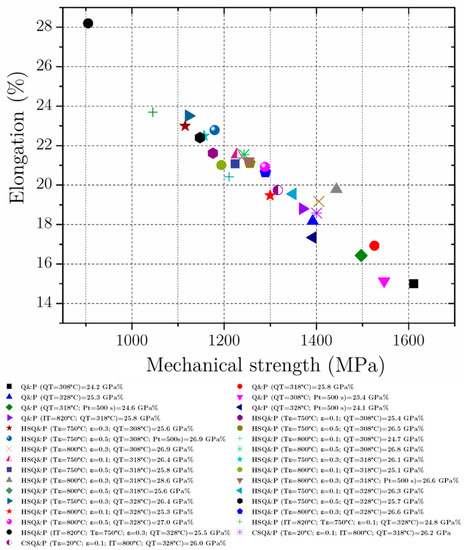
Figure 32.
Combinations of ductility and mechanical strength obtained by the Mileiko model [116] using the results of the volume fractions calculated experimentally for the various heat treatments performed: quenching and partitioning (Q&P), hot stamping followed by quenching and partitioning (HSQ&P), and cold stamping followed by quenching and partition (CSQ&P). Tε, ε, QT and Pt represent the deformation temperature, the percentage of deformation, the quenching temperature, and the partitioning time, respectively.
As seen in this figure, the highest mechanical strength values are associated with Q&P treatments, while the highest uniform elongation and lowest mechanical resistance are associated with HSQ&P. This behavior is related to greater volume fractions of retained austenite and deformation-induced ferrite in the HSQ&P samples. When the isothermal deformations are made at higher temperatures (800 °C), the resulting microstructures show increased mechanical strength. In comparison, non-isothermal deformations (starting at 750 °C) are suggested, if the objective is to increase ductility, sacrificing the mechanical strength. Additionally, it is known that the absorbed energy during an eventual collision depends on the product between elongation and strength (PSE, in GPa%). This product was calculated and associated with each heat treatment as observed at the bottom of Figure 32. From these results, it was possible to correlate the heat treatments conditions exhibiting the higher PSE values or the best combination of mechanical properties due to the multi-phase microstructures and the TRIP effect caused by RA.
The results obtained from the Mileiko model [116] relating the number of phases quantified by XRD and stereology was superimposed on the Material Property Charts (intermediate region of Figure 33). These results show that the various heat treatments performed in this study are promising for filling part of the gap between the first and second generations of AHSS, as predicted by the numerical model proposed by Matlock and Speer [112].
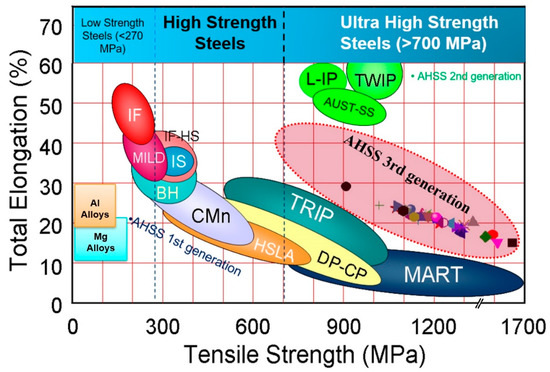
Figure 33.
Superposition of the results obtained in the present investigation (Figure 32) on the elongation-mechanical strength ‘banana’ curve for the region of ultra-high-strength steels corresponding to those of the third generation of AHSS. Adapted from Matlock et al. [117] and Srikanth et al. [118].
A good combination of high strength and ductility of the AHSS allows the manufacture of structural components with less thickness, improving passenger safety due to its high energy absorption capacity during a collision. This combination can be achieved by balancing the difference in the mechanical properties of hard and soft microconstituents, based on the assumption that each constituent contributes to strength and ductility, creating a composite microstructure and/or controlling the deformation mechanisms by imposing barriers to the dislocation movements [119]. Research indicates that reducing vehicle weight by 10% reduces fuel consumption by 6 to 10% and CO2 emissions by ≈ 4% [4,5]. Therefore, to meet the requirements in terms of safety, impact resistance, and reduced fuel consumption, the most viable alternative for creating thinner structural components is the development of high and ultra-high-strength steels with adequate formability [4] and merit indexes (yield strength/density) ratio. Additionally, the relationship between CO2 emission and fuel consumption savings is also an essential aspect because, according to the International Energy Agency (IEA, International Energy Agency) [120], the transport sector is responsible for more than half (≈65%) of the oil consumption in the world. Thus, lightweight car manufacture effectively reduces fuel consumption and emissions during the use of a vehicle, which in turn decreases the environmental impact, all without sacrificing passenger safety. The obtained results point toward an expansion of the combination of the mechanical properties spectrum of AHS steels. Within this scope, the mechanical properties of the HSQ&P and CSQ&P processed specimens are compatible with a “third-generation” of AHSS, aiming to reduce the weight of the vehicle structure at a low cost.
4. Summary and Conclusions
In the present study, various heat and thermomechanical treatments were applied to an advanced high-strength TRIP-assisted steel consisting of quenching (Q), quenching and partitioning (Q&P), hot stamping (HS), and the combined process of HS or cold stamping (CS) with subsequent quenching and partitioning (HSQ&P or CSQ&P). The main purpose was to investigate and discuss the effects of the variables involving the heat treatments, such as the intercritical austenitization temperature, the temperature and amount of deformation, the annealing temperature, and the temperature and partitioning time, and to analyze their influence on microstructural and mechanical responses. The analysis was carried out both during (in situ) the thermal and thermomechanical treatments and after applying these treatments. The performance and analysis of these heat and thermomechanical treatments allowed the following results and conclusions:
- The described methodology to calculate the optimal quenching temperature, including intercritical austenitization, allows estimating the appropriate quenching temperature for the Q&P and HSQ&P processes to obtain a substantial amount of retained austenite at room temperature. This prediction proved helpful in obtaining the highest amounts of retained austenite, even considering the restrictions imposed by the constrained carbon equilibrium model.
- In situ synchrotron X-ray diffraction showed the evident effect of the carbon enrichment of austenite during the partitioning stage. Furthermore, increasing the amount of deformation promotes less carbon enrichment of austenite. Isothermal deformation at 800 °C favors a higher carbon enrichment when compared to the samples non-isothermally deformed at 750 °C. Therefore, carbon enrichment during the partitioning stage does not depend solely on the Q&P heat treatment parameters, but also on the conditions created in the microstructure at high temperatures by isothermal or non-isothermal deformations.
- The results of synchrotron radiation using a 2D detector allowed us to observe that textures are present in the material since before the heat treatment and at the beginning and end of the partitioning stage, confirming that crystallographic texture does not appear as a consequence of the Q&P treatment parameters.
- Austenite deformation promotes diffusional phase transformation (DIFT ferrite), which results in carbon redistribution between supersaturated ferrite and austenite prior to martensitic transformation, leading to enrichment of untransformed austenite and, consequently, to a decrease in the Ms temperature. This phenomenon appears to be predominant for deformation percentages up to 30%. However, for larger strains, the increase in total free energy by creating a mechanical driving force caused by the strain is the predominant phenomenon.
- From the EBSD results, it was possible to distinguish different morphologies of the retained austenite, which appeared in the form of equiaxed blocks (preexisting austenite grains) distributed along the martensite packages and close to the ferrite boundaries; films between the martensite laths and between the bainitic-ferrite plates; and embedded in the ferrite grains. Additionally, the combination of the quality map with the orientation map allowed us to observe that the austenite islands belonging to the same grain have the same crystallographic orientation, indicating that this retained austenite originated from the same previous austenite grain.
- For the Q&P sample quenched at 318 °C and partitioned at 400 °C for 100 s, the average grain size value was 28 μm2, while the HSQ&P samples deformed by 30%, quenched at 318 °C and partitioned at 400 °C for 100 s showed medium values around 16 µm2. This suggested that the transformation of austenite into ferrite produced by deformation (DIFT-effect) and dynamic recrystallization would be the main mechanisms contributing to the formation of refined ferrite grains.
- In the HSQ&P samples, some ferrite/ferrite interfaces were analyzed using Kernel Average Misorientation (KAM) maps. Due to the variation in the misorientation results for this type of interface, the formation and identification of two types of ferrites can be proposed: the ferrite generated by the DIFT effect, which has lower KAM values, and the higher KAM values ferrite formed during the intercritical step, which was deformed mainly at the grain boundaries, and therefore, presents higher values of KAM in this region.
- Using the rule of mixtures, it was possible to build an elongation-mechanical strength diagram to identify and correlate the heat or thermomechanical treatment conditions that lead to an increase in ductility or strength according to the volume fractions of the resulting phases. Comparing the results for the HSQ&P treatments, it was observed that isothermal strains at higher temperatures (≥ 800 °C) are more advantageous to increase mechanical strength, while non-isothermal strains (starting at 750 °C) are suggested, if the objective is the increase in ductility, with mechanical strength being sacrificed.
Author Contributions
Conceptualization, E.A.A.E., A.S.N., A.P.T. and H.G.; methodology, E.A.A.E., A.S.N., A.M.R. and N.G.M.; software, E.A.A.E., A.S.N.; validation, M.M., H.B.P.; formal analysis, E.A.A.E., A.S.N. and M.M.; investigation, E.A.A.E., A.S.N., H.G. and A.P.T.; writing—review and editing, E.A.A.E., A.S.N., M.M., H.B.P., N.G.M., A.M.R., H.G. and A.P.T.; supervision, A.P.T. All authors have read and agreed to the published version of the manuscript.
Funding
This research was funded by FAPESP, Grant number 2014/11793-4 and Coordination for the Improvement of Higher Education Personnel—CAPES—Brazil Grant number 1715938.
Data Availability Statement
Not applicable.
Acknowledgments
To the Brazilian Nanotechnology National Laboratory (LNNano) and the Brazilian Synchrotron Light Laboratory (LNLS) are also acknowledged for the use of the XTMS facility at the XRD1 beamline.
Conflicts of Interest
The authors declare no conflict of interest.
References
- Hu, P.; Shi, D.; Ying, L.; Shen, G.; Liu, W. The finite element analysis of ductile damage during hot stamping of 22MnB5 steel. Mater. Des. 2015, 69, 141–152. [Google Scholar] [CrossRef]
- WORLDAUTOSTEEL. Future Steel Vehicle—Final Engineering Report. Available online: http://www.autosteel.org/Programs/FutureSteelVehicle.aspx (accessed on 7 October 2021).
- UltraLight Steel Auto Body Consortium. ULSAB-AVC—Advanced Vehicle Concepts Overview Report; ULSAB-AVC Consortium: Troy, MI, USA, 2002. [Google Scholar]
- Fonstein, N. Advanced High Strength Sheet Steels; Springer: Chicago, IN, USA, 2015; ISBN 9783319191645. [Google Scholar]
- Wang, X.; Ma, F.; Liu, Q.; Zhao, F. Research on Holding Pressure and Cooling Process During Hot Forming of Ultra-High Strength Steel 22MnB5. In Proceedings of the FISITA 2012 World Automotive Congress, Beijing, China, 27–30 November 2012; Springer: Berlin/Heidelberg, Germany, 2013; pp. 123–131. [Google Scholar]
- Yan, S.; Liu, X.; Liu, W.J.; Liang, T.; Zhang, B.; Liu, L.; Zhao, Y. Comparative study on microstructure and mechanical properties of a C-Mn-Si steel treated by quenching and partitioning (Q&P) processes after a full and intercritical austenitization. Mater. Sci. Eng. A 2017, 684, 261–269. [Google Scholar] [CrossRef]
- Liu, H.; Jin, X.; Dong, H.; Shi, J. Martensitic microstructural transformations from the hot stamping, quenching and partitioning process. Mater. Charact. 2011, 62, 223–227. [Google Scholar] [CrossRef]
- Lora, F.; Meza-García, E.; Rautenstrauch, A.; Mosel, A.; Silva, B.; Müller, R.; Ladgrebe, D.; Coelho, R. Press Hardening Technology: Current Challenges and Potential for Expansion in the Brazilian Industrial Sector. In Proceedings of the SENAFOR 35th, Porto Alegre, Brazil, 7 October 2015; p. 8. [Google Scholar]
- Windmann, M.; Röttger, a.; Theisen, W. Formation of intermetallic phases in Al-coated hot-stamped 22MnB5 sheets in terms of coating thickness and Si content. Surf. Coat. Technol. 2014, 246, 17–25. [Google Scholar] [CrossRef]
- Lei, C.; Cui, J.; Xing, Z.; Fu, H.; Zhao, H. Investigation of Cooling Effect of Hot-stamping Dies by Numerical Simulation. Phys. Procedia 2012, 25, 118–124. [Google Scholar] [CrossRef][Green Version]
- Wang, S.; Lee, P. Investigation of Die Quench Properties of Hot Stamping. China Steel Tech. Rep. 2013, 2, 22–31. [Google Scholar]
- Okitsu, Y.; Takata, N.; Tsuji, N. Mechanical properties of ultrafine grained ferritic steel sheets fabricated by rolling and annealing of duplex microstructure. J. Mater. Sci. 2008, 43, 7391–7396. [Google Scholar] [CrossRef]
- Fereiduni, E.; Ghasemi Banadkouki, S.S. Improvement of mechanical properties in a dual-phase ferrite-martensite AISI4140 steel under tough-strong ferrite formation. Mater. Des. 2014, 56, 232–240. [Google Scholar] [CrossRef]
- Karmakar, A.; Misra, R.D.K.; Neogy, S.; Chakrabarti, D. Development of Ultra-Fine Grained Dual-Phase Steels: Mechanism of Grain Refinement during Inter-Critical Deformation. Mater. Sci. Forum 2014, 783–786, 674–678. [Google Scholar] [CrossRef]
- Matsumara, O.; Sakuma, T.; Ishi, Y.; Zhao, J. Etfect of Retained Austenite on Formability of High Strength Sheet Steels. ISIJ Int. 1992, 32, 1110–1116. [Google Scholar] [CrossRef]
- Yin, H.; Zhao, A.; Zhao, Z.; Li, X.; Li, S.; Hu, H.; Xia, W. Influence of original microstructure on the transformation behavior and mechanical properties of ultra-high-strength TRIP-aided steel. Int. J. Miner. Metall. Mater. 2015, 22, 262–271. [Google Scholar] [CrossRef]
- Gibbs, P.J.; De Moor, E.; Merwin, M.J.; Clausen, B.; Speer, J.G.; Matlock, D.K. Austenite Stability Effects on Tensile Behavior of Manganese-Enriched-Austenite Transformation-Induced Plasticity Steel. Metall. Mater. Trans. A 2011, 42, 3691–3702. [Google Scholar] [CrossRef]
- Han, H.N.; Oh, C.S.; Kim, G.; Kwon, O. Design method for TRIP-aided multiphase steel based on a microstructure-based modelling for transformation-induced plasticity and mechanically induced martensitic transformation. Mater. Sci. Eng. A 2009, 499, 462–468. [Google Scholar] [CrossRef]
- Young, C.H.; Bhadeshia, H.K.D.H. Strength of mixtures of bainite and martensite. Mater. Sci. Technol. 1994, 10, 209–214. [Google Scholar] [CrossRef]
- Hase, K.; Garcia-Mateo, C.; Bhadeshia, H.K.D.H. Bainite formation influenced by large stress. Mater. Sci. Technol. 2004, 20, 1499–1505. [Google Scholar] [CrossRef]
- Hell, J.-C.; Dehmas, M.; Allain, S.; Prado, J.M.; Hazotte, A.; Chateau, J.-P. Microstructure—Properties Relationships in Carbide-free Bainitic Steels. ISIJ Int. 2011, 51, 1724–1732. [Google Scholar] [CrossRef]
- Andrea Di Schino Analysis of Phase Transformation in High Strength Low Alloyed Steels. Metalurgija 2017, 56, 349–352.
- Cornide, J.; Miyamoto, G.; Caballero, F.G.; Furuhara, T.; Miller, M.K.; García-Mateo, C. Distribution of Dislocations in Nanostructured Bainite. Solid State Phenom. 2011, 172–174, 117–122. [Google Scholar] [CrossRef]
- Gong, W.; Tomota, Y.; Harjo, S.; Su, Y.H.; Aizawa, K. Effect of prior martensite on bainite transformation in nanobainite steel. Acta Mater. 2015, 85, 243–249. [Google Scholar] [CrossRef]
- Caballero, F.G.; Garcia-Mateo, C.; Miller, M.K. Design of novel bainitic steels: Moving from ultrafine to nanoscale structures. Jom 2014, 66, 747–755. [Google Scholar] [CrossRef]
- Speer, J.; Matlock, D.K.; De Cooman, B.C.; Schroth, J.G. Carbon partitioning into austenite after martensite transformation. Acta Mater. 2003, 51, 2611–2622. [Google Scholar] [CrossRef]
- Santofimia, M.J.; Zhao, L.; Sietsma, J. Microstructural evolution of a low-carbon steel during application of quenching and partitioning heat treatments after partial austenitization. Metall. Mater. Trans. A Phys. Metall. Mater. Sci. 2009, 40, 46–57. [Google Scholar] [CrossRef]
- Santofimia, M.J.; Zhao, L.; Petrov, R.; Kwakernaak, C.; Sloof, W.G.; Sietsma, J. Microstructural development during the quenching and partitioning process in a newly designed low-carbon steel. Acta Mater. 2011, 59, 6059–6068. [Google Scholar] [CrossRef]
- Steineder, K.; Schneider, R.; Krizan, D.; Béal, C.; Sommitsch, C. Comparative Investigation of Phase Transformation Behavior as a Function of Annealing Temperature and Cooling Rate of Two Medium-Mn Steels. Steel Res. Int. 2015, 86, 1179–1186. [Google Scholar] [CrossRef]
- Grajcar, A.; Kilarski, A.; Radwanski, K.; Swadzba, R. Microstructural Features of Strain-Induced Martensitic Transformation in Medium-Mn Steels with Metastable Retained Austenite. Arch. Metall. Mater. 2014, 59, 12–14. [Google Scholar] [CrossRef]
- Aydin, H.; Essadiqi, E.; Jung, I.-H.; Yue, S. Development of 3rd generation AHSS with medium Mn content alloying compositions. Mater. Sci. Eng. A 2013, 564, 501–508. [Google Scholar] [CrossRef]
- Narayanaswamy, B.; Hodgson, P.; Beladi, H. Comparisons of the two-body abrasive wear behaviour of four different ferrous microstructures with similar hardness levels. Wear 2016, 350–351, 155–165. [Google Scholar] [CrossRef]
- Han, W.; Li, Y.; Chen, G.; Yang, Q. Effect of sintering additive composition on microstructure and mechanical properties of silicon nitride. Mater. Sci. Eng. A 2017, 700, 19–24. [Google Scholar] [CrossRef]
- Speer, J.G.; Assunção, F.C.R.; Matlock, D.K.; Edmonds, D.V. The “quenching and partitioning” process: Background and recent progress. Mater. Res. 2005, 8, 417–423. [Google Scholar] [CrossRef]
- Di Schino, A.; Gaggiotti, M.; Testani, C. Heat Treatment Effect on Microstructure Evolution in a 7% Cr Steel for Forging. Metals 2020, 10, 808. [Google Scholar] [CrossRef]
- Choi, K.S.; Soulami, A.; Liu, W.N.; Sun, X.; Khaleel, M.A. Influence of various material design parameters on deformation behaviors of TRIP steels. Comput. Mater. Sci. 2010, 50, 720–730. [Google Scholar] [CrossRef]
- Wang, J.; van der Zwaag, S. Stabilization Mechanisms of Retained Austenite in Transformation-Induced Plasticity Steel. Metall. Mater. Trans. A 2001, 32, 1527–1539. [Google Scholar] [CrossRef]
- Yi, H.L.; Lee, K.Y.; Bhadeshia, H.K.D.H. Mechanical stabilisation of retained austenite in δ-TRIP steel. Mater. Sci. Eng. A 2011, 528, 5900–5903. [Google Scholar] [CrossRef]
- Shen, Y.F.; Qiu, L.N.; Sun, X.; Zuo, L.; Liaw, P.K.; Raabe, D. Effects of retained austenite volume fraction, morphology, and carbon content on strength and ductility of nanostructured TRIP-assisted steels. Mater. Sci. Eng. A 2015, 636, 551–564. [Google Scholar] [CrossRef]
- Seol, J.B.; Raabe, D.; Choi, P.P.; Im, Y.R.; Park, C.G. Atomic scale effects of alloying, partitioning, solute drag and austempering on the mechanical properties of high-carbon bainitic-austenitic TRIP steels. Acta Mater. 2012, 60, 6183–6199. [Google Scholar] [CrossRef]
- Cai, Z.H.; Ding, H.; Misra, R.D.K.; Ying, Z.Y. Austenite stability and deformation behavior in a cold-rolled transformation-induced plasticity steel with medium manganese content. Acta Mater. 2015, 84, 229–236. [Google Scholar] [CrossRef]
- Ariza, E.A.; Poplawsky, J.; Guo, W.; Unocic, K.; Ramirez, A.J.; Tschiptschin, A.P.; Babu, S.S. Evaluation of Carbon Partitioning in New Generation of Quench and Partitioning (Q&P) Steels. Metall. Mater. Trans. A 2018, 49, 4809–4823. [Google Scholar] [CrossRef]
- Eghbali, B. Study on the ferrite grain refinement during intercritical deformation of a microalloyed steel. Mater. Sci. Eng. A 2010, 527, 3407–3410. [Google Scholar] [CrossRef]
- Ariza, E.A.; Nishikawa, A.S.; Goldenstein, H.; Tschiptschin, A.P. Characterization and methodology for calculating the mechanical properties of a TRIP-steel submitted to hot stamping and quenching and partitioning (Q&P). Mater. Sci. Eng. A 2016, 671, 54–69. [Google Scholar] [CrossRef]
- Ariza-Echeverri, E.A.; Masoumi, M.; Nishikawa, A.S.; Mesa, D.H.; Marquez-Rossy, A.E.; Tschiptschin, A.P. Development of a new generation of quench and partitioning steels: Influence of processing parameters on texture, nanoindentation, and mechanical properties. Mater. Des. 2020, 186, 108329. [Google Scholar] [CrossRef]
- Bardelcik, A.; Worswick, M.J.; Wells, M.A. The influence of martensite, bainite and ferrite on the as-quenched constitutive response of simultaneously quenched and deformed boron steel—Experiments and model. Mater. Des. 2014, 55, 509–525. [Google Scholar] [CrossRef]
- Faria, G.A. Exploring Metallic Materials Behavior Through In Situ Crystallographic Studies by Synchrotron Radiation. Master’s Thesis, State University of Campinas, Sao Paulo, Brazil, 2014. [Google Scholar]
- De Knijf, D.; Nguyen-Minh, T.; Petrov, R.H.; Kestens, L.A.I.; Jonas, J.J. Orientation dependence of the martensite transformation in a quenched and partitioned steel subjected to uniaxial tension. J. Appl. Crystallogr. 2014, 47, 1261–1266. [Google Scholar] [CrossRef]
- Available online: http://lnnano.cnpem.br/laboratories/cpm/facilities/xtms (accessed on 31 August 2021).
- Suwanpinij, P. The Synchrotron Radiation for Steel Research. Adv. Mater. Sci. Eng. 2016, 2016, 1–6. [Google Scholar] [CrossRef]
- Babu, S.S.; Specht, E.D.; David, S.A.; Karapetrova, E.; Zschack, P.; Peet, M.; Bhadeshia, H.K.D.H. In-situ observations of lattice parameter fluctuations in austenite and transformation to bainite. Metall. Mater. Trans. A 2005, 36, 3281–3289. [Google Scholar] [CrossRef]
- Gnäupel-Herold, T.; Creuziger, A. Diffraction study of the retained austenite content in TRIP steels. Mater. Sci. Eng. A 2011, 528, 3594–3600. [Google Scholar] [CrossRef]
- Dickson, M.J. The Significance of Texture Parameters in Phase Analysis by X-Ray Diffraction. J. Appl. Crystallogr. 1969, 2, 176–180. [Google Scholar] [CrossRef]
- Fielding, L.C.D.; Jones, N.G.; Walsh, J.; Van Boxel, S.; Blackmur, M.S.; Lee, P.D.; Withers, P.J.; Stone, H.J.; Bhadeshia, H.K.D.H. Synchrotron analysis of toughness anomalies in nanostructured bainite. Acta Mater. 2016, 105, 52–58. [Google Scholar] [CrossRef]
- Van Bohemen, S.M.C. The nonlinear lattice expansion of iron alloys in the range 100–1600 K. Scr. Mater. 2013, 69, 315–318. [Google Scholar] [CrossRef]
- Dyson, D.J.; Holmes, B. Effect of alloying additions on the lattice parameter of austenite. J. Iron Steel Inst. 1970, 208, 469–474. [Google Scholar]
- Mola, J.; Cooman, B.C. Quenching and Partitioning (Q&P) Processing of Martensitic Stainless Steels. Metall. Mater. Trans. A 2012, 44, 946–967. [Google Scholar] [CrossRef]
- Speer, J.G.; Matlock, D.K.; Decooman, B.C. Analysis of Lattice Parameter Changes Following Induced Plasticity Sheet Steel. Met. Mater Trans A 2005, 36, 907–918. [Google Scholar]
- Fultz, B.; Howe, J. Diffraction and the X-Ray Powder Diffractometer. In Transmission Electron Microscopy and Diffractometry of Materials; Graduate Texts in Physics; Springer: Berlin/Heidelberg, Germany, 2013; pp. 1–57. ISBN 978-3-642-29760-1. [Google Scholar]
- ASTM Standard. ASTM E562-08; Standard Test Method for Determining Volume Fraction by Systematic Manual Point Count. 1–7. ASTM International: West Conshohocken, PA, USA, 2002.
- Koistinen, D.P.; Marburger, R.E. A general equation prescribing the extent of the austenite-martensite transformation in pure iron-carbon alloys and plain carbon steels. Acta Metall. 1959, 7, 59–60. [Google Scholar] [CrossRef]
- van Bohemen, S.M.C. Bainite and martensite start temperature calculated with exponential carbon dependence. Mater. Sci. Technol. 2012, 28, 487–495. [Google Scholar] [CrossRef]
- Andrews, K. Empirical Formulae for the Calculation of Some Transformation Temperatures. J. Iron Steel Inst. 1965, 203, 721–727. [Google Scholar]
- Speer, J.G.; Edmonds, D.V.; Rizzo, F.C.; Matlock, D.K. Partitioning of carbon from supersaturated plates of ferrite, with application to steel processing and fundamentals of the bainite transformation. Curr. Opin. Solid State Mater. Sci. 2004, 8, 219–237. [Google Scholar] [CrossRef]
- Rizzo, F.C.; Martins, A.R.; Speer, J.G.; Matlock, D.K.; Clarke, a.; De Cooman, B.C. Quenching and Partitioning of Ni-Added High Strength Steels. Mater. Sci. Forum 2007, 539–543, 4476–4481. [Google Scholar] [CrossRef]
- Matlock, D.K.; Bräutigam, V.E.; Speer, J.G. Application of the Quenching and Partitioning (Q&P) Process to a Medium-Carbon, High-Si Microalloyed Bar Steel. Mater. Sci. Forum 2003, 426–432, 1089–1094. [Google Scholar] [CrossRef]
- Rollett, A.; Humphreys, F.; Rohrer, G.S.; Hatherly, M. Recrystallization and Related Annealing Phenomena, 2nd ed.; Pergamon: Stanmore, UK, 2004; ISBN 9780080441641. [Google Scholar]
- Cheng, L.; Chen, Y.; Cai, Q.; Yu, W.; Han, G.; Dong, E.; Li, X. Precipitation enhanced ultragrain refinement of Ti-Mo microalloyed ferritic steel during warm rolling. Mater. Sci. Eng. A 2017, 698, 117–125. [Google Scholar] [CrossRef]
- Shen, X.J.; Tang, S.; Chen, J.; Liu, Z.Y.; Misra, R.D.K.; Wang, G.D. Grain refinement in surface layers through deformation-induced ferrite transformation in microalloyed steel plate. Mater. Des. 2017, 113, 137–141. [Google Scholar] [CrossRef]
- Liu, H.; Sun, H.; Liu, B.; Li, D.; Sun, F.; Jin, X. An ultrahigh strength steel with ultrafine-grained microstructure produced through intercritical deformation and partitioning process. Mater. Des. 2015, 83, 760–767. [Google Scholar] [CrossRef]
- Ghosh, C.; Aranas, C.; Jonas, J.J. Dynamic transformation of deformed austenite at temperatures above the Ae3. Prog. Mater. Sci. 2016, 82, 151–233. [Google Scholar] [CrossRef]
- Nikravesh, M.; Naderi, M.; Akbari, G.H. Influence of hot plastic deformation and cooling rate on martensite and bainite start temperatures in 22MnB5 steel. Mater. Sci. Eng. A 2012, 540, 24–29. [Google Scholar] [CrossRef]
- Wang, H.-Z.; Yang, P.; Mao, W.-M.; Lu, F.-Y. Effect of hot deformation of austenite on martensitic transformation in high manganese steel. J. Alloys Compd. 2013, 558, 26–33. [Google Scholar] [CrossRef]
- He, B.B.; Xu, W.; Huang, M.X. Increase of martensite start temperature after small deformation of austenite. Mater. Sci. Eng. A 2014, 609, 141–146. [Google Scholar] [CrossRef]
- Han, Q.; Kang, Y.; Zhao, X.; Stanford, N.; Cai, M. Suppression of Ms temperature by carbon partitioning from carbon-supersaturated ferrite to metastable austenite during intercritical annealing. Mater. Des. 2013, 51, 409–414. [Google Scholar] [CrossRef]
- Ariza, E.A.; Tschiptschin, A.P.; Azevedo, C.R.F. Failure analysis of a martensitic stainless steel (CA-15M) roll manufactured by centrifugal casting. Part II: Thermal stress analysis by FEA. Eng. Fail. Anal. 2015, 48, 78–93. [Google Scholar] [CrossRef]
- Zhang, M.; Wang, Y.H.; Zheng, C.L.; Zhang, F.C.; Wang, T.S. Austenite deformation behaviour and effect of ausforming process on starting martensite microstructure in medium-carbon S-Al-rich alloy steel. Mater. Sci. Eng. A 2014, 596, 9–14. [Google Scholar] [CrossRef]
- Luo, H.; Zhao, L.; Kruijver, S.O.; Sietsma, J.; Zwaag, S. Van Der Effect of Intercritical Deformation on Bainite Formation in Al-containing TRIP Steel. ISIJ Int. 2003, 43, 1219–1227. [Google Scholar] [CrossRef][Green Version]
- Garcia-Mateo, C.; Caballero, F.G.; Capdevila, C.; De Andres, C.G. Estimation of dislocation density in bainitic microstructures using high-resolution dilatometry. Scr. Mater. 2009, 61, 855–858. [Google Scholar] [CrossRef]
- Fan, D.W.; Park, R.B.; Cho, Y.R.; De Cooman, B.C. Influence of isothermal deformation conditions on the mechanical properties of 22mnb5 hpf steel. Steel Res. Int. 2010, 81, 292–298. [Google Scholar] [CrossRef]
- Hosseini, S.M.K.; Zarei-Hanzaki, A.; Yue, S. The Effect of Intercritical Deformation on Microstructure Development in Thermomechanically-Processed Low-Silicon TRIP-Assisted Steels. Adv. Mater. Res. 2013, 856, 251–256. [Google Scholar] [CrossRef]
- Lawrynowicz, Z. Rationalisation of Austenite Transformation to Upper or Lower Bainite in Steels. Adv. Mater. Sci. 2014, 14, 14–23. [Google Scholar] [CrossRef][Green Version]
- Santofimia, M.J.; Nguyen-Minh, T.; Zhao, L.; Petrov, R.; Sabirov, I.; Sietsma, J. New low carbon Q&P steels containing film-like intercritical ferrite. Mater. Sci. Eng. A 2010, 527, 6429–6439. [Google Scholar] [CrossRef]
- Zaefferer, S.; Ohlert, J.; Bleck, W. A study of microstructure, transformation mechanisms and correlation between microstructure and mechanical properties of a low alloyed TRIP steel. Acta Mater. 2004, 52, 2765–2778. [Google Scholar] [CrossRef]
- Yang, J.; Liu, Q.; Sun, D.; Li, X. Microstructure and Transformation Characteristics of Acicular Ferrite in High Niobium-Bearing Microalloyed Steel. J. Iron Steel Res. Int. 2010, 17, 53–59. [Google Scholar] [CrossRef]
- Li, Z.D.; Yang, Z.G.; Zhang, C.; Liu, Z.Q. Influence of austenite deformation on ferrite growth in a Fe-C-Mn alloy. Mater. Sci. Eng. A 2010, 527, 4406–4411. [Google Scholar] [CrossRef]
- Hurley, P.J.; Muddle, B.C.; Hodgson, P.D. The production of ultrafine ferrite during hot torsion testing of a 0.11 wt pct C steel. Metall. Mater. Trans. A 2002, 33, 2985–2993. [Google Scholar] [CrossRef]
- De Knijf, D.; Petrov, R.; Föjer, C.; Kestens, L.A.I. Effect of fresh martensite on the stability of retained austenite in quenching and partitioning steel. Mater. Sci. Eng. A 2014, 615, 107–115. [Google Scholar] [CrossRef]
- Hsu, T.Y. Additivity hypothesis and effects of stress on phase transformations in steel. Curr. Opin. Solid State Mater. Sci. 2005, 9, 256–268. [Google Scholar] [CrossRef]
- Shi, Z.; Liu, K.; Wang, M.; Shi, J.; Dong, H.; Pu, J.; Chi, B.; Zhang, Y.; Jian, L. Effect of non-isothermal deformation of austenite on phase transformation and microstructure of 22SiMn2TiB steel. Mater. Sci. Eng. A 2012, 535, 290–296. [Google Scholar] [CrossRef]
- Sun, J.; Yu, H.; Wang, S.; Fan, Y. Study of microstructural evolution, microstructure-mechanical properties correlation and collaborative deformation-transformation behavior of quenching and partitioning (Q&P) steel. Mater. Sci. Eng. A. 2014, 596, 89–97. [Google Scholar] [CrossRef]
- Somani, M.C.; Porter, D.A.; Karjalainen, L.P.; Misra, D.K. Designing a Novel DQ&P Process through Physical Simulation Studies. Mater. Sci. Forum 2013, 762, 83–88. [Google Scholar] [CrossRef]
- Humphreys, F.J.; Hatherly, M. Hot Deformation and Dynamic Restoration. In Recrystallization and Related Annealing Phenomena; Elsevier: Oxford, UK, 2004; pp. 415–450. [Google Scholar]
- Siciliano, F. Recuperação e recristalização durante a deformação a quente. In Textura e Relações de Orientação; EPUSP: São Paulo, Brazil, 2001; pp. 93–108. [Google Scholar]
- Hidaka, K.; Takemoto, Y.; Senuma, T. Microstructural Evolution of Carbon Steels in Hot Stamping Processes. ISIJ Int. 2012, 52, 688–696. [Google Scholar] [CrossRef][Green Version]
- Rasouli, D.; Khameneh Asl, S.; Akbarzadeh, A.; Daneshi, G.H. Effect of cooling rate on the microstructure and mechanical properties of microalloyed forging steel. J. Mater. Process. Technol. 2008, 206, 92–98. [Google Scholar] [CrossRef]
- Santofimia, M.J.; Petrov, R.H.; Zhao, L.; Sietsma, J. Microstructural analysis of martensite constituents in quenching and partitioning steels. Mater. Charact. 2014, 92, 91–95. [Google Scholar] [CrossRef]
- Baltazar Hernandez, V.H.; Panda, S.K.; Kuntz, M.L.; Zhou, Y. Nanoindentation and microstructure analysis of resistance spot welded dual phase steel. Mater. Lett. 2010, 64, 207–210. [Google Scholar] [CrossRef]
- de Diego-Calderón, I.; De Knijf, D.; Monclús, M.A.; Molina-Aldareguia, J.M.; Sabirov, I.; Föjer, C.; Petrov, R.H. Global and local deformation behavior and mechanical properties of individual phases in a quenched and partitioned steel. Mater. Sci. Eng. A 2015, 630, 27–35. [Google Scholar] [CrossRef]
- Park, H.S.; Han, J.C.; Lim, N.S.; Park, C.G. Nano-scale observation on the transformation behavior and mechanical stability of individual retained austenite in CMnSiAl TRIP steels. Mater. Sci. Eng. A 2015, 627, 262–269. [Google Scholar] [CrossRef]
- Misra, R.D.K.; Venkatsurya, P.; Wu, K.M.; Karjalainen, L.P. Ultrahigh strength martensite–austenite dual-phase steels with ultrafine structure: The response to indentation experiments. Mater. Sci. Eng. A 2013, 560, 693–699. [Google Scholar] [CrossRef]
- Furnémont, Q.; Kempf, M.; Jacques, P.J.; Göken, M.; Delannay, F. On the measurement of the nanohardness of the constitutive phases of TRIP-assisted multiphase steels. Mater. Sci. Eng. A 2002, 328, 3–20. [Google Scholar] [CrossRef]
- Rios, P.R.; Padilha, A.F. Transformações de Fase; Artliber Editora Ltd.: São Paulo, Brazil, 2007. [Google Scholar]
- Gadelrab, K.R.; Li, G.; Chiesa, M.; Souier, T. Local characterization of austenite and ferrite phases in duplex stainless steel using MFM and nanoindentation. J. Mater. Res. 2012, 27, 1573–1579. [Google Scholar] [CrossRef]
- He, B.B.; Huang, M.X. Revealing the Intrinsic Nanohardness of Lath Martensite in Low Carbon Steel. Metall. Mater. Trans. A 2014, 46, 688–694. [Google Scholar] [CrossRef]
- Blondé, R.; Jimenez-Melero, E.; Huizenga, R.; Zhao, L.; Wright, J.; Bruck, E.; van der Zwaag, S.; van Dijk, N. High-resolution X-ray diffraction investigation on the evolution of the substructure of individual austenite grains in TRIP steels during tensile deformation. Mater. Sci. Eng. A 2014, 47, 965–973. [Google Scholar] [CrossRef]
- Bernier, N.; Bracke, L.; Malet, L.; Godet, S. Crystallographic Reconstruction Study of the Effects of Finish Rolling Temperature on the Variant Selection During Bainite Transformation in C-Mn High-Strength Steels. Metall. Mater. Trans. A 2014, 45, 5937–5955. [Google Scholar] [CrossRef]
- Tirumalasetty, G.K.; van Huis, M.; Kwakernaak, C.; Sietsma, J.; Sloof, W.G.; Zandbergen, H.W. Deformation-induced austenite grain rotation and transformation in TRIP-assisted steel. Acta Mater. 2012, 60, 1311–1321. [Google Scholar] [CrossRef]
- Bhadeshia, H.K.D.H. Stress and Strain Effects. In Bainite in Steels; IOM Communications: London, UK, 2001; pp. 201–224. [Google Scholar]
- Chaouch, D.; Guessasma, S.; Sadok, A. Finite Element simulation coupled to optimisation stochastic process to assess the effect of heat treatment on the mechanical properties of 42CrMo4 steel. Mater. Des. 2012, 34, 679–684. [Google Scholar] [CrossRef]
- Nayak, S.S.; Anumolu, R.; Misra, R.D.K.; Kim, K.H.; Lee, D.L. Microstructure–hardness relationship in quenched and partitioned medium-carbon and high-carbon steels containing silicon. Mater. Sci. Eng. A 2008, 498, 442–456. [Google Scholar] [CrossRef]
- Matlock, D.; Speer, J. Design Considerations for the Next Generation of Advanced High Strength Sheet Steels. In Proceedings of the 3rd International Conference on Structural Steels, Gyeongju, Korea, 22–24 August 2006; Lee, H.C., Ed.; The Korean Institute of Metals and Materials: Seoul, Korea, 2006; pp. 774–781. [Google Scholar]
- Davies, R.G. The deformation behavior of a vanadium-strengthened dual phase steel. Metall. Mater. Trans. A 1978, 9, 41–52. [Google Scholar] [CrossRef]
- Davies, R.G. Influence of martensite composition and content on the properties of dual phase steels. Metall. Trans. A 1978, 9, 671–679. [Google Scholar] [CrossRef]
- Ojima, M.; Inoue, J.; Nambu, S.; Xu, P.; Akita, K.; Suzuki, H.; Koseki, T. Stress partitioning behavior of multilayered steels during tensile deformation measured by in situ neutron diffraction. Scr. Mater. 2012, 66, 139–142. [Google Scholar] [CrossRef]
- Mileiko, S. The Tensile Strength and Ductility of Continuous Fibre Composites. J. Mater. Sci. 1969, 4, 974–977. [Google Scholar] [CrossRef]
- Matlock, D.K.; Speer, J.G.; De Moor, E.; Gibbs, P.J. Recent developments in Advanced High Strength Sheet Steels for automotive applications: An overview. Jestech 2012, 15, 1–12. [Google Scholar]
- Srikanth, S.; Saravanan, P.; Kumar, V.; Saravanan, D.; Sivakumar, L.; Sisodia, S.; Ravi, K.; Jha, B. Property Enhancement in MetasTable 301LN Austenitic Stainless Steel through Strain-Induced Martensitic Transformation and its Reversion (SIMTR) for Metro Coach Manufacture. Int. J. Metall. Eng. 2013, 2, 203–213. [Google Scholar] [CrossRef]
- Jiao, Z.; Liu, C.-T. Research and development of advanced nano-precipitate strengthened ultra-high strength steels. Mater. China 2011, 30, 1–7. [Google Scholar]
- International Energy Agency. Key World Energy Statistics; International Energy Agency: Paris, France, 2016. [Google Scholar]


Publisher’s Note: MDPI stays neutral with regard to jurisdictional claims in published maps and institutional affiliations. |
© 2022 by the authors. Licensee MDPI, Basel, Switzerland. This article is an open access article distributed under the terms and conditions of the Creative Commons Attribution (CC BY) license (https://creativecommons.org/licenses/by/4.0/).