Article

Microstructural, Chemical, and Crystallographic Investigations of Dynamic Strain-Induced Ferrite in a Microalloyed QT Steel

1
Department of Materials Science, Montanuniversität Leoben, Franz Josef-Straße 18, 8700 Leoben, Austria
2
Voestalpine Wire Rod Austria GmbH, Drahtstraße 1, 8792 St. Peter-Freienstein, Austria
3
Voestalpine Stahl Donawitz GmbH, Kerpelystraße 199, 8700 Leoben, Austria
4
Voestalpine Forschungsservicegesellschaft Donawitz GmbH, Kerpelystraße 199, 8700 Leoben, Austria
*
Author to whom correspondence should be addressed.
Metals 2022, 12(2), 313; https://doi.org/10.3390/met12020313
Submission received: 10 January 2022 / Revised: 2 February 2022 / Accepted: 8 February 2022 / Published: 10 February 2022

Abstract

:
Dynamic strain-induced transformation (DSIT) enables the formation of fine-grained ferritic microstructures, which are well suited for cold forming processes in the as-rolled condition. In this work, the formation mechanism, chemical composition, and crystallographic orientation of DSIT ferrite were investigated in a micro-alloyed steel and compared to pre-eutectoid ferrite. High-resolution techniques, such as scanning transmission electron microscopy and atom probe tomography (APT), were used for the investigations. To generate DSIT ferrite and pre-eutectoid ferrite, different experimental routes were applied using a compression deformation dilatometer. The results show a large number of NbC precipitates within DSIT ferrite, and show that the formation of DSIT ferrite is accompanied with C diffusion and the formation of retained austenite. APT measurements revealed that the C- and Mn concentration in DSIT ferrite is higher compared to pre-eutectoid ferrite. The crystallographic orientation of DSIT ferrite was examined using electron backscatter diffraction. The crystallographic orientation of DSIT ferrite after the deformation route revealed that the <111> plane normals are parallel to the compression direction with the <110> directions pointing towards the radial direction of the compressed sample. The results suggest that the formation of DSIT ferrite is a displacive mechanism, accompanied by C diffusion.

1. Introduction

Quenched and tempered (QT) steels are characterized by a good toughness with a high hardness and strength. The final properties are achieved after quenching from the austenitic phase field and a subsequent tempering process. In order to ensure good cold formability, the microstructure of the semi-finished parts must meet certain properties before quenching and tempering. In most cases, the optimal cold forming properties of semi-finished QT steels are achieved after a soft annealing process prior to the forming process. In order to avoid this cost-intensive annealing step, micro-alloyed and thermomechanical controlled (TMC) processed QT steels have emerged as an alternative. The underlying idea is based on the good formability of fine ferritic microstructures, which can be adjusted using TMC processes and the addition of microalloying elements such as Nb and Ti [1]. A specific form of TMC processing is the formation of ferrite by dynamic strain-induced transformation (DSIT) [2,3,4]. This ferrite formation takes place dynamically during the deformation between Ae3 (equilibrium temperature of the austenite to ferrite transformation) and Ar3 (transformation temperature from austenite to ferrite, depending on the cooling rate) and differs from the dynamic transformation (DT) above Ae3 that Priestner et al. [5] observed already in the early 1980s. Yada et al. [6] were among the first to provide direct evidence of the dynamic formation of ferrite from an austenitic microstructure using in-situ X-ray diffraction. For the onset of the DSIT ferrite formation, a critical strain (εC,DSIT) is required, which can be determined either by metallographic methods after quenching the deformed microstructure or indirectly by using the double-differentiation method developed by Poliak and Jonas [7,8]. The latter method was originally developed to determine the critical strain for the onset of dynamic recrystallization (DRX). However, it has shown that the underlying principle is the same for DRX and DSIT, as in both cases the softening affects the work hardening behavior of the deformed materials [9,10]. Thanks to the formation process of DSIT ferrite, it is possible to produce fine equiaxed ferrite grains with a grain size in the range of a few µm. Beladi et al. [11] have shown that the formation of DSIT ferrite initially occurs along the prior austenite grain boundaries (PAGB), followed by intragranular nucleation. It has also been reported that the presence of deformation bands [12] and fine NbC precipitates [13] enhances the amount of DSIT ferrite. During the formation process of DSIT ferrite, dynamic recrystallization and thus further grain refinement takes place. A misorientation of the low-angle grain boundaries that leads to a gradual transformation to high-angle grain boundaries is responsible for this, and therefore to a decreasing ferrite grain size [4,14,15].
Although the formation of DSIT ferrite has been well studied in the past, there are still open points regarding its mechanism of formation. Studies suggest that the formation of DSIT ferrite is more of a diffusional transformation process than a displacive mechanism [2,11]. Previous simulations by Zheng et al. [16] and experimental results by Hao et al. [17] show that the formation of DSIT ferrite is accompanied by C diffusion. As reported by Hao et al. [17], dislocations and deformation bands can serve as rapid diffusion channels. Nevertheless, C can only insufficiently diffuse due to the short time, which can lead to C supersaturated ferrite, or the formation of ultrafine cementite particles within ferrite. Hurley et al. [18] were able to show a Kurdjumov–Sachs orientation between the prior austenite grain and DSIT ferrite. This, in turn, would indicate a displacive mechanism.
In this study, the formation mechanism, chemical composition, and crystallographic orientation of DSIT ferrite were investigated and compared to pre-eutectoid formed ferrite in a QT steel. Therefore, various compression tests were performed with a deformation dilatometer in order to produce DSIT ferrite on the one hand and pre-eutectoid ferrite on the other. High resolution techniques, such as scanning transmission electron microscopy (STEM) in a scanning electron microscope (SEM), atom probe tomography (APT), and electron backscatter diffraction (EBSD) are used to provide insight into the microstructure, the chemical composition, and the crystallographic orientation of the ferritic areas.

2. Materials and Methods

2.1. Investigated Material

The chemical composition of the investigated steel is given in Table 1.
The C content was selected in such a way that a sufficiently high strength for the finished components can be guaranteed after quenching and tempering. Ti was added to inhibit the grain growth during annealing. On the one hand, Nb was added to inhibit recrystallization through the formation of strain-induced NbC precipitates during TMC processing and, on the other hand, to support the formation of DSIT ferrite through NbC precipitates. The addition of small amounts of B improves the hardenability of the steel. The steel was produced by vacuum induction melting. After reheating to 1100 °C, the ingot was rolled to a sheet thickness of 15 mm with a finish rolling temperature of 900 °C.

2.2. Dilatometric Experiments

The size of the dilatometer samples was 5 mm in diameter and 10 mm in length, with the longitudinal direction of the dilatometer sample oriented in the rolling direction of the sheet. To control the temperature during the processing a type S thermocouple was spot welded onto the surface of the sample.

2.2.1. Determination of Ae1, Ae3, and Ar3

The measurements of the transformation temperatures Ae1, Ae3, and Ar3 were done by using a quenching dilatometer (DIL 805, TA Instruments, Hüllhorst, Germany). To determine Ae1 and Ae3, measurements according to the ASTM A 1033-04 standard were carried out. To measure Ar3, the samples were heated to an annealing temperature (Ta) 50 °C above Ae3 with a heating rate of 10 °Cs−1. After a holding step (ta) of 300 s the samples were cooled down to room temperature with cooling rates (λ) of −0.1, −0.3, −1.0, and −3.0 °Cs−1.

2.2.2. Compression Experiments

In order to create DSIT ferrite and pre-eutectoid ferrite, three different compression routes were carried out with a deformation dilatometer (DIL 805 A/D/T, TA Instruments, Hüllhorst, Germany). A schematic drawing of the time−temperature−deformation schedule is shown in Figure 1.
In all routes, the samples were initially heated with a heating rate of 10 °Cs−1 to a Ta of 1200 °C and were held for 300 s. An equilibrium solubility temperature of 1165 °C was calculated for Nb(C,N) using the equation from Irivine at al. [19]. Therefore, the Ta was chosen in a way that Nb precipitates inside the matrix dissolved within the 300 s annealing time. After that, two compression steps were carried out with φ = 0.1 and a strain rate of 10 s−1 at deformation temperatures (Tdef) of 1050 °C and 950 °C, respectively. The samples were cooled to Tdef with a cooling rate of −10 °Cs−1 and held at a constant temperature for 30 s before compression. In route I, the sample was cooled to Tdef = 750 °C with a cooling rate of −10 °Cs−1 and held for 30 s. To clarify whether the ferrite formation was due to DSIT or whether the formation was pre-eutectoid, the sample was directly gas quenched. In route II, after the holding time of 30 s the sample was compressed with φ = 0.4 at a strain rate of 10 s−1. The sample was then also gas quenched to room temperature with a cooling rate of −100 °Cs−1. In order to investigate the properties of pre-eutectoid ferrite in the equilibrium state, route III was chosen. After the final compression step in route III, the sample was cooled to Thold = 730 °C with a cooling rate of −10 °Cs−1 and was held constant for thold = 300 s. Thold was chosen in a way that the temperature was still in the austenite/ferrite two-phase region. This sample was then also directly gas quenched to room temperature with a cooling rate of −100 °Cs−1. Silicon nitride tools were used for the uniaxial compression of the material.

2.3. Microstructural and Crystallographic Characterization

The microstructure in the deformed and quenched condition was examined with light optical microscopy (LOM) (Axio Imager M1m, Zeiss, Oberkochen, Germany) and SEM. Therefore, the samples were ground with SiC paper, polished with a 1 µm diamond suspension, and etched with a 3% nital etchant. In addition, high resolution images of DSIT ferrite were made using STEM. The thin-foil STEM specimens were prepared by polishing with SiC paper, subsequently followed by a thinning step in a double-jet electropolishing device (Tenupol 5, Struers, Willich, Germany).
The crystallographic orientation of DSIT ferrite after route II was determined using EBSD. Therefore, the polished samples were only lightly etched with a 3% nital etchant and then polished for about 1 min using an OP-U suspension. The data evaluation was carried out with the OIM Analysis 8 software from EDAX.
In order to investigate the chemical composition of ferrite, atom probe tomography (APT) measurements were performed. For this reason, APT tips were site-specific produced from the ferritic areas with a focused ion beam (FIB) microscope [20,21]. The APT measurements were carried out with a LEAP 3000X HR (Cameca, Gennevilliers Cedex, France) in the laser mode, with a pulse frequency of 250 kHz, a base temperature of 40 K, and a laser energy of 60 pJ. The data reconstruction was done with IVAS 3.6.14 software from Cameca. The SEM, STEM, EBSD, and FIB methods were performed using a Versa 3D Dual Beam device (FEI, Hillsboro, OR, USA).

3. Results

3.1. Determination of Ae1, Ae3 and Ar3

For Ae1 and Ae3, temperatures of 722 °C and 809 °C were determined, respectively. The results of the measurements for Ar3 are shown in Table 2. With an increasing λ from −0.1 °Cs−1 to −3.0 °Cs−1, the Ar3 decreased from 751 °C to 690 °C.

3.2. Microstructural and Chemical Characterization after the Deformation Experiments

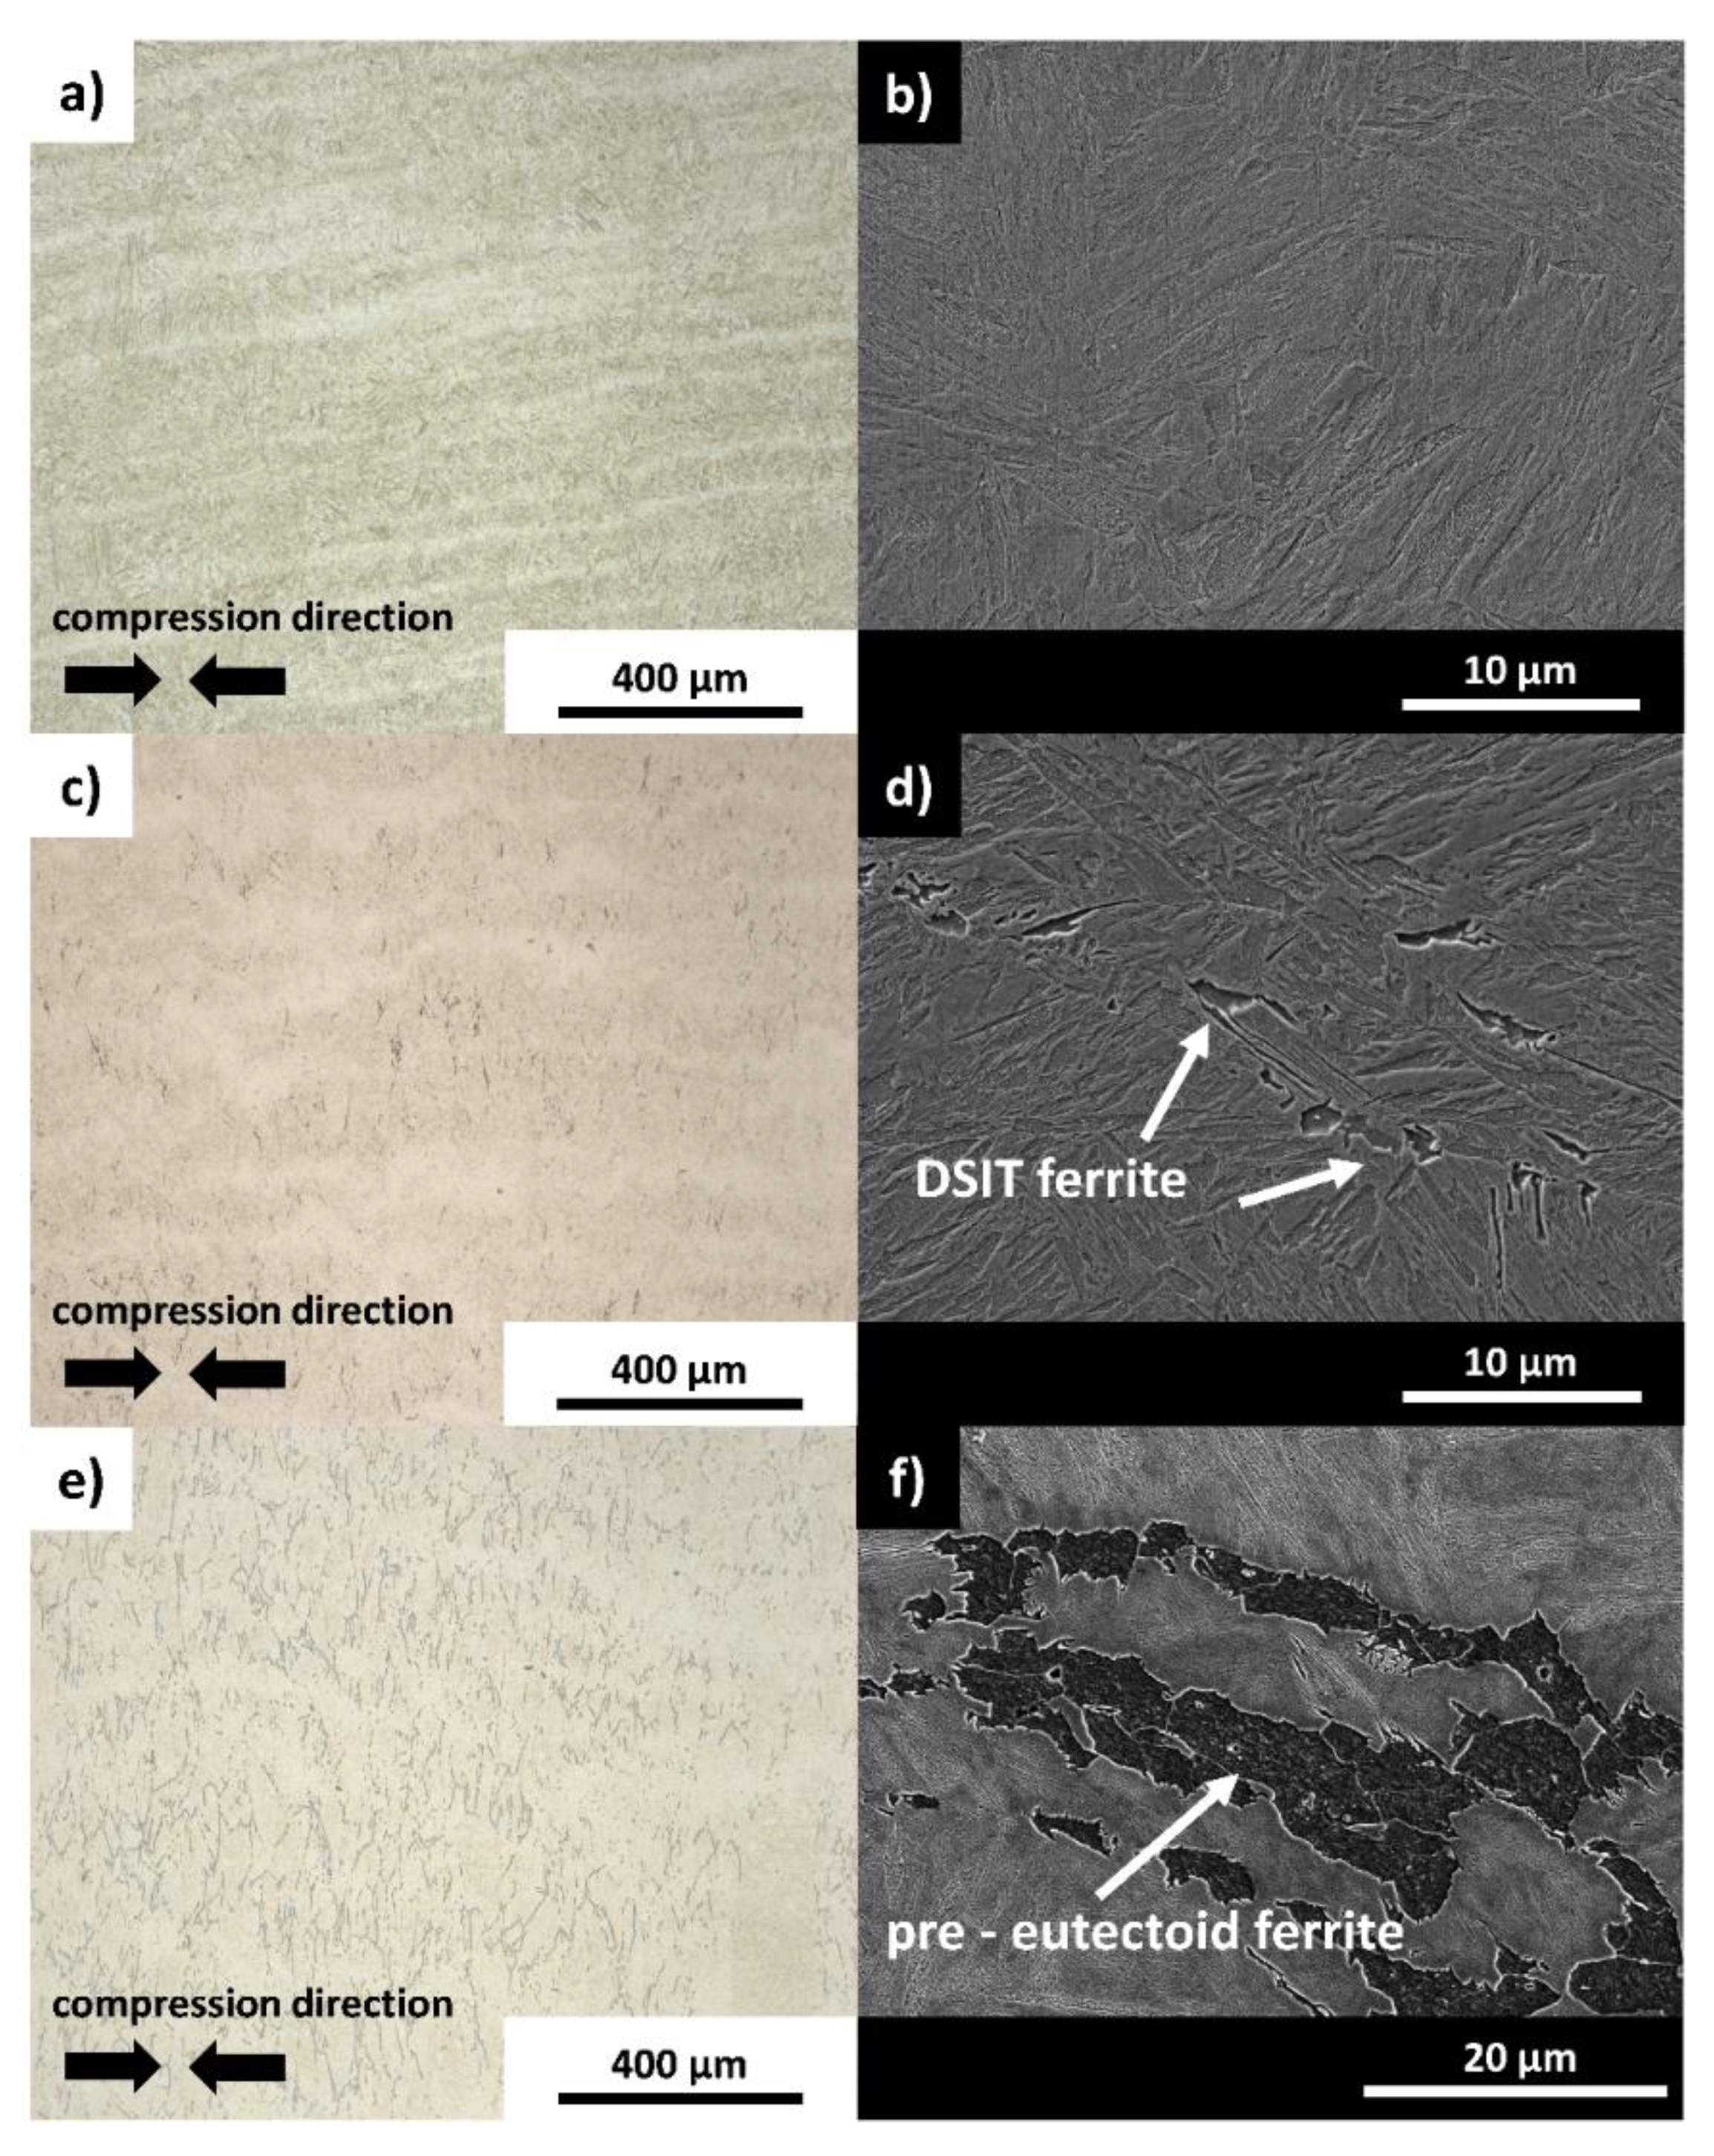
Figure 2 shows LOM and SEM images of the quenched samples after the dilatometer routes I–III in the longitudinal section. Figure 2a,b depicts the microstructure after route I and shows a purely martensitic microstructure. The microstructure after route II is presented in Figure 2c,d. A martensitic matrix and approximately 5 µm small and uniform ferrite grains can be seen in both images. As a purely martensitic microstructure was observed after route I, this was used as indirect evidence that ferrite formed during the final deformation step of route II, and therefore is DSIT ferrite. A detailed LOM image after route II is presented in Figure 3. Triple points are highlighted with arrows to show the formation of DSIT ferrite along PAGB. In route III, the sample was annealed at a Thold of 730 °C for 300 s. This temperature was just above Ae1. Therefore, it can be said that the ferrite shown in Figure 2e,f is pre-eutectoid ferrite, which formed primarily along the PAGB. Furthermore, a comparison of Figure 2c,e shows that the ferrite content in the microstructure has increased between route II and route III.
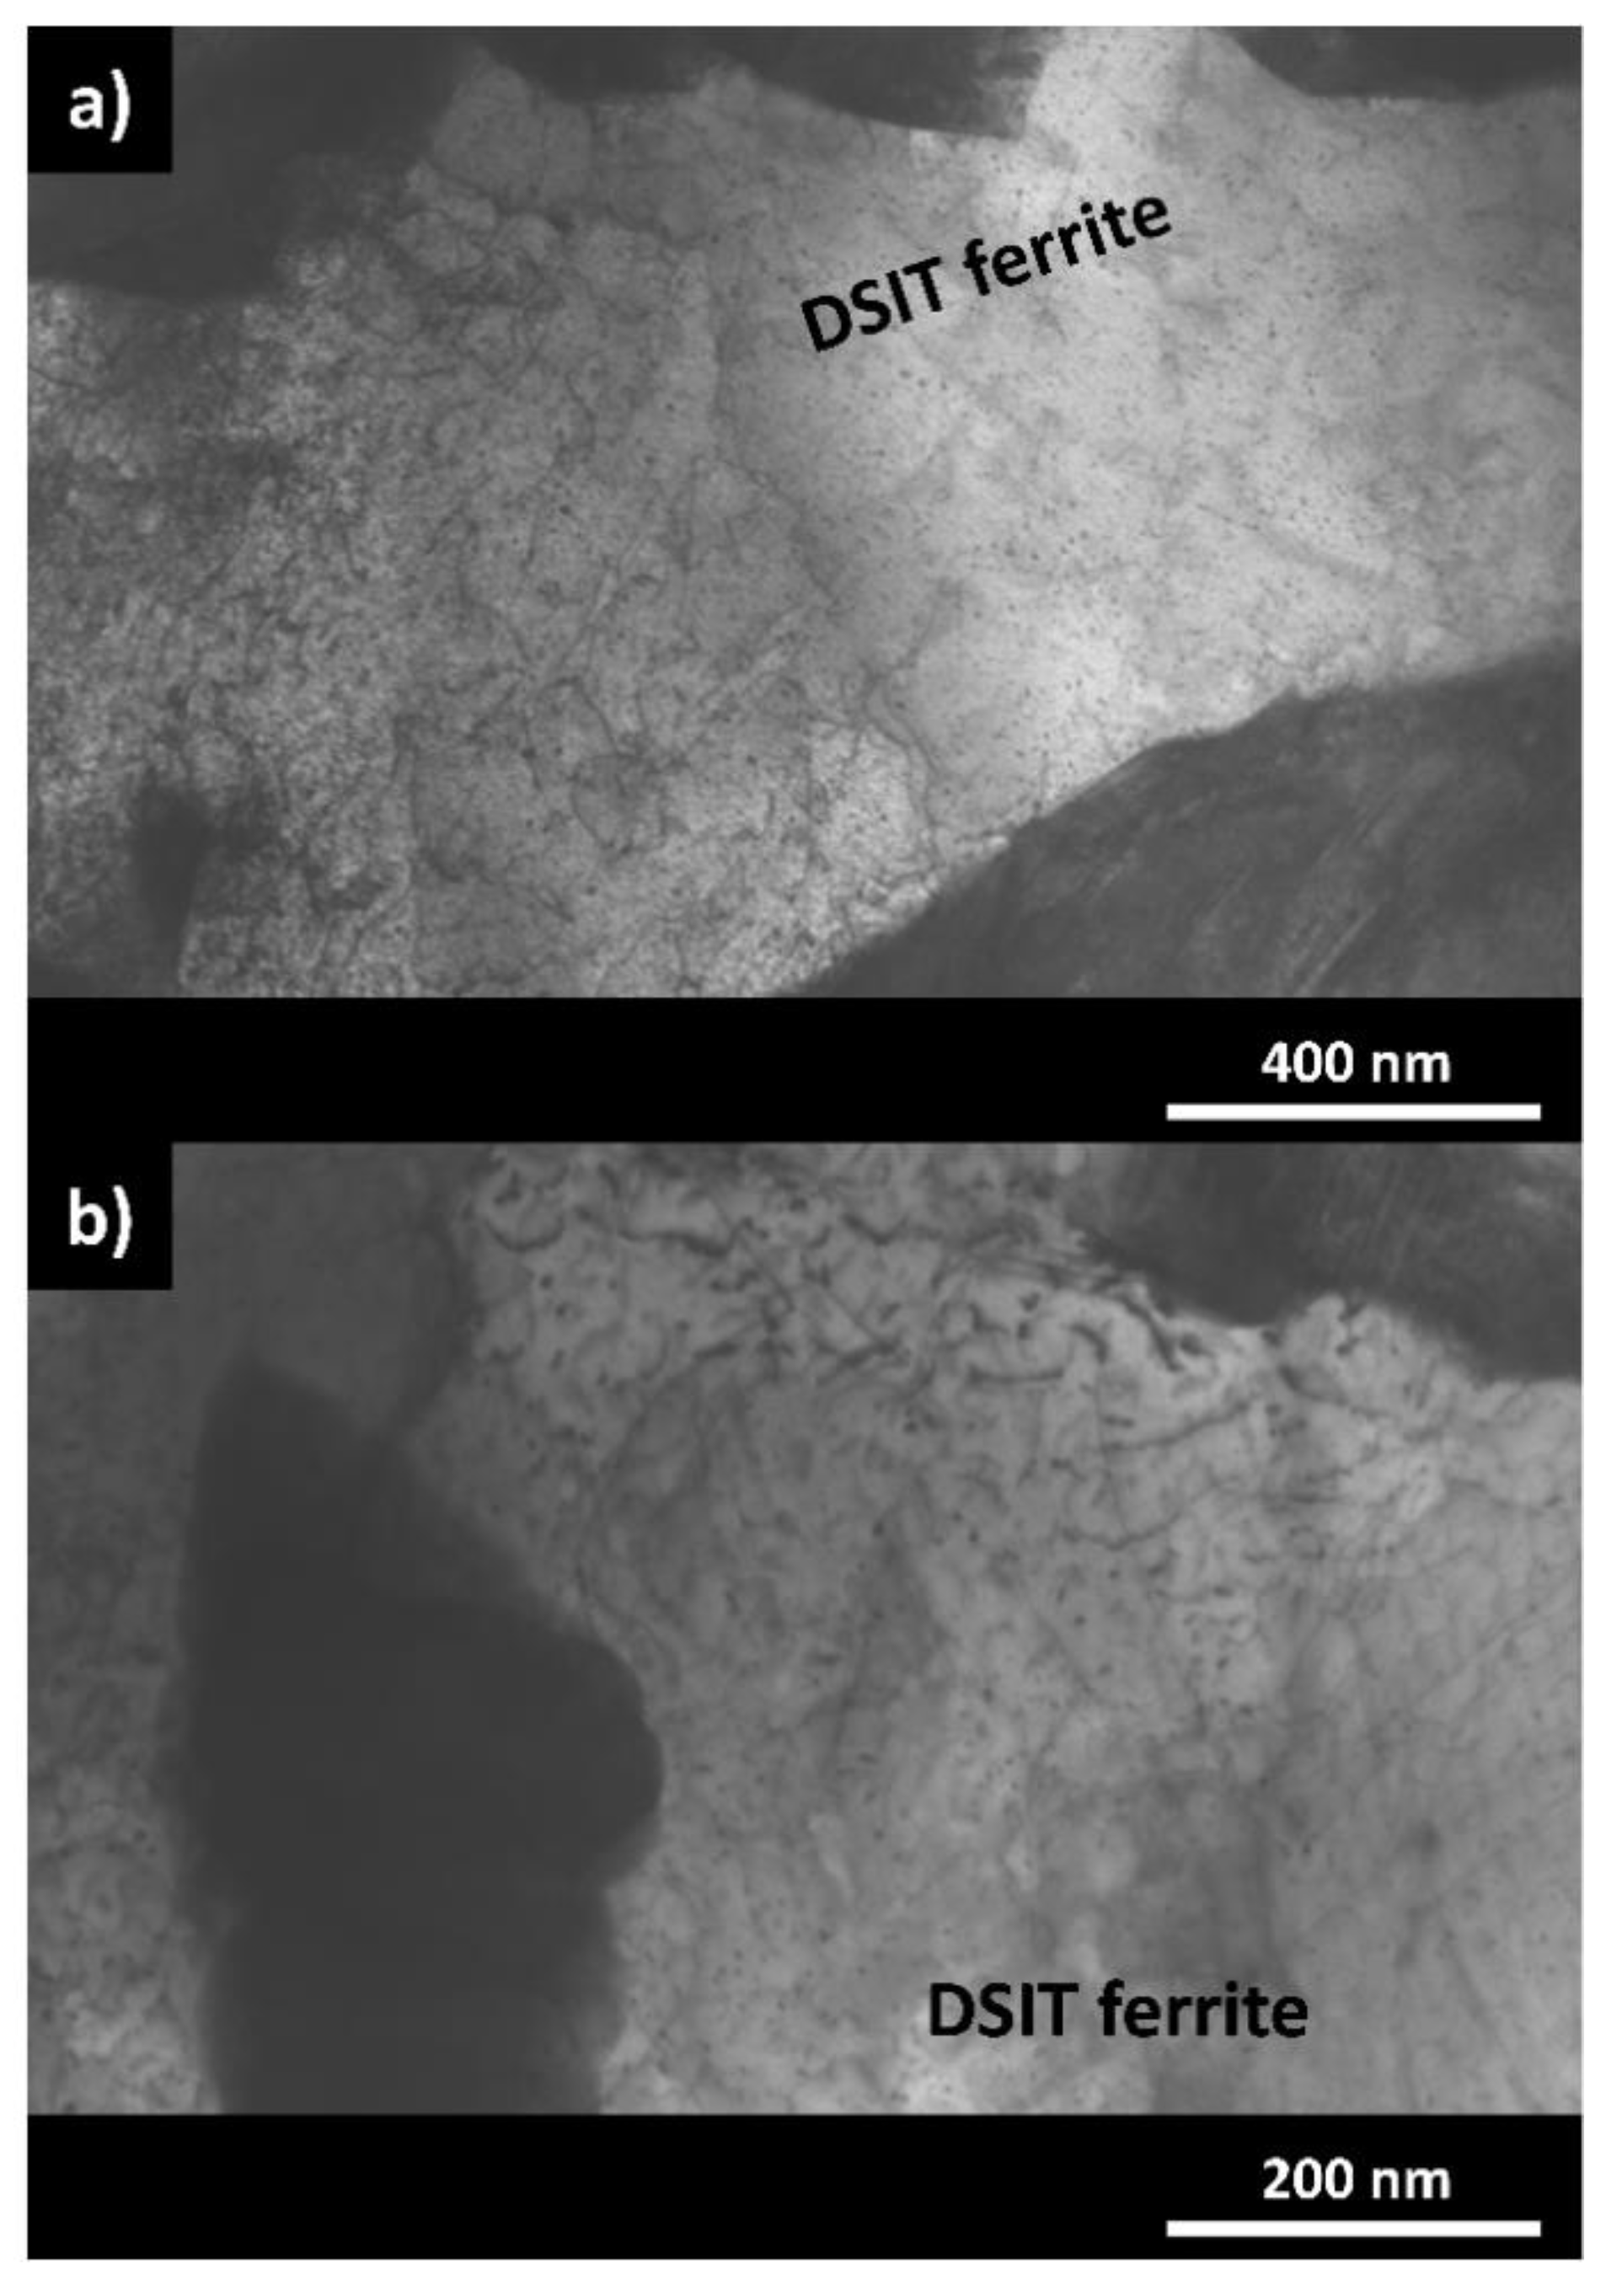
Figure 4a,b shows STEM images with different magnifications of DSIT ferrite after route II. Both images show few dislocations within the ferrite, but a large amount of small precipitates. For further characterization of the precipitates and the chemical composition of DSIT ferrite after route II, APT measurements were carried out.
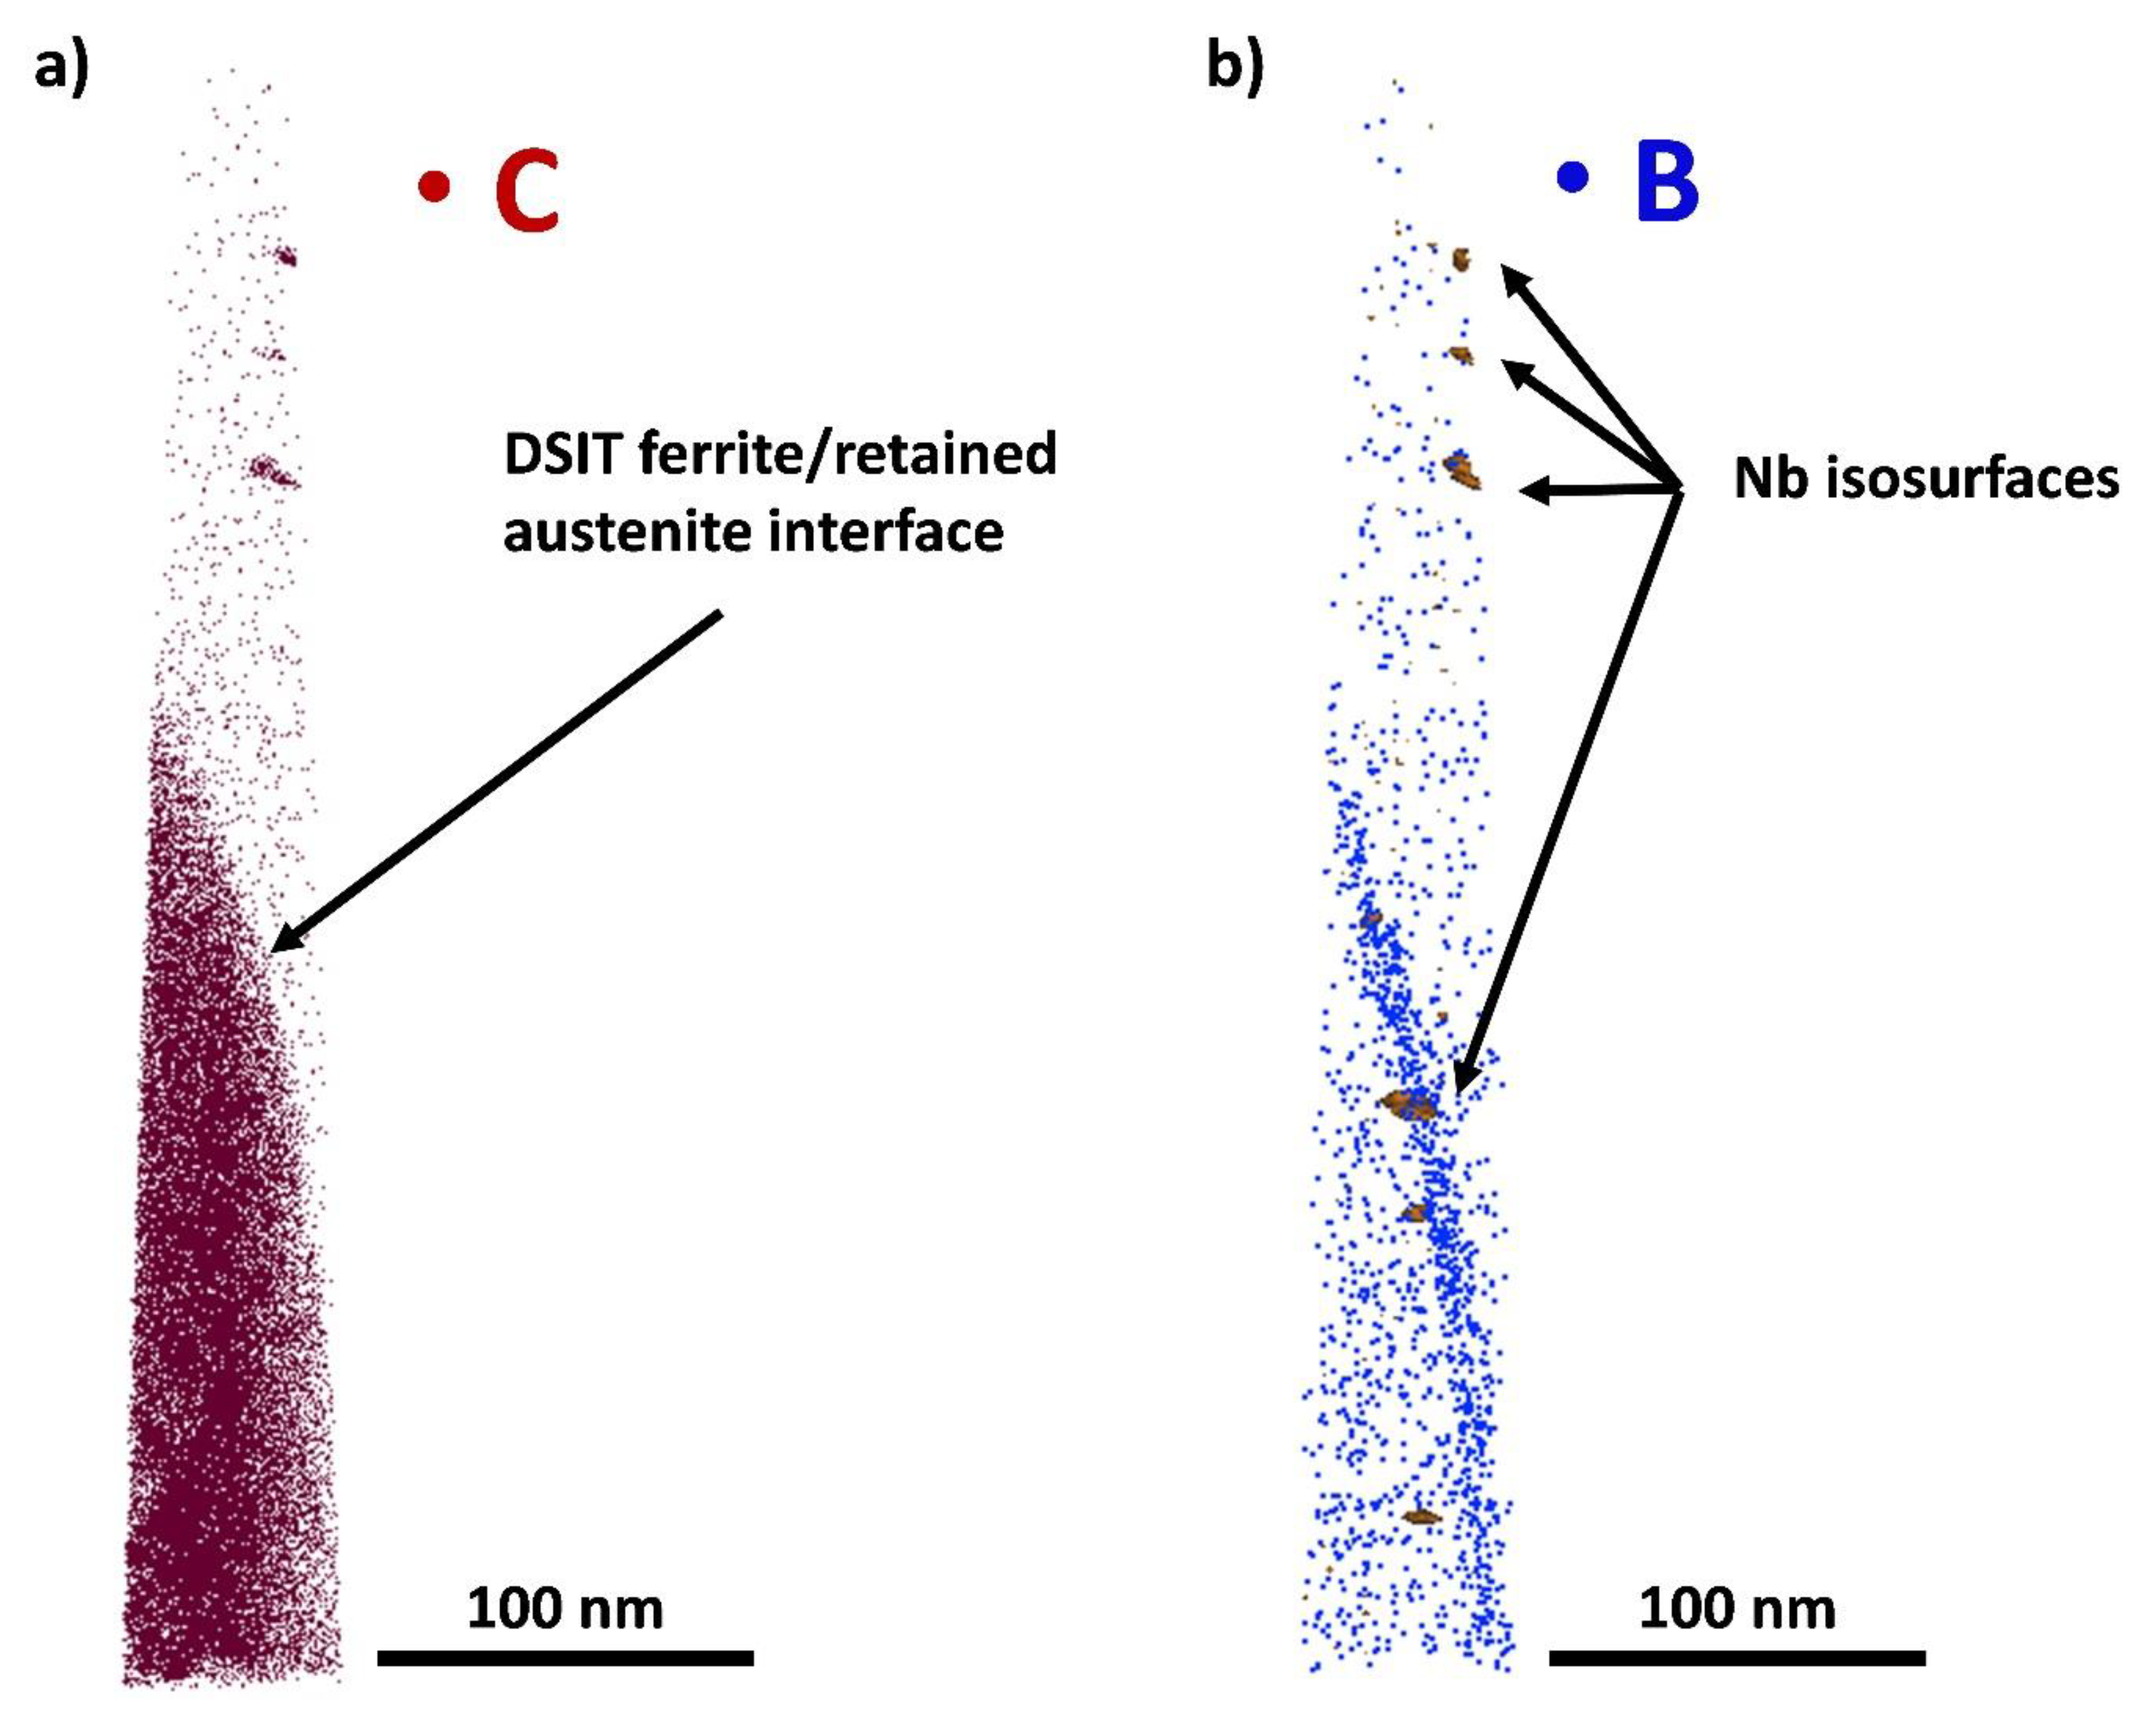
Figure 5 shows 3D reconstructions of an APT measurement after route II. The APT tips were produced by a site-specific tip preparation of the DSIT ferrite along the PAGB. In the upper part of the tip in Figure 5a, DSIT ferrite can be seen through the low C concentration, whereas in the lower half, a region with a higher C concentration was measured. Figure 5a,b shows the clustering of Nb and C both in DSIT ferrite and at the interface with the region with the higher C concentration. Figure 5b shows the distribution of B atoms and shows that B segregates in particular at the interface between the two regions.
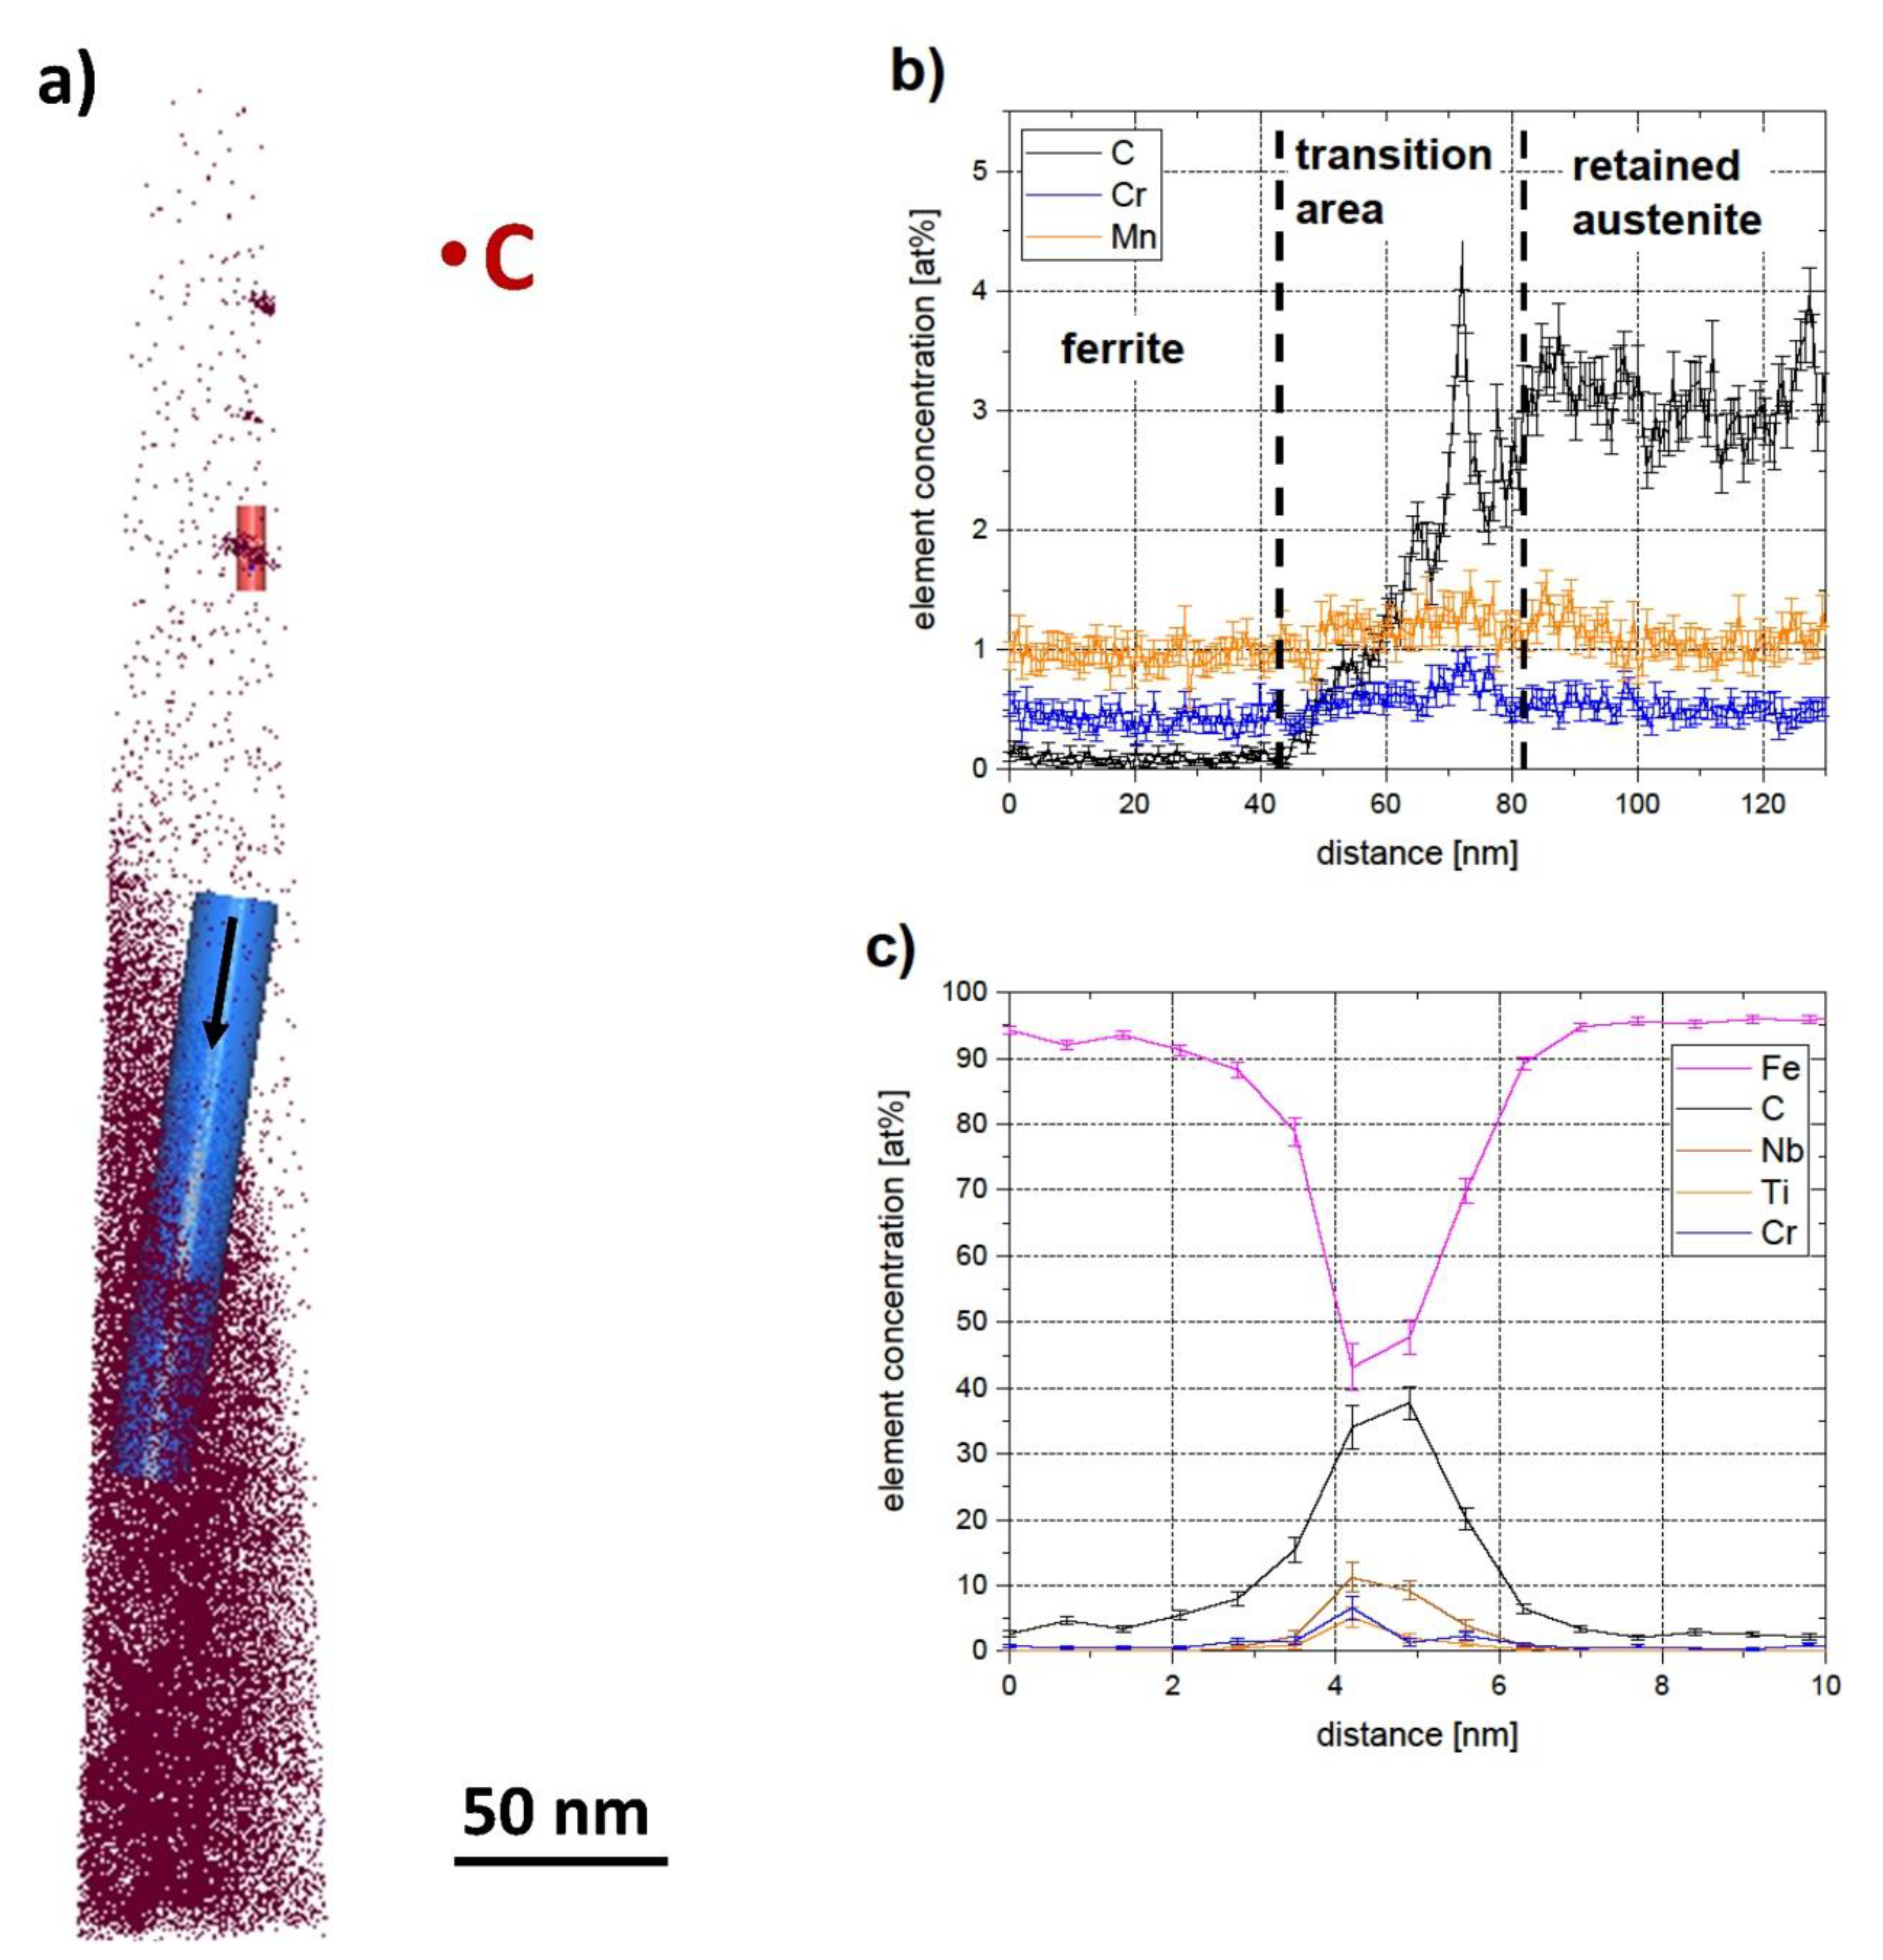
To investigate the chemical composition of DSIT ferrite and its neighboring area, a chemical depth profile was created along the arrow in the blue cylinder in Figure 6a. The results are shown in Figure 6b, and show that there is an increase of the C content from 0.1 at% inside the DSIT ferrite up to 3.5 at% outside of it. The high C concentration of 3.5 at% compared to the nominal concentration of 1.45 at% indicates that the phase in the lower region of the tip is retained austenite [22].
The Cr and Mn concentrations remain constant across the interface around 0.5 at% and 1.0 at%, respectively. Figure 6c shows the chemical depth profile of the red cylinder in Figure 6a. This indicates that this cluster mainly consists next to C and Fe of around 10 at% Nb and 5 at% Cr and Ti.
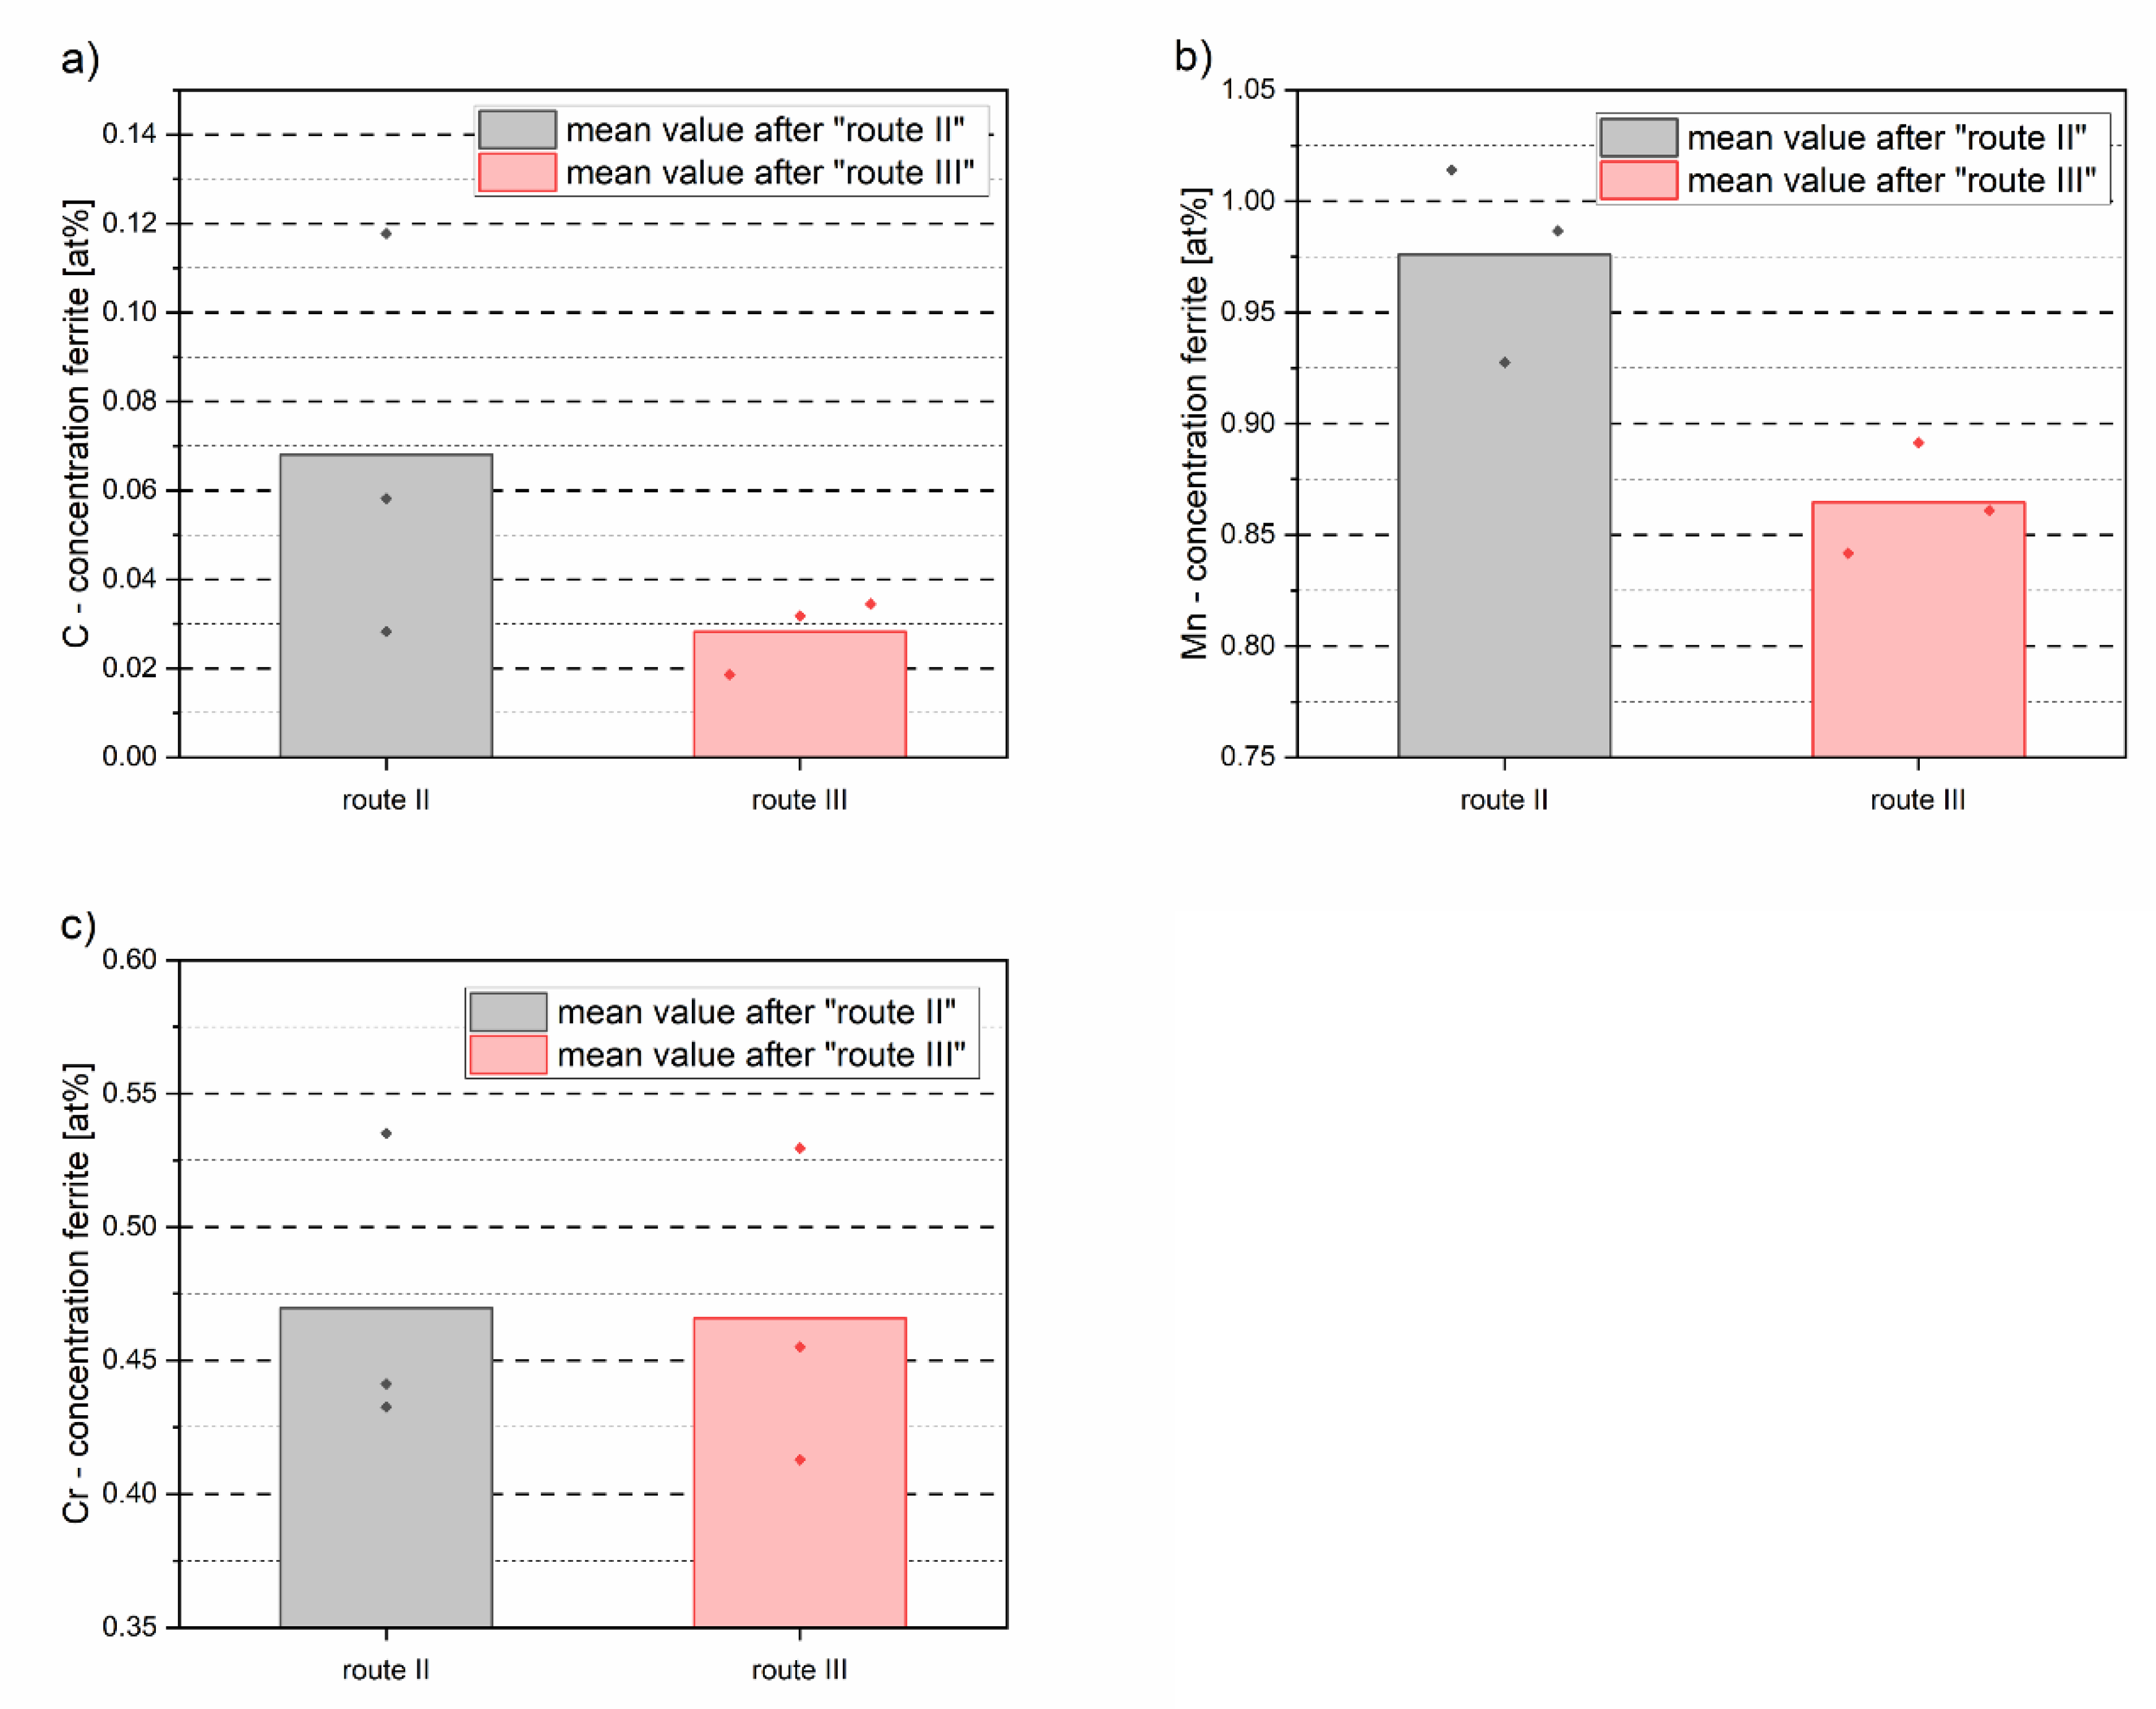
In order to investigate how the chemical composition of pre-eutectoid ferrite in the equilibrium state differs from the initial composition immediately after the formation of DSIT ferrite, further APT measurements were carried out after route III. Therefore, after route II as well as after route III, three APT tips including DSIT ferrite and pre-eutectoid ferrite, separately, were prepared by using a site-specific FIB-based preparation method. The results of the chemical composition of ferrite after route II and route III are depicted in Figure 7. Figure 7a,b shows that both the C and Mn concentration in ferrite are lower after route III than after route II. For route II, the mean C and Mn concentration is 0.068 at% and 0.980 at%, respectively, whereas the mean C and Mn concentration after route III is decreased to 0.028 at% and 0.864 at%, respectively. No significant differences could be measured for the Cr concentration in the ferrite between route II and route III. In this case, the large scatter of the measured values has to be taken into account.

3.3. Crystallographic Characterization

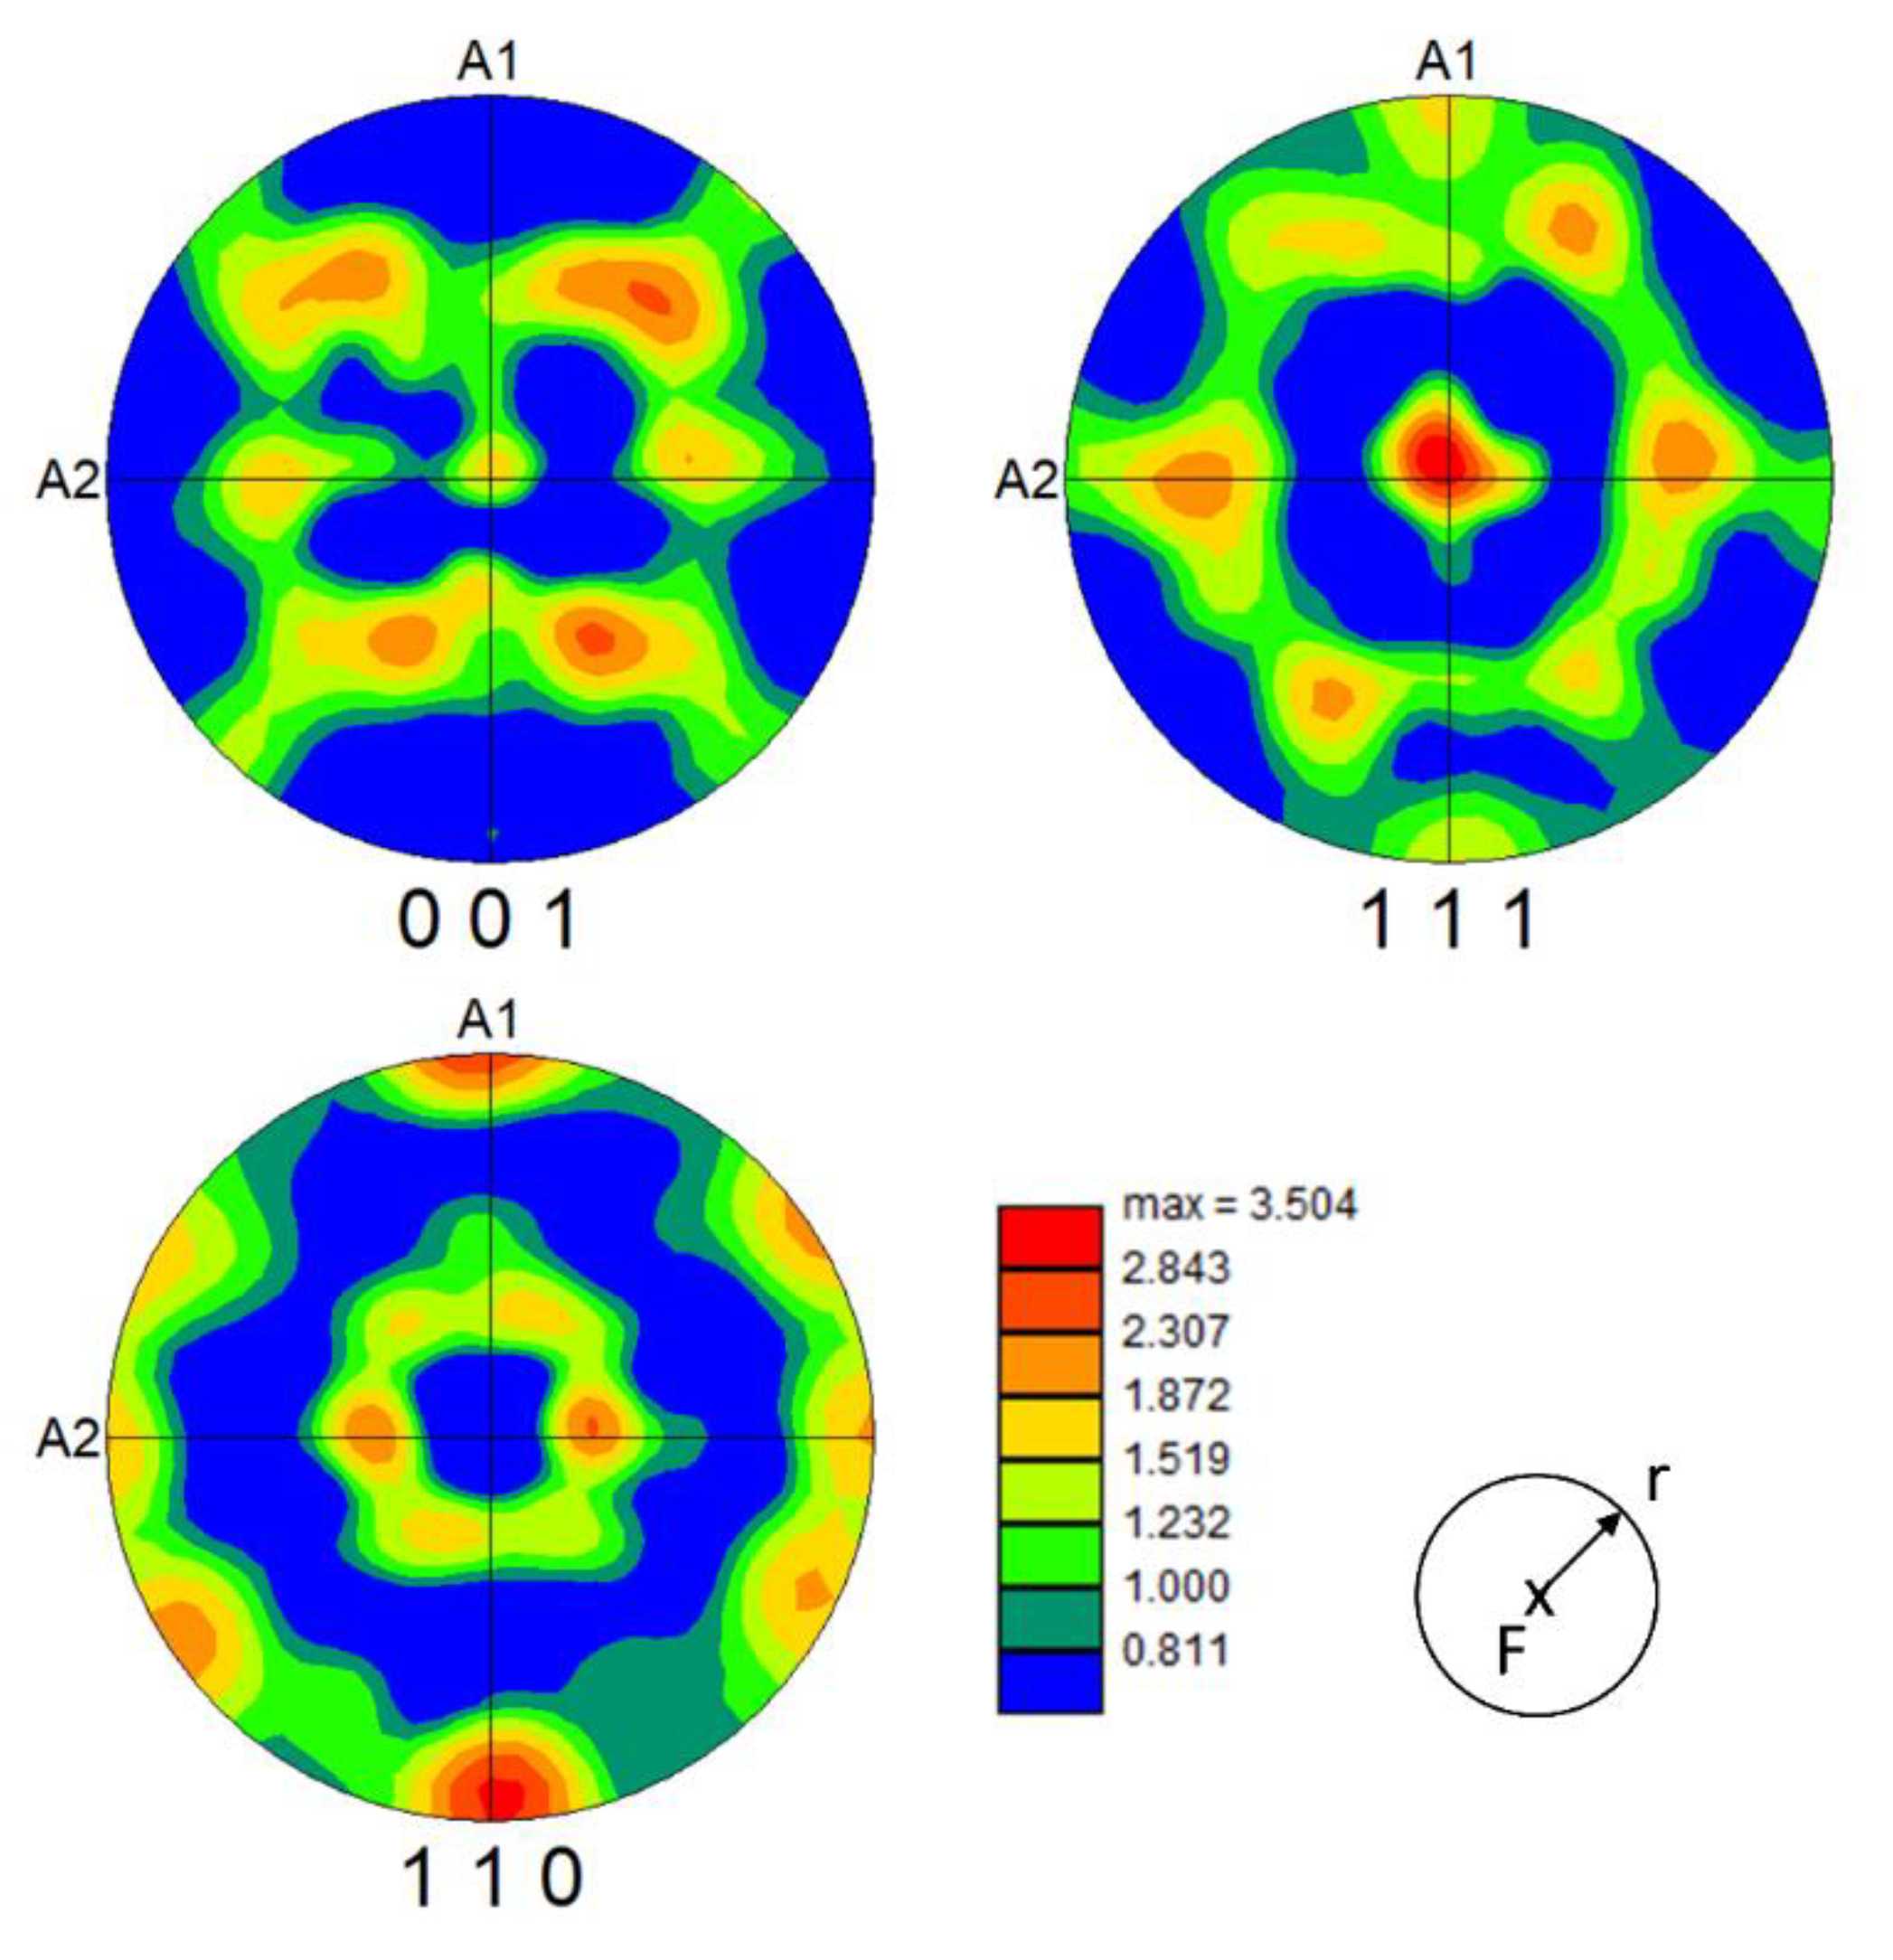
An EBSD measurement was performed to determine the crystallographic orientation of DSIT ferrite after route II. Therefore, the longitudinal section of a compressed sample after route II was examined. Figure 8a shows the image quality (IQ) map after the EBSD measurement and the associated inverse pole figure (IPF) map in Figure 8b. From Figure 8a, it can be seen that DSIT ferrite can be distinguished from the martensitic matrix by a lower IQ. This is due to the different etching attacks of the phases during sample preparation. In order to separate the data corresponding to DSIT ferrite from the martensitic matrix, all data points above an IQ threshold were filtered out. The result can be seen for the IQ map in Figure 8c. In order to investigate the crystallographic orientation of DSIT ferrite after route II in the direction of the compression, the data were rotated in the direction of the compression force. The results are shown in Figure 9 and show that a (111)[-110] and (111)[1-10] texture are present. This means that most of the <111> plane normals are parallel to the compression direction, with the <110> directions pointing towards the radial direction of the compressed sample.

4. Discussion

The aim of this study was to investigate the formation mechanism, the chemical composition, and the crystallographic orientation of DSIT ferrite and to compare it with the properties of pre-eutectoid ferrite. For this reason, compression tests were performed with a deformation dilatometer to produce DSIT ferrite on the one hand, and pre-eutectoid ferrite on the other. Three different compression routes were chosen for this (Figure 1). All three routes had in common that the Ta and the first two compression steps at temperatures of 1050 °C and 950 °C were identical. The aim of the first two compression steps was to introduce deformation into the sample to promote the precipitation of NbC precipitates. In order to create the basic requirement for the formation of DSIT ferrite, the final experiment temperature was chosen in a way that it was between Ae3 (809 °C) and Ar3 (690 °C for λ = −3.0 °Cs−1). Therefore, both in route I and route II the samples were cooled to a final temperature of 750 °C, with the difference being that in route I the sample was quenched to room temperature immediately after keeping the temperature constant for 30 s. The LOM and SEM images in Figure 2a,b show that no ferrite formed after route I and that the matrix consists exclusively of martensite. Figure 2c,d shows ferritic areas inside a martensitic matrix after route II. In the present work, this serves as indirect evidence that DSIT ferrite has formed during the last compression step of route II. Sun et al. [23] followed a similar approach when they were able to preserve DSIT ferrite by quenching it directly after the final deformation step. From Figure 3 and Figure 8a,c, it can be seen in more detail that DSIT ferrite, which formed during the last compression step of route II, has grown along PAGB. Similar results were reported in the past by Beladi et al. [11] and Bae et al. [12]. To further characterize pre-eutectoid ferrite, route III was performed. For this reason, the temperature was cooled down to Thold = 730 °C and was kept constant for 300 s directly after the last compression. Thold was chosen in a way that it was in the austenite/ferrite two phase region between Ae1 and Ae3. In Figure 2e, pre-eutectoid ferrite is depicted along the PAGB. Therefore, our results indicate that DSIT ferrite, shown in Figure 2c,d and Figure 3, served as a nucleation site for the further formation of pre-eutectoid ferrite, shown in Figure 2e,f.
The STEM images in Figure 4 reveal that DSIT ferrite after route II has a large number of fine precipitates around 5 nm. However, the results of this work do not allow any statement to be made regarding whether the precipitates were already present in the steel before the formation of DSIT ferrite, or whether they were precipitated during the formation of DSIT ferrite. Further investigations would have to be carried out in this regard. According to Hong et al. [13], NbC could act as a DSIT ferrite nucleation site. The APT measurements in this study also indicate this mechanism, as fine NbC precipitates (around 5 nm) were often detected in the area of the retained austenite/DSIT ferrite interface and DSIT ferrite itself, which can be seen in Figure 5b. A detailed analysis of the NbC precipitates revealed that they also contain small amounts of Ti and Cr. Figure 5b shows B segregation at the interface between DSIT ferrite and retained austenite in the 3D reconstruction. As B is known to segregate at PAGB, therefore delaying the austenite to ferrite phase transformation during cooling [24], our results suggest that the interface between DSIT ferrite and retained austenite in Figure 5b is a PAGB.
Previous research from Zheng et al. [16] and Hao et al. [17] indicated that the formation of DSIT ferrite is associated with C diffusion, whereas due to the short diffusion time, a ferrite oversaturated with C can remain. Our results confirm this, as the C concentration in DSIT ferrite after route II was on average 0.068 at% and decreased to 0.028 at% after route III. The further decrease in the C concentration between route II and route III indicates that the C diffusion during the formation of DSIT ferrite was insufficient. As a result, this led to the formation of DSIT ferrite oversaturated with C. The Mn concentration in the ferritic areas also decreased after route III (0.864 at%) compared to route II (0.980 at%). Both C and Mn are known to stabilize austenite, which is why it was assumed that they diffused into the neighboring retained austenite areas. In order to verify this, further APT measurements of retained austenite after route III would have to be carried out to determine the chemical composition in the equilibrium state. No decrease could be observed for the Cr concentration in ferrite between route II and route III. The scatter of the measured values does not allow for drawing any conclusions in this case.
The presence of retained austenite right next to DSIT ferrite suggests that C diffuses into the neighboring areas during the formation of DSIT ferrite, and leads to an enrichment with C. As a result, retained austenite was stabilized down to room temperature. According to Ghosh et al. [4], the fact that only C diffuses into neighboring areas during the formation of DSIT ferrite but not heavier elements, such as Mn, Si, or Cr, indicates that the formation is a displacive mechanism, although accompanied by C diffusion. The present APT investigations of DSIT ferrite (Figure 6) and its neighboring areas show that during the formation, there was only a diffusion of C and no other elements into the neighboring areas. This, in turn, supports the before mentioned assumption of a displacive mechanism. Furthermore, it is supported by the results of the EBSD measurement (Figure 8 and Figure 9). The texture analysis of DSIT ferrite has shown that the <111> plane normals are parallel to the compression direction with the <110> directions pointing towards the radial direction of the compressed sample. The fact that there is a certain orientation relationship between the prior austenite grain and DSIT ferrite is, according to Ghosh et al. [4], also an indication for a displacive mechanism, as polygonal ferrite usually does not have any particular orientation relation with respect to its parent austenite grain. Although in the present case further experiments and EBSD measurements would be required to confirm and describe the displacive mechanism in more detail, our results indicate that the formation of DSIT ferrite is a displacive mechanism accompanied by C diffusion and the formation of retained austenite.

5. Conclusions

In this work, the microstructural, chemical, and crystallographic properties of DSIT ferrite were examined and compared with pre-eutectoid ferrite. In order to obtain the desired ferrite structure, various compression experiments were performed with a deformation dilatometer. Route I was chosen to check whether ferrite had already formed before the final deformation step of route II. Route II was chosen to produce DSIT ferrite through a final deformation step at a temperature of 750 °C and a strain of 0.4. The final experiment temperature of route III (730 °C) was chosen in a way that pre-eutectoid ferrite formed during a final holding time of 300 s.
The results can be summarized as follows:
  • The LOM and SEM analysis of the quenched dilatometer samples did show that DSIT ferrite formed predominantly along the PAGB during the final compression step of route II. Investigations of the quenched dilatometer samples after route III indicate that DSIT ferrite serves as a nucleation site for the formation of pre-eutectoid ferrite.
  • APT measurements showed that the formation of DSIT ferrite was accompanied by the formation of retained austenite. This could be explained by the fact that C diffuses into neighboring areas during the formation of DSIT ferrite and stabilizes the austenite down to room temperature.
  • STEM and APT measurements revealed the presence of fine NbC precipitates (around 5–10 nm) within DSIT ferrite, as well as at the interface between DSIT ferrite and retained austenite.
  • During the formation of DSIT ferrite, only a diffusion of C into neighboring areas was observed. Both the Mn and Cr concentration were equal within DSIT ferrite and the neighboring retained austenite right after the formation of DSIT ferrite. The reason for this is assumed to be that the heavier elements, such as Mn and Cr, did not have enough time to diffuse during the formation of DSIT ferrite.
  • The C and Mn concentrations within DSIT ferrite after route II were higher than the concentrations in the pre-eutectoid ferrite after route III. This leads to the assumption that C and Mn did not have enough time to diffuse during the formation of DSIT ferrite and that DSIT ferrite is therefore oversaturated with C and Mn right after the formation. To verify this, further APT measurements of retained austenite after route III would have to be carried out to determine the chemical composition in the equilibrium state.
  • An EBSD measurement of the crystallographic orientation of DSIT ferrite after route II showed that the <111> plane normals were parallel to the compression direction, with the <110> directions pointing towards the radial direction of the compressed sample.
  • It was found that during the formation of DSIT ferrite, only diffusion from C into neighboring areas occurred. At the same time a preferred orientation of DSIT ferrite in relation to the compression direction exists. This suggests that the formation of DSIT ferrite is a displacive mechanism, accompanied with C diffusion and the formation of retained austenite.

Author Contributions

Conceptualization, S.M., K.S.R., J.F., D.Z. and R.S.; methodology, S.M.; software, R.S.; validation, K.S.R., J.F., D.Z. and R.S.; investigation, S.M.; resources, K.S.R., J.F., D.Z. and R.S.; data curation, S.M.; writing—original draft preparation, S.M.; writing—review and editing, K.S.R., J.F. and R.S.; visualization, S.M.; supervision, R.S. and K.S.R.; project administration, S.M.; funding acquisition, R.S. All authors have read and agreed to the published version of the manuscript.

Funding

This research was funded by: Austrian BMK (846933) in the framework of the program 387 “Production of the future” and the “BMK Professorship for Industry”; Österreichische Forschungsförderungs GmbH (FFG:885187); Österreichische Forschungsförderungs GmbH (FFG:873200).

Data Availability Statement

Not applicable.

Conflicts of Interest

The authors declare no conflict of interest.

References

  1. Buchmayr, B.; Hatzenbichler, T.; Kienreich, R.; Beyer, S. Werkstoff- und verfahrenstechnische Optimierung bei der Herstellung hochfester Schrauben. Berg Huettenmaennische Mon. 2008, 153, 423–429. [Google Scholar] [CrossRef]
  2. Beladi, H.; Kelly, G.L.; Hodgson, P.D. Ultrafine grained structure formation in steels using dynamic strain induced transformation processing. Int. Mater. Rev. 2007, 52, 14–28. [Google Scholar] [CrossRef]
  3. Zhao, L.; Park, N.; Tian, Y.; Shibata, A.; Tsuji, N. Dynamic Transformation Mechanism for Producing Ultrafine Grained Steels. Adv. Eng. Mater. 2018, 20, 1701016. [Google Scholar] [CrossRef]
  4. Ghosh, C.; Aranas, C.; Jonas, J.J. Dynamic transformation of deformed austenite at temperatures above the Ae3. Prog. Mater. Sci. 2016, 82, 151–233. [Google Scholar] [CrossRef] [Green Version]
  5. Priestner, R.; de los Rios, E. Ferrite grain refinement by controlled rolling of lovv-carbon and microalloyed steel. Met. Technol. 1980, 7, 309–316. [Google Scholar] [CrossRef]
  6. Yada, H.; Li, C.-M.; Yamagata, H. Dynamic γ→α Transformation during Hot Deformation in Iron-Nickel-Carbon Alloys. ISIJ Int. 2000, 40, 200–206. [Google Scholar] [CrossRef] [Green Version]
  7. Poliak, E.I.; Jonas, J.J. A one-parameter approach to determining the critical conditions for the initiation of dynamic recrystallization. Acta Mater. 1996, 44, 127–136. [Google Scholar] [CrossRef]
  8. Poliak, E.I.; Jonas, J.J. Initiation of Dynamic Recrystallization in Constant Strain Rate Hot Deformation. ISIJ Int. 2003, 43, 684–691. [Google Scholar] [CrossRef] [Green Version]
  9. Sun, L.; Muszka, K.; Wynne, B.P.; Palmiere, E.J. Effect of strain path on dynamic strain-induced transformation in a microalloyed steel. Acta Mater. 2014, 66, 132–149. [Google Scholar] [CrossRef]
  10. Choi, J.-K.; Seo, D.-H.; Lee, J.-S.; Um, K.-K.; Choo, W.-Y. Formation of Ultrafine Ferrite by Strain-induced Dynamic Transformation in Plain Low Carbon Steel. ISIJ Int. 2003, 43, 746–754. [Google Scholar] [CrossRef]
  11. Beladi, H.; Kelly, G.L.; Shokouhi, A.; Hodgson, P.D. The evolution of ultrafine ferrite formation through dynamic strain-induced transformation. Mater. Sci. Eng. A 2004, 371, 343–352. [Google Scholar] [CrossRef]
  12. Bae, Y.H.; Lee, J.S.; Choi, J.-K.; Choo, W.-Y.; Hong, S.H. Effects of Austenite Conditioning on Austenite/Ferrite Phase Transformation of HSLA Steel. Mater. Trans. 2004, 45, 137–142. [Google Scholar] [CrossRef] [Green Version]
  13. Hong, S.C.; Lim, S.H.; Hong, H.S.; Lee, K.J.; Shin, D.H.; Lee, K.S. Effect of Nb on grain growth of ferrite in C-Mn steel during isothermal holding after severe deformation. Mater. Sci. Technol. 2004, 20, 207–212. [Google Scholar] [CrossRef]
  14. Gourdet, S.; Montheillet, F. A model of continuous dynamic recrystallization. Acta Mater. 2003, 51, 2685–2699. [Google Scholar] [CrossRef]
  15. Pandi, R.; Yue, S. Dynamic Transformation of Austenite to Ferrite in Low Carbon Steel. ISIJ Int. 1994, 34, 270–279. [Google Scholar] [CrossRef] [Green Version]
  16. Zheng, C.; Xiao, N.; Hao, L.; Li, D.; Li, Y. Numerical simulation of dynamic strain-induced austenite–ferrite transformation in a low carbon steel. Acta Mater. 2009, 57, 2956–2968. [Google Scholar] [CrossRef]
  17. Hao, L.; Sun, M.; Xiao, N.; Li, D. Characterizations of Dynamic Strain-induced Transformation in Low Carbon Steel. J. Mater. Sci. Technol. 2012, 28, 1095–1101. [Google Scholar] [CrossRef]
  18. Hurley, P.J.; Hodgson, P.D.; Muddle, B.C. Analysis and characterisation of ultra-fine ferrite produced during a new steel strip rolling process. Scr. Mater. 1999, 40, 433–438. [Google Scholar] [CrossRef]
  19. Irvine, K.J.; Pickering, F.B.; Gladman, T. Grain-refined C-Mn steels. J. Iron Steel Res. Int. 1967, 205, 161–182. [Google Scholar]
  20. Miller, M.K.; Russell, K.F.; Thompson, G.B. Strategies for fabricating atom probe specimens with a dual beam FIB. Ultramicroscopy 2005, 102, 287–298. [Google Scholar] [CrossRef] [PubMed]
  21. Lefebvre-Ulrikson, W.; Vurpillot, F.; Sauvage, X. (Eds.) Atom Probe Tomography: Put Theory into Practice; Academic Press: London, UK, 2016; ISBN 0128046473. [Google Scholar]
  22. Lerchbacher, C.; Zinner, S.; Leitner, H. Atom probe study of the carbon distribution in a hardened martensitic hot-work tool steel X38CrMoV5-1. Micron 2012, 43, 818–826. [Google Scholar] [CrossRef] [PubMed]
  23. Sun, X.; Dong, H.; Liu, Q.; Weng, Y. Dynamically transformed ferrite fraction inferred from dilatometry measurements after deformation. Mater. Sci. Eng. A 2008, 487, 93–98. [Google Scholar] [CrossRef]
  24. He, X.L.; Chu, Y.Y.; Jonas, J.J. Grain boundary segregation of boron during continuous cooling. Acta Metall. 1989, 37, 147–161. [Google Scholar] [CrossRef]
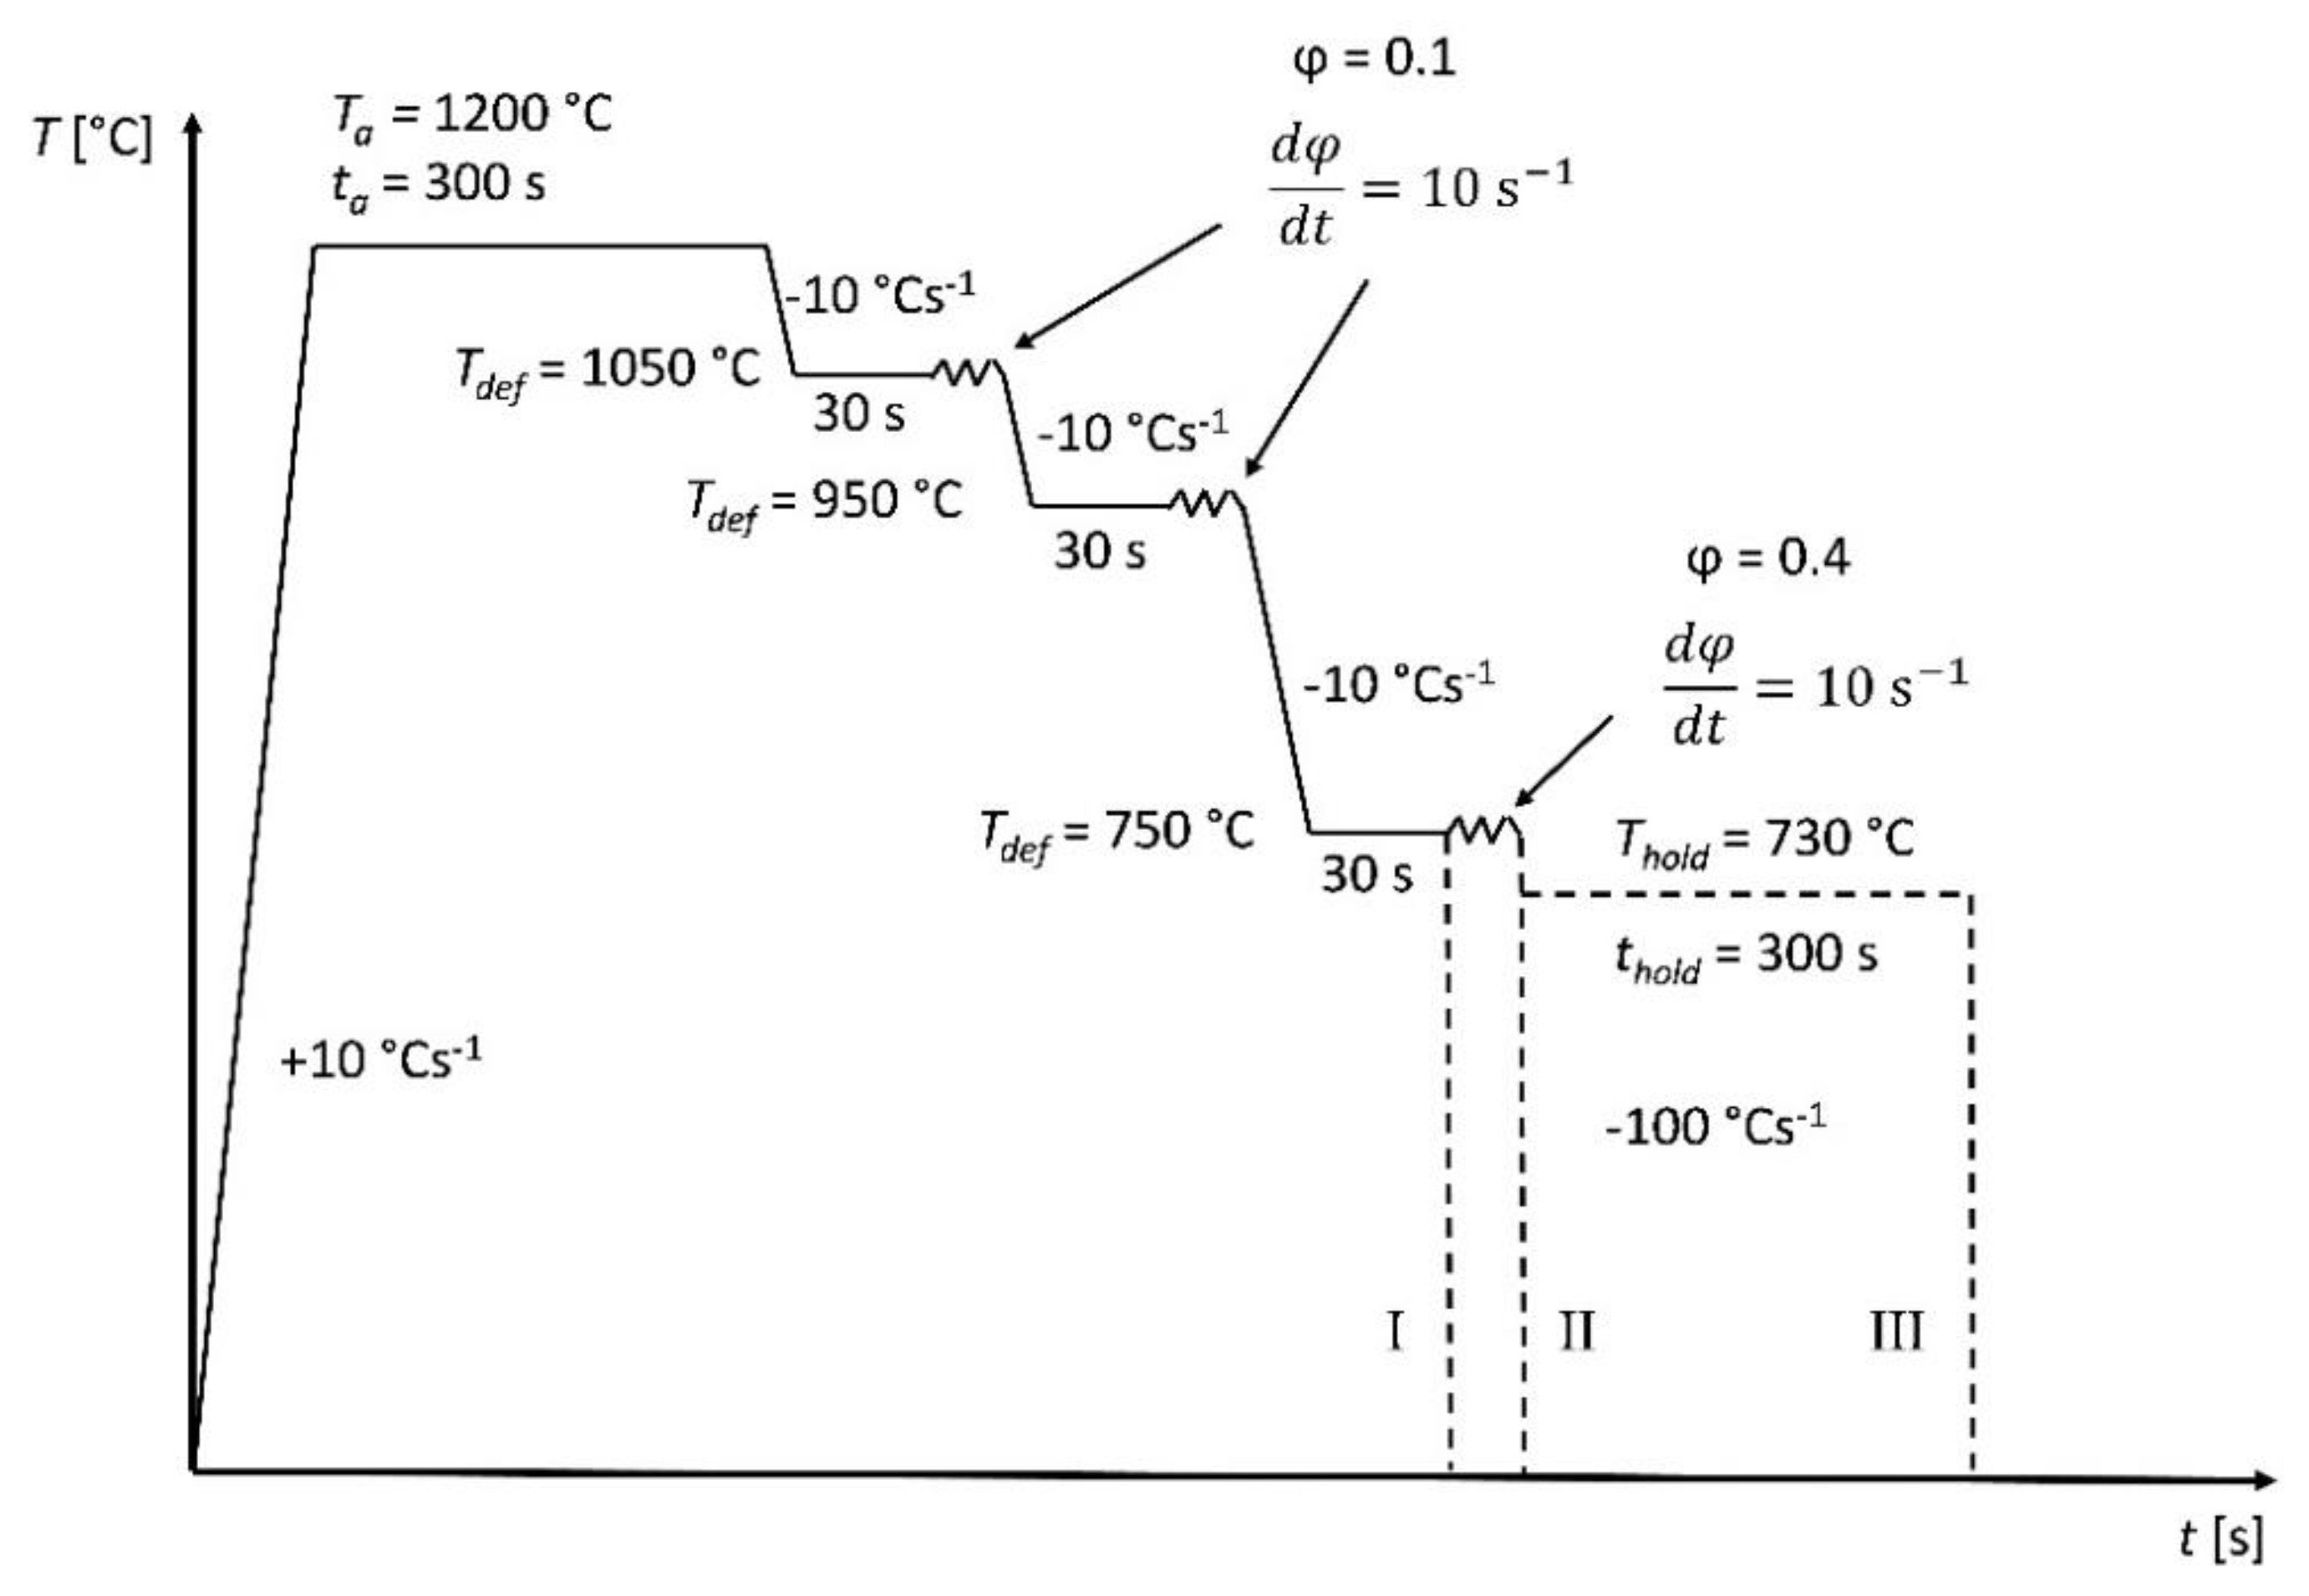
Figure 1. Schematic drawing of the time-temperature-deformation schedule. To investigate the dynamic strain-induced transformation (DSIT) and pre-eutectoid ferrite, three different deformation routes were carried out.
Metals 12 00313 g001
Figure 2. (a,b) Light optical microscopy (LOM) and scanning electron microscopy (SEM) image after route I. (c,d) LOM and SEM image after route II. (e,f) LOM and SEM image after route III.
Metals 12 00313 g002
Figure 3. LOM image after route II. Triple points are highlighted with arrows to show the DSIT ferrite along prior austenite grain boundaries (PAGB).
Metals 12 00313 g003
Figure 4. (a,b) Scanning transmission electron microscopy (STEM) images with different magnifications of DSIT ferrite after route II.
Metals 12 00313 g004
Figure 5. 3D reconstructions of an atom probe tomography (APT) measurement after route II. (a) C atoms are visualized by brown dots. The upper part with the lower number of C atoms represents DSIT ferrite and the lower retained austenite (b) B atoms are visualized by blue dots. The orange Nb isosurface represents the Nb clusters in the DSIT ferrite region and at the interface.
Metals 12 00313 g005
Figure 6. (a) 3D reconstruction of an APT measurement after route II. C atoms are visualized by brown dots. (b) The chemical depth profile across the interface along the arrow in the blue cylinder in (a). (c) The chemical depth profile of a carbide along the red cylinder in (a).
Metals 12 00313 g006
Figure 7. Chemical composition of DSIT ferrite after route II and pre-eutectoid ferrite after route III. (a) C content, (b) Mn content, and (c) Cr content.
Metals 12 00313 g007
Figure 8. (a) Image quality (IQ) map after an electron backscatter diffraction (EBSD) measurement of a sample after route II in the longitudinal direction. (b) Inverse pole figure (IPF) map after an EBSD measurement of a sample after route II in the longitudinal direction. (c) Reduced IQ map of (a).
Metals 12 00313 g008
Figure 9. Texture plot of DSIT ferrite in compression direction after route II.
Metals 12 00313 g009
Table 1. Chemical composition of the investigated steel.
FeCNMnSiCrBNbTi
wt.%bal.0.320.0040.980.100.430.00200.01100.0220
at.%bal.1.450.0160.980.190.460.01000.00600.0250
Table 2. Ar3 temperature depending on the cooling rate (λ).
λ [°Cs−1]Ar3 [°C]
0.1751
0.3728
1.0717
3.0690
Publisher’s Note: MDPI stays neutral with regard to jurisdictional claims in published maps and institutional affiliations.