Abstract
Nickel Aluminum Bronze (NAB) and Manganese Aluminum Bronze (MAB) are high-alloyed bronzes that are increasingly employed in several industrial sectors, mainly related to hostile environments due to their excellent properties against corrosion, cavitation, erosion and improved mechanical properties in relation to other copper-based alloys. These materials are very sensitive against thermal treatments due to a multiphase microstructure in as-cast condition. To contribute to the knowledge of the behavior of both alloys, the effect of thermal treatments on the corrosion behavior of NAB (CuAl10Fe5Ni5) and MAB (CuMn12Al8Fe4Ni2) was studied. As-cast material was subjected to various combinations of quenching and quenching and tempering at 850 °C and 600 °C. Corrosion testing was carried out using simulated sea and fresh water. The microstructures of the as-cast and heat-treated samples were characterized by metallography using two chemical agents with FeCl3 and NH4OH solutions and examination by optical and scanning electron microscopy. The major effect of thermal treatments on corrosion was found in influencing the amount and distribution of β-phase, which is prone to selective corrosion in both electrolytes.
1. Introduction
Nickel Aluminum Bronzes (NAB) and Manganese Aluminum Bronzes (MAB) are copper-based alloys with a relevant content of Ni, Al, Mn and Fe. They have high resistance to corrosion in numerous environments, particularly marine conditions, and good tribological properties, such as resistance against erosion, wear, and cavitation. These characteristics make them highly versatile alloys and the basic fields of application are linked to the manufacture of valves, turbines, and marine propellers [1,2,3,4]. The fundamental difference between both alloys is manifested mainly in the content of Mn and to a lesser extent in the percentages of Ni and Fe [5,6]. Their high microstructural complexity is a direct consequence of the chemical composition and the possible heat treatments they may undergo [7,8,9,10,11,12,13]. Besides the cooling inherent to the solidification process itself during casting, further thermal influences may occur during manufacturing or in service and particularly welding is one of the most relevant, with important consequences for the corrosion behaviour of these alloys [14,15,16,17].
The aim of this investigation is the direct comparison of corrosion behaviour of NAB and MAB, with identical thermal history in well-defined yet practically relevant media (simulated fresh water, simulated sea water), under identical and constant oxidative conditions (potentiostatically), for extended time (days).
Figure 1 presents the partial phase diagrams of NAB [10] (Figure 1a) and MAB [18] (Figure 1b), respectively. During solidification of NAB melt with 9 wt.% Al, a copper solid solution referred to as β-phase is formed, and in this phase, the other alloying elements are dissolved. During further cooling, the β-phase decomposes into α-phase and κ-phases, also coexisting as a ternary phase region with α-, β- and κ-phases. In particular, κ-phases show different morphologies and variable compositions with high amounts of Fe, Ni, and Al [18,19,20,21].
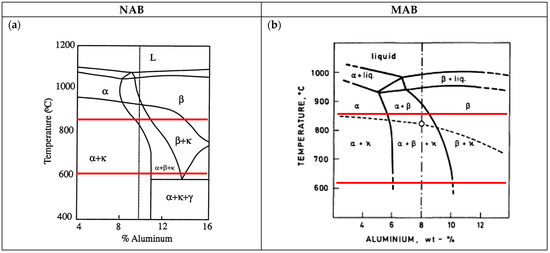
Figure 1.
Partial phase diagrams of CuAl10Fe5Ni5 type of NAB alloy [10] and CuMn12Al8Fe4Ni2 type of MAB alloy [18] showing in red colour the temperatures of the respective heat treatments applied in this investigation. (a) NAB; (b) MAB.
The microstructure of MAB is similar to that of NAB, influenced by the composition and the manufacturing processes. It is dominated by α-phase, which is copper-enriched, and by β-phase. When the melt cools down rapidly, the martensitic β’-phase is preserved. At elevated proportions of Mn, Fe and Ni, different κ-phases form, which contain higher amounts of Mn and Fe [18,21,22].
2. Instrumental and Experimental Methodology
2.1. Materials
The chemical composition of the studied bronze alloys is included in Table 1. The material was received as ingots of 1000 × 100 × 10 mm3. It is important to highlight the difference in Fe/Ni ratio, which is 1.08 in NAB and 1.73 in MAB, the high amount of Al in both alloys, and the presence of Mn providing high mechanical resistance, together with the reinforcing role of Ni [22,23].

Table 1.
Chemical composition of NAB and MAB (wt.%) as provided by the foundry.
2.2. Heat Treatments
Two heat treatments were carried out to study their effect on the microstructure of NAB and MAB. The first heat treatment, a quenching (T1), was performed at 850 °C for 1 h and then the samples were cooled in water without stirring. The second heat treatment, a quenching and tempering (T2), was performed by quenching (according to T1) and further annealing at 600 °C for 2 h, followed by cooling in the oven over 6 h. Such temperatures are, for example, related to welding processes; in particular, multi-pass welding, which reaches high temperatures and may include stress-relieving at lower temperature levels. References [11,20] support the temperatures selected in this study. Table 2 defines the heat treatments carried out in this study. The as-received, i.e., as-cast, material (AR) of both alloys was also considered for the microstructural analysis, AR being the reference for comparative purposes.
Table 2.
List of samples, types, and parameters of heat treatments.
2.3. Metallographic Preparation
Samples of approximately 20 × 10 × 3 mm3 were prepared for metallographic characterization by embedding in phenolic resin and grinding starting with 320 grit SiC, followed by polishing steps with 9 and 3 μm diamond suspensions and finally with 0.05 μm alumina suspension. To reveal the microstructures, two different solutions were used, referenced as etchant 1 and etchant 2: ferric chloride (5 g FeCl3, 20 mL HCl, and 80 mL distilled water) and ammonium hydroxide (25 mL NH4OH, 25 mL H2O2, and 25 mL distilled water), during 10 s and 13 s, respectively [24,25].
Metallographic analyses were performed with a light optical microscope (LOM—Leica DM 100, Leica Mikrosysteme Vertrieb GmbH Mikroskopie und Histologie, Wetzlar, Germany) and a scanning electron microscope (SEM, JEOL 2000, JEOL Ltd., Freising, Germany) equipped with energy dispersive spectroscopy (EDS) and back-scattered electron detector (BSE).
2.4. Electrochemical Corrosion Tests
Simulated sea water (SSW) and simulated fresh water (SFW) were used as electrolytes in the electrochemical corrosion tests. SSW was prepared according to the standard DIN 50905-4, Section 4.1. Simulated fresh water (SFW) was prepared by dissolving 1 mmol NaHCO3 and 0.5 mmol Na2SO4 per litre of distilled water, which is characterized as chloride-free, buffered (60 mg/L bicarbonate), and sulphate-dominated (48 mg/L). This composition was chosen as it was found critical for NAB in a corrosion failure analysis reported previously [26].
The saturated calomel electrode (SCE, 0 mVSCE = +242 mVH) was used as reference electrode in all tests and all potentials reported in the following are referred to SCE.
Potentiostatic corrosion tests were carried out in a cylindrical container (ca. 300 mm diameter) serving as test cell and filled with 6 L of electrolyte. A cylinder made from stainless steel mesh was placed inside along the container wall, serving as counter electrode (CE). The reference electrode (RE) was inserted from top in the centre of the container. For each test, four samples, serving as working electrodes (WE), were contacted by clamping to suitably bent stainless steel wires and placed symmetrically around the reference electrode. The four samples were polarized to +50, +150, +250, and +350 mVSCE, respectively, in SFW. In SSW, the four samples were polarized to −250, −200, −150, and −100 mVSCE. The lowest of these values was estimated as being close to the free corrosion potential of each bronze alloy in the corresponding electrolyte and is based on practical experience. The upper limit in SFW refers to a practically feasible worst-case corrosion scenario: galvanic coupling to large stainless-steel component under microbial influence [27]. Similarly, the upper limit for SSW is related to the scenario of the bronze being galvanically coupled to stainless steel. Polarization was controlled by a multichannel potentiostat (Octopoti, homemade [28]), connected to a data acquisition system logging the individual currents up to 72 h. Figure 2 shows the electrochemical test cell), Octopoti and the data acquisition system. Figure 3a shows the schematic configuration of the Octopoti and Figure 3b shows the distribution of all electrodes in the container.
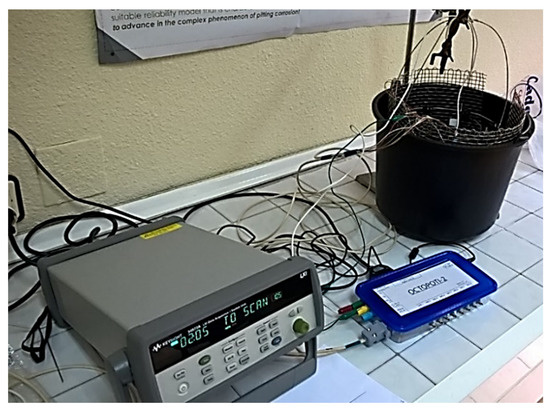
Figure 2.
Practical setup for the electrochemical cell for corrosion tests.
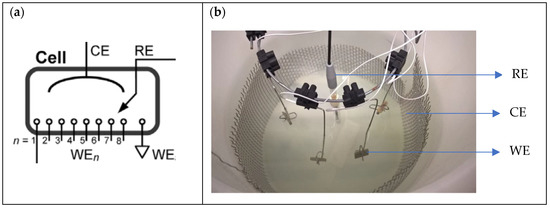
Figure 3.
(a) Detail of Octopoti configuration [28] and (b) distribution of all electrodes in the container (RE: Reference Electrode; CE: Counter Electrode; WE: Working Electrode). 4 WEs are used in the tests.
3. Results and Analysis
3.1. Microstructural Analysis of NAB and MAB Alloys
In general, both etchants were applied to the micrographs, which are presented in Figure 4, Figure 5 and Figure 6, together with SEM-BSE images of the unetched state. In the case of the NAB alloy, in terms of resolution and contrast, etchant 1 (ferric chloride solution) was found to better reveal the microstructure, clearly showing the main phases α and β, in yellow and black, respectively. The κ-phases were included within the α-phase and at the interface between α and β, all of them with a dark-greyish colouration. In the case of MAB alloy, the chemical etchant 2 (aqueous solution of ammonium hydroxide) reveals the microstructure better. However, etchant 1 yields additional information since some of the phases manifested with different colouration: α and β phases appear in different shades of orange and the κ-phases are located within the α-phase, highlighted by their bluish-grey colour [29].
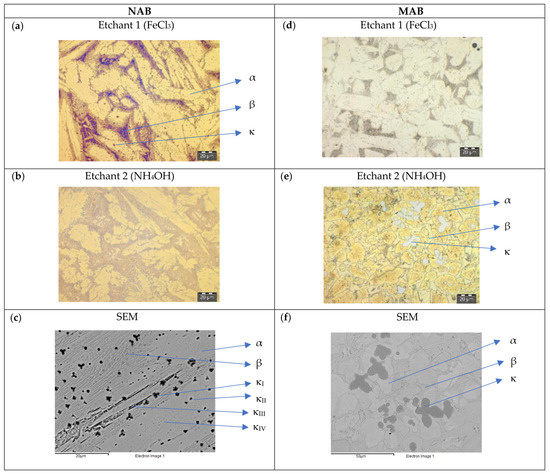
Figure 4.
As-received (AR) NAB and MAB microstructure. LOM images after applying etchants 1 (a,d) and 2 (b,e), and SEM-BSE pictures (c,f).
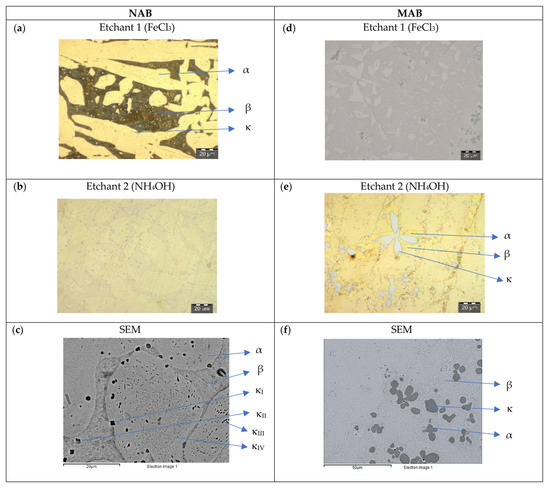
Figure 5.
NAB and MAB microstructure after quenching (T1). LOM images after applying etchants 1 (a,d) and 2 (b,e), and SEM-BSE pictures (c,f).
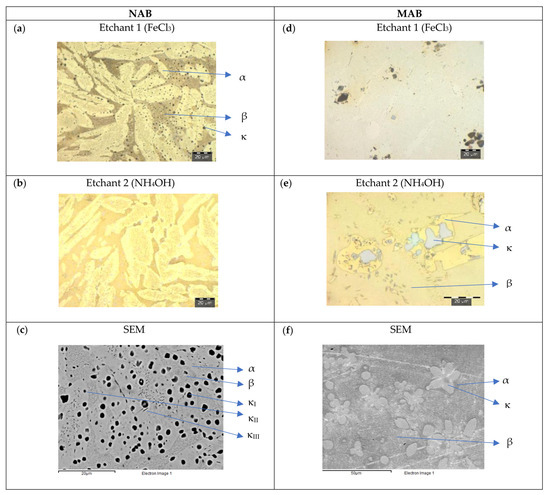
Figure 6.
NAB and MAB microstructure after quenching and tempering (T2). LOM images after applying etchants 1 (a,d) and 2 (b,e), and SEM-BSE pictures (c,f).
The microstructure of NAB may have up to six phases, and up to three phases are found in the case of the MAB alloy. Their quantity, distribution and morphology appear highly sensitive to the heat treatment applied. The evolution in appearance of phases is related to the slow cooling of the casting process with AR and the fast-cooling rate of quenching with T1. The quenching and tempering facilitating the diffusion of chemical elements is linked to T2.
As-Received (AR):
Figure 4 shows the microstructure of NAB and MAB as-cast after etching.
The NAB material (Figure 4a,b) in the AR state shows a complex columnar microstructure, with a high percentage of dendrites with an average width of 10–20 μm, in which the light zone predominates, representing the α-phase. A not very well-defined dark area corresponds to the retained β-phase. The micro-precipitates with different sizes, from 1 to 5 μm, represent the κ-phases. The structure of the MAB material (Figure 4d,e) in the AR state shows a high contrast of different phases and a remarkably globular area. There is also a series of rosette-shaped micro-precipitates of different sizes, from 20 μm to 30 μm, which represent the κ-phases and which are larger in size than the κ-phases of NAB. In SEM-BSE images, the κ-phases are of dark and grey colour, and the Cu-rich α-phase is bright (Figure 4c,f).
Quenched (T1):
Figure 5 shows the microstructure of NAB and MAB after quenching in the etched state. As a result of the quenching process, in NAB (Figure 5a,b), a widened β-phase appears as a dark zone with a thickening of the dendrites of α-phase, with an average length of 100 μm and a width of 25 μm. The α-phase also appears as isolated globular areas of average diameter 10 μm. The heat treatment does not affect the size of the micro-precipitates of the κ-phases detected in both α- and β-phases. In SEM-BSE image, the κ-phases are dark and the Cu-rich α-phase is bright (Figure 5c). In MAB (Figure 5d,e), the quenching process causes the presence of slabs, where α- and β-phases are difficult to distinguish. The rosette-shaped precipitates of different sizes, from 5 μm to 20 μm, are related to the κ-phases. SEM-BSE images confirm the metallographic findings (Figure 5f).
Quenched and tempered (T2):
Figure 6 shows the microstructure of etched NAB and MAB after quenching and tempering. In NAB (Figure 6a,b), the dendrites of α-phase are smaller, with an average length of 30 μm and width of 15 μm. There appears a random distribution of micro-precipitates of average diameter 3 μm, detectable in both α- and β-phases. The precipitates of κIV are very fine and cannot be identified explicitly (Figure 6c). In MAB (Figure 6d,e), again α- and β-phase are difficult to distinguish. The κ-phases, higher in density compared to AR, appear as rosette-shaped precipitates, with an average size of 10 μm. The SEM-BSE image of MAB confirms the metallographic findings (Figure 6f).
On NAB, the α-phase is clearly found in the microstructure after the heat treatments of quenching (T1), quenching and tempering (T2) and in the as-cast state (AR). The β-phase is retained after T1 but is transformed after T2 and acquires a similar morphology to that observed in AR. After the heat treatments, an increase in the quantity and size of the κ-phases has been observed.
On MAB, α- and β-phase configure a large percentage of the microstructure. The dendrites of α-phase are larger in relation to those found in NAB. After T1, β-phase increases its presence and there is a notable growth in size of the rosette-shaped precipitates that define the κ-phases and which are distributed in α-phase. Finally, after T2, the rosette precipitates lost their shape accompanied by coarsening.
Table 3 and Table 4 present for both alloys the chemical composition of the phases from SEM/EDS analysis. For comparison, the batch analysis data from the manufacturer are included.
Table 3.
Batch analysis data of NAB alloy (as-received) and the composition of the phases from EDS analysis (wt.%) in the AR state. Data for κIV were taken from literature [30] for comparison.
Table 4.
Batch analysis data of MAB alloy (as-received) and the composition of the phases from EDS analysis (wt.%) in the AR state.
Heat treatments, in general, do not change the composition of the different phases, so the values shown in Table 3 and Table 4, from AR state, may be considered typical.
In NAB (Table 3), generally rich in Ni, Fe and Al, κI and κII phases have similar chemical compositions rich in Fe and Al and are thought to be based on Fe3Al [19]. κIII phase, according to [11] is rich in nickel and related to NiAl. κIV, with higher Fe content than the rest of the κ phases, was not easily detectable in this study due to its nanometric size [30]. In general, the κ phases are low in Cu content compared to the average alloy composition.
In MAB (Table 4), generally rich in Mn and Al, a decrease in Cu content of the κ phases is also observed, obviously by accumulating other substitutional solutes such as Fe. The κ phases observed are thought to be based on FeMn.
3.2. Electrochemical Corrosion Tests
A typical example for results of potentiostatic corrosion tests of NAB in T1 state is presented in Figure 7 for both electrolytes. Tested in SFW (Figure 7), the current densities increase rather proportionally with the applied potential and there is no passive/active transition observed in the selected range of potentials. A kind of steady state, indicated by rather constant current is reached after 72 h. By contrast, in SSW (Figure 7) a very different behavior was observed, giving a high dynamic range of the current, where part is in the passive range and part is in the active regime. This is taken taken into account by presenting the data in semilog scale. Steady state currents were established within approximately 24 h. The most negative potential (–250 mVSCE) caused just cathodic currents. By the end of the test, low anodic current densities, i.e., passive or inactive behavior, were established at the test potentials −200 mVSCE and −150 mVSCE. The most anodic potential (–100 mVSCE) resulted in 2 orders of magnitude higher current density. These data indicate a sharp transition from passive to active behavior in the potential interval −150 to −100 mVSCE (Figure 7).
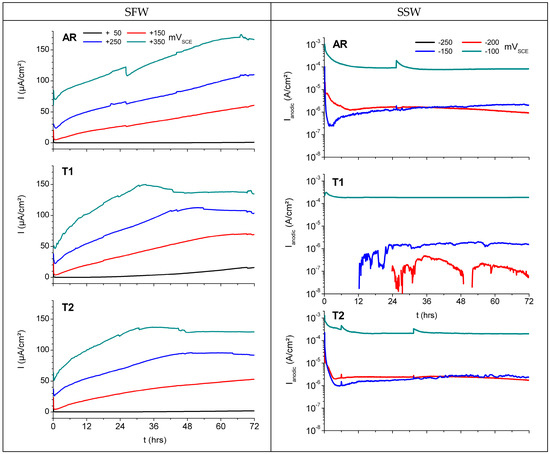
Figure 7.
Effect of electrolyte and potentials on potentiostatic corrosion testing of NAB in SFW (plotted with linear scaling) and SSW (plotted with semilog scaling).
Potentiostatic corrosion test results of MAB (data taken from [21]) generally exhibit similar trends as were observed with NAB: no passive/active transition was found with MAB in SFW, irrespective of the thermal treatment, while in SSW some passive behavior was established, except for T1.
In order to compare the corrosion behavior of NAB and MAB, the current densities after reaching the steady state are considered, which not only reflect the tendency of the metal to dissolve, but also include the ability of the material to develop protective layers of corrosion products in the respective electrolyte. In view of the slow kinetics of copper alloys in reaching such a steady state, particularly in electrolytes like SFW, the full test duration was considered and Table 5 compiles the final current densities after 72 h potentiostatic corrosion testing for both bronze alloys in both electrolytes.
Table 5.
Current density values (μA/cm2) for NAB and MAB [21] with different thermal treatments and exposed to SFW and SSW at various potentials, after 72 h of corrosion testing.
It can be observed that the behavior of NAB in SFW is strongly influenced by the heat treatment that led to an important microstructural transformation as has been described above in the microstructural analysis. The sequence in terms of susceptibility to corrosion phenomena turns out to be T1 >> T2 > AR, considering +50 mVSCE as the lowest polarized potential above the open circuit potential.
The influence of microstructure of NAB is not critical in SSW but is necessary to point out a light tendency of T2 samples to be more susceptible to corrosion, particularly at test potentials below −100 mVSCE. Although very similar, the susceptibility to corrosion of NAB in SSW follows the sequence T2 > AR > T1.
By contrast, the behavior of MAB in SFW and SSW electrolytes exhibits significant differences in relation to NAB, strongly influenced by the microstructure. Based on the gradual differences, the sequence in terms of susceptibility to corrosion phenomena in SFW turns out to be T2 > T1 > AR, considering +50 mVSCE as the lowest polarized potential above the open circuit potential. In this way, the material with quenched and tempered state (T2) is the one that presents the worst corrosion behavior even at low potentials in SFW, while as-cast state (AR) material performs best, establishing the lowest current densities in this electrolyte.
The susceptibility to corrosion of MAB in SSW follows the sequence T1 >> AR ≈ T2, considering −250 mVSCE as the lowest test potential above the open circuit potential. These data indicate that any quenching process (T1) would be disadvantageous for the material if used in marine service conditions. The best response to corrosion was presented by the quenched and tempered sample (T2), even at higher potentials. However, at −200 mVSCE, T2 material has worse corrosion behavior than AR material, which could be associated to the higher density of full κ-phase in T2 microstructure, which may have caused an increased influence of the phase boundary effect on the corrosion process.
Based on the results shown in Table 5, it can be highlighted that the heat treatments affect in a different way the corrosion behaviour of both alloys in simulated fresh water (SFW). NAB in general shows a slight decrease in the current density after both heat treatments, which is more evident at higher potentials (from 176 to 129 μA/cm2 at +350 mVSCE). By contrast, MAB shows an increase in the current densities (from 215 to 249 μA/cm2 at +350 mVSCE) which corresponds with the increase in β-phase content. In simulated seawater (SSW), a different effect of the heat treatments was observed. For NAB, they decrease the corrosion resistance, especially in the trans-passive region at higher potentials (from 82 to 200 μA/cm2 at −100 mVSCE), while there is no clear influence in the passive range, i.e., at the lower test potentials. In the case of MAB, T1 treatment reduces the corrosion resistance significantly at all potentials, while T2 treatment improves the corrosion resistance, indicated by the much lower current densities at the higher test potentials of −150 and −100 mVSCE. The observed relationships between corrosion behavior and microstructure will be discussed in the following section.
3.3. Type of Corrosion and Its Relationship with the Microstructure
Comparison of the final current densities in both electrolytes in Figure 7 indicates that SFW and SSW cause different corrosion effects on the alloys. SFW, which is based on sulphate and bicarbonate, seems to cause an increase of corrosion rate over time, hardly reaching an equilibrated state within the time scope of this experiment. This behavior is considered typical for localized corrosion in which there is extensive attack at distinct sites on the surface while the rest of it is corroding at a much lower rate. By contrast, the chloride-based SSW causes strong activation of the metal dissolution, steady state conditions are reached rather quickly, and the formation of a more or less protective film of corrosion products results in a more uniform corrosion process with steady current densities at high level. These considerations are reflected in the cross section of corroded samples of both alloys after corrosion testing in SFW at +350 mVSCE (Figure 8), and after testing in SSW at −100 mVSCE (NAB) and at −150 mVSCE (MAB), i.e., the lowest test potentials in the trans-passive range of AR (Figure 9). Samples subjected to rather high test potentials, and thus offering best visibility of the corrosion phenomena, were selected for this analysis.
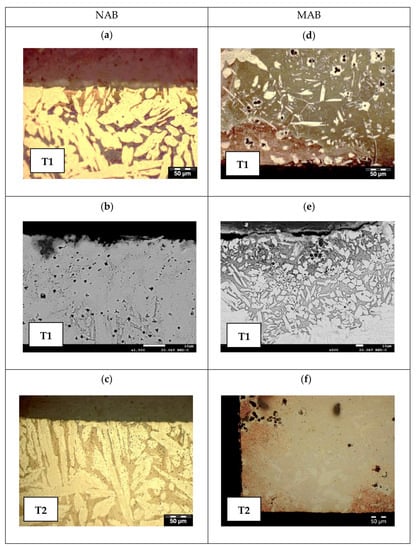
Figure 8.
LOM pictures of T1 and T2 samples after potentiostatic corrosion testing in SFW at +350 mVSCE for NAB (a,c) and MAB (d,f), and SEM pictures of T1 samples (b,e).
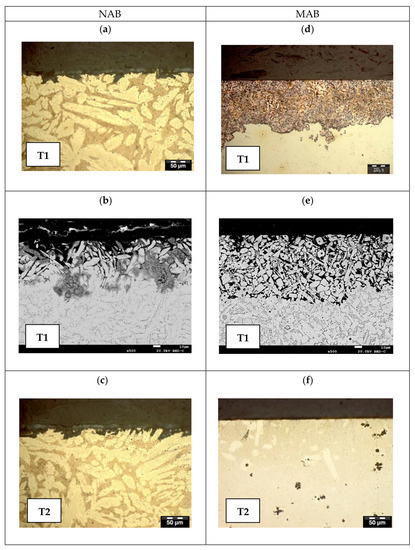
Figure 9.
LOM pictures of T1 and T2 samples after potentiostatic corrosion testing in SSW at −100 mVSCE for NAB (a,c) and −150 mVSCE for MAB (d,f), and SEM pictures of T1 samples (b,e).
Tested in SFW, for NAB, uniform corrosion with a depth of approximately 10 μm was observed in the case of T1 sample, with preferential dissolution at the β-phase and locally some redeposited copper observed (Figure 8a,b). Neither in state T2 nor in AR (not show here) were indications of localized corrosion detectable (Figure 8c). In MAB, selective corrosion with localized dealloying of β-phase and some material loss was observed in T1 sample, while α-phase and κ-phases remained unaffected (Figure 8d,e). T2 and AR (not shown here) samples exhibit localized dealloying, but no significant material loss (Figure 8f).
After testing in SSW, selective corrosion of β-phase was observed in NAB T1 and T2 samples tested in SSW (Figure 9a–c) at the test potential beyond the passive range. For MAB, selective corrosion and dealloying of β-phase and attack of κ-phase was observed with a uniform depth of 350–400 μm along its entire surface for the T1 sample (Figure 9d,e), while no significant corrosion was observed with T2 (Figure 9f). The AR sample (not shown here) underwent dealloying of β-phase with a depth of 300 μm.
4. Conclusions
The main conclusions based on the experimental results and their analysis are summarized as follows:
- The NAB and MAB cast alloys studied include up to six phases in their micro-structure (α-phase, β-phase and the κ-phases), which are sensitive to heat treatments as applied in this research: quenching (T1) and quenching + tempering (T2). For both materials, the major effect of heat treatments was found in influencing amount and distribution of the corrosion-susceptible β-phase. The α-phase and κ-phases are generally not attacked; dissolution of κ-phases was observed only with MAB in SSW.
- In sulphate-dominated SFW, active corrosion behaviour is generally observed and the heat treatments just gradually modify the corrosion behaviour. Selective corrosion of β-phase and dealloying occur in both alloys. MAB appears particularly sensitive to dealloying. For NAB, a significant detrimental effect of T1 relative to AR and T2 was found, correlating with a wider extent of the β-phase resulting from T1 treatment.
- In SSW, there is a sharp transition from passive to trans-passive corrosion regime. For NAB, T1 improves the corrosion behaviour in the passive potential range compared to AR, while T2 gradually degrades stability. In the practically less relevant trans-passive mode, AR appears gradually more stable than T1 and T2. With MAB, the situation is very different: T1 has a generally detrimental effect, while T2 extends the passive range to higher potentials and even improves corrosion stability in the trans-passive situation. During trans-passive corrosion, selective dissolution of β-phase dominates with NAB, while dealloying appears as a major mode of attack with MAB.
- With both alloys, keeping the amount of β-phase low and controlled is important for optimum corrosion behaviour and must be considered with any kind of heat treatment.
Author Contributions
Conceptualization, I.C.O., M.V.B.M. and P.L.; methodology, I.C.O., M.V.B.M. and P.L.; investigation, I.C.O.; supervision, M.V.B.M. and P.L.; writing—original draft, I.C.O.; writing—review & editing, I.C.O., M.V.B.M. and P.L. All authors have read and agreed to the published version of the manuscript.
Funding
This research was funded by Programa de Doctorado Industriales of Universidad de Cantabria, Spain, grant number 03.DI07.649, and the APC was funded by Universidad de Cantabria, Spain project P092.
Institutional Review Board Statement
Not applicable.
Informed Consent Statement
Not applicable.
Data Availability Statement
Data and results reported in this work are available on request from the corresponding author.
Acknowledgments
The authors would like to acknowledge the company Wärtsila Ibérica, S.A. located in Maliaño, Cantabria, Spain, for providing materials and continuous support during all the analysis. Financial support by the Universidad de Cantabria, Spain, (Industrial Doctorate Program) is greatly acknowledged.
Conflicts of Interest
The authors declare no conflict of interest.
References
- Birn, J.; Skalski, I. Corrosion behavior of noun-ferrous metals in sea wáter. In Proceedings of the European Corrosion Conference: Long Term Prediction and Modelling of Corrosion, EUROCORR 2004, Nice, France, 12–16 September 2004. [Google Scholar]
- Shüssler, A.; Exner, H.E. The corrosion of nickel-aluminum bronzes in seawater-I. Protective layer formation and the passivation mechanism. Corros. Sci. 1993, 34, 1793–1815. [Google Scholar] [CrossRef]
- Macken, P.J.; Smith, A.A. The Aluminum Bronzes: Properties and Production Processes; Copper Development Association: London, UK, 1966. [Google Scholar]
- Park, J.C.; Han, M.S.; Kim, S.J. Investigation on the cavitation damage behavior with temperature and cavitation time in seawater. Surf. Interface Anal. 2012, 44, 11–12. [Google Scholar] [CrossRef]
- Couture, A. Iron in aluminum casting alloy—A literature survey. ASF Int. Cast Met. J. 1981, 6, 33–46. [Google Scholar]
- Tang, C.H.; Cheng, F.T. Laser surface alloying of marine propeller bronze using aluminum powder. Part I: Microstructural analysis and cavitation erosion study. Surf. Coat. Technol. 2006, 200, 2602–2609. [Google Scholar] [CrossRef]
- Hobbs, J.M. Erosion by Cavitation or Impingement; ASTM STP 408; American Society for Testing and Materials: West Conshohocken, PA, USA, 1967; p. 220. Available online: https://www.scribd.com/document/477276297/ASTM-STP-408-Erosion-by-Cavitation-or-Impingement (accessed on 1 January 2022).
- Thomson, R.; Edwards, J.O. The kappa-phase in Nickel Aluminum Bronze, Part 2: Cast microstructures and properties. AFS Trans. 1978, 86, 395–400. [Google Scholar]
- Lorimer, G.W.; Hasan, F.; Iqbal, J.; Ridley, N. Observation of microstructure and corrosion behaviour of some aluminium bronzes. Br. Corros. J. 1986, 21, 244–248. [Google Scholar] [CrossRef]
- Hasan, F.; Jahanafrooz, A.; Lorimer, G.W.; Ridley, N. The morphology, crystallography and chemistry of phases in as cast nickel-aluminium bronce. Metall. Trans. A 1982, 13A, 1337–1345. [Google Scholar] [CrossRef]
- Wharton, J.A.; Stokes, K.R. The influence of nickel-aluminium bronze microstructure and crevice solution on the initiation of crevice corrosión. Electrochim. Acta 2008, 53, 2463–2473. [Google Scholar] [CrossRef]
- Wharton, J.A.; Barik, R.C.; Kear, G.; Wood, R.J.K.; Stokes, K.R.; Walsh, F.C. The Corrosion of Nickel–Aluminium Bronze in Seawater. Corros. Sci. 2005, 47, 3336–3367. [Google Scholar] [CrossRef]
- Al-Hashem, A.; Riad, W. The Role of Microstructure of Nickel–Aluminium–Bronze Alloy on its Cavitation Corrosion Behavior in Natural Seawater. Mater. Character. 2002, 48, 37–41. [Google Scholar] [CrossRef]
- Sabbaghzadeh, B.; Parvizi, R.; Davoodi, A.; Moayed, M.H. Corrosion evaluation of multi-pass welding nickel-aluminium bronze alloy in 3.5% sodium chloride solution: A restorative application of gas tungsten arc welding process. Mater. Des. 2014, 58, 346–356. [Google Scholar] [CrossRef]
- Li, H.; Grudgings, D.; Larkin, N.; Norrish, J.; Callagan, M.; Kuzmikova, L. Optimization of welding parameters for repairing NiAl bronze components. Mater. Sci. Forum 2012, 706, 2980–2985. [Google Scholar] [CrossRef] [Green Version]
- Li, X.Y.; Yan, Y.G.; Ma, L.; Xu, Z.M.; Li, J.G. Cavitation erosion and corrosion behavior of copper–manganese–aluminium alloy weldment. Mater. Sci. Eng. A 2004, 382, 82–89. [Google Scholar] [CrossRef]
- Punburi, P.; Tareelap, N.; Srisukhumbowornchai, N.; Yordsri, V. De-alloying corrosion in the heat-affected zone in Mn-Al bronze Weld. Mater. Chem. Phys. 2018, 212, 471–478. [Google Scholar] [CrossRef]
- Brezina, P. Heat Treatment of Complex Aluminum Bronzes. Int. Met. Rev. 1982, 27, 77–120. [Google Scholar] [CrossRef]
- Culpan, E.A.; Rose, G. Microstructural Characterization of Cast Nickel–Aluminum Bronze. J. Mater. Sci. 1978, 13, 1647–1657. [Google Scholar] [CrossRef]
- Böhm, J.; Linhardt, P.; Strobl, S.; Haubner, R.; Biezma, M.V. Microstructure of a Heat-Treated Nickel-Aluminum Bronze and Its Corrosion Behavior in Simulated Fresh and Sea Water. Mater. Perform. Charact. 2016, 5, 689–700. [Google Scholar] [CrossRef]
- Linhardt, P.; Strobl, S.; Böhm, J.; Haubner, R.; Biezma, M.V. Heat treatment effect on the microstructure and the corrosion resistance of manganese-aluminum-bronzes. Pract. Metallogr. 2021, 58, 72–82. [Google Scholar] [CrossRef]
- Iqbal, J.; Hasan, F.; Ahmad, F. Characterization of phases in an as-cast copper-manganese-aluminum alloy. J. Mater. Sci. Technol. 2006, 22, 779–784. [Google Scholar]
- Yang, F.; Kang, H.; Guo, E.; Li, R.; Chen, Z.; Zeng, Y.; Wang, T. The role of nickel in mechanical performance and corrosion behavior of nickel-aluminum bronzer in 3.5 wt.% NaCl solution. Corros. Sci. 2018, 139, 333–345. [Google Scholar] [CrossRef]
- Voort, G.F.V. Metallography: Principles and Practice, 3rd ed.; ASM International: Materials Park, OH, USA, 2004. [Google Scholar]
- Davis, J.R. Cooper and Cooper Alloys; ASM International: Materials Park, OH, USA, 2001. [Google Scholar]
- Linhardt, P. Unusual Corrosion of Nickel-Aluminum Bronze in a Hydroelectric Power Plant. Mater. Corros. 2015, 66, 1536–1541. [Google Scholar] [CrossRef]
- Linhardt, P. Twenty years of experience with corrosion failures caused by manganese oxidizing microorganisms. Mater. Corros. 2010, 61, 1034–1039. [Google Scholar] [CrossRef]
- Linhardt, P.; Kührer, S.; Ball, G.; Biezma, M.V. Design of a multichannel potentiostat and its application to corrosion testing of a nickel-aluminum bronze. Mater. Corros. 2017, 69, 358–364. [Google Scholar] [CrossRef]
- Cobo, I.; Biezma, M.V.; Sánchez, L. Estudio microestructural de bronces de aluminio y níquel (NAB) y bronces de aluminio y manganeso (MAB): Efecto de dos reactivos químicos. Mater.-ES 2017, 1, 56–59. [Google Scholar]
- Culpan, E.A.; Rose, G. Corrosion Behaviour of Cast Nickel Aluminum Bronze in Sea Water. Br. Corros. J. 1979, 14, 160–166. [Google Scholar] [CrossRef]
Publisher’s Note: MDPI stays neutral with regard to jurisdictional claims in published maps and institutional affiliations. |
© 2022 by the authors. Licensee MDPI, Basel, Switzerland. This article is an open access article distributed under the terms and conditions of the Creative Commons Attribution (CC BY) license (https://creativecommons.org/licenses/by/4.0/).