Article

An Accurate Model of the Corrosion Current Density of Coatings Using an Adaptive Network-Based Fuzzy Inference System

1
K.A. CARE Energy Research and Innovation Center, King Abdulaziz University, Jeddah 21589, Saudi Arabia
2
Department of Chemical and Materials Engineering, Faculty of Engineering, King Abdulaziz University, Jeddah 21589, Saudi Arabia
3
Center of Excellence in Desalination Technology, King Abdulaziz University, Jeddah 21589, Saudi Arabia
4
College of Engineering at Wadi Addawaser, Prince Sattam Bin Abdulaziz University, Al-Kharj 11911, Saudi Arabia
*
Author to whom correspondence should be addressed.
Metals 2022, 12(3), 392; https://doi.org/10.3390/met12030392
Submission received: 19 December 2021 / Revised: 9 February 2022 / Accepted: 22 February 2022 / Published: 24 February 2022

Abstract

:
Corrosion resistance coating is fabricated using epoxy/glass flake (E/GF) composites and is utilized to prolong the lifespan of cold-rolled steel (CRS) metal substrates. An in situ synthesis approach was adopted to prepare the composite coating at different levels of synthesis parameters, including a load of filler and coating thickness. In addition, this work shows the effects of the chemical functionalization of the filler on the corrosion protection property of the epoxy/functional glass flake (E/FGF) composite coatings. The effects of the modification of the filler, as well as the other synthesis parameters, on the corrosion resistance property are evaluated using a potentiodynamic polarization technique. Here, the corrosion resistance property is evaluated based on the observed current density. The primary goal of this work is to present an accurate model of corrosion current density (CCD). By using measured data, a precise model, which simulates the corrosion resistance properties of the coatings, has been created by an adaptive network-based fuzzy inference system (ANFIS) in terms of glass flake loading, chemical functionalization, and coating thickness. The obtained results revealed good agreement between ANFIS-based modelling and the measured dataset. The root mean square errors of the prediction model were 8.1391 × 10⁻⁸ and 0.0104 for training and testing, respectively. The coefficient of determination (R2) values of the ANFIS output were found to be 1.0 and 0.9997 for training and testing, respectively. To prove the superiority of the ANFIS-based model of CCD, the achieved results were compared with an analysis of variance (ANOVA). ANOVA utilizes a linear regression approach to get the model. Thanks to ANFIS, compared with ANOVA, the values of R2 are increased by 10% and 18.6% for the training and testing phases, respectively. Finally, the accuracy of the ANFIS model of corrosion current density is validated experimentally.

1. Introduction

Metallic corrosion delivers a significant impact on society and industries, as metals interact with their surroundings and deteriorate. The total mitigation of corrosion might be challenging. Therefore, researchers have considered different techniques to attenuate the rate of corrosion reactions. These techniques include, but are limited to, the use of corrosion resistance coatings and the incorporation of fillers to excel the corrosion resistance property of the coating. The focus on the synthesis of composite coatings can be attributed to various reasons, including the possibility of utilizing coatings in a wide range of applications, the low maintenance cost, and the variety of deposition techniques [1,2,3,4,5]. In particular, epoxy coating is widely utilized for corrosion protection purposes in a range of applications, including pipeline, transportation, construction, and water treatment. Moreover, studies have demonstrated that the corrosion protection property of epoxy composite coatings can be excelled by integrating different types of filler, including graphene, ZnCo-carbon nanotube, and glass flake [6,7,8,9]. In particular, the low cost and the advanced barrier property of glass flake triggers the need to further investigate the possibility of improving the corrosion protection ability of glass flake composite coatings. This study focused on examining the chance of boosting corrosion protection of epoxy glass flake composites by chemical modification of the filler to improve the interaction between the filler and the hosting polymer. In addition, artificial intelligent tools have been utilized to model and optimize the performance of the prepared composite coatings.
Artificial intelligence (AI) tools, for example, artificial neural networks, fuzzy, etc., have great roles in the development of many engineering systems. One highly recommended technique is fuzzy logic (FL), which still holds a competitive position among other techniques. An advantage of using FL in the system’s modelling is its ability to handle data with uncertainty. This uncertainty could happen either due to errors in the measurement instruments or because the data is superimposed with noise. Another crucial merit of using FL is the efficiency in modelling complex systems even if it has nonlinearity in the input–output relationship. The Adaptive Network-based Fuzzy Inference Systems (ANFISs) are the integration between fuzzy and neural networks [10,11]. ANFIS achieved a high accuracy in modelling various applications, for example, corrosion protection [12]. Alhumade et al. [12] succeeded in decreasing current density by 7.52% using ANFIS modelling and optimization in comparison with experimental data. They determined the optimal parameters of a load of graphene, the thickness of the coating, and the mixing time. Moreover, artificial intelligence has been used to model the pitting risk and corrosion rate of steel [13]. The lowest mean error is 1.26% for predicting corrosion rate and 5.60% for pitting risk. Sheikh et al. [14], based on acoustic emission and machine learning, proposed a methodology to predict corrosion and the severity level.
To the knowledge of the authors, this is the first time that a comparison between ANOVAs, a traditional method, and ANFIS, an artificial intelligence (AI) modelling approach, has been used to model the corrosion current density of coatings. Therefore, the key objective of the current work is to establish an accurate model of corrosion current density (CCD) based on ANFIS modelling, as an important step to improve the corrosion mitigation property of E/FGF coatings. By using measured data, the ANFIS-based model has been designed to model corrosion current density in terms of load of filler, type of filler, and coating thickness. To confirm the superiority of ANFIS-based modelling of CCD, the achieved results are compared with an ANOVA.
The rest of the work is arranged as follows: an experimental work explanation is presented in Section 2. Section 3 describes the suggested approach. The main findings are examined in Section 4. Lastly, in Section 5, the conclusions are summarized.

2. Experimental Work

2.1. Materials

Cold-rolled steel metal substrate (CRS, McMaster-Carr, Elmhurst, IL, USA) was polished gradually using 400–6000 grits polishing paper, cleaned with acetone and distilled water, and dried before being utilized as substrate. Bisphenol A diglycidyl ether (BADGE, Sigma Aldrich, St. Louis, MO, USA) was utilized as an epoxy resin, while Poly (propylene glycol) bis (2-aminopropyl ether) (B230, Sigma Aldrich) was utilized as hardener. (3-Aminopropyl) triethoxysilane (Sigma Aldrich) was utilized for the chemical modification of glass flake. All materials were used as received except for the filler.

2.2. Synthesis of FGF

GF was added to 10 mL of 1 M ammonium hydroxide solution sitting at 5 °C in an ice bath. The mixer was stirred for 30 min before slowly adding 3 mL of (3-Aminopropyl) triethoxysilane. The final mixer was stirred in the ice bath for 30 min, followed by stirring for 12 h at room temperature. The FGF was collected using vacuum filtration and the excess (3-Aminopropyl) triethoxysilane was washed away with 40 mL of ethanol. Finally, the collected FGF particles were neutralized using distilled water.

2.3. Composite Preparation

Composite coatings were prepared by dispersing the various loads of the pristine and functional filler in the epoxy resin. The mixture was stirred and bath sonicated for 1 h each before an appropriate amount of hardener was added to the mixture and stirred for 30 min. The composites were spin coated (SC 100, Smart Coater) on cleaned CRS substrates and cured at 50 °C for 4 h. After curing, the thickness of the coating was measured using scanning electron microscopy (SEM) (Zeiss LEO 1550) with a cross-sectional holder. The load of the filler is reported as the weight percentage (wt%) of the total weight of the composite. For instance, the composite coating with 10 wt% glass flake was prepared using 200 mg of glass flake, 0.5 B230, and 1.5 g BADGE.

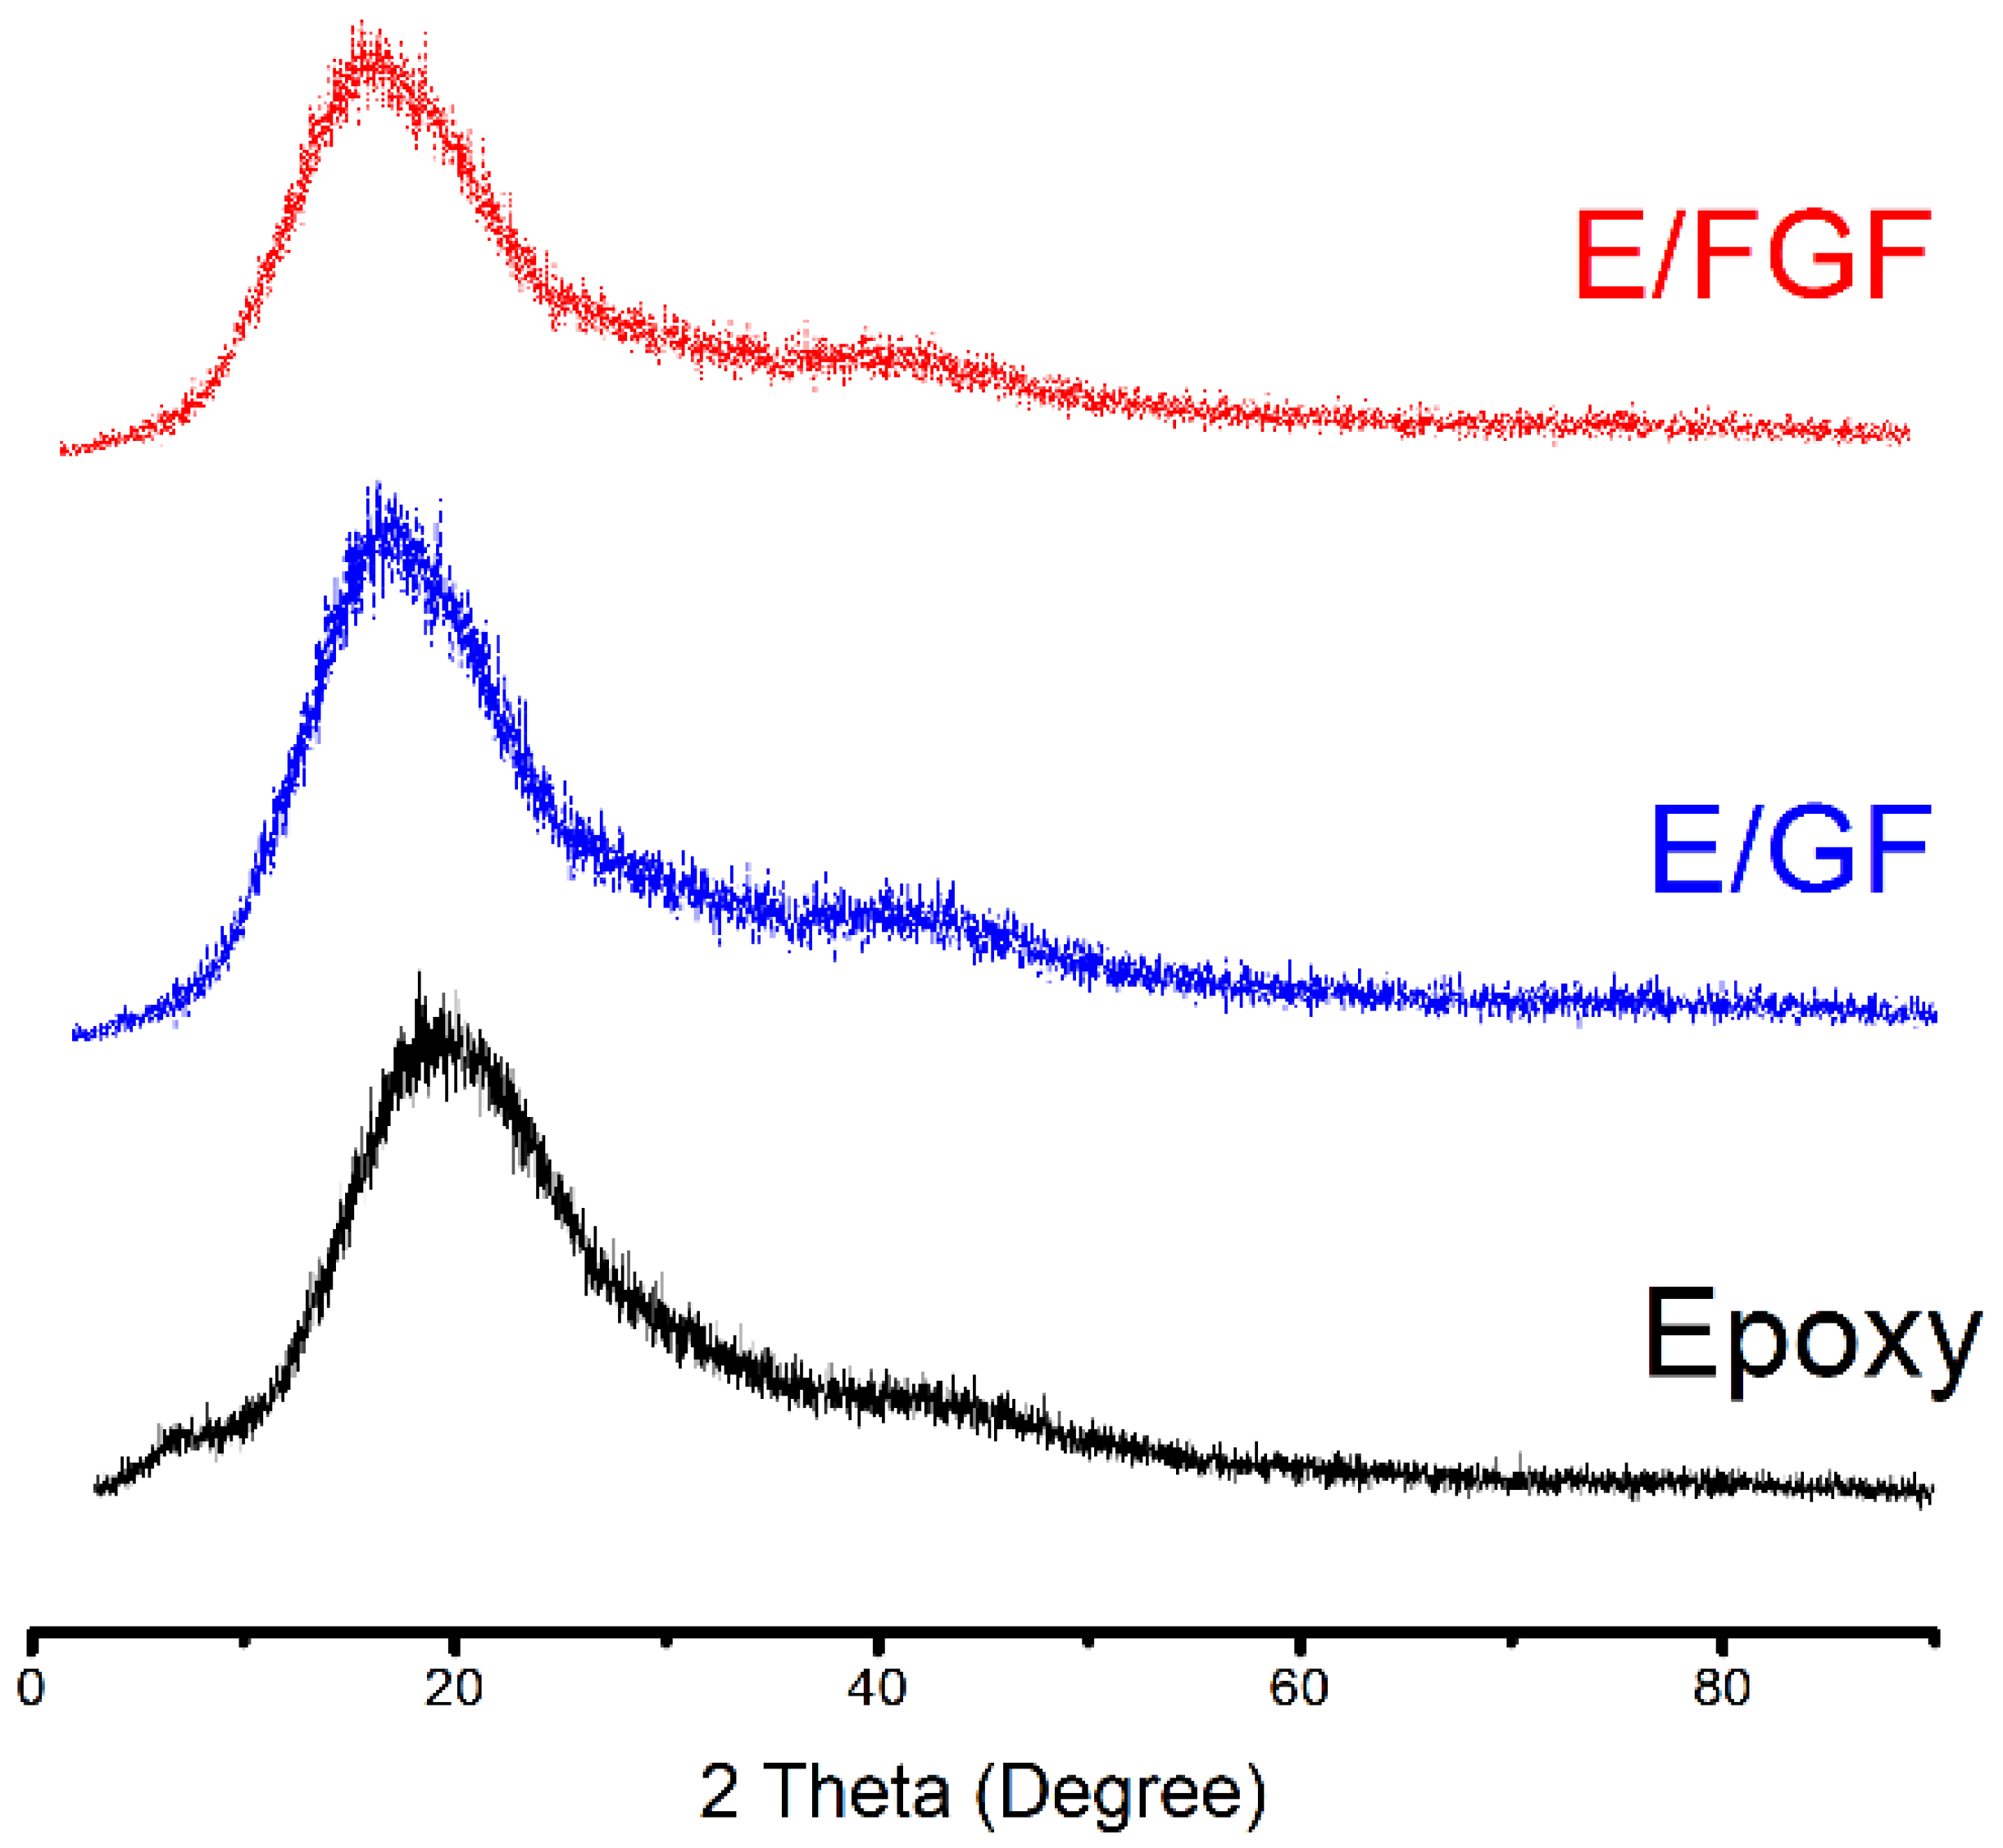
2.4. Characterization

The IR spectra of GF, FGF, and composite materials were recorded using FTIR (Tensor 27, Bruker, Billerica, MA, USA). The observed FTIR spectra were utilized to confirm the chemical functionalization of GF, as well as the curing of the composites. In addition, the curing of the composite materials was examined using XRD (Rigaku, Tokyo, Japan), where the patterns were recorded from 2θ = 3° to 90° at scan rate of 0.24°/min and 0.02° step size.

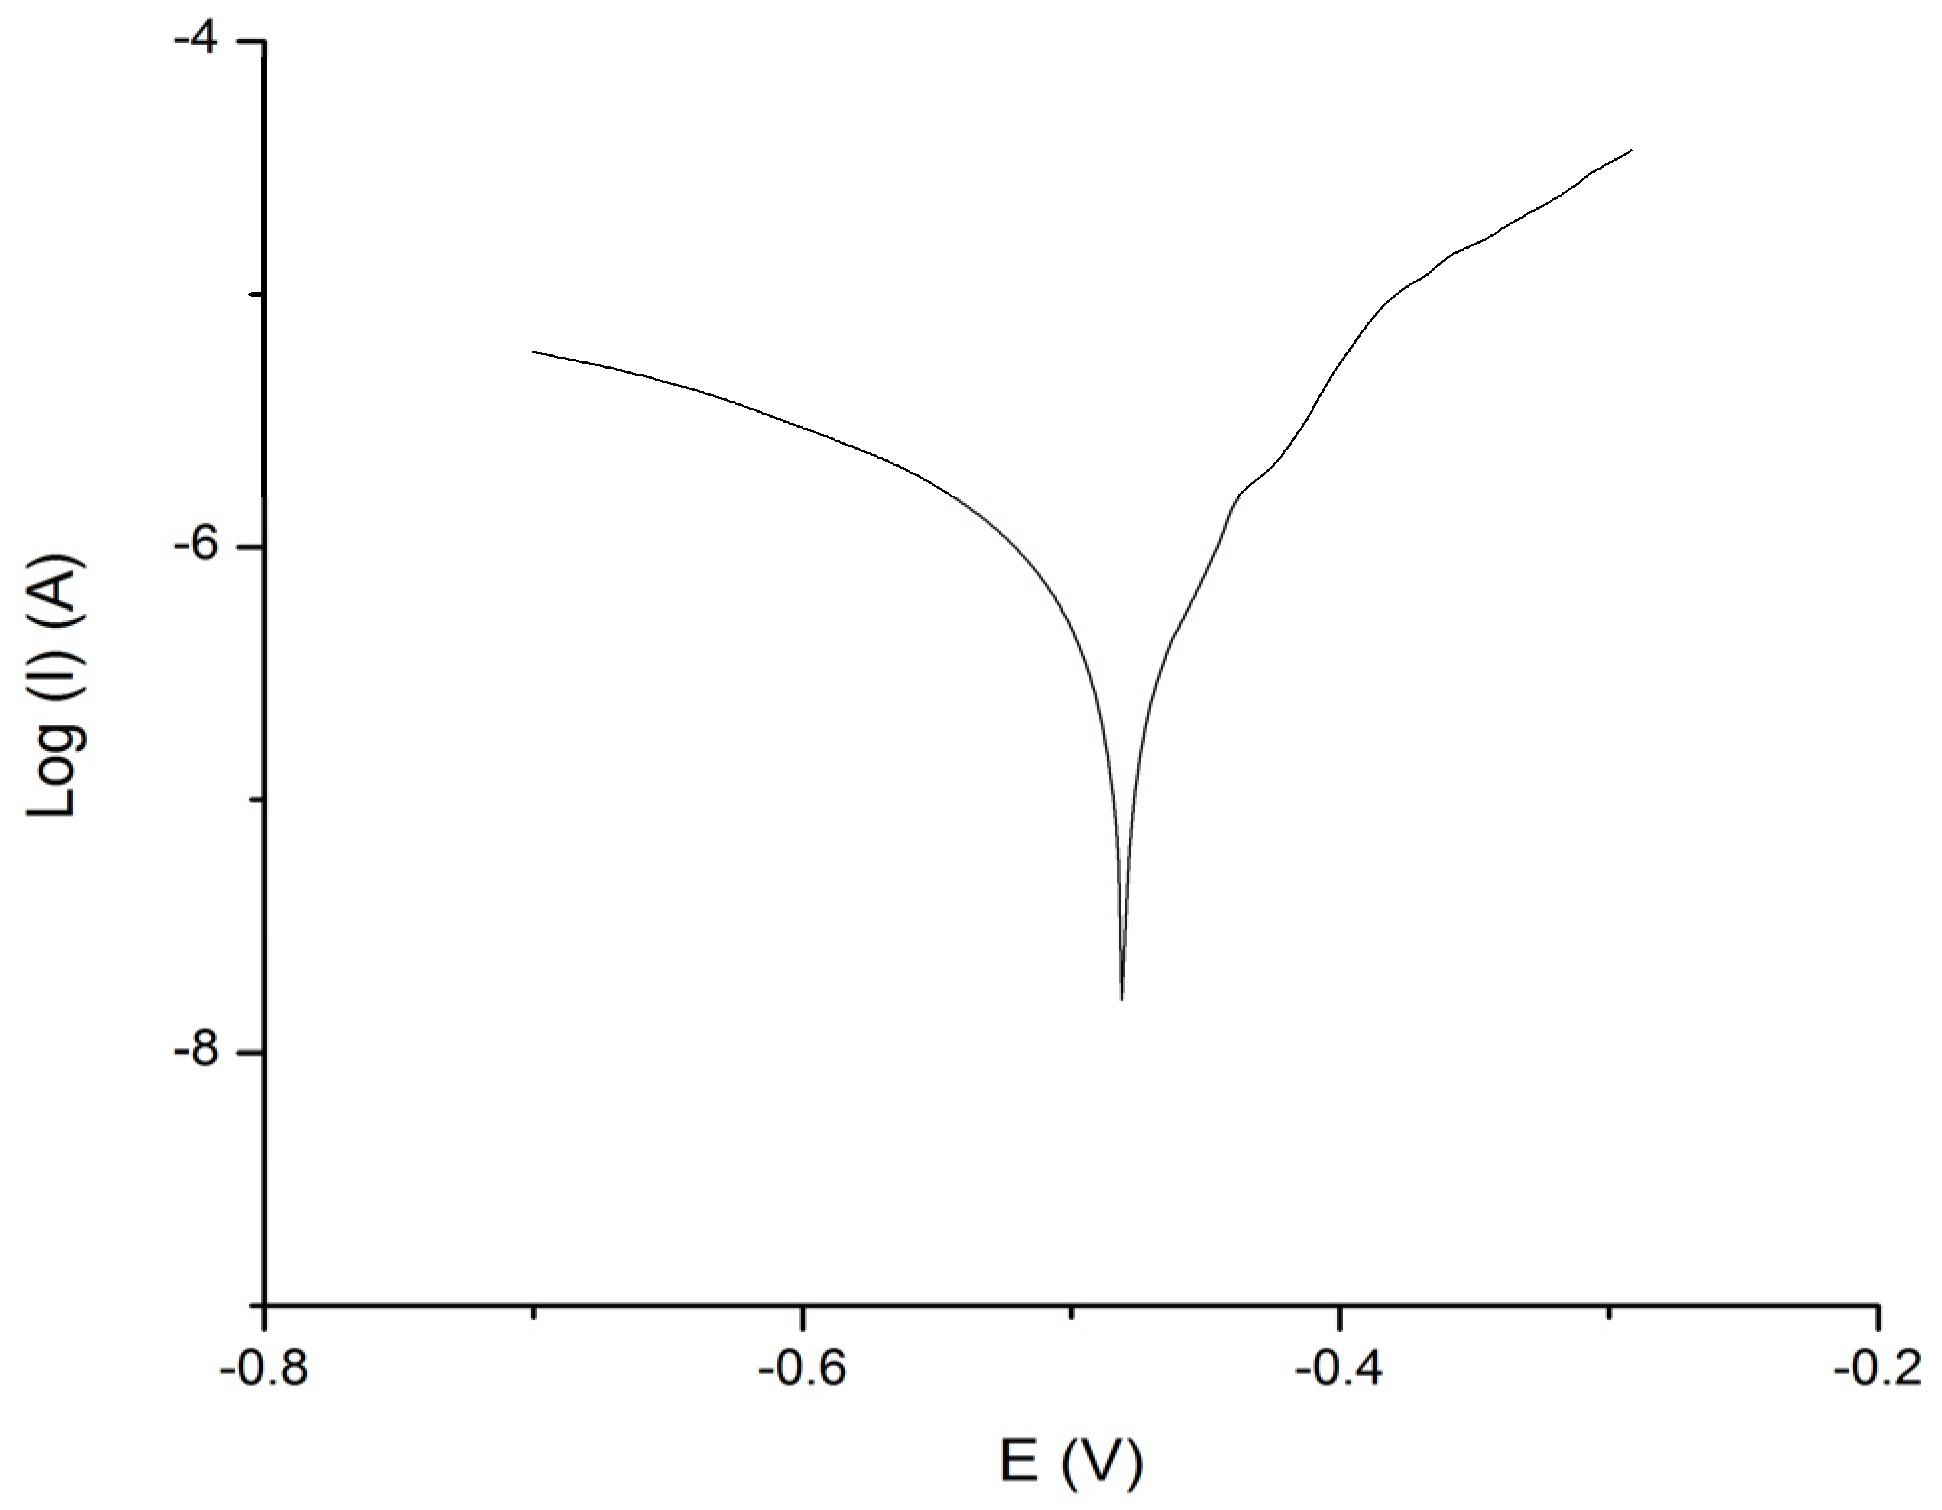
2.5. Polarization Measurements

The corrosion resistance property of the coating was evaluated through polarization measurements to generate Tafel plots using a VSP-300 workstation (Uniscan instruments Ltd., Buxton, UK) and EC-Lab software (Bio-Logic, Clay, France). A three-electrode configuration corrosion cell was used to conduct electrochemical measurements. Here, the coated samples were utilized as the working electrode, graphite rods as counter electrodes, and a silver/silver chloride electrode as a reference electrode in a temperature-controlled 3.5% NaCl solution as electrolyte. The potential of the working electrode was allowed to stabilize before the measurement was carried out in triplicate to collect the corrosion current density (Icorr). Here, measurements were carried out by scanning the working electrode potential at the range of −0.5 to 0.5 V around the open circuit potential using a scan rate of 0.02 V/min. The corrosion current densities were extracted by extrapolating the linear portion of the anodic and the cathodic curves in the Tafel plots using EC-Lab software.

3. Proposed Modelling of Corrosion Current Density

The proposed methodology includes both ANOVA and ANFIS-based modelling. By using the measured data, ANOVA and ANFIS models, which model the corrosion resistance properties of the coatings, have been created.

3.1. ANOVA Model of Corrosion Current Density

To create the corrosion current density (CCD) model using an ANOVA, Design Expert software was used. Table 1 presents the numerical values for the corrosion current density-based ANOVA model. An ANOVA can be applied for evaluating the relative significance of several factors in the existence of difficult interactions. It is a powerful method to test multiple-process variables. ANOVAs create a polynomial model that characterizes and predicts the data. It ensures no lack of fit due to surface curvature and perfect interactions between independent variables. The following relation can define the second-order quadratic polynomial model.
Y = B 0 + i = 1 k B i x i + i = 1 k B i i x i 2 + i < j B i j x i x j
where Y denotes the predicted output response; B0, Bi, Bii, and Bij denote the regression coefficients; k denotes the factors numbers; and x are the factors.

3.2. ANFIS Model of Corrosion Protection System

Unlike mathematical equations that describe the relation between the inputs and the output, fuzzy systems formulate this relationship as IF (antecedent)—THEN (consequence) rules. Usually, these rules are built either by experts or from the measured data. There are two methods to obtain the rules from the data: grid partitioning (GP) and subtractive clustering (SC). The latter is recommended because it creates the minimum number of rules. Fuzzy rules are classified according to the rule’s form into two types: Mamdani-Type and Sugeno-Type. In both types, the antecedent represents a logical combination of the inputs and their fuzzy mapping. On the other hand, the consequence, which represents the output, is either fuzzy mapping or a function of the inputs. Fortunately, to handle very complex systems, this function can be linear or non-linear. Examples of the two types of rules are shown in Equations (2) and (3), respectively
IF a1 is MFA1 AND a2 is MFA2 THEN b is MFB
IF a1 is MFA1 AND a2 is MFA2 THEN b = f(a1, a2)
where MFA1 and MFA2 denote two input membership functions, respectively; MFB denotes the membership function of the output; and f(a1, a2) is a function of the two inputs.
The choice of the rule’s type is application-dependent. Usually, the Mamdani-type is recommended in control applications while the Sugeno-type is recommended in modelling applications.
As soon as each rule produces its output, these outputs are aggregated together to produce one final fuzzy output. Then, it is defuzzified to produce its corresponding crisp value. The defuzzification method is selected according to the rule’s type. In the case of Mamdani-types, the centre of area (COA) is the best nomination, while the weighted average (Wavg) is recommended in the case of Sugeno-types [15,16]. The setup and formulation of fuzzy rules are typically made by a specialist. The whole system’s output y at a certain input sample x can be aggregated by the weighted average Wtaver method as presented in the following relation.
y ( x ) = i = 1 n w i . y i ( x ) i = 1 n w i  
where w i and y i are the weight and output of the rule i, respectively; and n is the number of rules.

4. Results and Discussion

4.1. Experimental Results

The FTIR spectra of GF presents absorption bands of silica, such as the peak at 794 cm−1 (Si-O-Si), peaks at 452 and 1048 cm−1 (Si-O), and the moisture peak at 1430 cm−1 [17], as depicted in Figure 1.
The successful synthesis of FGF is confirmed by the appearance of new absorption peaks, such as the peak at 1457 cm−1 and the peak at 1100–1126 cm−1, which corresponds to the attachment of NH2 to the (3-Aminopropyl) triethoxysilane coupling agent and the Si-O-C bond that bridges the NH2 functional group to the GF [18], as depicted in Figure 1. FTIR was also used to examine E/GF and E/FGF composites. Various characteristic peaks were identified in the spectra, including the peaks at 1508 cm−1 and 1609 cm−1 (C–C skeletal stretching), and at 915 cm−1 (epoxide ring). Moreover, the successful curing of the epoxy can be confirmed by the characteristic peak at 3380 cm−1, which represents -OH stretching. In addition, the curing of epoxy composites was confirmed using the XRD technique, where typical diffraction peaks for epoxy composites were observed around 2θ of 10 to 30° for all the composites, as depicted in Figure 2, which is ascribed to the homogeneously amorphous morphology of epoxy.
The corrosion current densities reported from the polarization measurements were studied to compare the corrosion mitigation performances of the various coatings, as reported in Table 1. The results indicate that for the same type of filler, increasing the load and/or the coating’s thickness will enhance the corrosion resistance property of the coating. For instance, such influence can be observed as a drop in the corrosion current density in Sample 3 and 5 in comparison to Sample 1. However, it was interesting to notice the significant impact of chemical functionalization of the filler on the corrosion protection property of the coating. For example, the utilization of FGF in Sample 2 clearly attenuated the corrosion current density reported for Sample 1. Moreover, the reported results in Table 1 indicate that the functionalization of the filler will deliver further corrosion mitigation coating than either increasing the load of the GF or the coating’s thickness. This can be seen by comparing the corrosion current densities for Samples 2 and 9 or Samples 2 and 3, respectively. The positive influence of FGF on the corrosion resistance property can be attributed to the dispersion of the filler in the composites, which prolong the paths for corrosive agents to reach the surface of the coated metal.

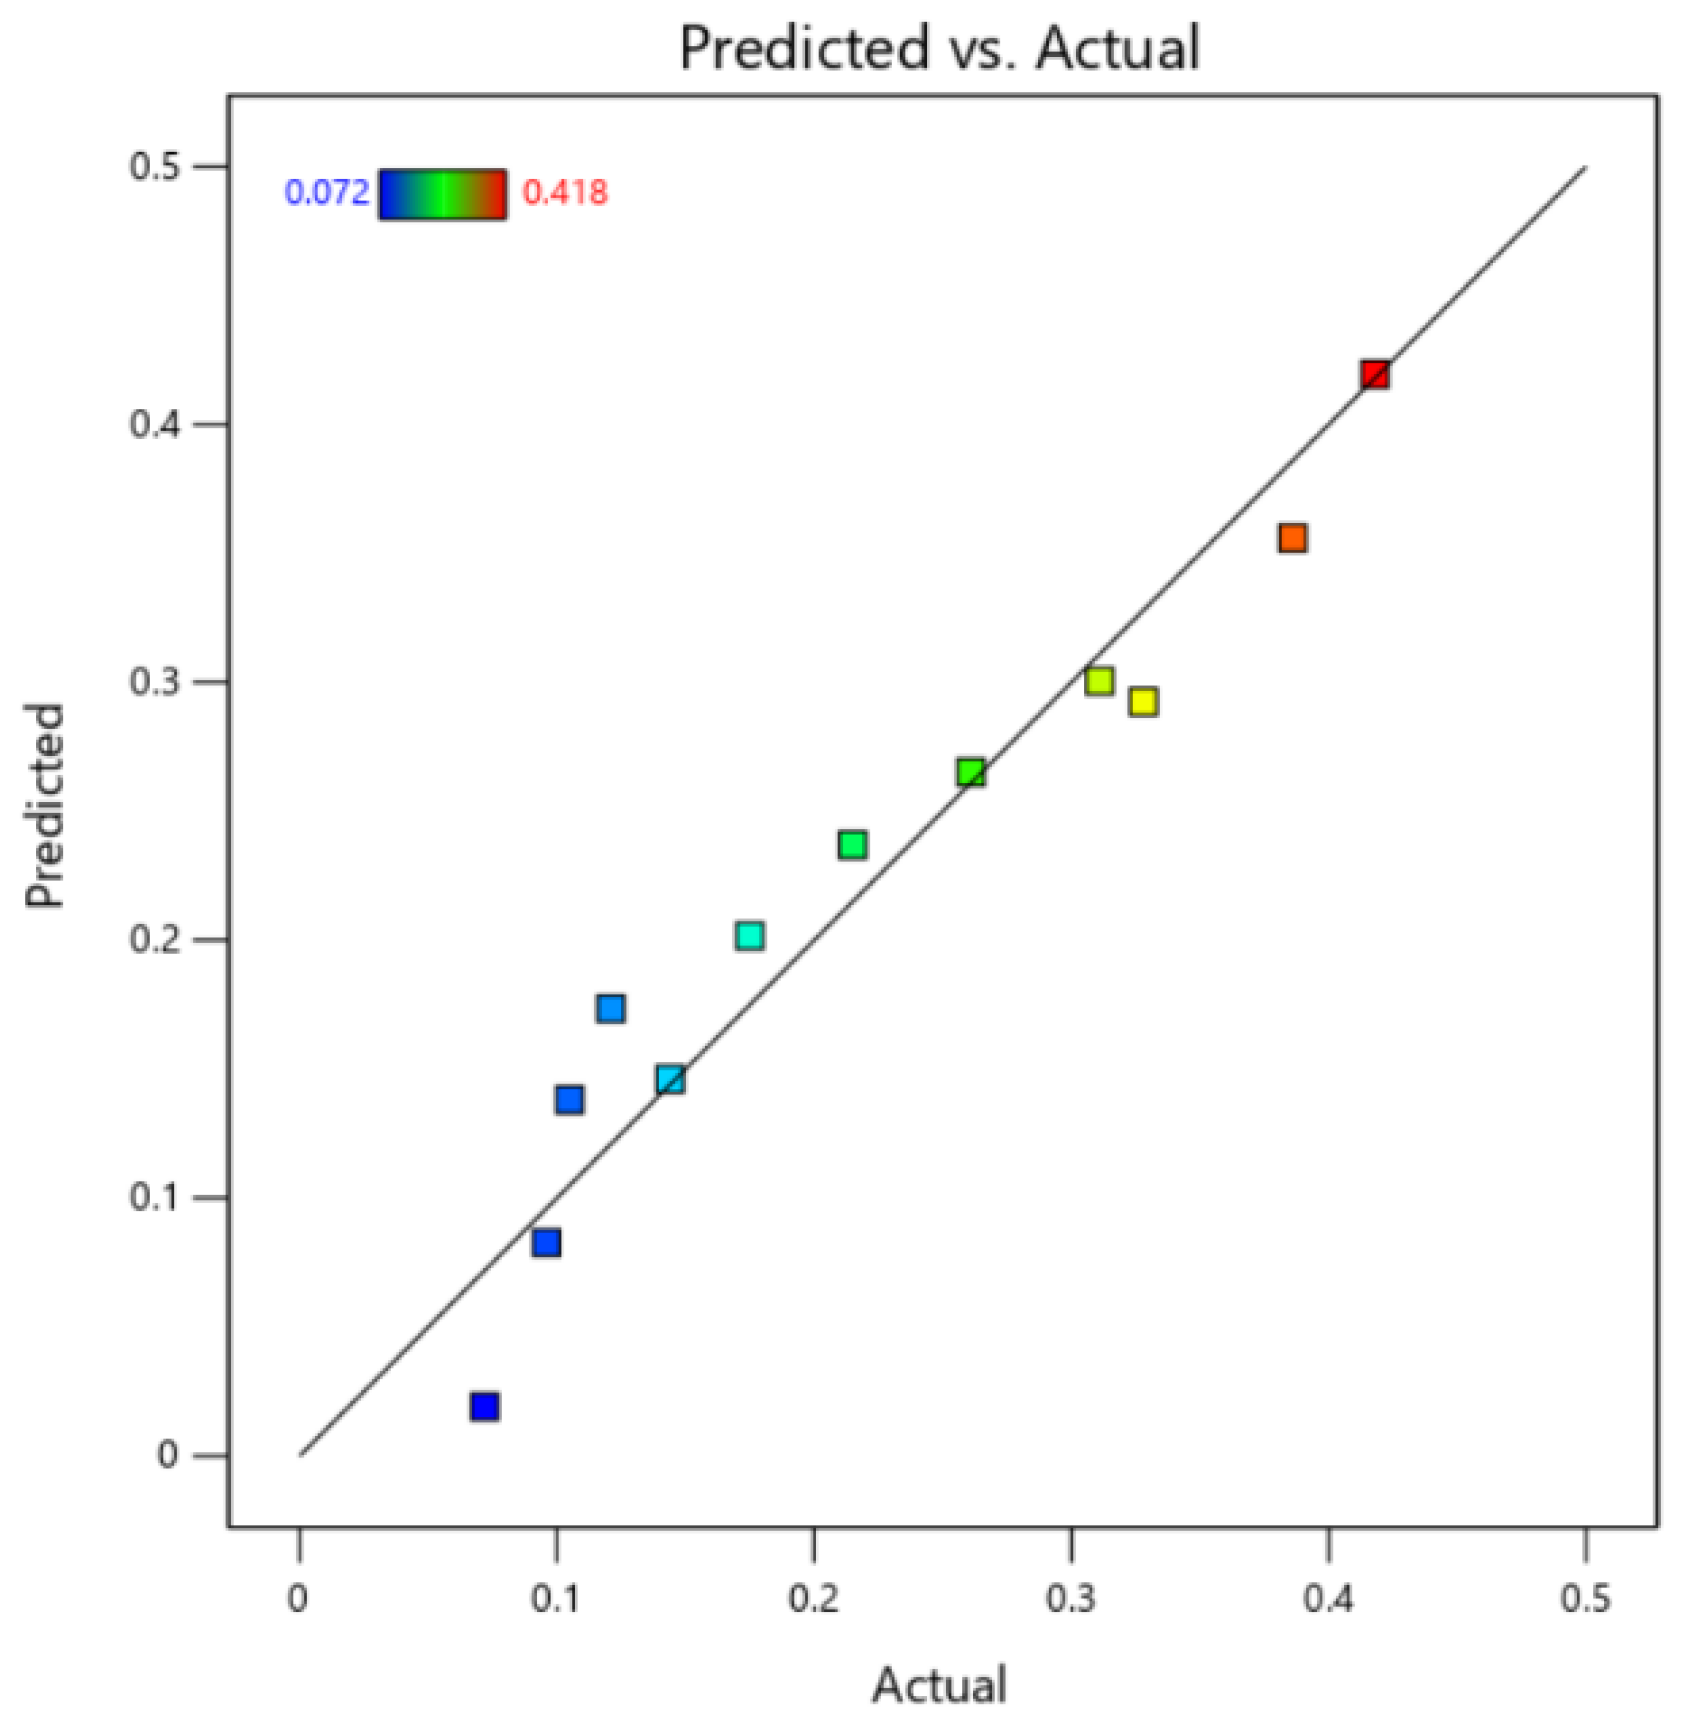
4.2. ANOVA-Based Modelling Results

Table 2 presents the data for the corrosion current density-based ANOVA model. To be clear, A, B, and C are used to define the load of filler, type of filler, and coating thickness, respectively. Considering Table 2, the F-value of 37.79 reinforces the significance of the model. The p-values less than 0.05 show the model terms are significant. In the case study, A, B, and C were significant. The next equation can be used to calculate the CCD.
I c o r r = 0.6655 0.0127 A 0.154333 B 0.002380 C
The statistical analysis of the CCD-based ANOVA model is presented in Table 3. The predicted and Adjusted R2 values were 0.8426 and 0.9094, respectively. The root mean square error (RMSE) and mean square error (MSE) values were 0.4683 and 0.2193, respectively. The ratio of adequate signal was 19.31, denoting an adequate signal. Such a model may be applied to navigate the design space.
The predicted versus actual values for the corrosion current density model is shown in Figure 3. As explained in Figure 3, the actual values are the experimental data, and the predicted ones are estimated by the ANOVA model. One can note the data are distributed close to the diagonal. This indicates the correlation between the predicted and the actual datasets.

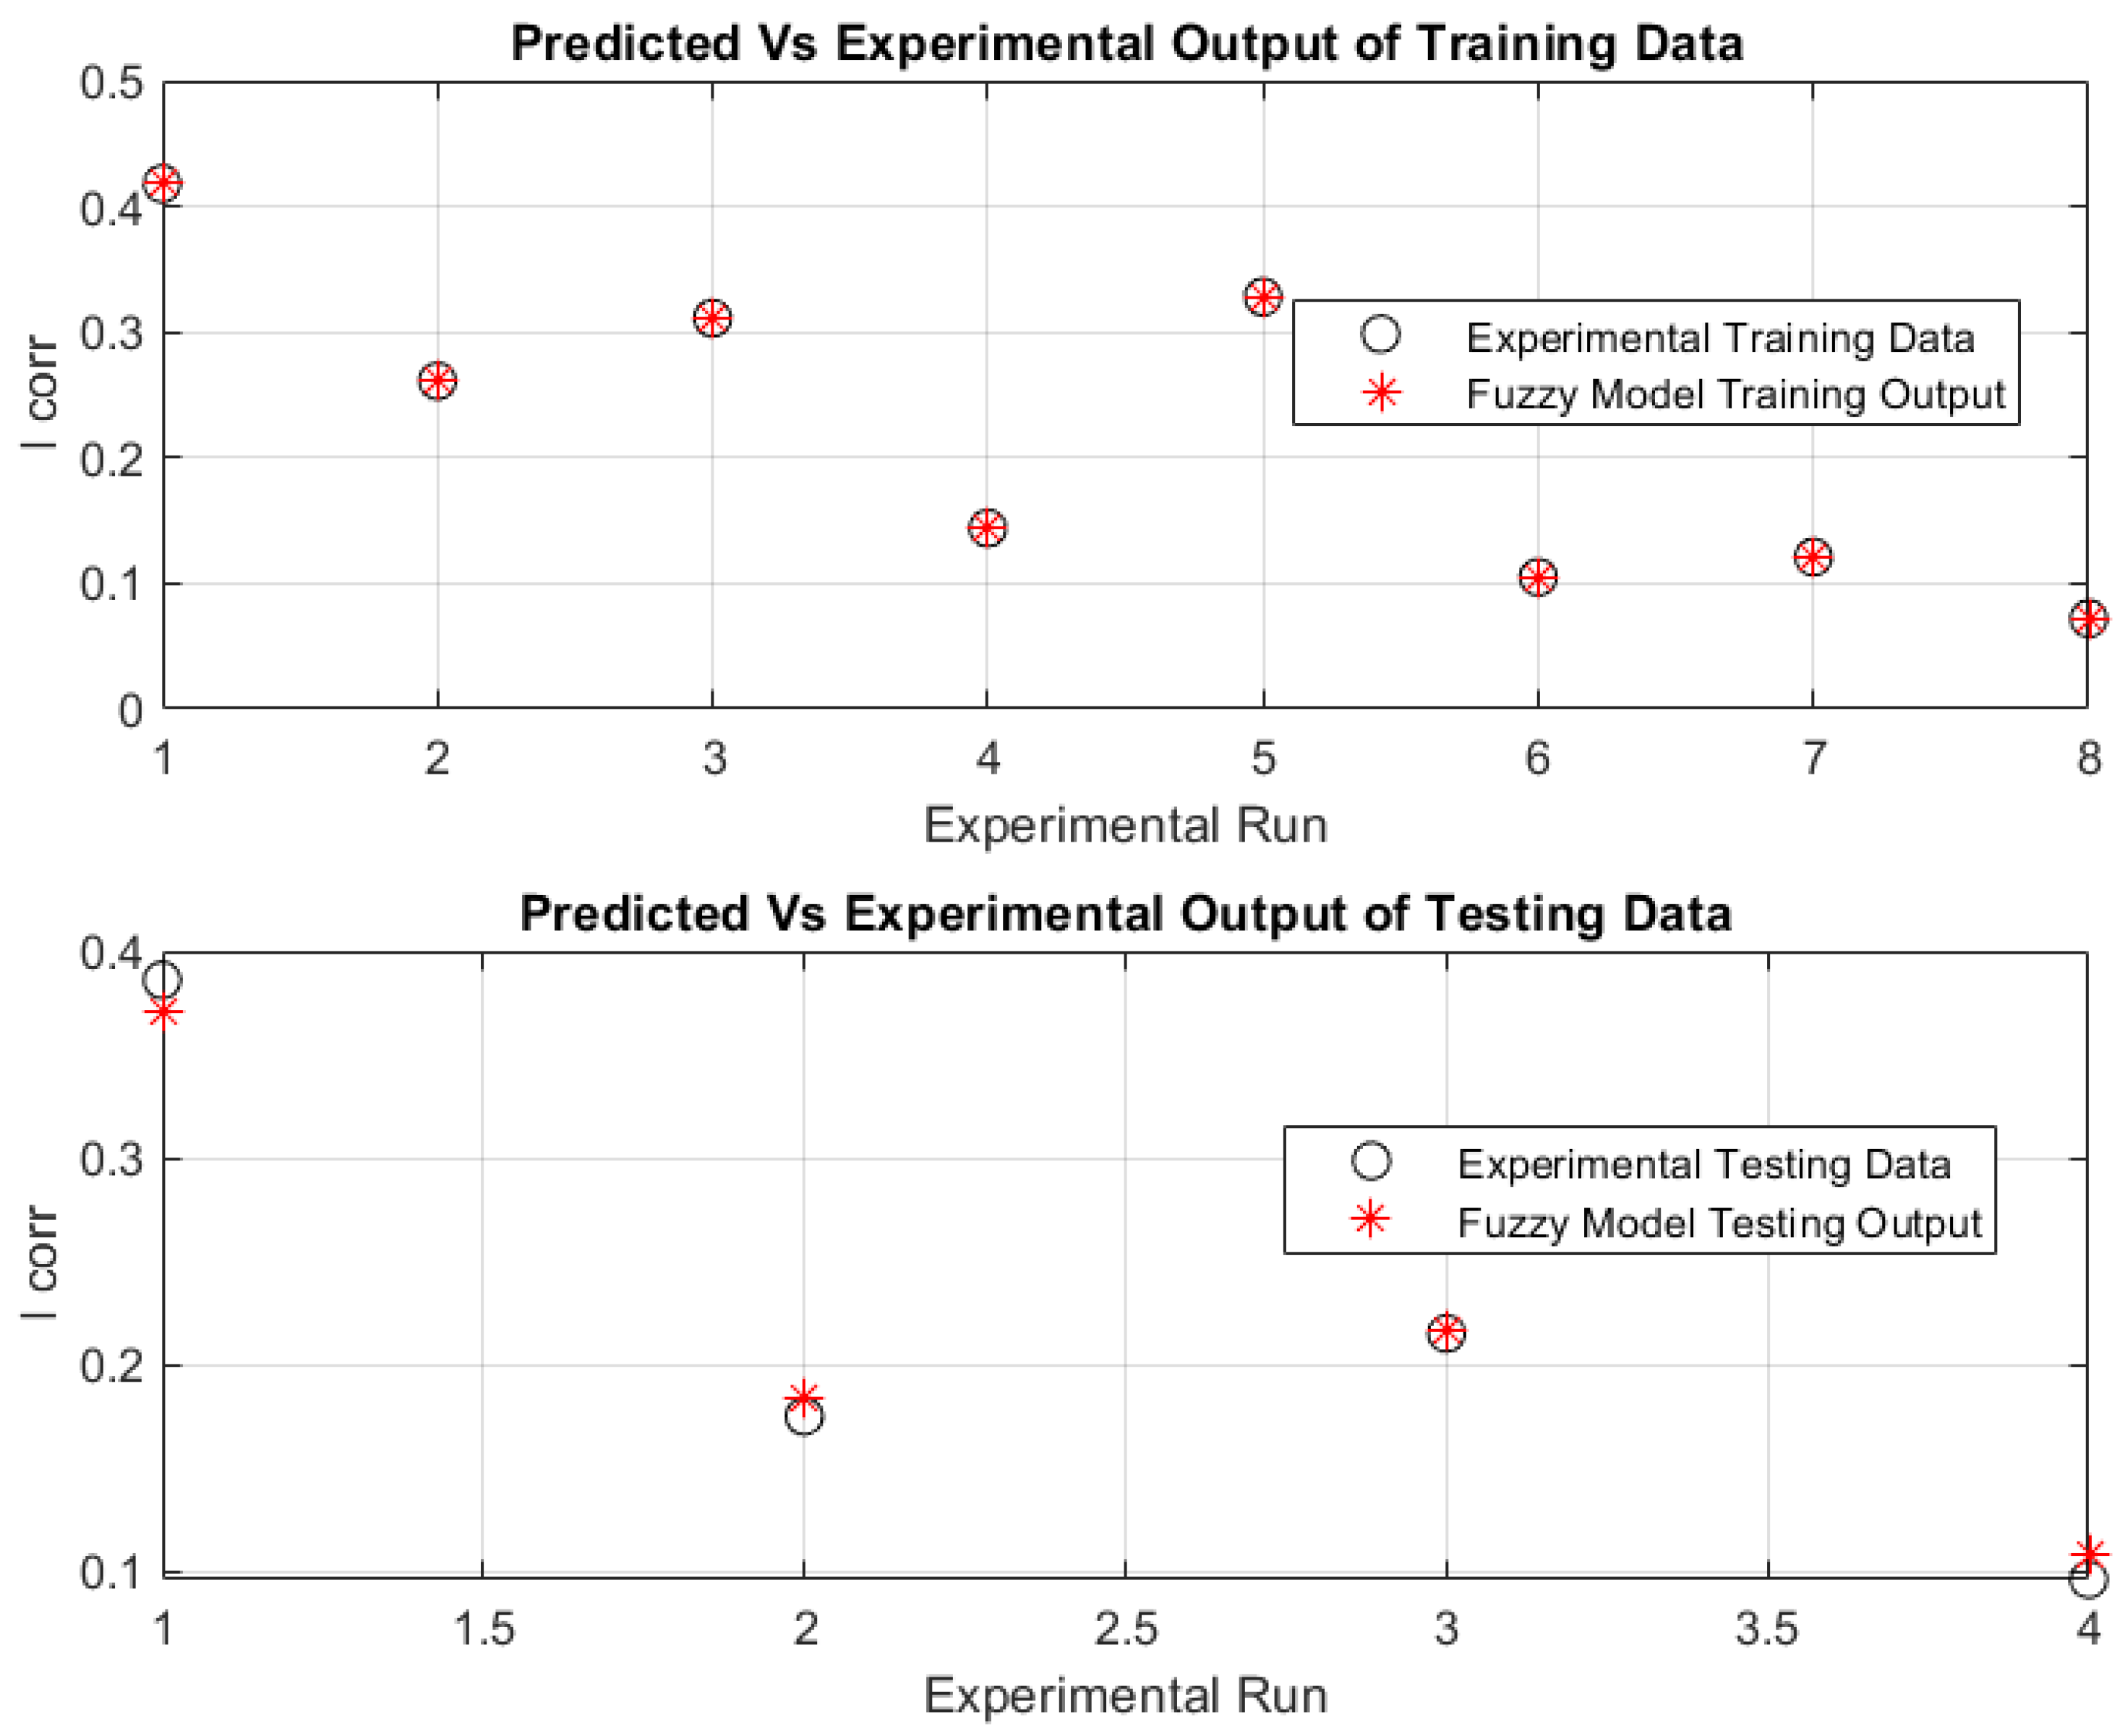
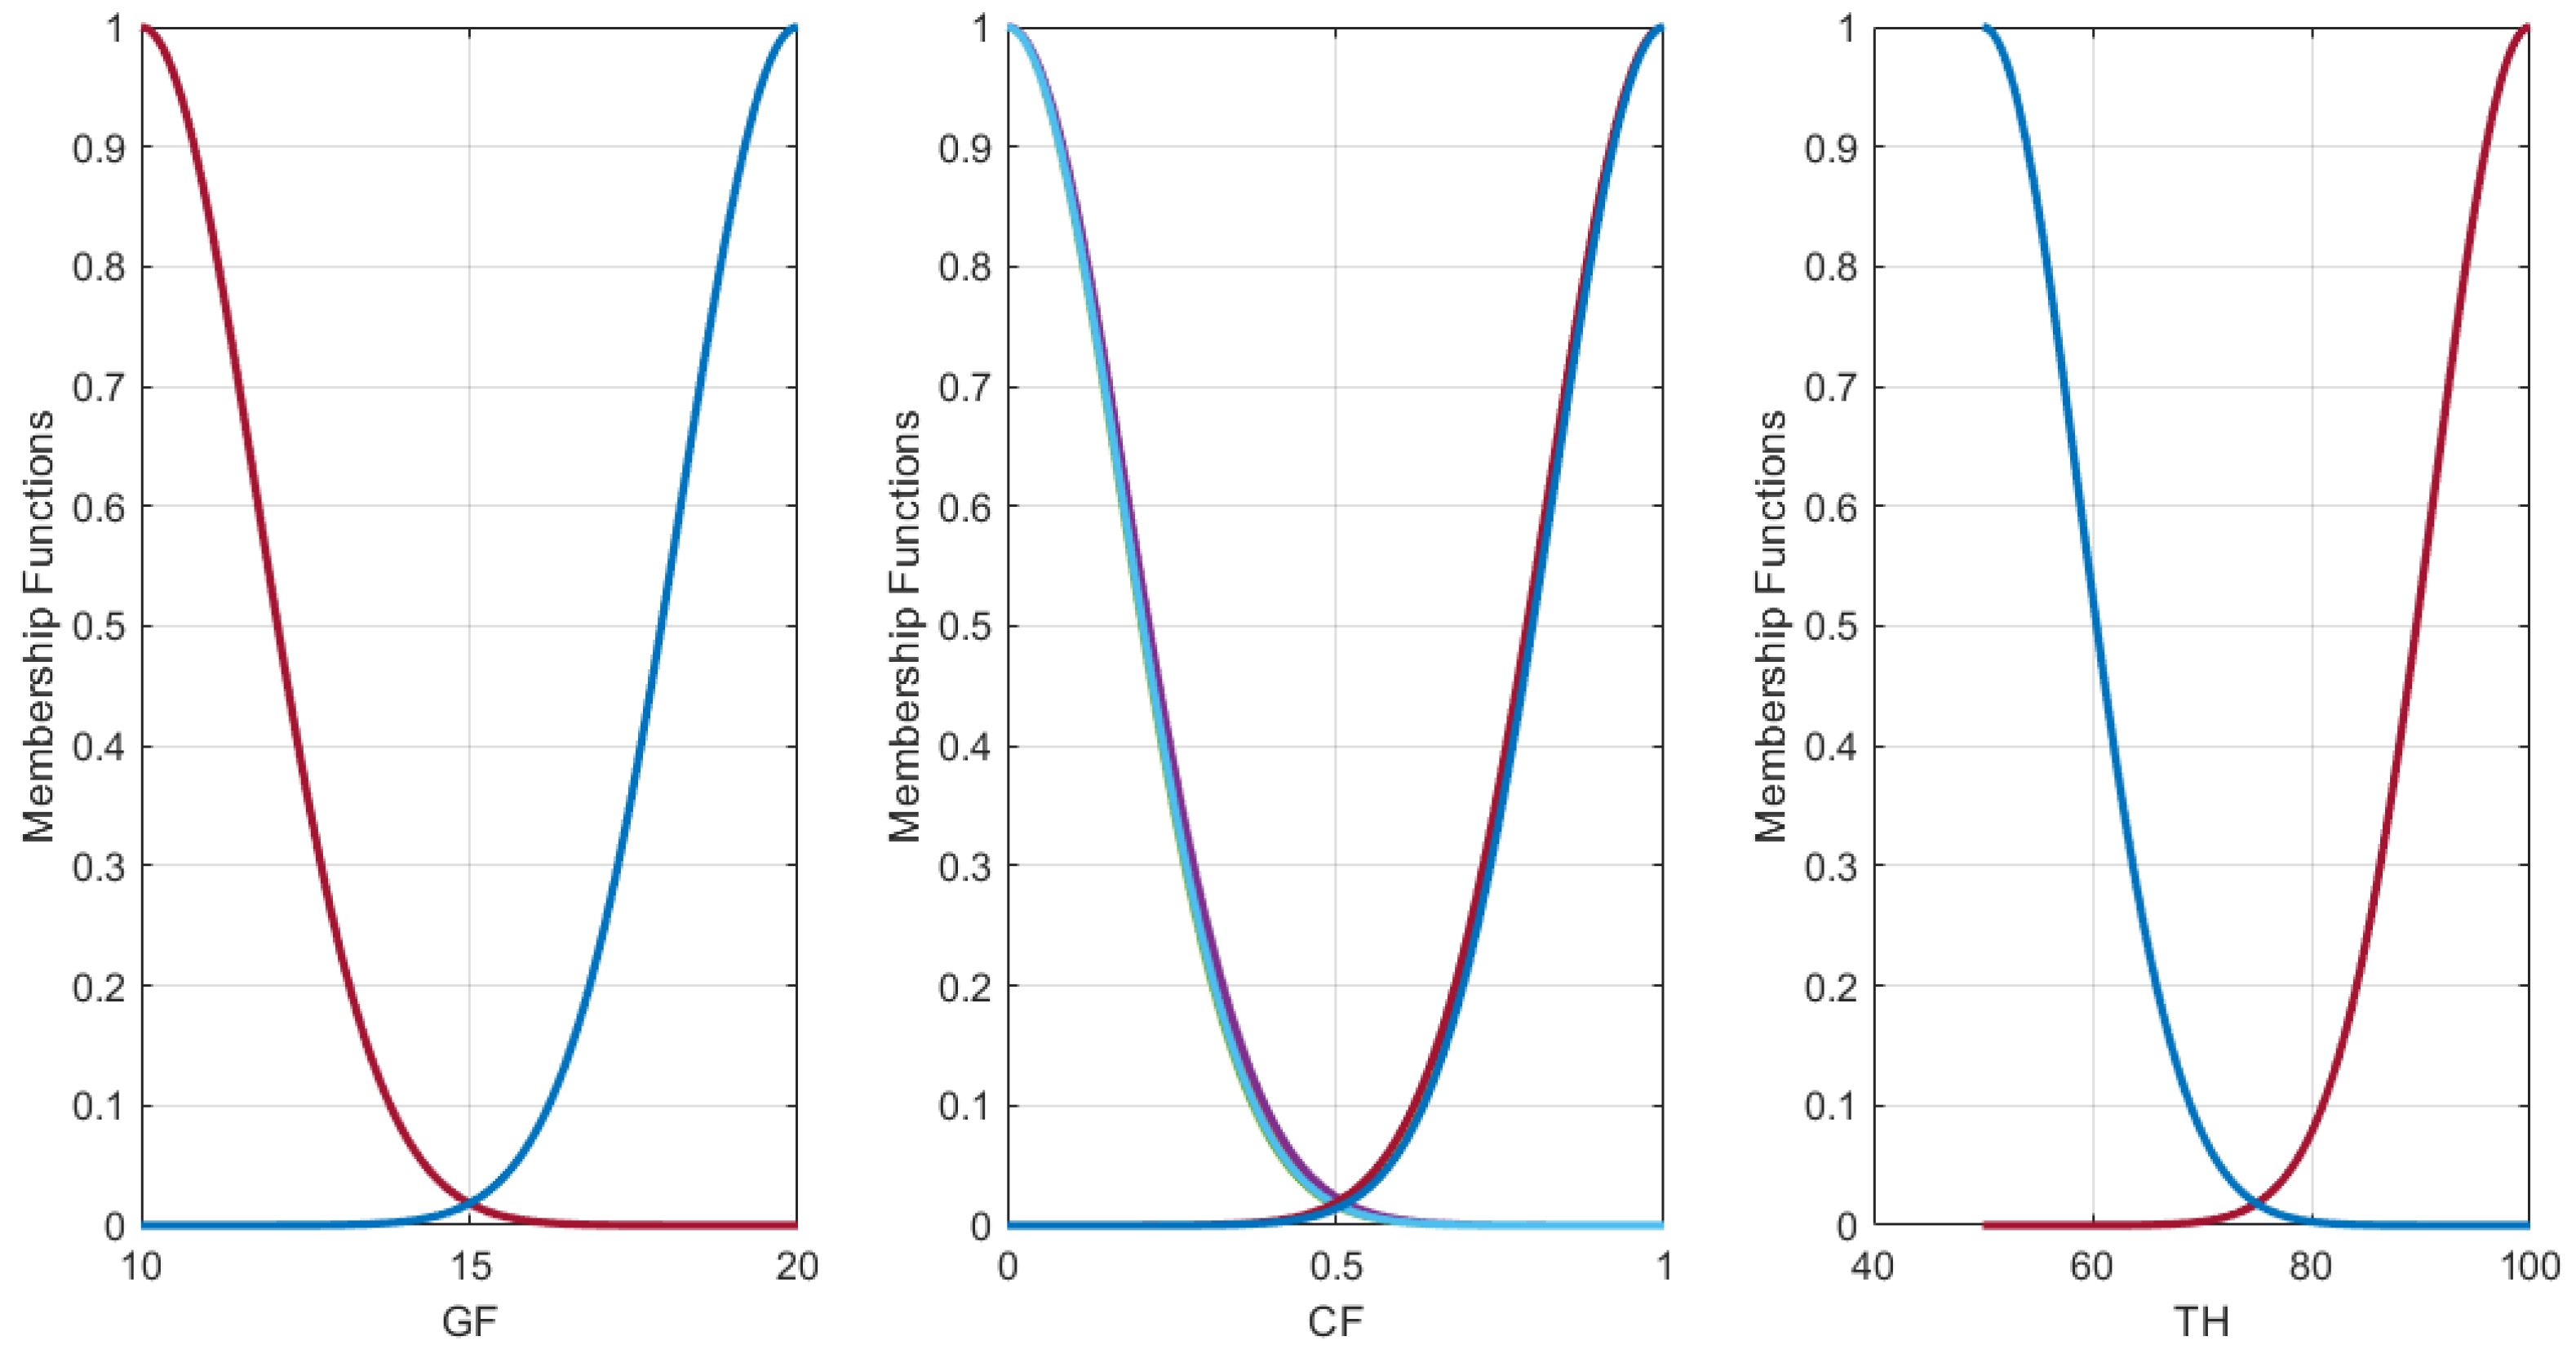
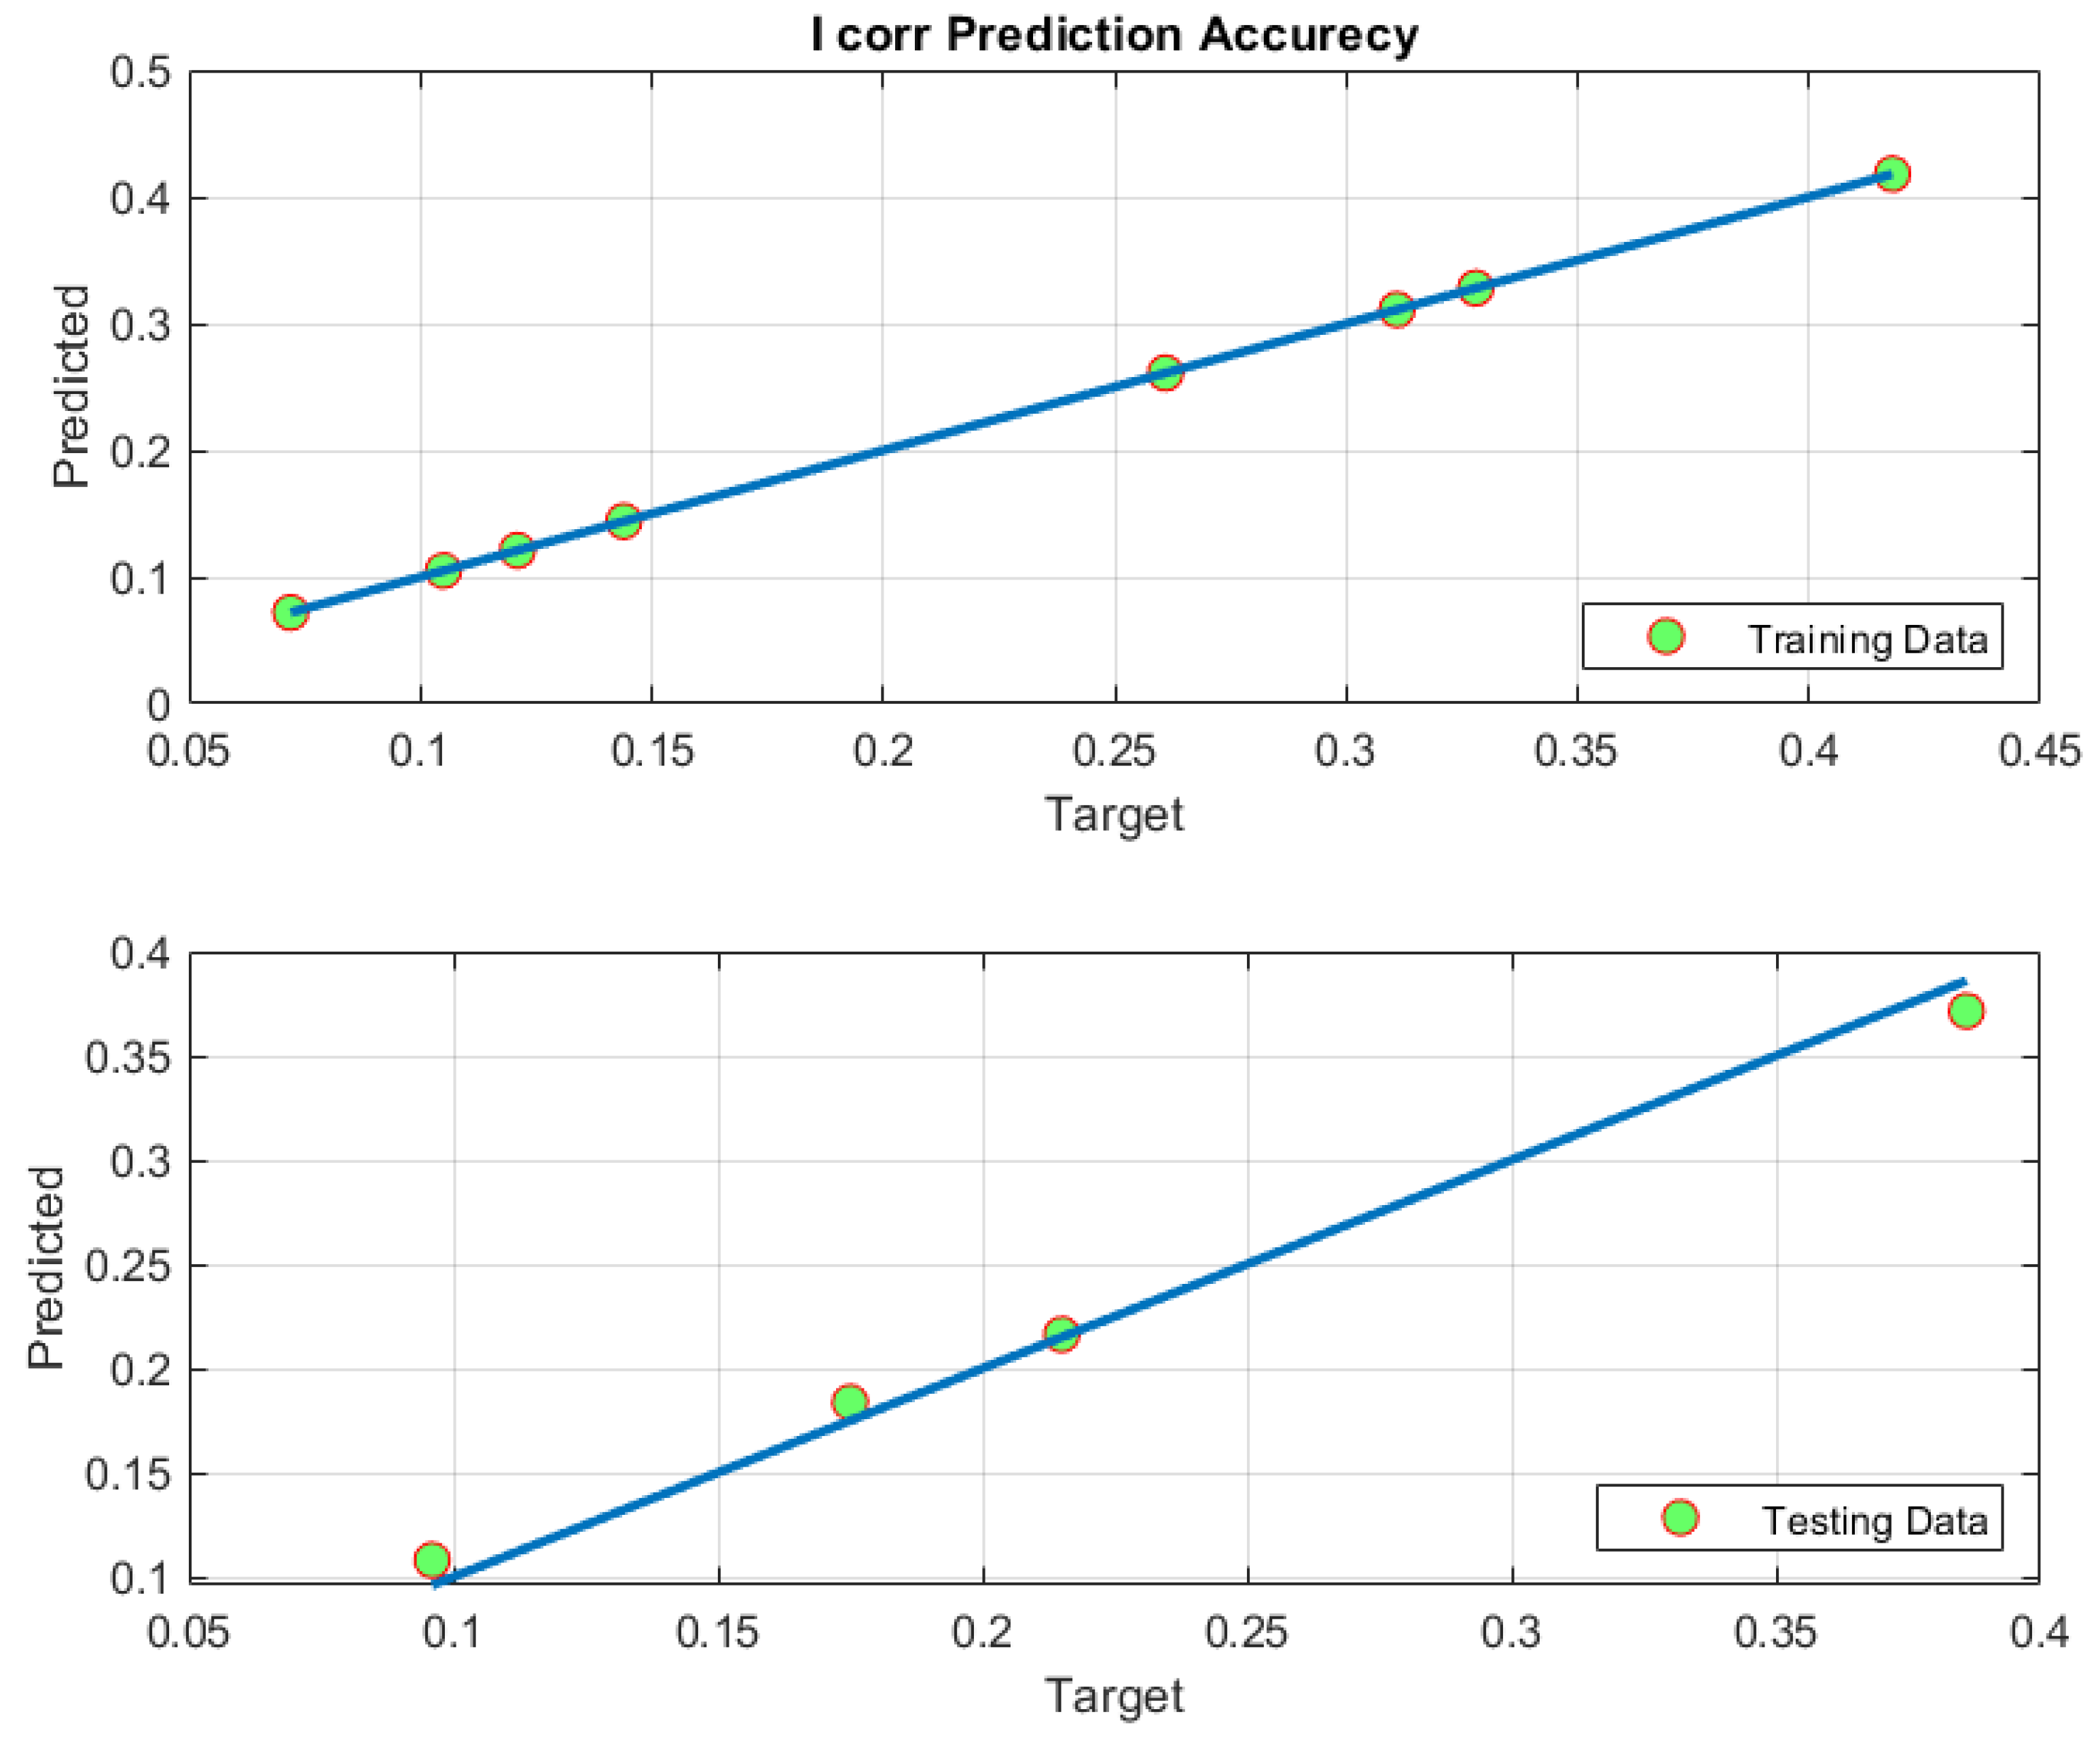
4.3. ANFIS-Based Modelling Results

To enhance the corrosion protection property, three parameters (glass flake loading, chemical functionalization, and coating thickness) were considered. Twelve experiments were carried out. The minimum obtained current density was 0.072. Based on these experimental data, in this paper, an ANFIS-based model was developed. The datasets are divided into two parts: 70% (training) and 30% (testing).
For the ANFIS-based model, the rule-base list was designed, applying a ‘subtractive clustering’ approach. The ANFIS model ended up with eight rules. The modelling procedure was conducted using the 12 datasets and trained for 10 epochs. The accuracy of the ANFIS-based model was evaluated using MSE, RMSE, and R2. The statistical assessment of the ANFIS model is presented in Table 4.
The MSEs values were 6.6244 × 10⁻¹⁵, 1.0848 × 10⁻⁴, and 3.6161 × 10⁻⁵ for training, testing, and total datasets, respectively. On the other hand, the RMSEs values were 8.1391 × 10⁻⁸, 0.0104, and 0.006 for training, testing, and total datasets, respectively. The R2 values were 1.00, 0.9997, and 0.9979 for training, testing, and total datasets, respectively. Therefore, throughout the training stage, the R2 increased from 0.9094 when applying an ANOVA to 1.000 when applying ANFIS (10% increase). Furthermore, throughout the testing stage, the R2 was increased from 0.8426 to 0.9997 (18.6% increase). This reinforces the model’s precision for tracking the data. Figure 4 demonstrates a comparison between the ANFIS-based model and experimental datasets. It seems obvious from the graph that the ANFIS-based model is typical with measured datasets, specifically for the testing datasets, which indicates that the ANFIS-based model is consistent.
Figure 5 shows the 3D surface of the ANFIS model. In fact, the plotting of the 3D surface with contours helps to investigate the relation between the inputs and the output appropriately. For more illustrations, Figure 5 presents the 3D surfaces for every two-input combination. The FL membership functions of inputs are presented in Figure 6.
Modelling precision was also examined to guarantee the performance of the ANFIS-based model for any different input datasets. To assess the prediction precision, the predictions of the ANFIS-based model were mapped versus the experimental datasets, as shown in Figure 7. Figure 7 illustrates that the ANFIS-based model predictions were distributed over the diagonal line, which is 100% precision.

4.4. Model Validation

An additional experiment was carried out to validate the model. The glass flake composites were prepared and evaluated according to the procedure described before. The composites were prepared using 240 mg of FGF, 0.5 B230, and 1.5 g BADGE, and the polarization result is depicted in Figure 8. The synthesis variables and the corrosion current density for the validation run is presented in Table 5. Referring to Table 5, the consistency of the ANFIS model of corrosion current density was demonstrated. The RMSE value was 0.08, which is an acceptable value.

5. Conclusions

Modelling the corrosion current density (CCD) as a first stage to improve the corrosion resistance properties of coatings, by identifying the best synthesis parameters, including the coating thickness, chemical functionalization, and glass flake loading, was the key objective of this paper. Using the experimental data, a precise ANFIS-based model was designed to simulate the corrosion current density. The modelling results reinforced the model precision for tracking the datasets and proved the superiority of ANFIS. The MSEs values were 6.6244 × 10⁻¹⁵, 1.0848 × 10⁻⁴, and 3.6161 × 10⁻⁵ for training, testing, and total data, respectively. On the other hand, RMSEs values were 8.1391 × 10⁻⁸, 0.0104, and 0.006 for training, testing, and total data, respectively. R2 values were 1.00, 0.9997, and 0.9979 for training, testing, and total datasets, respectively. To verify the superiority of the ANFIS-based model, the results were compared with the ANOVA model. Throughout the training stage, the R2 increased from 0.9094 when applying the ANOVA to 1.000 when applying ANFIS (10% increase). Furthermore, during the testing phase, R2 increased from 0.8426 to 0.9997 (18.6% increase). The RMSE values were 8.1391 × 10⁻⁸, 0.0104, and 0.006, for training, testing, and all datasets for ANFIS-based modelling of CCD, respectively. Conversely, the RMSE value was 0.4683 when applying ANOVA-based modelling. This confirms the superiority of ANFIS compared with the ANOVA in modelling the corrosion current density. Finally, the ANFIS model of corrosion current density has been validated experimentally, and the validation results demonstrated the consistency of the model.

Author Contributions

All authors collaborated and contributed equally to this work. All authors have read and agreed to the published version of the manuscript.

Funding

This project was funded by the Deanship of Scientific Research (DSR) at King Abdulaziz University, Jeddah, Saudi Arabia, under Grant No. (G 423-135-1442). The authors, therefore, acknowledge the DSR for technical and financial support.

Institutional Review Board Statement

Not applicable.

Informed Consent Statement

Not applicable.

Data Availability Statement

Not applicable.

Acknowledgments

The authors acknowledge the support provided by King Abdullah City for Atomic and Renewable Energy (K.A.CARE) under K.A.CARE-King Abdulaziz University Collaboration Program. The authors are also thankful to Deanship of Scientific Research (DSR) at King Abdulaziz University, Jeddah, Saudi Arabia, for financial support under Grant No. (G 423-135-1442).

Conflicts of Interest

The authors declare no conflict of interest.

References

  1. Casanova, L.; La Padula, M.; Pedeferri, M.; Diamanti, M.V.; Ormellese, M. An insight into the evolution of corrosion resistant coatings on titanium during bipolar plasma electrolytic oxidation in sulfuric acid. Electrochim. Acta 2021, 379, 138190. [Google Scholar] [CrossRef]
  2. Al Zoubi, W.; Kim, M.J.; Kim, Y.G.; Ko, Y.G. Dual-functional crosslinked polymer-inorganic materials for robust electrochemical performance and antibacterial activity. Chem. Eng. J. 2020, 392, 123654. [Google Scholar] [CrossRef]
  3. Cheng, Y.; Matykina, E.; Skeldon, P.; Thompson, G. Characterization of plasma electrolytic oxidation coatings on Zircaloy-4 formed in different electrolytes with AC current regime. Electrochim. Acta 2011, 56, 8467–8476. [Google Scholar] [CrossRef]
  4. Al Zoubi, W.; Kim, M.J.; Kim, Y.G.; Ko, Y.G. Enhanced chemical stability and boosted photoactivity by transition metal doped-crosslinked polymer-inorganic materials. J. Mol. Liq. 2020, 303, 112700. [Google Scholar] [CrossRef]
  5. Al Zoubi, W.; Allaf, A.W.; Assfour, B.; Ko, Y.G. Toward two-dimensional hybrid organic-inorganic materials based on a I-PE/UHV-PVD system for exceptional corrosion protection. Appl. Mater. Today 2021, 24, 101142. [Google Scholar] [CrossRef]
  6. Ying, L.; Wu, Y.; Nie, C.; Wu, C.; Wang, G. Improvement of the Tribological Properties and Corrosion Resistance of Epoxy–PTFE Composite Coating by Nanoparticle Modification. Coatings 2021, 11, 10. [Google Scholar] [CrossRef]
  7. Ma, L.; Wang, X.; Wang, J.; Zhang, J.; Yin, C.; Fan, L.; Zhang, D. Graphene oxide-cerium oxide hybrids for enhancement of mechanical properties and corrosion resistance of epoxy coatings. J. Mater. Sci. 2021, 56, 10108–10123. [Google Scholar] [CrossRef]
  8. Alhumade, H.; Nogueira, R.; Yu, A.; Elkamel, A.; Simon, L.; Abdala, A. Role of surface functionalization on corrosion resistance and thermal stability of epoxy/glass flake composite coating on cold rolled steel. Prog. Org. Coat. 2018, 122, 180–188. [Google Scholar] [CrossRef]
  9. Arora, S.; Sharma, B.; Srivastava, C. ZnCo-carbon nanotube composite coating with enhanced corrosion resistance behavior. Surf. Coat. Technol. 2020, 398, 126083. [Google Scholar] [CrossRef]
  10. Ehsani, M.; Khonakdar, H.; Ghadami, A. Assessment of morphological, thermal, and viscoelastic properties of epoxy vinyl ester coating composites: Role of glass flake and mixing method. Prog. Org. Coat. 2012, 76, 238–243. [Google Scholar] [CrossRef]
  11. Suleymani, M.; Bemani, A. Application of ANFIS-PSO algorithm as a novel method for estimation of higher heating value of biomass. Energy Sources Part A Recovery Util. Environ. Eff. 2018, 40, 288–293. [Google Scholar] [CrossRef]
  12. Alhumade, H.; Rezk, H.; Nassef, A.M.; Al-Dhaifallah, M. Fuzzy Logic Based-Modeling and Parameter Optimization for Improving the Corrosion Protection of Stainless Steel 304 by Epoxy-Graphene Composite. IEEE Access 2019, 7, 100899–100909. [Google Scholar] [CrossRef]
  13. Chou, J.-S.; Ngo, N.-T.; Chong, W.K. The use of artificial intelligence combiners for modeling steel pitting risk and corrosion rate. Eng. Appl. Artif. Intell. 2017, 65, 471–483. [Google Scholar] [CrossRef]
  14. Sheikh, M.F.; Kamal, K.; Rafique, F.; Sabir, S.; Zaheer, H.; Khan, K. Corrosion detection and severity level prediction using acoustic emission and machine learning based approach. Ain Shams Eng. J. 2021, 12, 3891–3903. [Google Scholar] [CrossRef]
  15. Valdez, F.; Vazquez, J.C.; Melin, P.; Castillo, O. Comparative study of the use of fuzzy logic in improving particle swarm optimization variants for mathematical functions using co-evolution. Appl. Soft Comput. 2017, 52, 1070–1083. [Google Scholar] [CrossRef]
  16. Gaxiola, F.; Melin, P.; Valdez, F.; Castro, J.R.; Castillo, O. Optimization of type-2 fuzzy weights in backpropagation learning for neural networks using GAs and PSO. Appl. Soft Comput. 2016, 38, 860–871. [Google Scholar] [CrossRef]
  17. Manna, J.; Roy, B.; Sharma, P. Efficient hydrogen generation from sodium borohydride hydrolysis using silica sulfuric acid catalyst. J. Power Sources 2015, 275, 727–733. [Google Scholar] [CrossRef]
  18. Li, Z.; Wang, R.; Young, R.; Deng, L.; Yang, F.; Hao, L.; Jiao, W.; Liu, W. Control of the functionality of graphene oxide for its application in epoxy nanocomposites. Polymer 2013, 54, 6437–6446. [Google Scholar] [CrossRef]
Figure 1. FTIR spectra of GF, FGF, E/GF, and E/FGF.
Metals 12 00392 g001
Figure 2. XRD patterns of the epoxy, E/GF, and E/FGF.
Metals 12 00392 g002
Figure 3. Predicted versus actual values for the CCD model.
Metals 12 00392 g003
Figure 4. A comparison between the ANFIS-based model and experimental datasets.
Metals 12 00392 g004
Figure 5. The 3D spatial shape that relates to the input controlling parameters.
Metals 12 00392 g005
Figure 6. The ANFIS-based model inputs’ MFs.
Metals 12 00392 g006
Figure 7. The prediction precision of the ANFIS-based model.
Metals 12 00392 g007
Figure 8. The polarization measurement for the validation run.
Metals 12 00392 g008
Table 1. Synthesis parameters for E/GF and E/FGF composite coatings.
RunA: Load of Filler (wt%) B: Type of FillerC: Coating Thickness (+/−5 µm)Icorr (µA/cm2)
110GF500.418
210FGF500.261
310GF1000.311
410FGF1000.144
515GF500.386
615FGF500.175
715GF1000.215
815FGF1000.096
920GF500.328
1020FGF500.105
1120GF1000.121
1220FGF1000.072
Table 2. ANOVA-based model of corrosion current density.
SourceSum of SquaresdfMean SquareF-Valuep-Value
Model0.146230.048737.79<0.0001significant
A (Load of Filler, wt%)0.032310.032325.020.0011
B (Type of Filler)0.071510.071555.42<0.0001
C (Coating Thickness, µm)0.042510.042532.950.0004
Residual0.010380.0013
Cor Total0.156511
Table 3. The statistical analysis of the CCD-based ANOVA model.
ANOVA Model of CCD
Std. Dev.0.0359R20.9341
MSE0.2193Adjusted R20.9094
C.V.%16.37Predicted R20.8426
RMSE0.4683Adeq Precision19.3102
Table 4. The statistical assessment of the ANFIS model.
MSE RMSE R2
TrainingTestingAllTrainingTestingAllTrainingTestingAll
6.6244 × 10−151.0848 × 10−43.6161 × 10−58.1391 × 10−80.01040.00601.0000.99970.9979
Table 5. Model validation results.
MethodGF (Glass Flake Loading, wt%)CF (Chemical Functionalization)TH (Coating Thickness, µm)Icorr
(µA/cm2)
RMSE
ANFIS model 121750.2480.08
Measured data 121750.241-
Publisher’s Note: MDPI stays neutral with regard to jurisdictional claims in published maps and institutional affiliations.

