
Effect of Natural Aging on Precipitation Strengthening Behaviors in Al-Mg-Si Alloy

Abstract
:1. Introduction
2. Materials and Methods
3. Results and Discussion
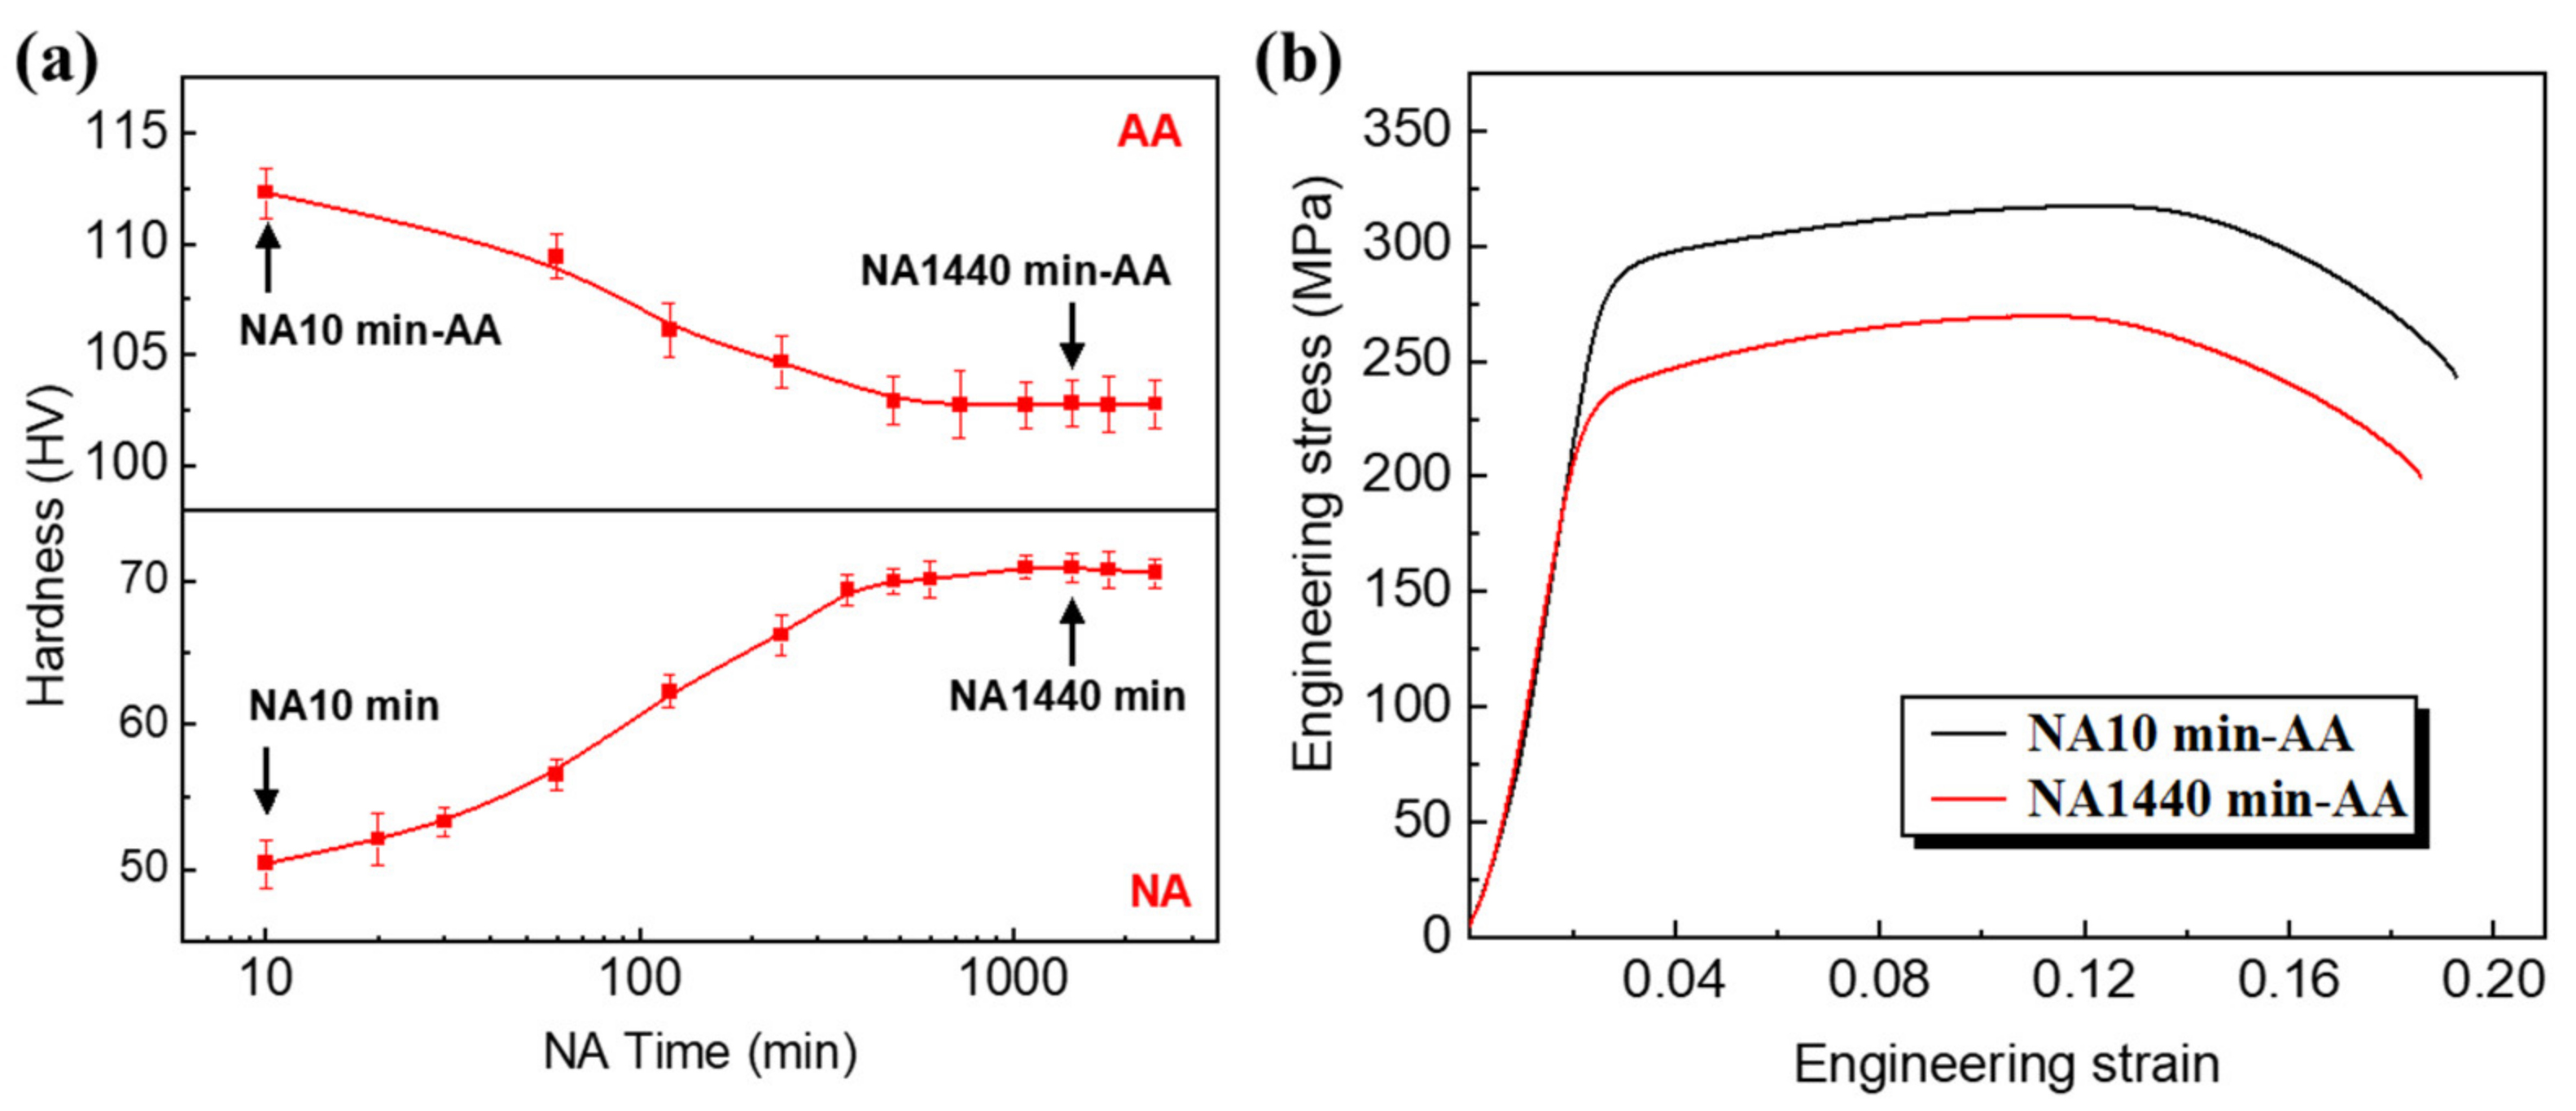
3.1. The Negative Effect of NA on the Alloy Strength
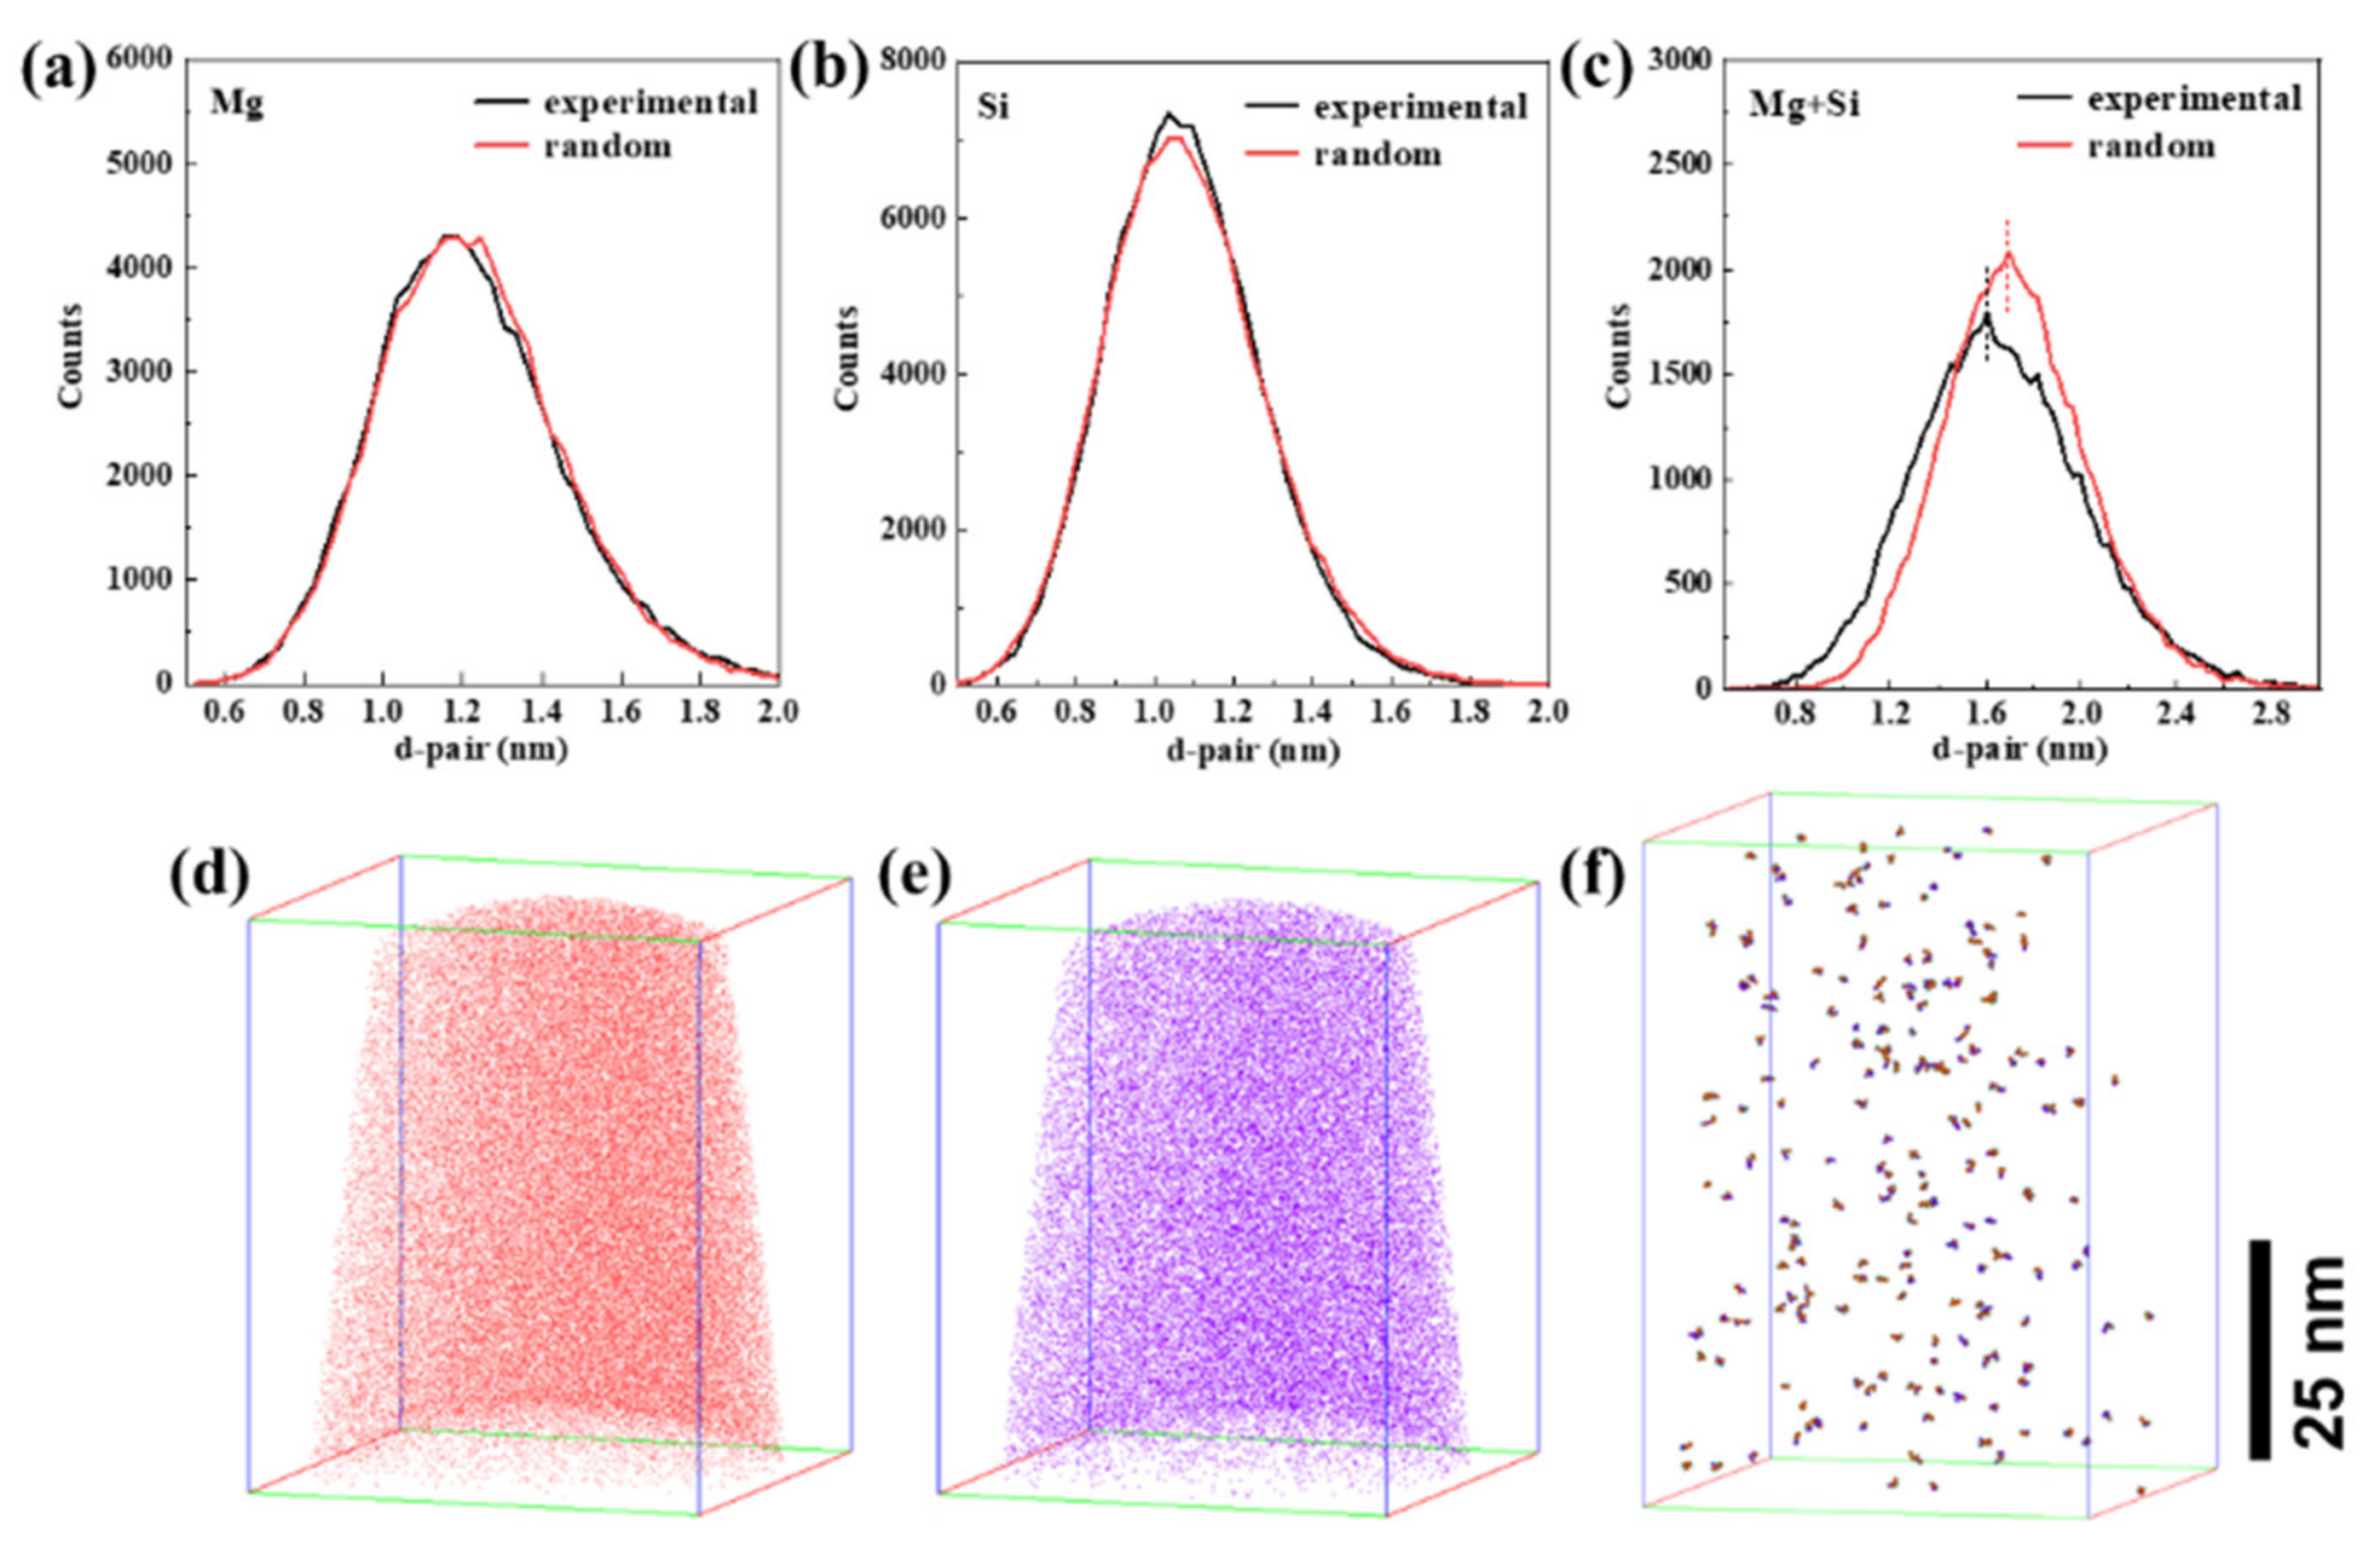
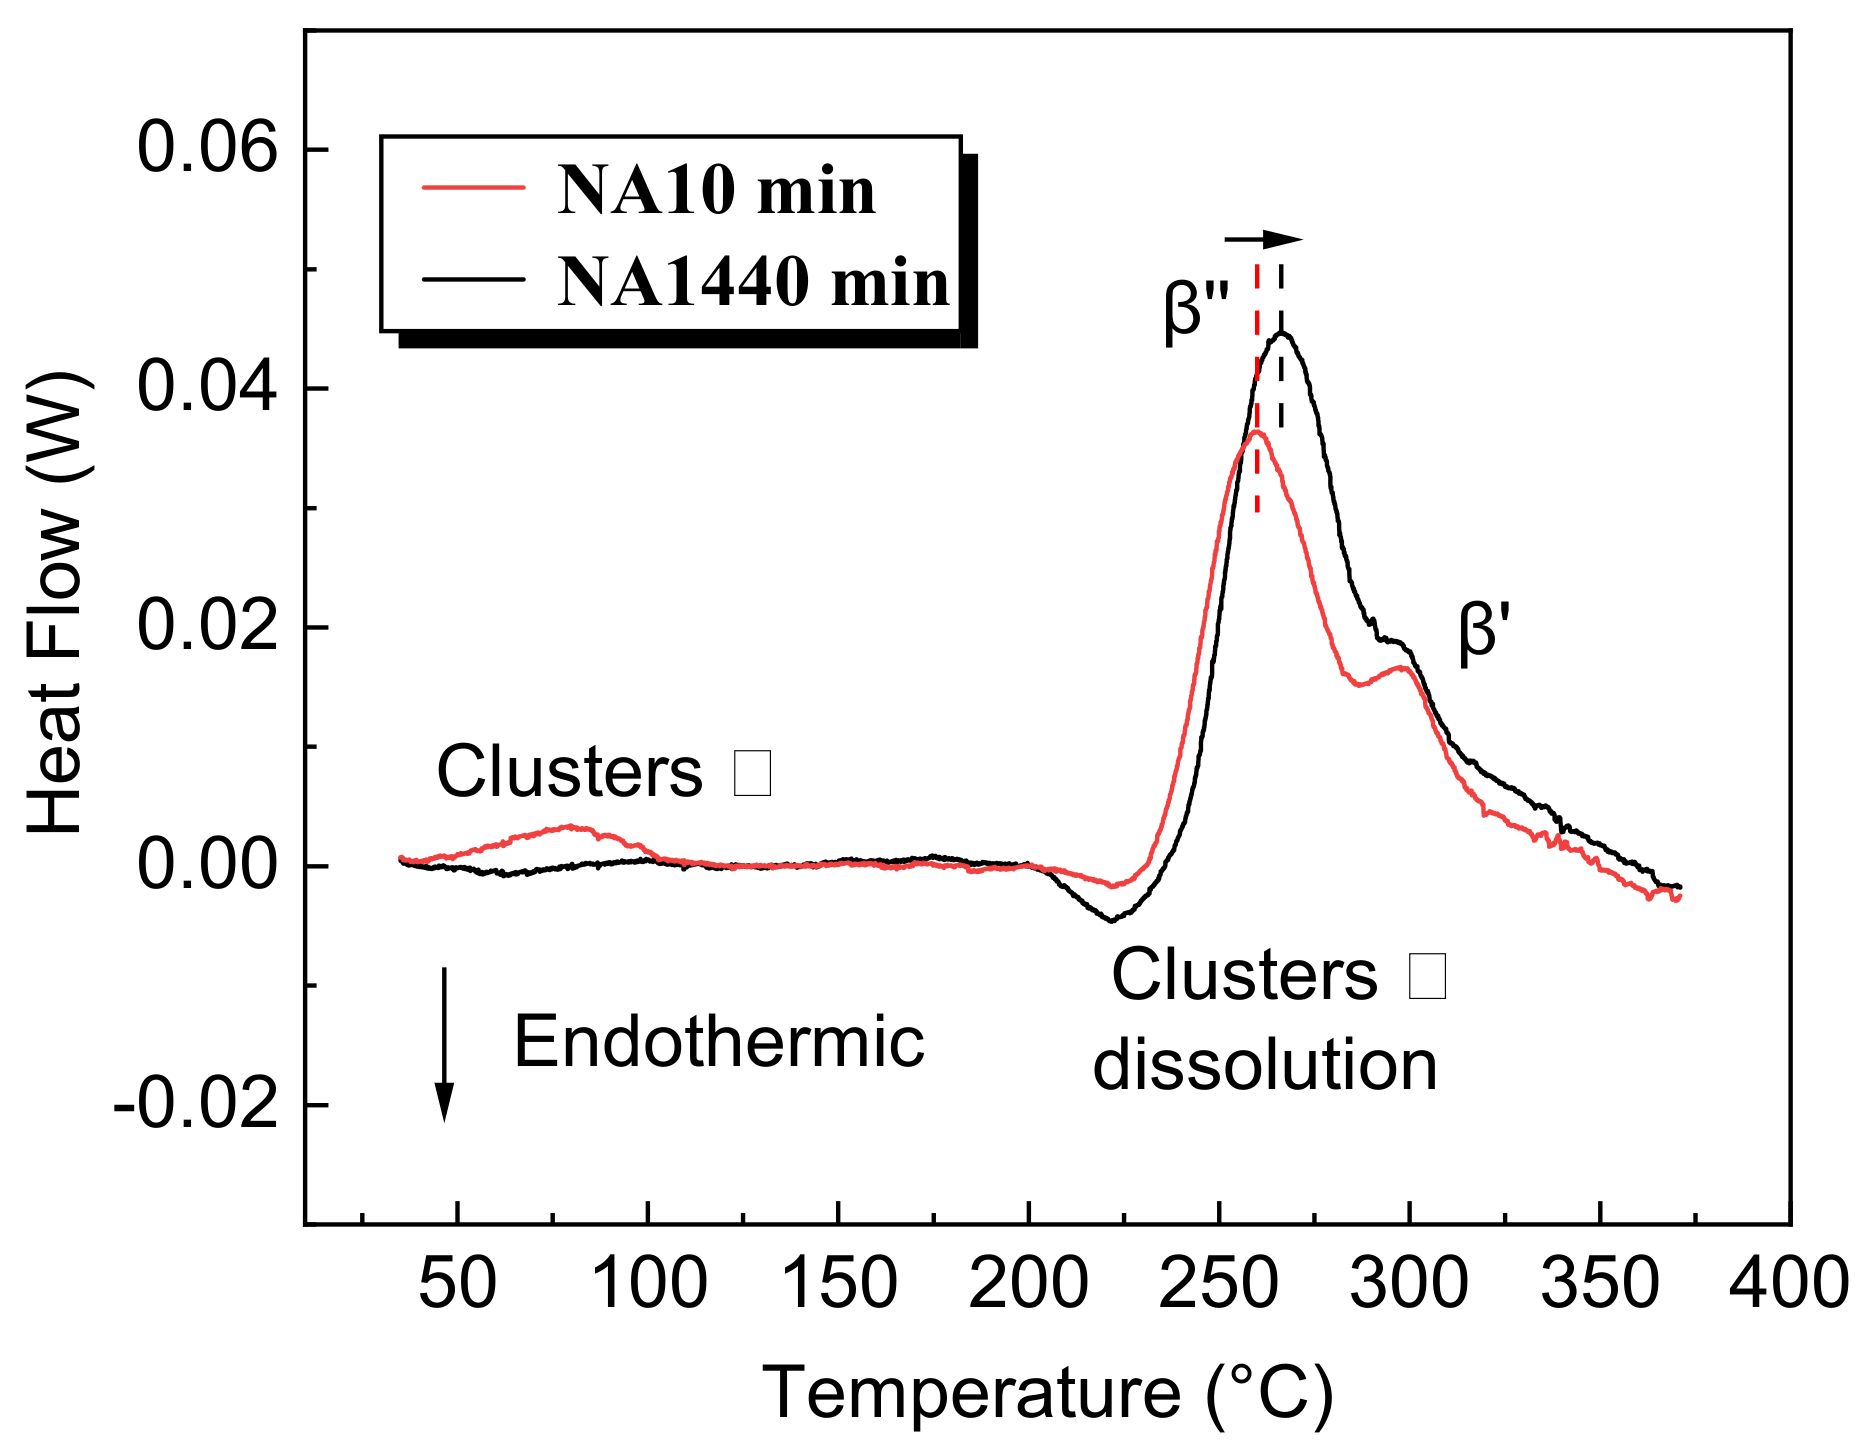
3.2. The Influence of NA on Clusters
3.3. The Influence of NA on Precipitates
3.3.1. TEM Images
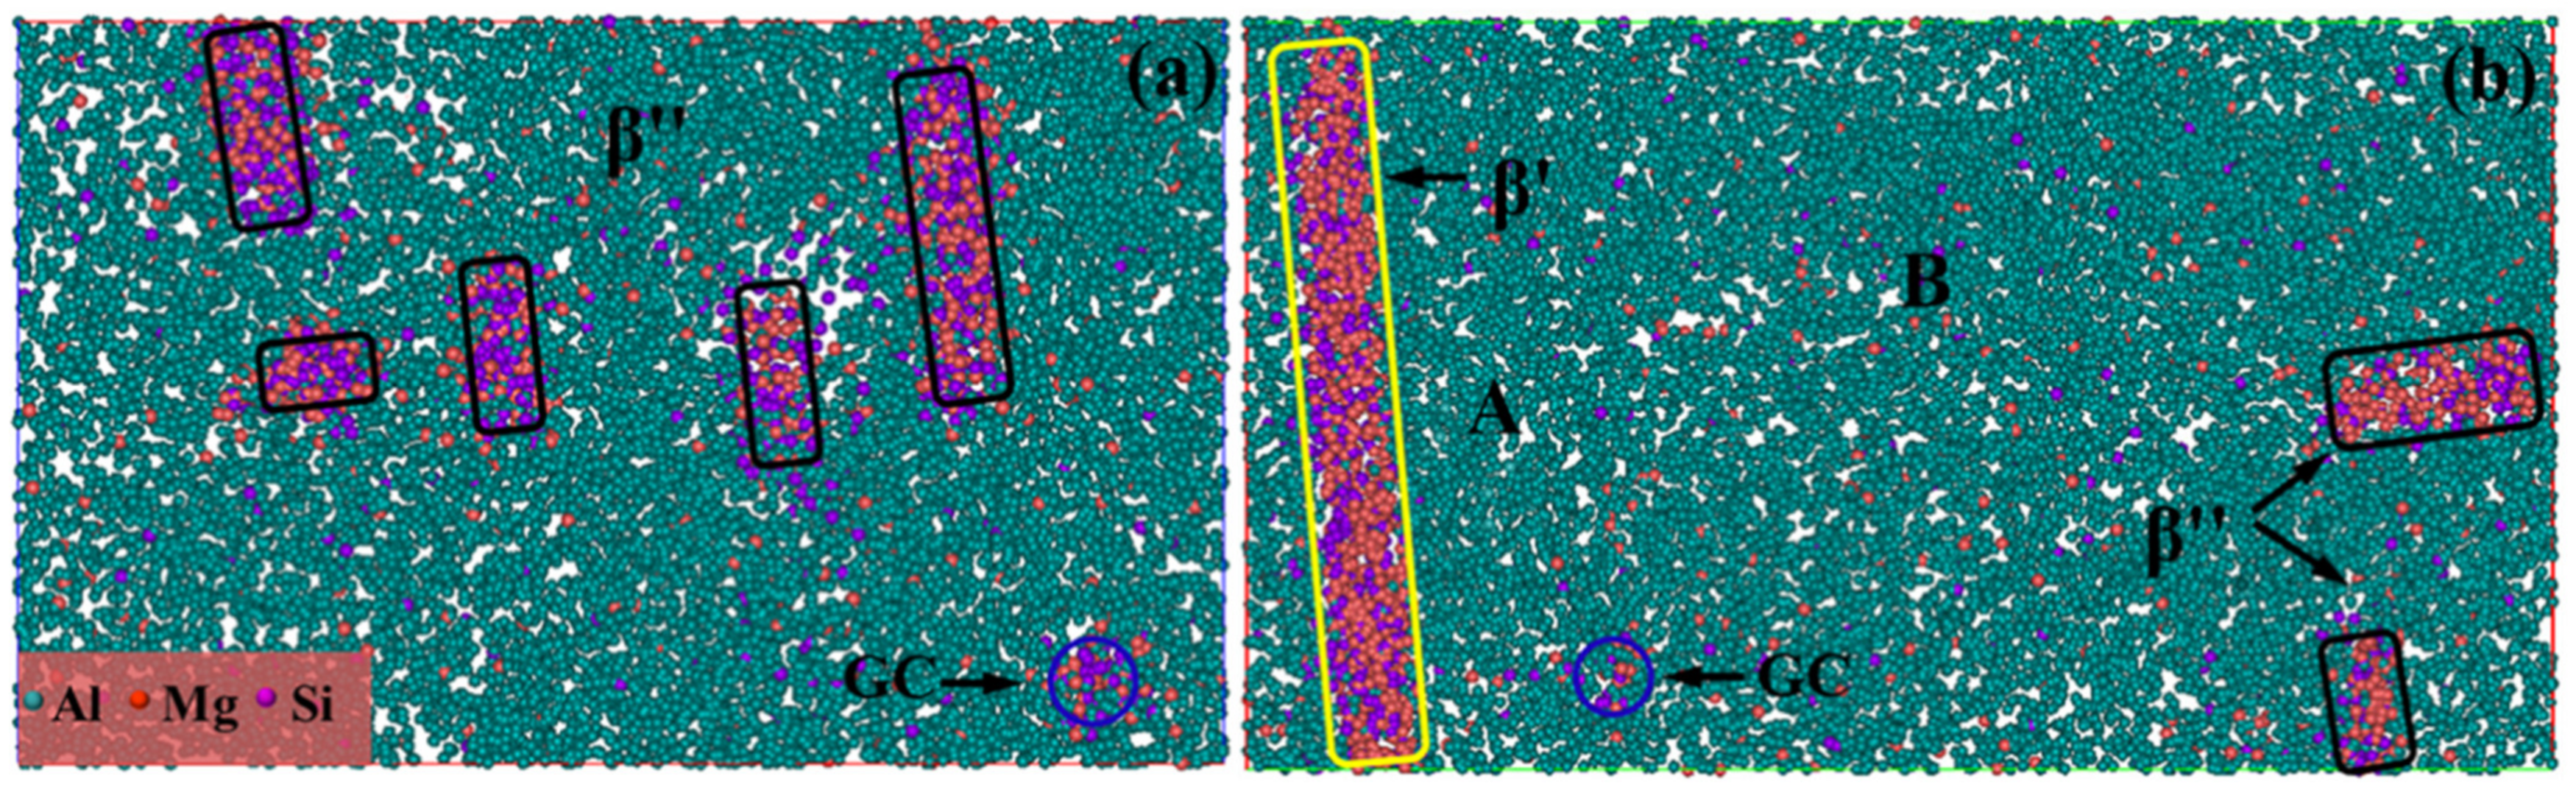
3.3.2. APT Maps
3.4. Size and Volume Fractions of Precipitates
3.5. The Contribution from Different Precipitates to the Alloy Strength
3.6. Reasons for the Occurance of Lower Strength in the NA1440 min-AA Sample
4. Conclusions
- (1)
- Separation of the contribution from different types of precipitates to the alloy strength was evaluated in this work. At the NA10 min-AA, the yield strength is mainly derived from which is 221 MPa. At the NA1440 min-AA, β′ with a volume fraction of 0.16% contribute 54 MPa to the yield strength, while 0.14% β″ contributes 101 MPa. This fully demonstrates that β″ is the main strengthening phase in Al-Mg-Si alloy, and the appearance of large-sized β′ is a major cause of the decreased strength.
- (2)
- Growth of the GP zone and clusters between β′ during AA can be restrained because the surrounding solute atoms are more easily captured by large-sized β′. Therefore, such a GP zone and clusters will be wrapped by more Al atoms, which explains the survival of a greater GP zone and more clusters in NA1440 min-AA.
- (3)
- The nature of the clusters during NA is considered to be responsible for the reduced strength of the alloy after AA. Owing to the instability of NA clusters and reduction in nucleation driving force, the nucleation sites are decreased, so that more solute atoms remain in the matrix. The strengthening of the solid solution atoms is much smaller than that of the large-sized β′, and large-sized β′ is much smaller than that of fine β″. This is the fundamental reason for the significant decrease in the strength of NA1440 min-AA.
Supplementary Materials
Author Contributions
Funding
Data Availability Statement
Conflicts of Interest
References
- Li, H.; Mao, Q.Z.; Wang, Z.X.; Miao, F.F.; Fang, B.J.; Song, R.G.; Zheng, Z. Simultaneously enhancing the tensile properties and intergranular corrosion resistance of Al–Mg–Si–Cu alloys by a thermo-mechanical treatment. Mat. Sci. Eng. A Struct. 2014, 617, 165–174. [Google Scholar] [CrossRef]
- Kumar, N.; Goel, S.; Jayaganthan, R.; Brokmeier, H.G. Effect of grain boundary misorientaton, deformation temperature and AlFeMnSi-phase on fatigue life of 6082 Al alloy. Mater. Charact. 2017, 124, 229–240. [Google Scholar] [CrossRef]
- Guo, M.X.; Du, J.Q.; Zheng, C.H.; Zhang, J.S.; Zhuang, L.Z. Influence of Zn contents on precipitation and corrosion of Al-Mg-Si-Cu-Zn alloys for automotive applications. J. Alloy Compd. 2019, 778, 256–270. [Google Scholar] [CrossRef]
- Ding, L.; Jia, Z.H.; Nie, J.F.; Weng, Y.Y.; Cao, L.F.; Chen, H.W.; Wu, X.Z.; Liu, Q. The structural and compositional evolution of precipitates in Al-Mg-Si-Cu alloy. Acta Mater. 2018, 145, 437–450. [Google Scholar] [CrossRef]
- Edwards, G.A.; Stiller, K.; Dunlop, G.L.; Couper, M.J. The precipitation sequence in Al-Mg-Si alloys. Acta Mater. 1998, 46, 3893–3904. [Google Scholar] [CrossRef]
- Andersen, S.J.; Marioara, C.D.; Friis, J.; Wenner, S.; Holmestad, R. Precipitates in aluminium alloys. Adv. Phys. X 2018, 3. [Google Scholar] [CrossRef]
- Buchanan, K.; Colas, K.; Ribis, J.; Lopez, A.; Garnier, J. Analysis of the metastable precipitates in peak-hardness aged Al-Mg-Si(-Cu) alloys with differing Si contents. Acta Mater. 2017, 132, 209–221. [Google Scholar] [CrossRef]
- Andersen, S.J.; Marioara, C.D.; Vissers, R.; Froseth, A.; Zhandbergen, H.W. The structural relation between precipitates in Al-Mg-Si alloys, the Al-matrix and diamond silicon, with emphasis on the trigonal phase U1-MgAl2Si2. Mat. Sci. Eng. A Struct. 2007, 444, 157–169. [Google Scholar] [CrossRef]
- Yang, W.; Wang, M.P.; Zhang, R.R.; Zhang, Q.; Sheng, X.F. The diffraction patterns from β″ precipitates in 12 orientations in Al-Mg-Si alloy. Scripta Mater. 2010, 62, 705–708. [Google Scholar] [CrossRef]
- Royset, J.; Stenne, T.; Sater, J.A.; Reiso, O. The effect of intermediate storage temperature and time on the age hardening response of Al-Mg-Si alloys. Mater. Sci. Forum 2006, 519–521, 239–244. [Google Scholar] [CrossRef]
- Tao, G.H.; Liu, C.H.; Chen, J.H.; Lai, Y.X.; Ma, P.P.; Liu, L.M. The influence of Mg/Si ratio on the negative natural aging effect in Al–Mg–Si–Cu alloys. Mat. Sci. Eng. A Struct. 2015, 642, 241–248. [Google Scholar] [CrossRef]
- Tu, W.B.; Tang, J.G.; Ye, L.Y.; Cao, L.F.; Zeng, Y.; Zhu, Q.Q.; Zhang, Y.; Liu, S.D.; Ma, L.H.; Lu, J.K.; et al. Effect of the natural aging time on the age-hardening response and precipitation behavior of the Al-0.4Mg-1.0Si-(Sn) alloy. Mater. Design 2021, 198, 109307. [Google Scholar] [CrossRef]
- Aruga, Y.; Kozuka, M.; Takaki, Y.; Sato, T. Formation and reversion of clusters during natural aging and subsequent artificial aging in an Al-Mg-Si alloy. Mat. Sci. Eng. A Struct. 2015, 631, 86–96. [Google Scholar] [CrossRef]
- Zurob, H.S.; Seyedrezai, H. A model for the growth of solute clusters based on vacancy trapping. Scripta Mater. 2009, 61, 141–144. [Google Scholar] [CrossRef]
- Cui, Z.J.; Jiang, H.C.; Zhang, D.; Song, Y.Y.; Yan, D.S.; Rong, L.J. Influence of Mn on the negative natural aging effect in 6082 Al alloy. Mat. Sci. Eng. A Struct. 2020, 793, 139874. [Google Scholar] [CrossRef]
- Cao, L.; Rometsch, P.A.; Couper, M.J. Clustering behaviour in an Al–Mg–Si–Cu alloy during natural ageing and subsequent under-ageing. Mat. Sci. Eng. A Struct. 2013, 559, 257–261. [Google Scholar] [CrossRef]
- Dumitraschkewitz, P.; Uggowitzer, P.J.; Gerstl, S.S.A.; Loffler, J.F.; Pogatscher, S. Size-dependent diffusion controls natural aging in aluminium alloys. Nat. Commun. 2019, 10. [Google Scholar] [CrossRef] [Green Version]
- Starink, M.J.; Cao, L.F.; Rometsch, P.A. A model for the thermodynamics of and strengthening due to co-clusters in Al–Mg–Si-based alloys. Acta Mater. 2012, 60, 4194–4207. [Google Scholar] [CrossRef] [Green Version]
- Seyedrezai, H.; Grebennikov, D.; Mascher, P.; Zurob, H.S. Study of the early stages of clustering in Al-Mg-Si alloys using the electrical resistivity measurements. Mat. Sci. Eng. A Struct. 2009, 525, 186–191. [Google Scholar] [CrossRef]
- Madanat, M.; Liu, M.; Banhart, J. Reversion of natural ageing in Al-Mg-Si alloys. Acta Mater. 2018, 159, 163–172. [Google Scholar] [CrossRef]
- Chang, C.S.T.; Banhart, J. Low-Temperature Differential Scanning Calorimetry of an Al-Mg-Si Alloy. Metall. Mater. Trans. A 2011, 42, 1960–1964. [Google Scholar] [CrossRef]
- Noseda Grau, V.; Cuniberti, A.; Tolley, A.; Castro Riglos, V.; Stipcich, M. Solute clustering behavior between 293 K and 373 K in a 6082 Aluminum alloy. J. Alloy Compd. 2016, 684, 481–487. [Google Scholar] [CrossRef]
- Gupta, A.K.; Lloyd, D.J.; Court, S.A. Precipitation hardening in Al-Mg-Si alloys with and without excess Si. Mat. Sci. Eng. A Struct. 2001, 316, 11–17. [Google Scholar] [CrossRef]
- Zhang, Z.; Xu, H.H.; Wu, S.N.; Liu, Y. Effects of combined pre-straining and pre-aging on natural aging and bake hardening response of an Al-Mg-Si alloy. Acta Metall. Sin Engl. 2013, 26, 340–344. [Google Scholar] [CrossRef] [Green Version]
- Vissers, R.; Van Huis, M.A.; Jansen, J.; Zandbergen, H.W.; Marioara, C.D.; Andersen, S.J. The crystal structure of the β′ phase in Al-Mg-Si alloys. Acta Mater. 2007, 55, 3815–3823. [Google Scholar] [CrossRef]
- Sha, G.; Moller, H.; Stumpf, W.E.; Xia, J.H.; Govender, G.; Ringer, S.P. Solute nanostructures and their strengthening effects in Al–7Si–0.6Mg alloy F357. Acta Mater. 2012, 60, 692–701. [Google Scholar] [CrossRef] [Green Version]
- Buha, J.; Lumley, R.N.; Crosky, A.G. Precipitation and solute distribution in an interrupted-aged Al–Mg–Si–Cu alloy. Philos. Mag. 2008, 88, 373–390. [Google Scholar] [CrossRef]
- Teichmann, K.; Marioara, C.D.; Andersen, S.J.; Marthinsen, K. TEM study of β′ precipitate interaction mechanisms with dislocations and β′ interfaces with the aluminium matrix in Al-Mg-Si alloys. Mater Charact. 2013, 75, 1–7. [Google Scholar] [CrossRef]
- Yang, M.; Chen, H.N.; Orekhov, A.; Lu, Q.; Lan, X.Y.; Li, K.; Zhang, S.Y.; Song, M.; Kong, Y.; Schryvers, D.; et al. Quantified contribution of β″ and β′ precipitates to the strengthening of an aged Al-Mg-Si alloy. Mat. Sci. Eng. A Struct. 2020, 774, 138776. [Google Scholar] [CrossRef]
- Esmaeili, S.; Lloyd, D.J.; Poole, W.J. Modeling of precipitation hardening for the naturally aged Al-Mg-Si-Cu alloy AA6111. Acta Mater. 2003, 51, 3467–3481. [Google Scholar] [CrossRef]
- Marceau, R.K.W.; Vaucorbeil, A.; Sha, G.; Ringer, S.P.; Poole, W.J. Analysis of strengthening in AA6111 during the early stages of aging: Atom probe tomography and yield stress modelling. Acta Mater. 2013, 61, 7285–7303. [Google Scholar] [CrossRef]
- Ardell, A.J. Precipitation Hardening. Metall. Trans. A 1985, 16A, 1985–2131. [Google Scholar] [CrossRef]
- Song, M. Modeling the hardness and yield strength evolutions of aluminum alloy with rod/needle-shaped precipitates. Mat. Sci. Eng. A Struct. 2007, 443, 172–177. [Google Scholar] [CrossRef]
- Guo, M.X.; Du, J.Q.; Zheng, C.H.; Zhang, J.S.; Zhuang, L.Z. Solute clustering in Al-Mg-Si-Cu-(Zn) alloys during aging. J. Alloy. Compd. 2019, 774, 347–363. [Google Scholar] [CrossRef]
- Myhr, O.R.; Grong, Ø.; Andersen, S.J. Modelling of the age hardening behaviour of Al–Mg–Si alloys. Acta Mater. 2001, 49, 65–75. [Google Scholar] [CrossRef]


| Samples | Precipitates | R/nm | Vf1 | Solute in Matrix 1 |
|---|---|---|---|---|
| NA10 min-AA | GC | 0.82 ± 0.13 1 | 0.02% | 0.45 wt% Mg 0.26 wt% Si |
| β″ | 1.93 ± 0.16 2 | 0.74% | ||
| Sum | - | 0.76% | ||
| NA1440 min-AA | GC | 0.43 ± 0.08 1 | 0.07% | 0.61 wt% Mg 0.35 wt% Si |
| β″ | 2.15 ± 0.11 2 | 0.14% | ||
| β′ | 3.23 ± 0.27 2 | 0.16% | ||
| Sum | - | 0.37% |
| Strength (MPa) | NA10 min-AA | NA1440 min-AA | |
|---|---|---|---|
| σmod | 14.6 | 6.5 | |
| σchem | 0.7 | 0.3 | |
| σcoh | 206.1 | 94.6 | |
| Sum | 221 | 101 | |
| σmod | - | 13.3 | |
| σchem | 0.7 | ||
| σcoh | 40.1 | ||
| Sum | 54 | ||
| σGC | 2.3 | 4.2 | |
| σs | 44.0 | 53.8 | |
| σi | 10.0 | 10.0 | |
| σy | 277 | 223 | |
| 280 | 230 | ||
Publisher’s Note: MDPI stays neutral with regard to jurisdictional claims in published maps and institutional affiliations. |
© 2022 by the authors. Licensee MDPI, Basel, Switzerland. This article is an open access article distributed under the terms and conditions of the Creative Commons Attribution (CC BY) license (https://creativecommons.org/licenses/by/4.0/).
Share and Cite
Cui, Z.; Jiang, H.; Zhang, D.; Song, Y.; Yan, D.; Rong, L. Effect of Natural Aging on Precipitation Strengthening Behaviors in Al-Mg-Si Alloy. Metals 2022, 12, 470. https://doi.org/10.3390/met12030470
Cui Z, Jiang H, Zhang D, Song Y, Yan D, Rong L. Effect of Natural Aging on Precipitation Strengthening Behaviors in Al-Mg-Si Alloy. Metals. 2022; 12(3):470. https://doi.org/10.3390/met12030470
Chicago/Turabian StyleCui, Zhenjie, Haichang Jiang, Duo Zhang, Yuanyuan Song, Desheng Yan, and Lijian Rong. 2022. "Effect of Natural Aging on Precipitation Strengthening Behaviors in Al-Mg-Si Alloy" Metals 12, no. 3: 470. https://doi.org/10.3390/met12030470