Article

On the Short-Term Creep Response at 482 °C (900 °F) of the 17-4PH Steel Produced by Bound Metal Deposition

by
Valerio Di Pompeo
,
Alberto Santoni
,
Eleonora Santecchia
and
Stefano Spigarelli
*
DIISM, Università Politecnica delle Marche, Via Brecce Bianche 12, 60131 Ancona, Italy
*
Author to whom correspondence should be addressed.
Metals 2022, 12(3), 477; https://doi.org/10.3390/met12030477
Submission received: 22 February 2022 / Revised: 7 March 2022 / Accepted: 9 March 2022 / Published: 11 March 2022
(This article belongs to the Special Issue New Horizons in High-Temperature Deformation of Metals and Alloys)

Abstract

:
The creep response of the 17-4PH precipitation hardening steel produced by a new additive manufacturing technology (Bound Metal Deposition) was investigated at 482 °C (900 °F), under stresses ranging from 350 to 600 MPa. Two different sets of samples produced with different deposition parameters were considered. Prior heat treatment consisted of ageing either at 482 °C (state H900) or at 621 °C (H1150). The minimum creep rate and time to rupture dependencies on applied stress were obtained. The creep response in terms of time to rupture under a given stress, in particular, was compared with the only other available literature dataset on a similar steel processed by traditional technologies. The analysis of the experiments demonstrated that the presence of dispersed defects causes, in the Bound Metal Deposited steel, a substantial reduction (35–40%) of the creep strength.

1. Introduction

Metal Additive Manufacturing (AM), a family of technologies in which parts are built layer-by-layer [1], is extremely attractive for a number of biomedical, automotive, aerospace, and oil and gas applications [2,3]. A widespread AM technology is laser powder bed fusion (L-PBF), where one or more lasers fuse the loose pre-alloyed metal powder to build the final object [4]. Yet, there are many others metal AM technologies available to industry. Electron beam melting, binder jetting, direct energy deposition, and material extrusion [5] are just a few examples of these processes. Another of the most interesting and recent technologies is Bound Metal Deposition (BMD), developed and patented by the Desktop Metal Company [6]. This process is quite similar to plastic fused filament fabrication (FFF), where material is deposited layer-by-layer using a temperature-controlled extruder [7]. In the BMD process, the feedstock material is a composite rod, an agglomerate of metal powder, wax and thermoplastic binder, properly designed to facilitate the printing procedure and to bind the metallic powder. One of the strengths of this approach is that the metal powder is obtained using the same procedure used for Metal Injection Molding (MIM) feedstock, a low-cost process, while the final rod is fabricated by extrusion [6].
The BMD technology consists of three steps: (i) composite extrusion, (ii) debinding, and (iii) sintering (Figure 1). Composite extrusion is the 3D-printing step of the process. After printing, the part is roughly 18% larger than its final size due to the presence of wax and binder [8]. The second step is debinding, where the part is soaked in a bath for a given duration, which depends on its geometry and on the percentage of material infill. The debinding process is necessary to remove the majority of wax and binder and to prepare the 3D-printed part for the final sintering process. The partial removal of wax and binder increases brittleness, but part handling is nevertheless possible. In the third and final sintering step, the part is heated in a controlled atmosphere (H2 + 3%Ar) to prevent corrosion phenomena. The sintering process actually consists of two sub-steps: during the first, heat eliminates the residual binder, while during the second sub-step the part is sintered to reach the final geometry and mechanical properties.
One of the best performing feedstocks commercially available for the BMD process is the 17-4PH precipitation hardening stainless steel. This martensitic alloy, in an aged state, shows good hardness, high corrosion resistance and high strength. These excellent properties are only attained after suitable ageing treatments [9,10]. Ageing results in the formation of precipitates and carbides along the grain boundaries, thus improving the material mechanical performance. As obvious in any age-hardening alloy, the combination of temperature and treatment duration exerts a strong influence on the volume fraction, size, and distribution of precipitates and, therefore, on the overall properties [11,12]. In this context, the microstructural instability, which is a typical feature of age-hardening alloys, should be carefully considered when envisaging high-temperature applications. On the other hand, data on the high-temperature properties, and, in particular, on the creep response, are unusually scarce for 17-4PH steel. Although a number of studies investigated even the creep response of age-hardening aluminum alloys (see [13,14,15] for just a few examples), which cannot be included among the most proficient creep-resistant materials, the knowledge of the creep strength of the 17-4PH steel is surprisingly limited to a single source [16]. For the 17-4PH (AISI 630), in that source admittedly listed among the stainless/heat resisting steels, only a collection of stresses for a given duration (100 or 1000 h) was provided. The origin of these data can be traced down to a commercial firm, Armco Steel Corp. Later commercial datasheets invariably report these same data when creep properties are considered. These observations suggested that the creep response of the 17-4PH steel is still a subject that deserves a more accurate analysis. The aim of this paper was, thus, to investigate the short-term creep behavior of the 17-4PH steel produced by BMD. In particular, the authors of this study aimed at attaining a conservative estimate of the (possible) reduction in the creep strength due to the peculiar processing route. Two different sets of printing parameters were used to identify the deposition conditions that resulted in the weakest material in the H1150 state. Once these deposition conditions were identified, they were used to print a second set of samples to be tested in the H900 stronger state.

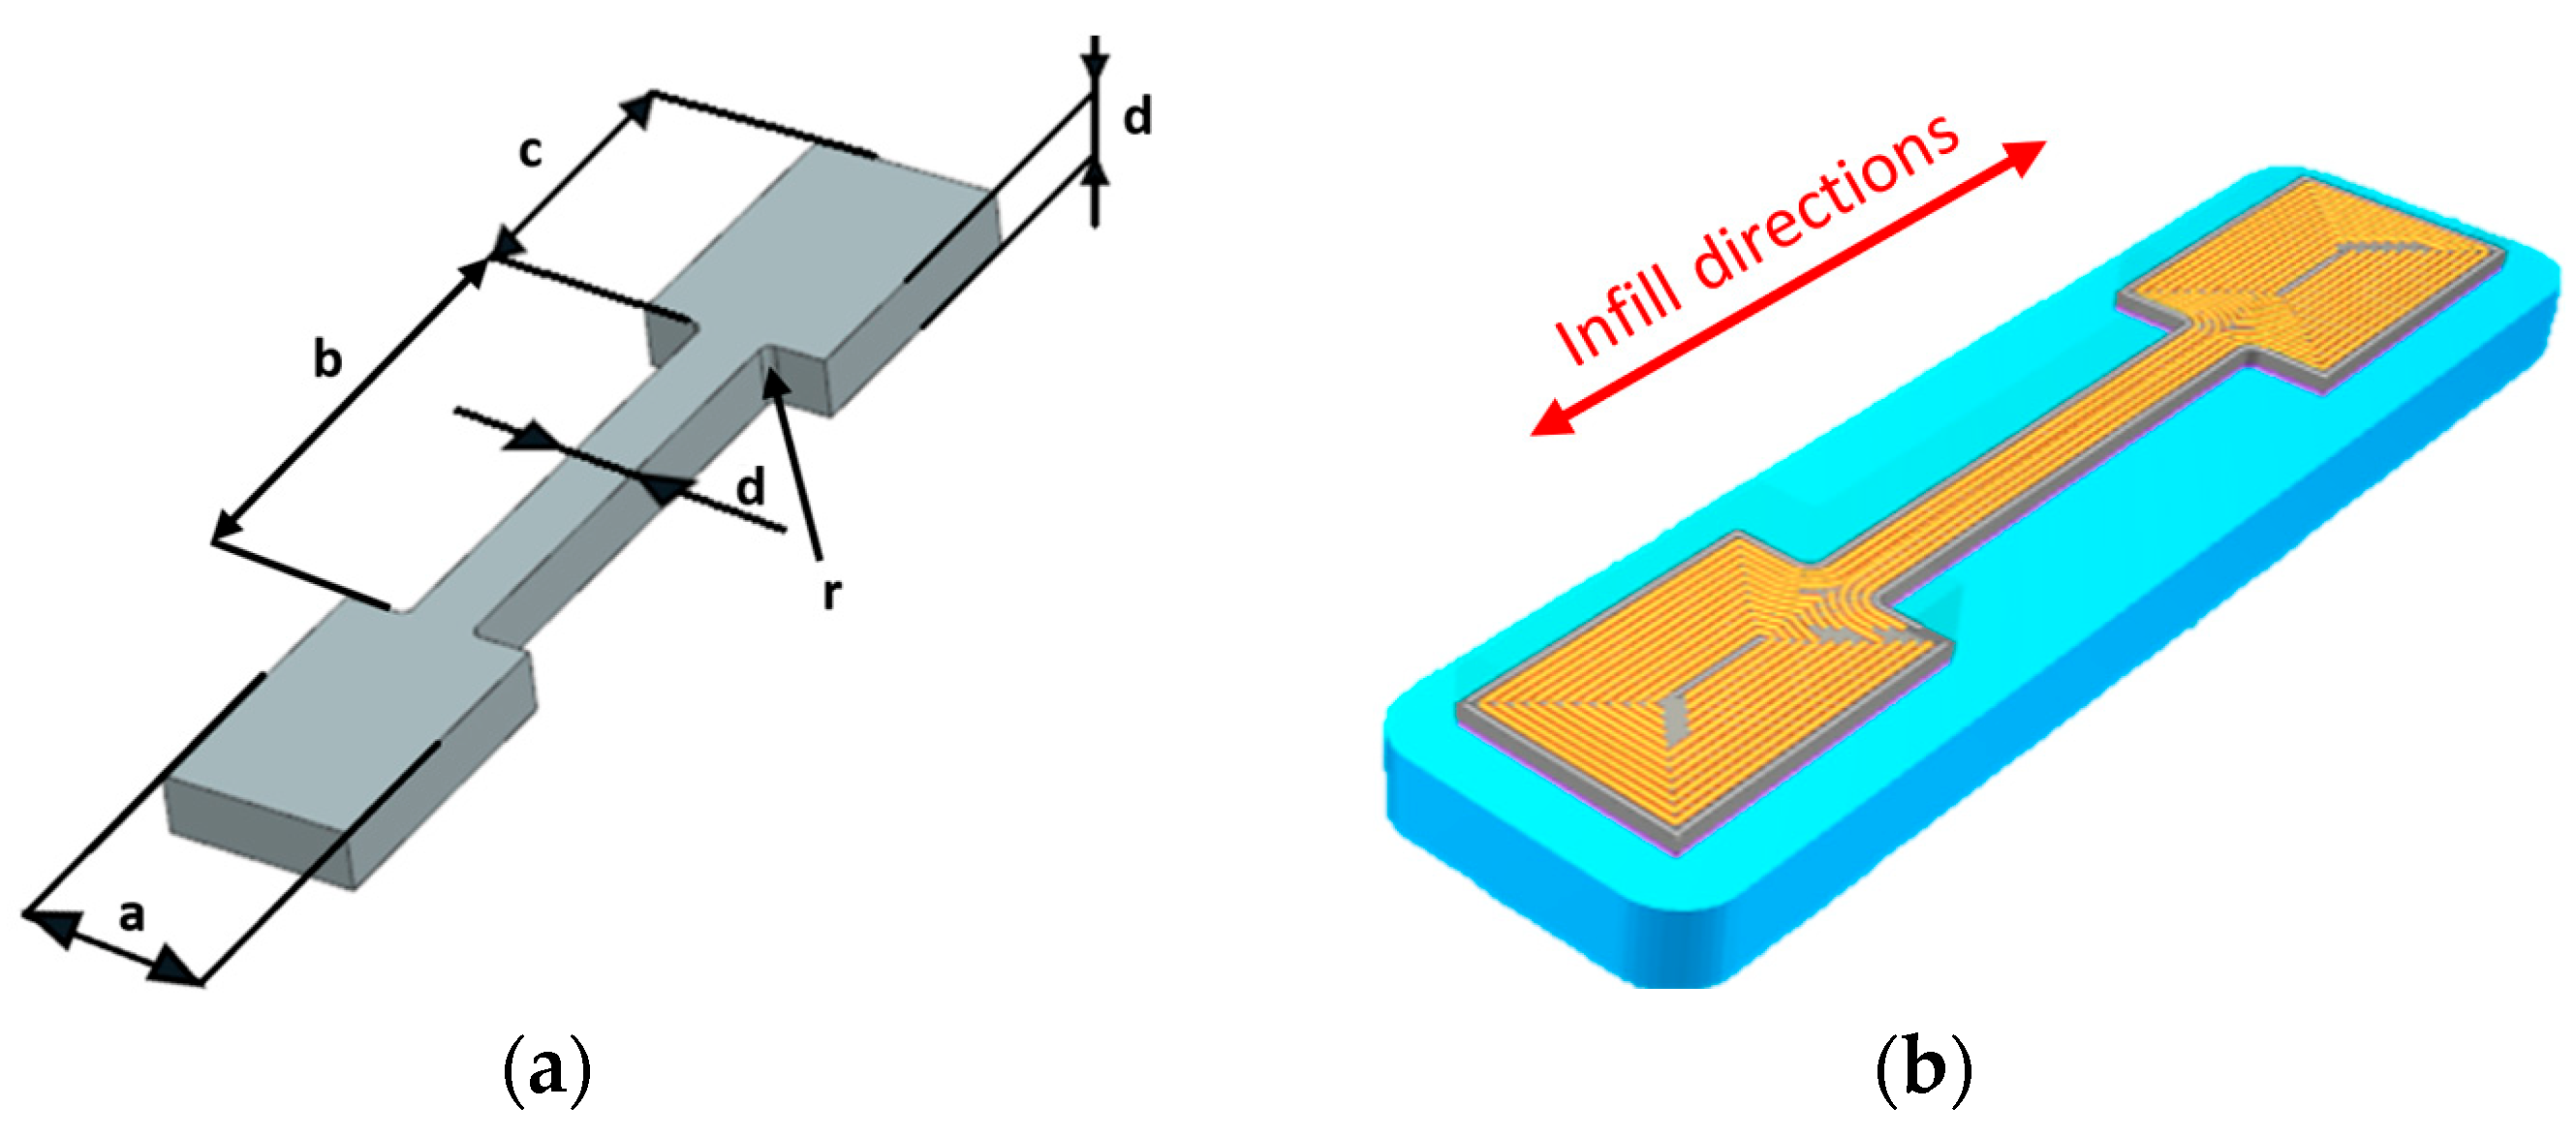
2. Materials and Methods

BMD creep samples were fabricated by a Desktop MetalTM (DM) Studio System equipment. Feedstock material was in the form of composite rods comprising a polymeric binder and a commercial Stainless Steel 17-4PH water-atomized powder, with the chemical composition reported in Table 1.
The creep samples geometry is shown in Figure 2a (a = 10 mm, b = 25 mm, c = 15 mm, d = 3 mm and r = 0.5 mm). The samples were processed by using two different sets of printing parameters, Standard (D1) and Dense (D2) (Table 2). The main differences consisted in printing speed, layer height, and deposited line width. In the “denser” samples set (D2), the extruder deposits and “squashes” the material in order to improve the adhesion of printing filament with the subsiding printed material. A detail of the infill strategy used for the fabrication of the samples is shown in Figure 2b.
Debinding lasted 30 h, a duration calculated by the Desktop MetalTM software. After debinding, the creep samples were sintered for 41 h at 1350 °C. After sintering, the samples underwent furnace ageing in air. Two different ageing treatments were investigated: H1150 (on both D1 and D2 states), and H900 (on D1) (Table 3). The samples were aged directly after sintering, on the assumption that both time and temperature during this step were more than enough to cause the complete solutioning of the material.
Constant load tensile creep experiments were carried out in air. Heating typically lasted for 3 h, followed by a 0.5 h-soaking at the testing temperature. To maintain a homogeneous heating profile in the furnace, the test temperature was measured by four thermocouples. Three of these thermocouples were used for control of the 3-zones furnace, while the fourth provided an instantaneous temperature measurement which was continuously recorded in parallel will deformation. Elongation was measured by LVDTs (Linear Variable Displacement Transducers). Tests were carried out until sample fracture.
An Ernst Hardness tester was used to measure the Rockwell hardness C (HRC), out of six indentations minimum for each sample.
A Leica optical microscope (OM, Leica, Wetzlar, Germany) was used to investigate the microstructure of the aged material. The preparation of metallographic specimens was carried out following the standard grinding and polishing procedures. After creep, the specimens were, thus, cut and embedded in phenolic resin and were ground and polished by a Struers Tegramin-20 automatic machine. Etching was carried out by a 10 mL HNO3 + 15 mL HCl + 10 mL acetic acid solution. Polished but unetched samples were used to qualitatively analyse the defects (porosity) size and distribution.
Scanning electron microscopy (SEM, Tescan, Brno, Czechia) was used for the fractographic analysis of the crept rupture surface. These observations were carried out by a Tescan Vega 3 scanning electron microscope equipped with an EDAX Element microanalysis, collecting the secondary electrons (SE) signal and using an accelerating voltage of 30 KeV.

3. Results and Discussion

3.1. Hardness Results
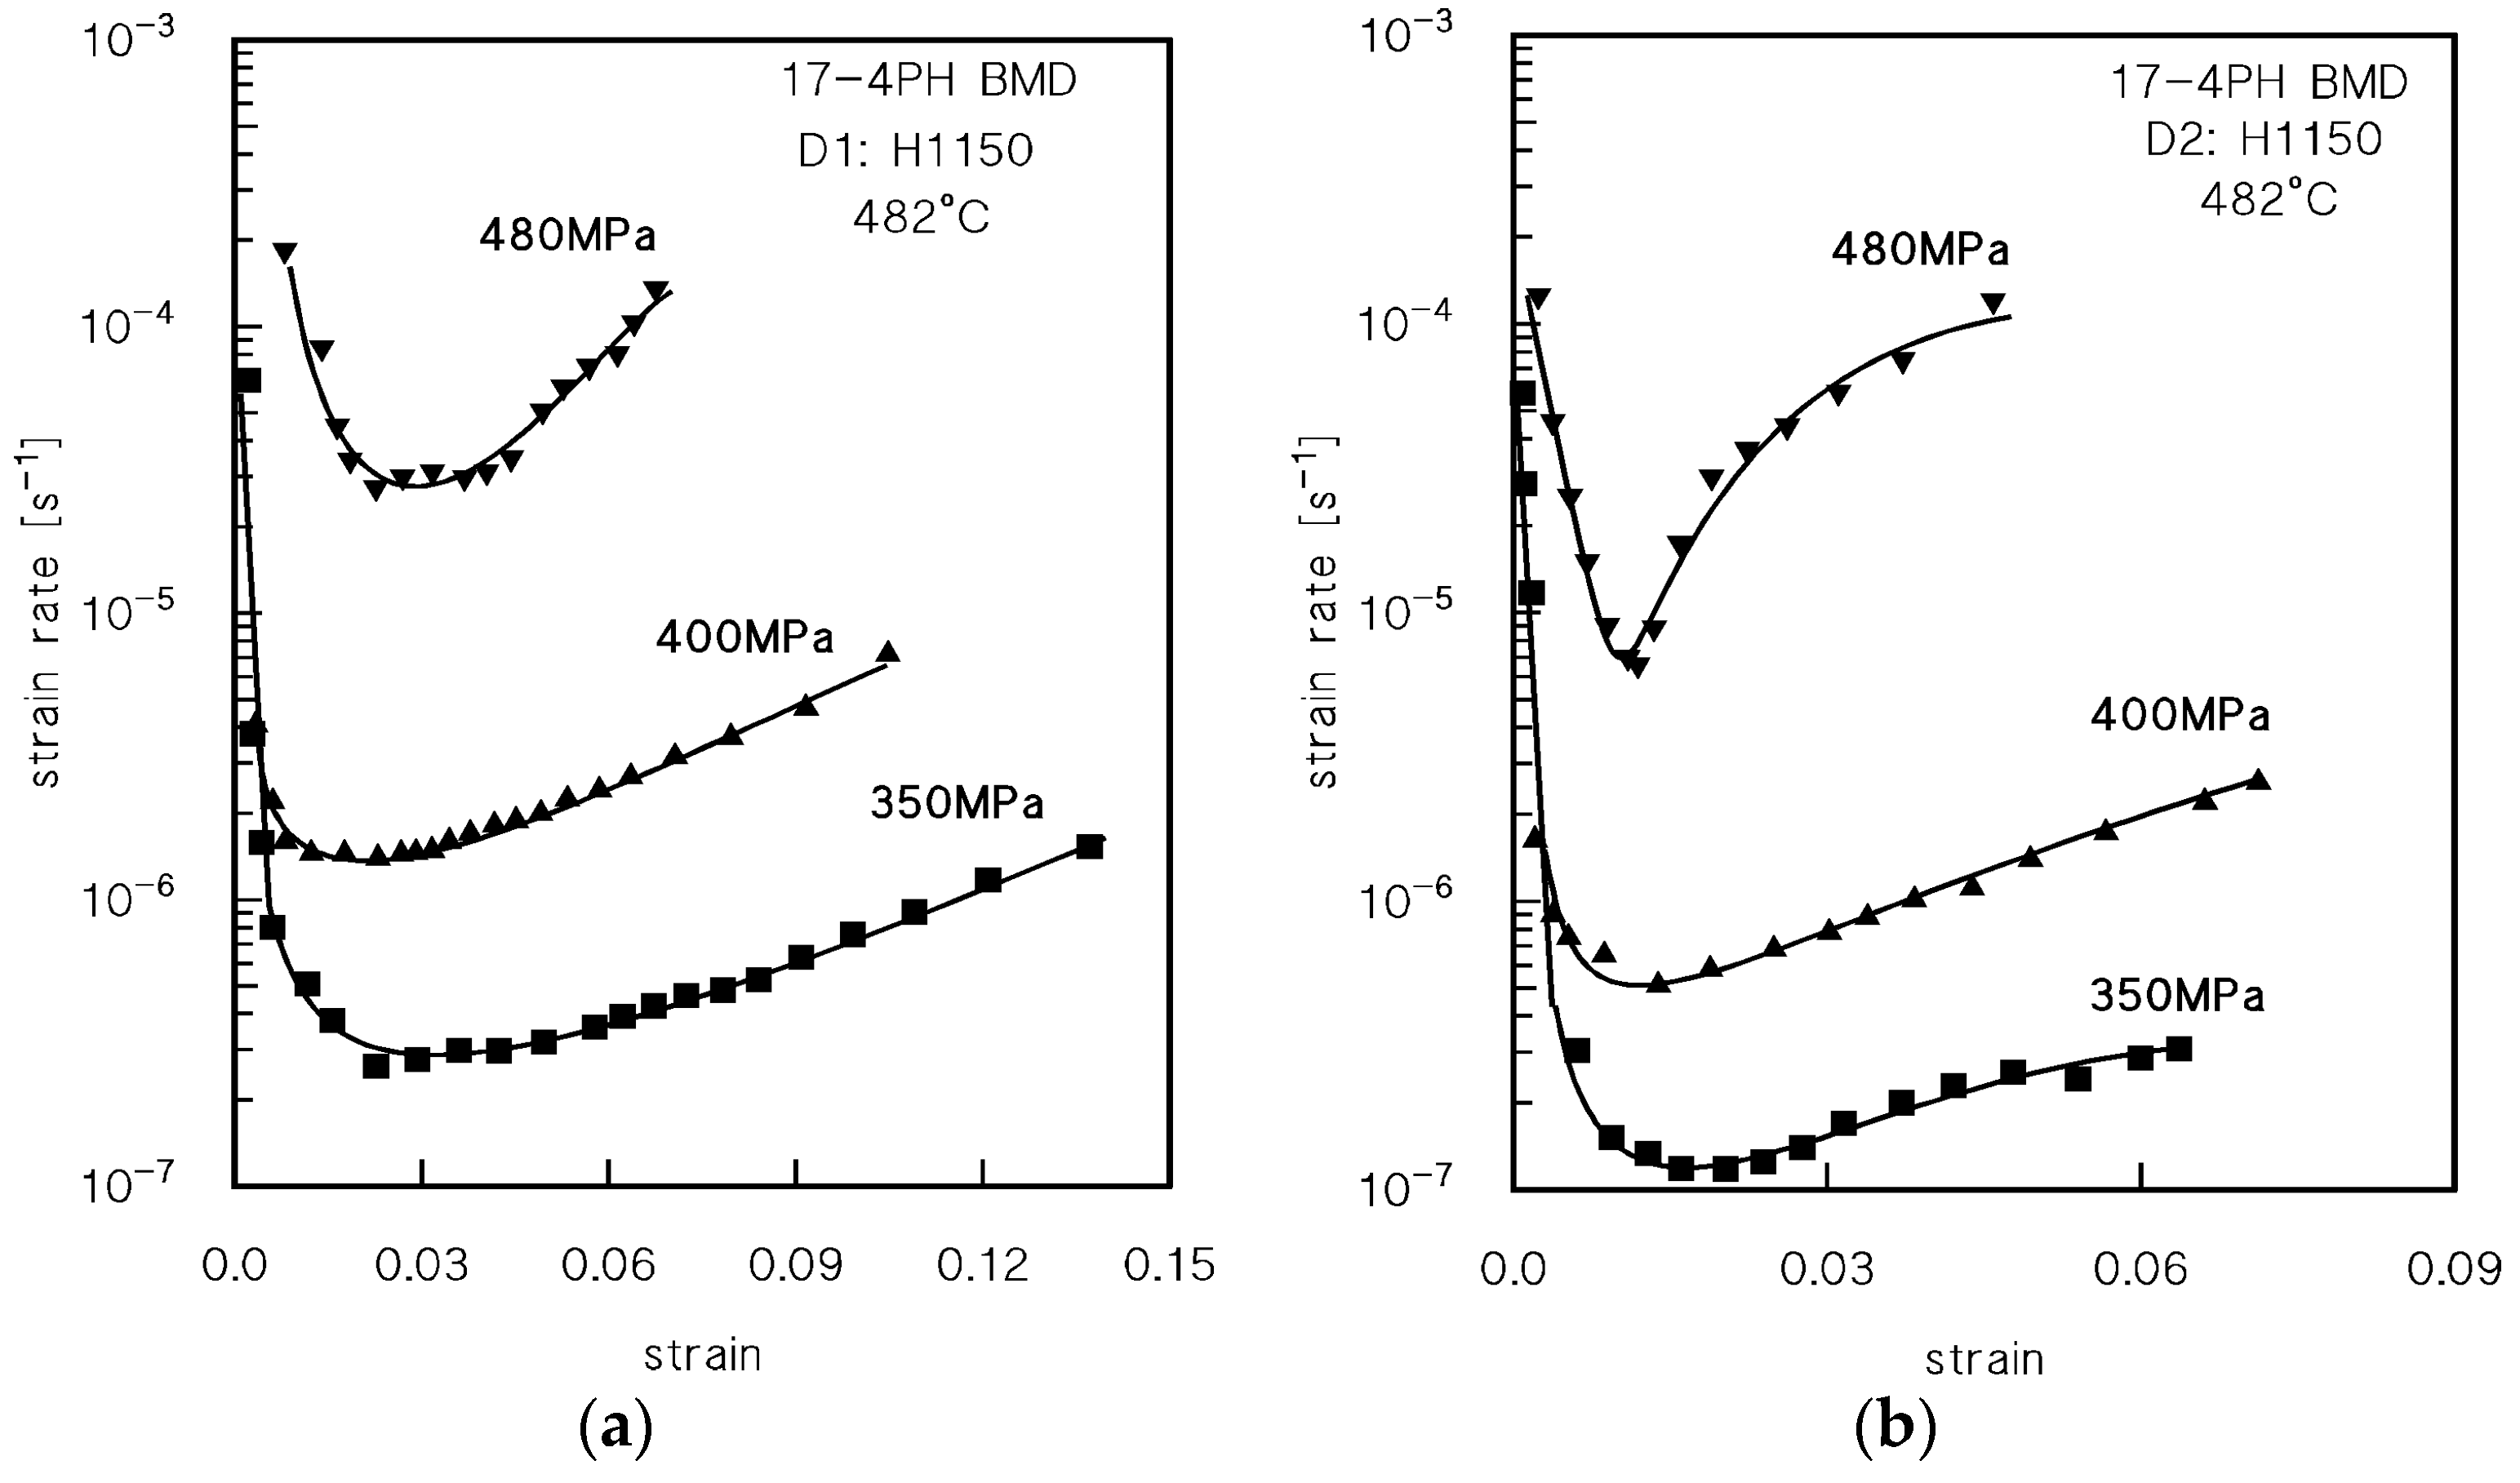
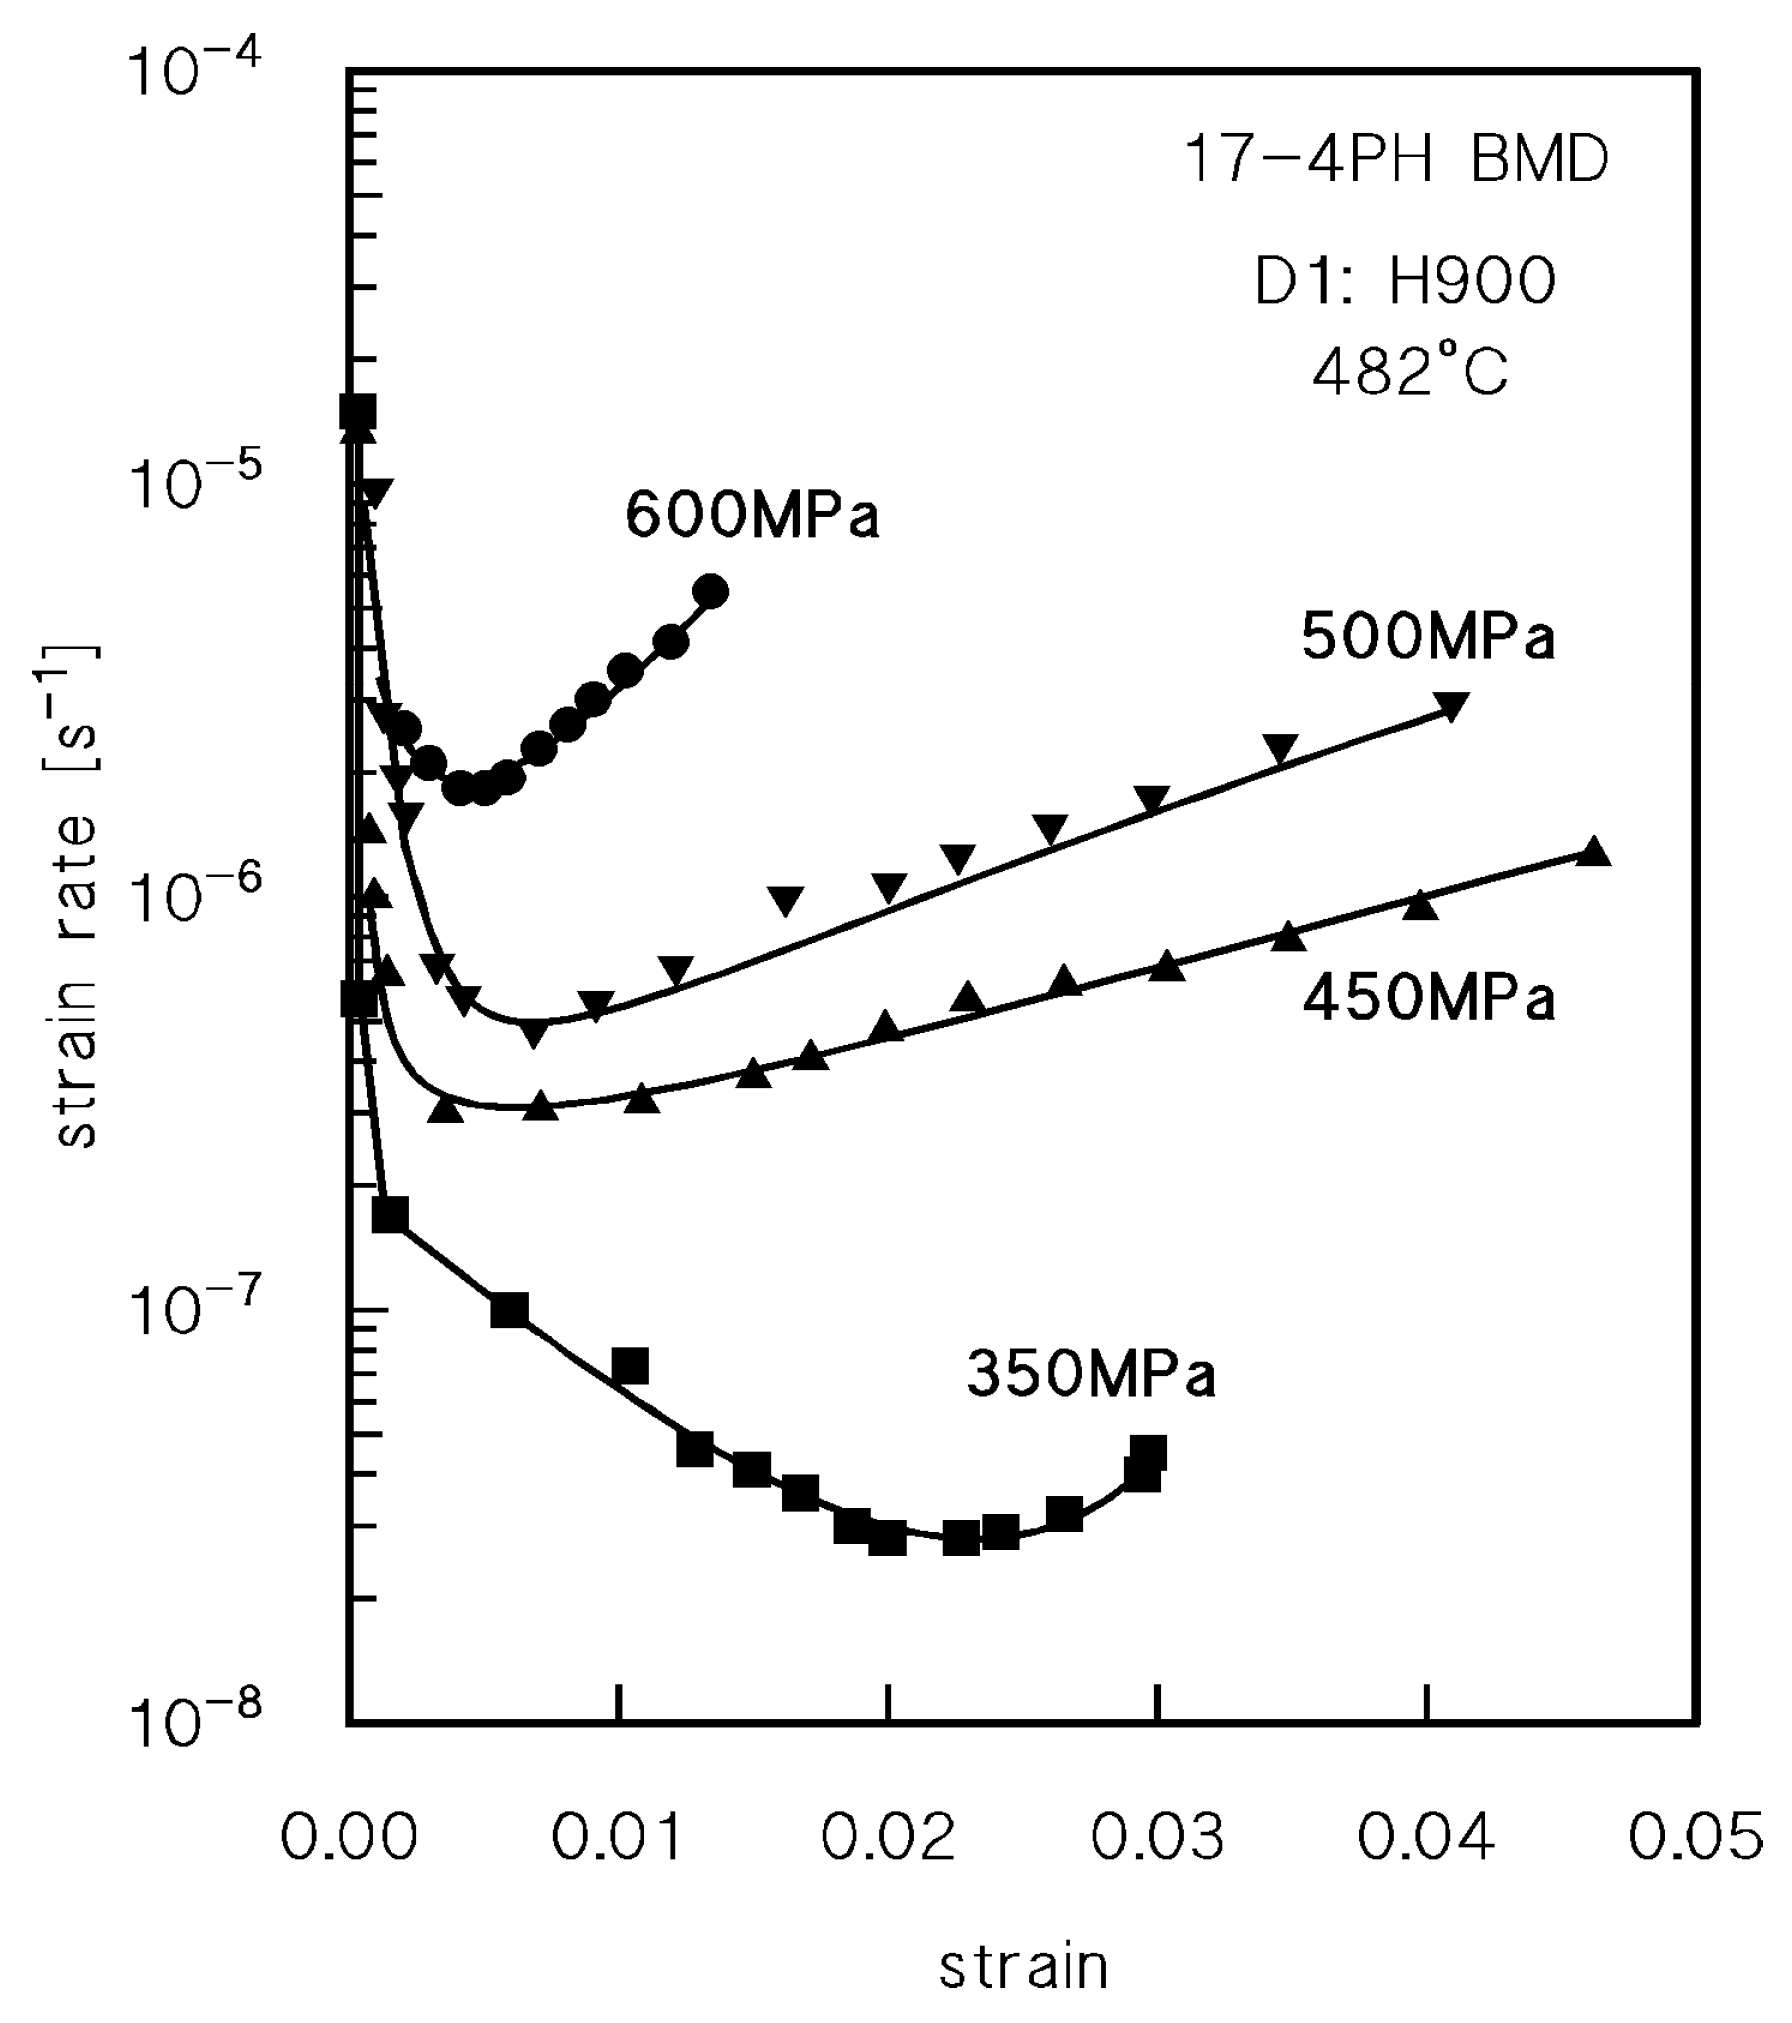
The hardness of D1 and D2 samples in the H1150 state ranged between 28 and 33 HRC. In the H900 state, the D1 material exhibited an HRC hardness ranging between 40 and 43 HRC. In both cases, the hardness of the BMD metal after sintering and ageing was only marginally inferior to that of the bulk metal after conventional solution treatment and ageing (Table 3). This minor difference could be attributed to the very high temperature experienced by the material during the sintering step, well above the usual solution treatment temperature.

3.2. Creep Results

Figure 3 shows the shape of the creep curves, in form of strain rate vs. strain, for the samples tested in the H1150 condition.
Figure 4 shows the curves obtained by testing the D1 material in the H900 state. In general, the shape of the creep curves is conventional, with a well-defined primary region, a minimum creep rate range, and a prolonged tertiary stage. That said, the analysis of Figure 3 and Figure 4 shows that there was considerable latitude in the shape of the tertiary region. In the case of the D1 H1150 material, the strain rate gradually increased with strain after attaining its minimal value. By contrast, the “denser” D2 state exhibited lower values of the minimum creep rate under a given stress, but the initial part of the tertiary curve was much steeper. Correspondingly, the tertiary stage started at strains close to 0.03 and 0.015 in D1 and D2, respectively. An earlier initiation of the tertiary stage thus occurred, somewhat surprisingly, in the “denser” condition. In any case, the D2 material still exhibited a marginal advantage in the creep response, which led to the identification of the D1 state as the weaker one, to be further investigated in the H900 condition. In this harder state, again the early part of the tertiary region was quite steep (Figure 4). This difference in the shape of the tertiary stage was reflected in the strain to fracture, much higher for the D1 H1150 set of samples, than for D2 H1150 or D1 H900.
Figure 5 shows the minimum creep rate ( ε ˙ m ) dependence on applied stress (σ) for the conditions investigated in the present study. The experimental data in Figure 5 align on straight lines, i.e., the results obey the usual phenomenological power-law equation
ε ˙ m = A σ n
where A is a temperature-dependent parameter. The stress exponent n here ranged between 7.6 and 14.7. Figure 5 clearly shows that the minimum strain rate of the samples tested in the H900 state is by far lower than that measured after H1150 ageing. This fact was largely expected since ageing at 482 °C produces a dispersion of hardening phases that is more effective in obstructing dislocation mobility [17]. The H1150 age hardening carried out at 621 °C, by contrast, results in an overaged state, which undergoes moderate changes in terms of nature and distribution of the strengthening phases when exposed for relatively short times at 482 °C. This fact explains the different stress exponent values. The D1 H900 material exhibits lower creep rates at 482 °C, but the difference with the H1150 state progressively vanishes for longer times of exposure, since the straight lines presented in Figure 5 converge. Thus, it can be reasonably inferred that the lower stress exponent recorded for the H900 state is the result of the instability of the microstructure, which approaches an overaged condition as the time of exposure increases.
A second interesting piece of evidence presented in Figure 5, is the lower creep rate measured in D2 samples. Here, the previous heat treatment should not play a major role, since both sets were in H1150 state. Thus, the difference in the creep rate can be attributed to a different content of macroscopic defects (cavities) introduced by the peculiar production technique. Unfortunately, no data describing the minimum creep rate dependence on applied stress for the material produced by traditional technologies can be found in the available literature. Thus, in this respect, a comparison between BMD and bulk samples is not possible.

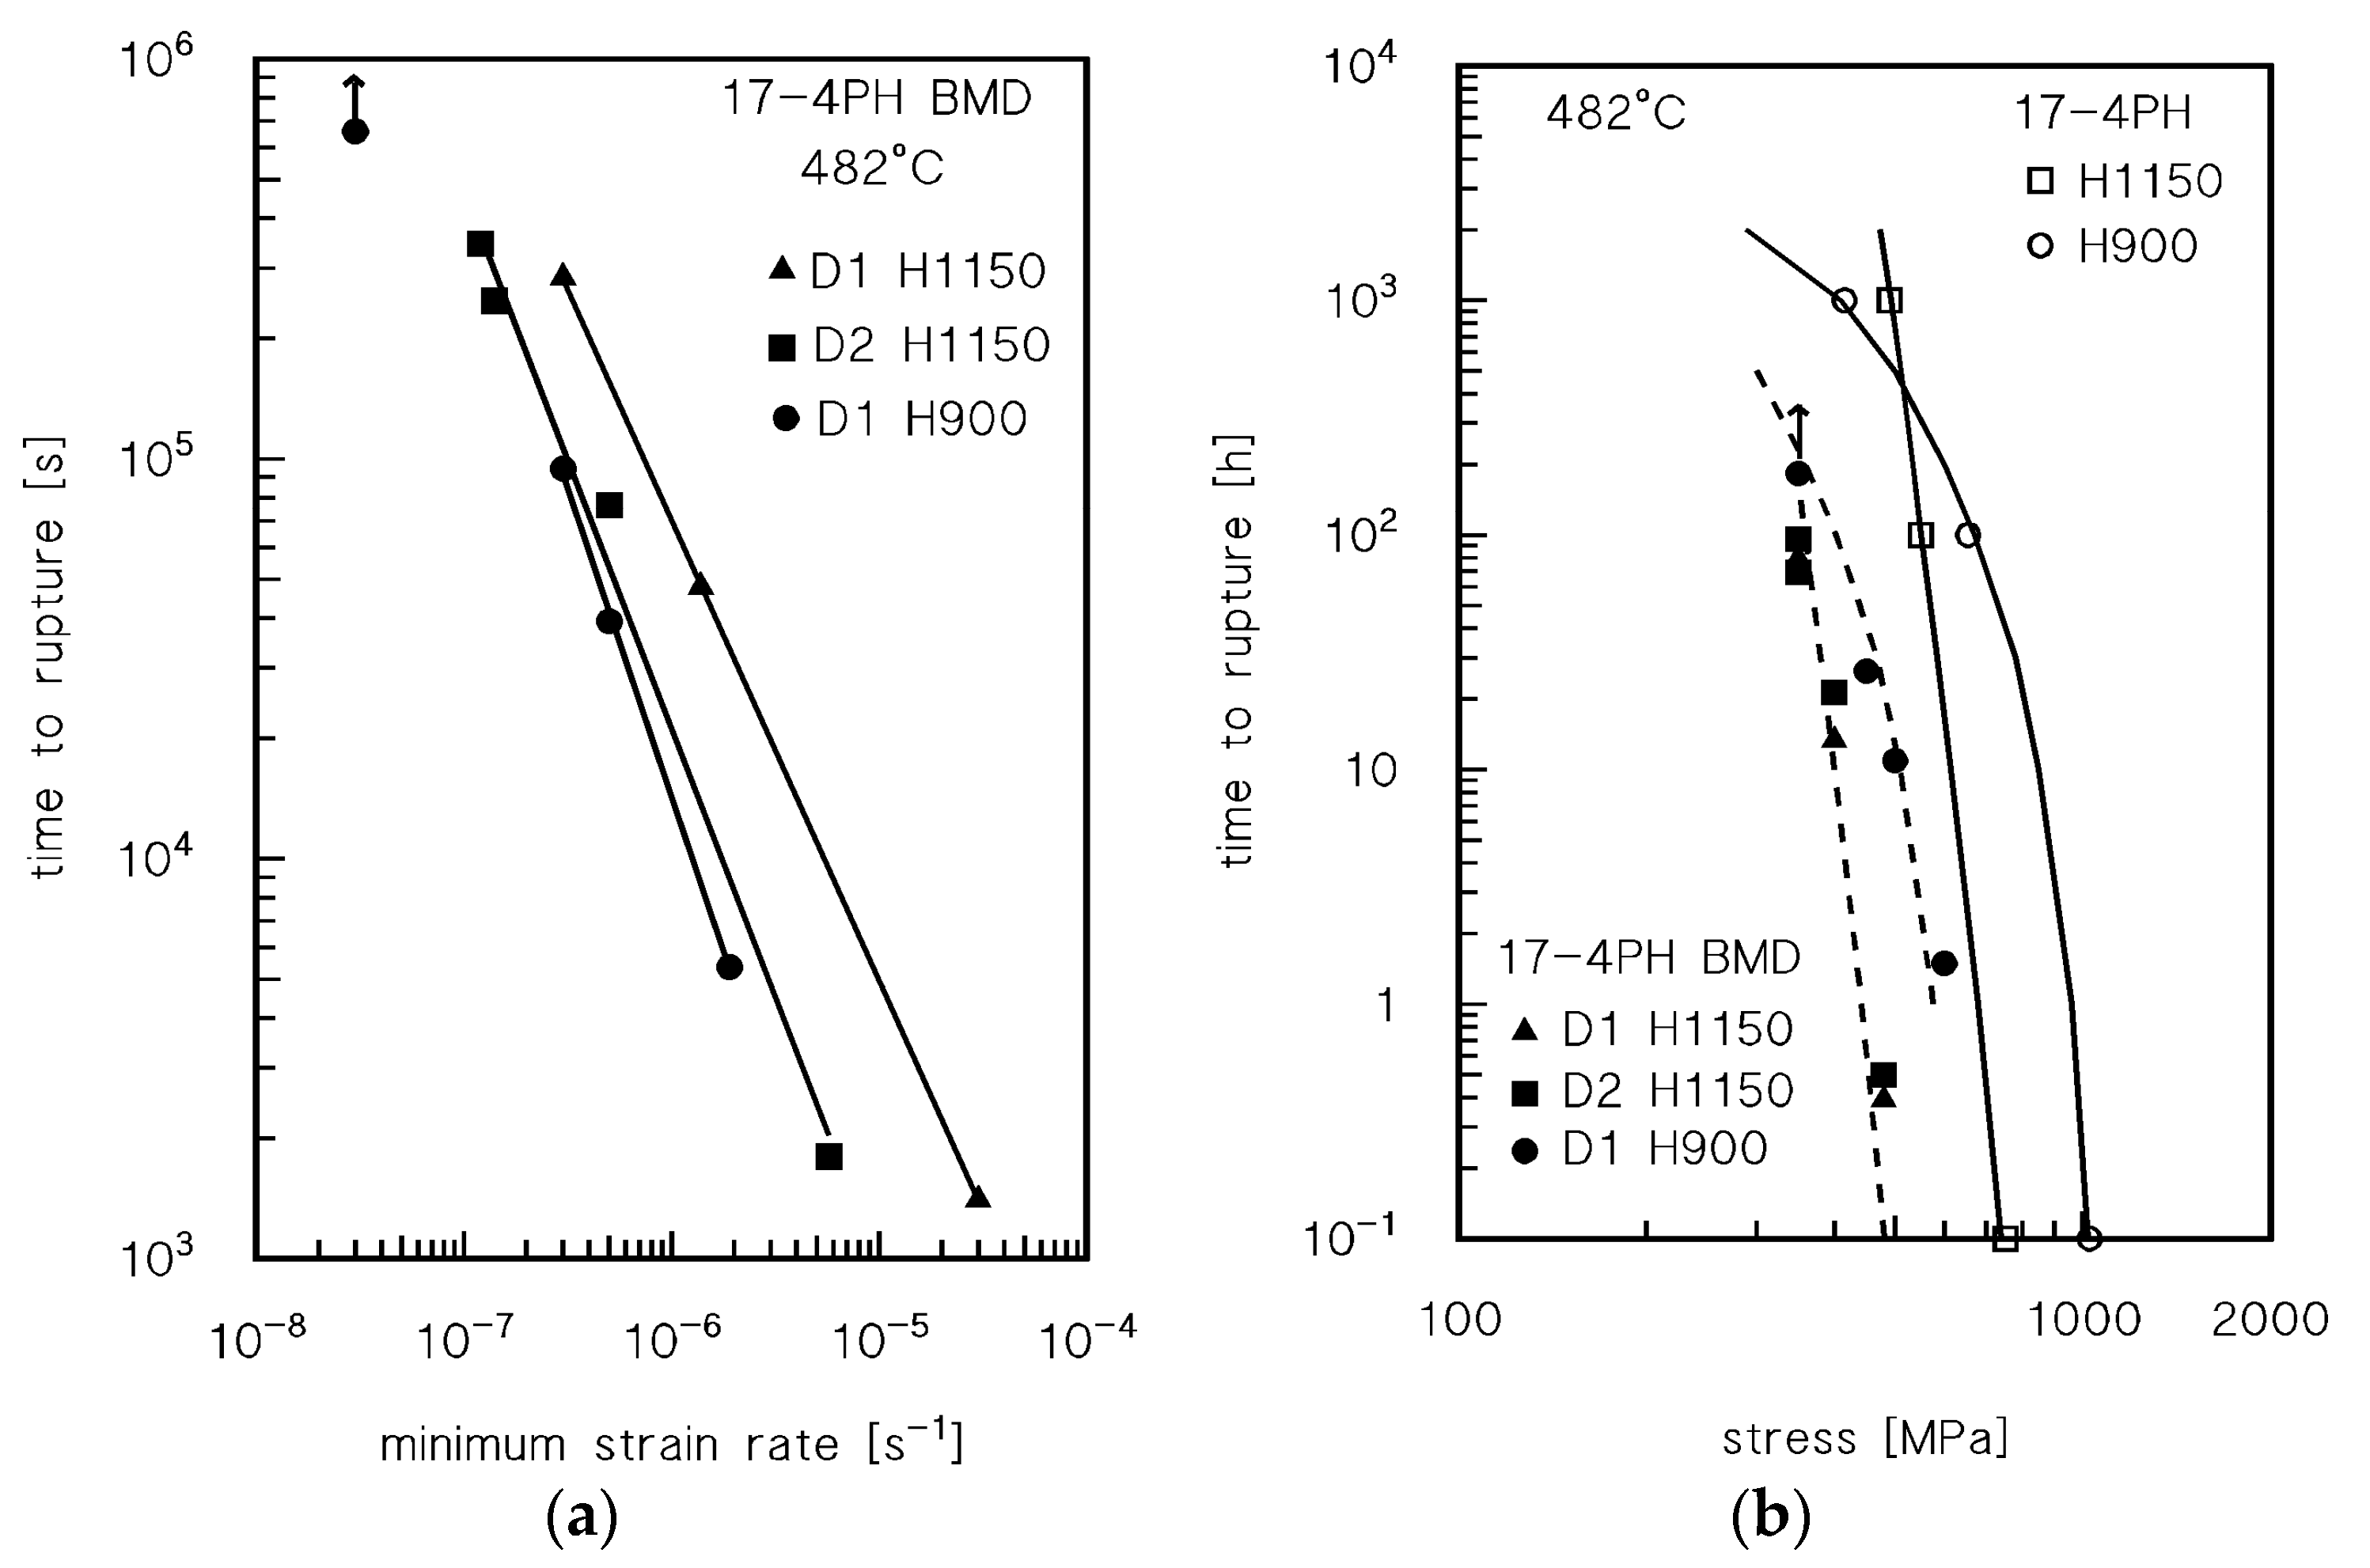
3.3. Time to Fracture

Figure 6a shows the time to fracture (tr) as a function of minimum strain rate. As usual in metals, the Monkman–Grant relationship
ε ˙ m t r = C
is substantially obeyed, but the data for the different datasets do not overlap, i.e., the three investigated conditions correspond to different values of the C constant. The Monkman–Grant equation is substantially empirical in nature, although it envisages a power-law with exponent 1/n for the cavity growth rate (=1/tr) dependence on applied stress. The fact that the data do not overlap clearly points to different kinetics of the creep damage progression. This fact is also reflected in the above-mentioned differences in the shape of the creep curves. In the D1 H1150, the creep rate in the tertiary region slowly increases, which gives times to rupture only marginally inferior to those recorded for D2 H1150, although the minimum creep rates are quite different. One should conclude that the “denser” D2 condition, due to its lower cavities content, exhibited slower creep rates, but was also prone to an accelerated damage progression, which led to earlier tertiary stage onset.
The focus of the present paper was the determination of the possible effects of BMD on the creep properties when compared with the same material processed by traditional technologies. This comparison can be presently attempted only for time to rupture. Even in this regard, the available data are scarce since they only consist in 100 and 1000 h creep-rupture stress at different temperatures [16]. Figure 6b shows two tentative curves obtained by connecting these two values and a third one, which corresponds to the UTS at 482 °C, here assumed to be roughly equivalent to the creep stress that provides a time to rupture of 0.1 h. The most striking feature of these curves is that they cross each other for a duration between 100 and 1000 h. This fact should imply that the material aged at 482 °C, for a reasonably long exposure time, becomes less creep resistant than the material that underwent prior ageing at 621 °C and subsequent creep exposure at 480 °C. Although the convergence of the two curves is physically reasonable (both materials overage), such an inversion of the creep response, in the opinion of the authors of the present paper, needs further analysis to be positively confirmed. On the other hand, the curves in Figure 6b are presently the only possibility to compare the time to rupture for the BMD material with that obtained by testing the same steel produced by traditional processes. Analysis of Figure 6b again shows that the natural tendency when comparing the creep response of the H900 and H1150 states is toward the overlapping of the curves for a sufficiently long time of exposure when the material overages. On the other hand, it is plainly apparent that BMD results in a marked reduction in the stress for a given duration. The two broken curves presented in Figure 6b were obtained by multiplying the stress for a given time of rupture as predicted by the solid curves, by a reducing factor f. The data for the H1150 state substantially overlap on a curve obtained with f = 0.65, while the single dataset for H900 is described by a curve with f = 0.60. Last, but not least, the time to rupture for the D1 material is only marginally inferior to that of the D2 material, although the minimum creep rates, as already mentioned, can be quite different.

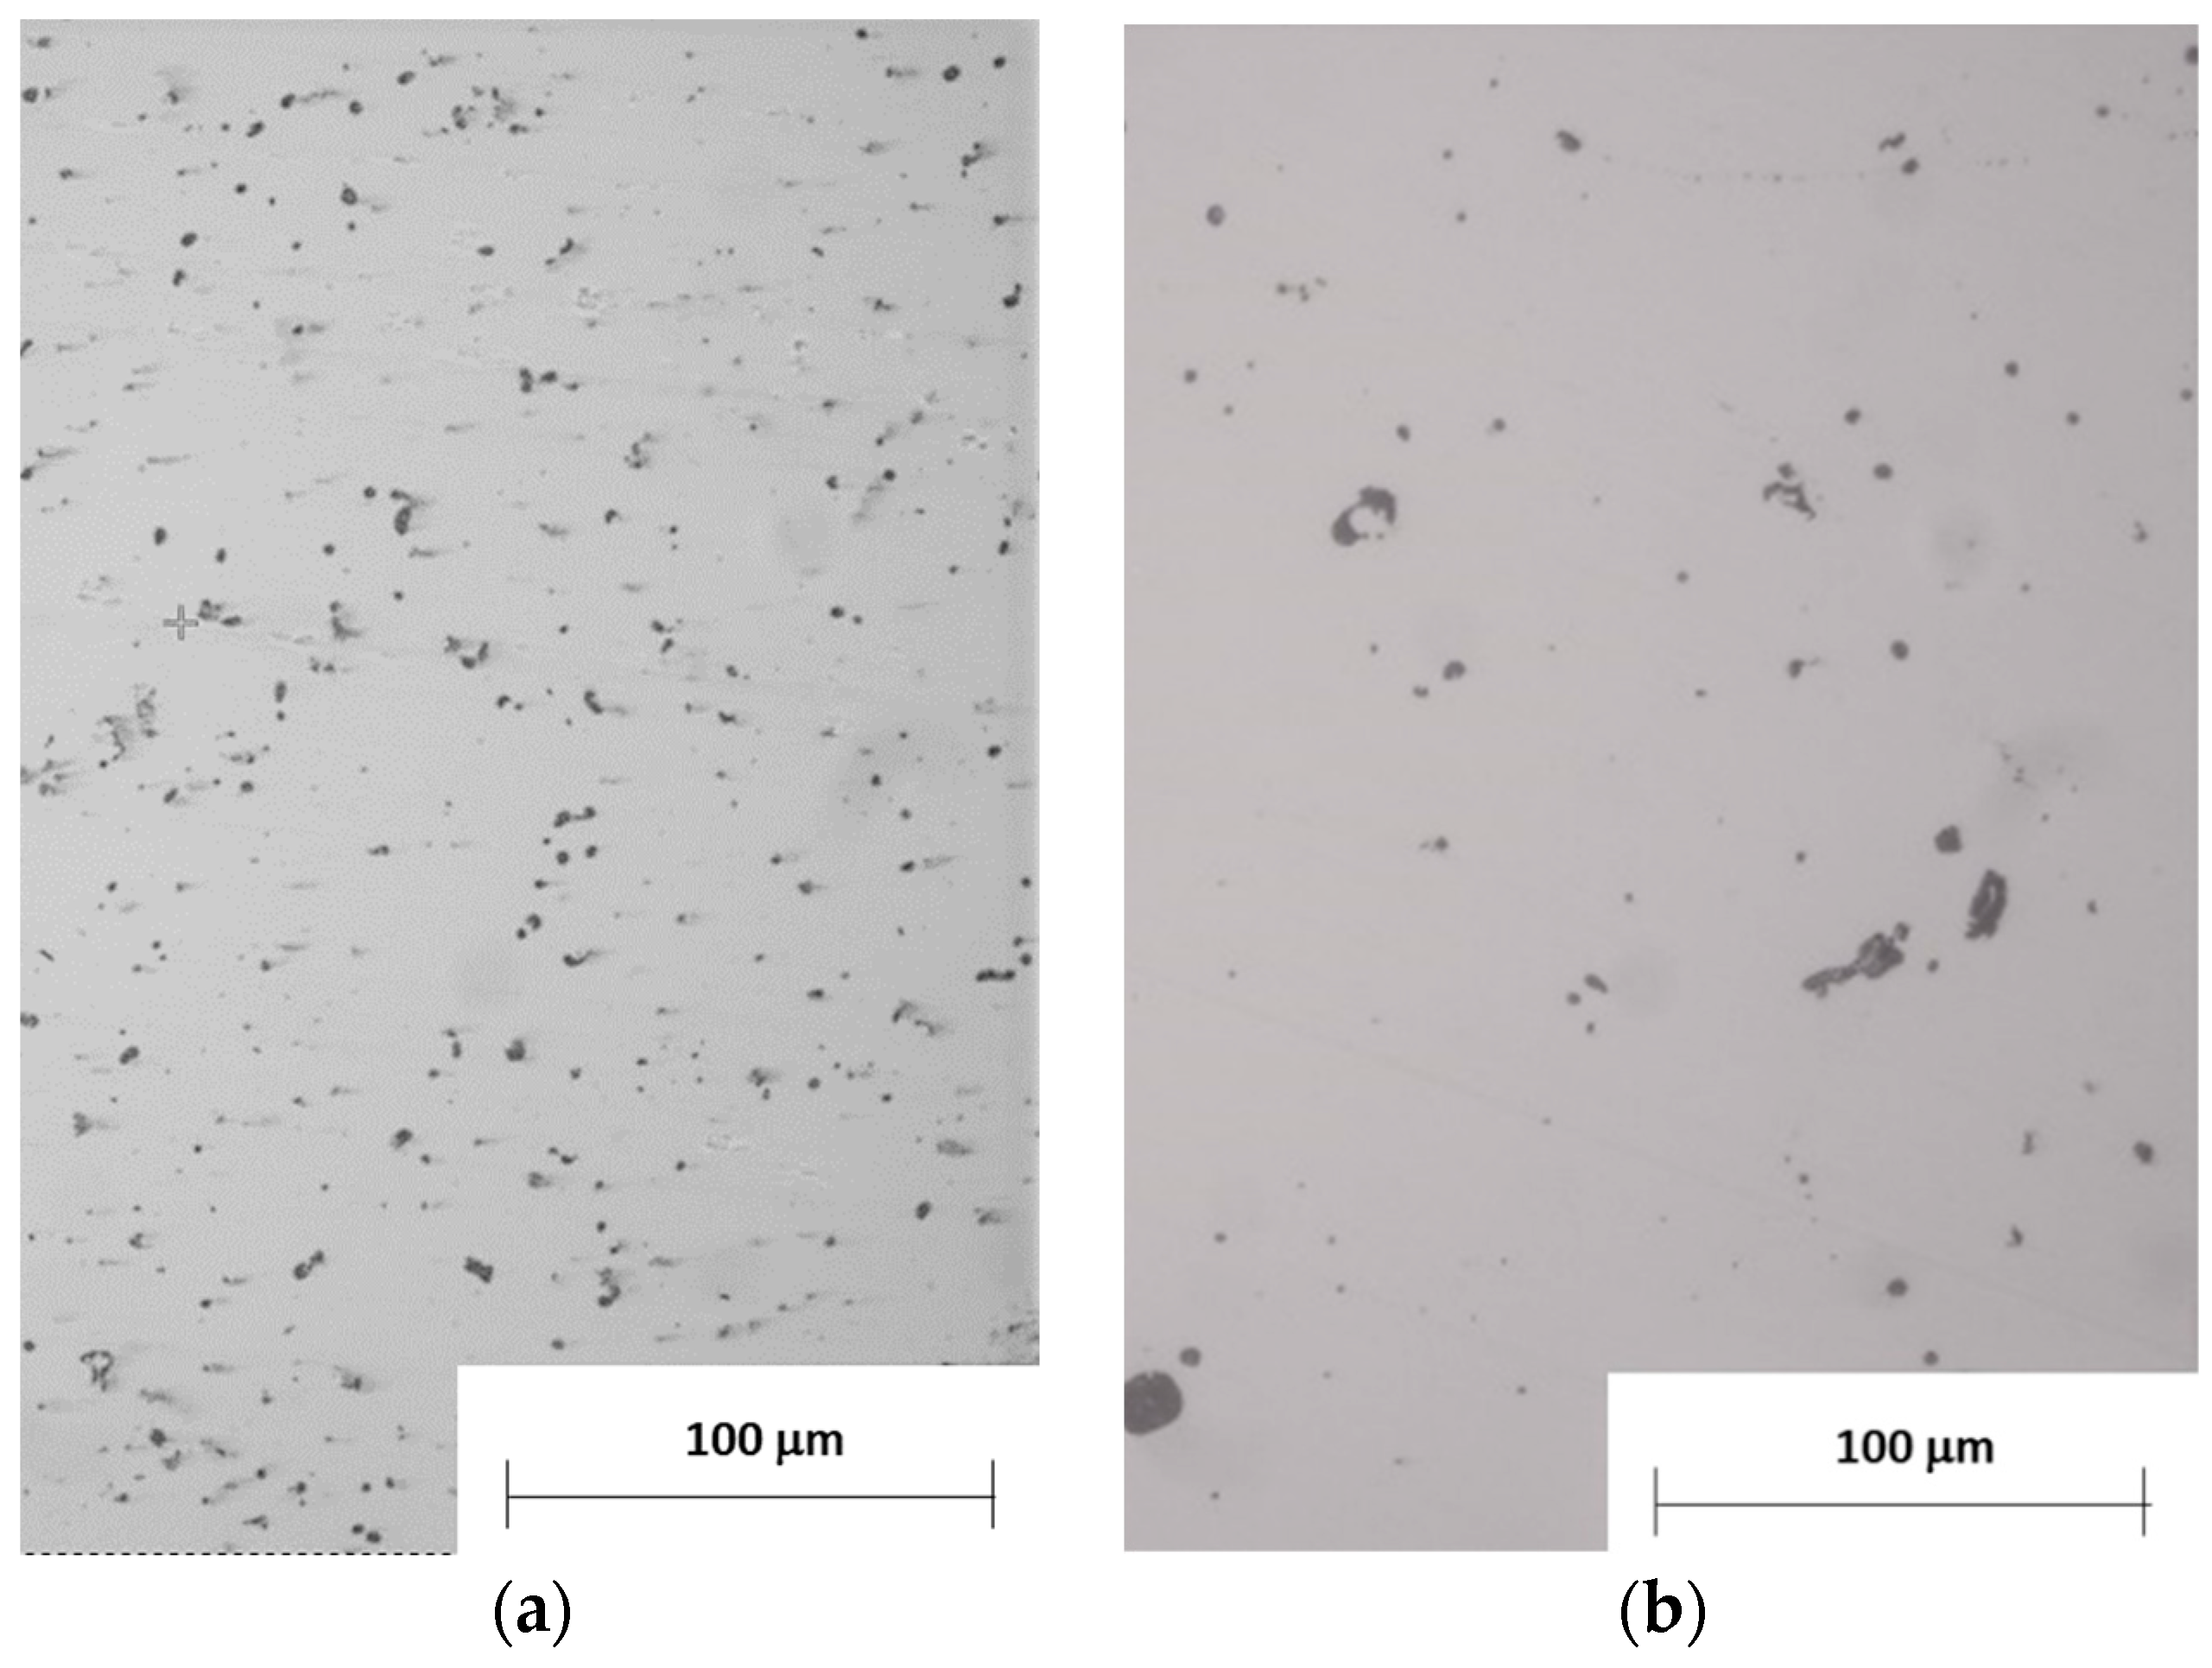
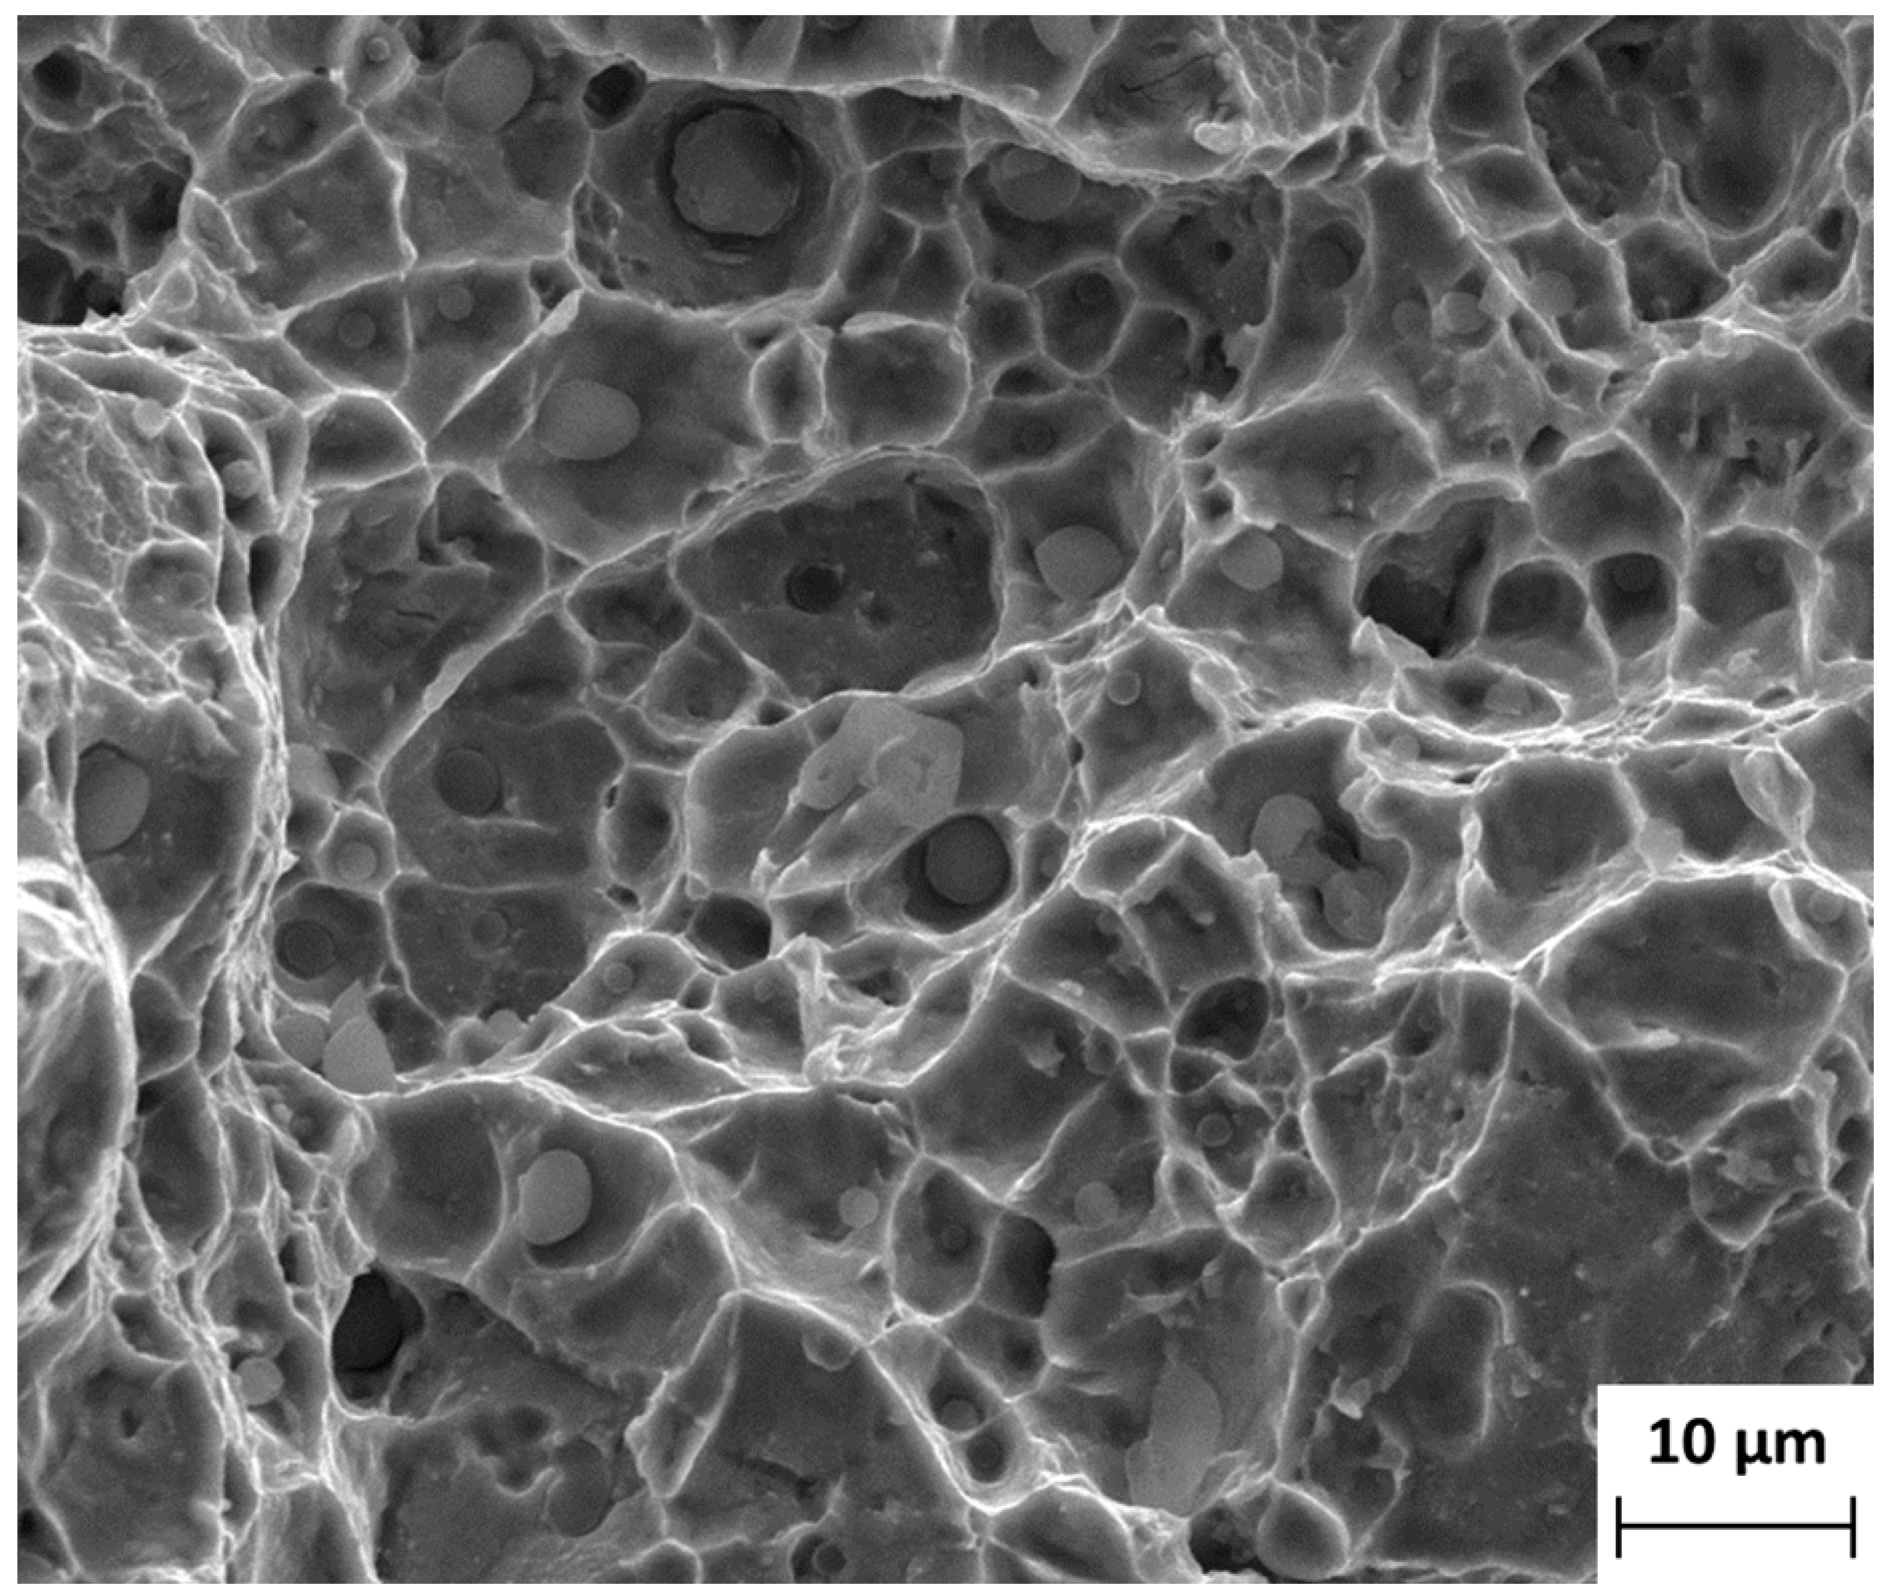
3.4. Source of Reduction in Strength: Analysis of Defects

Figure 7 shows the optical microscopy micrographs of unetched polished surfaces of D1 and D2 samples, respectively. Figures highlight the remarkable number of defects, mainly pores generated during the elimination of the polymeric binder and not suppressed by sintering.
Standard (D1) specimens (Figure 7a) exhibit a high number of fine pores with a random distribution. In D2 samples, the overall area fraction of the pores was lower, but occasionally locations with a higher number of much larger defects can be observed (one of these is shown in Figure 7b). These differences can be ascribed to the process parameters and to the nozzle forces applied to the material. Indeed, the process parameters used for the fabrication of the Dense (D2) samples were effective in preventing the development of finely dispersed pores within the metal matrix but, as a whole, a considerable content of larger defects can be still found in some locations.
The SEM inspection of the rupture surface of the crept samples highlighted features typical of a ductile behavior, which is hardly surprising in light of the high loads used in this study. Dimples with different dimensions surrounding large globules are clearly visible in Figure 8. The globules were silicon oxides presumably formed during the water-atomization stage of the feedstock material. These oxides represent another source of strength-reduction, since they act as nucleation sites for additional cavities during creep.
Figure 7 and Figure 8 explain the differences in the shape of the creep curves observed when comparing the D1 and D2 samples in the H1150 state. The two sets of samples both contain a combination of pre-existing cavities and silicon-oxide particles, the latter acting as nucleation sites for dimples, which severely impair the creep response. These defects cause an early onset of the tertiary stage, which rapidly leads to creep fracture. The differences in volume fraction, size and distribution of the defects not only influence the shape of the final part of the creep curves, but also the minimum creep rates reported in Figure 6, which are also dramatically affected by the early rupture initiation. In this regard, unfortunately, no comparison with the minimum creep rate dependence on the applied stress for a material produced by different technology can be attempted, due to the lack of literature data.

3.5. Creep Mechanisms

Figure 9 shows an example of the microstructure of the material in the H1150 state as observed by optical microscopy.
The microstructure is typical of high-Cr martensitic steels. At the higher magnifications obtained in transmission electron microscopy, one should observe the presence of lath-type martensite [11], decorated by finely dispersed Cu-rich particles which should evolve during high-temperature exposure [18]. Thus, mutatis mutandis, the creep response of the steel could be in principle described by microstructural models not dissimilar to those already in use for high-Cr martensitic steels, such as the T/P91 [19,20]. These models, which try to quantify the strengthening effects of the dispersed phases, are very attractive since they correlate the creep response with microstructural evolution. Yet, there is not much sense in using this sophisticated approach in the case of the material investigated in the present study, since the creep response, both in terms of minimum creep rate and time to rupture, is heavily conditioned by pre-existing defects. These defects cause an overestimation of the minimum creep rate that cannot be easily related to the microstructural deformation mechanisms. This fact again confirms that a study of the creep response of the “basic”, i.e., produced by traditional technologies, 17-4PH steel, is badly needed to properly identify the rate-controlling creep mechanisms and their correlation with microstructural evolution.

4. Conclusions

The creep response at 482 °C of a 17-4PH martensitic stainless steel produced by Bound Metal Deposition was investigated in the present study. The major findings of this research can be summarized as follows:
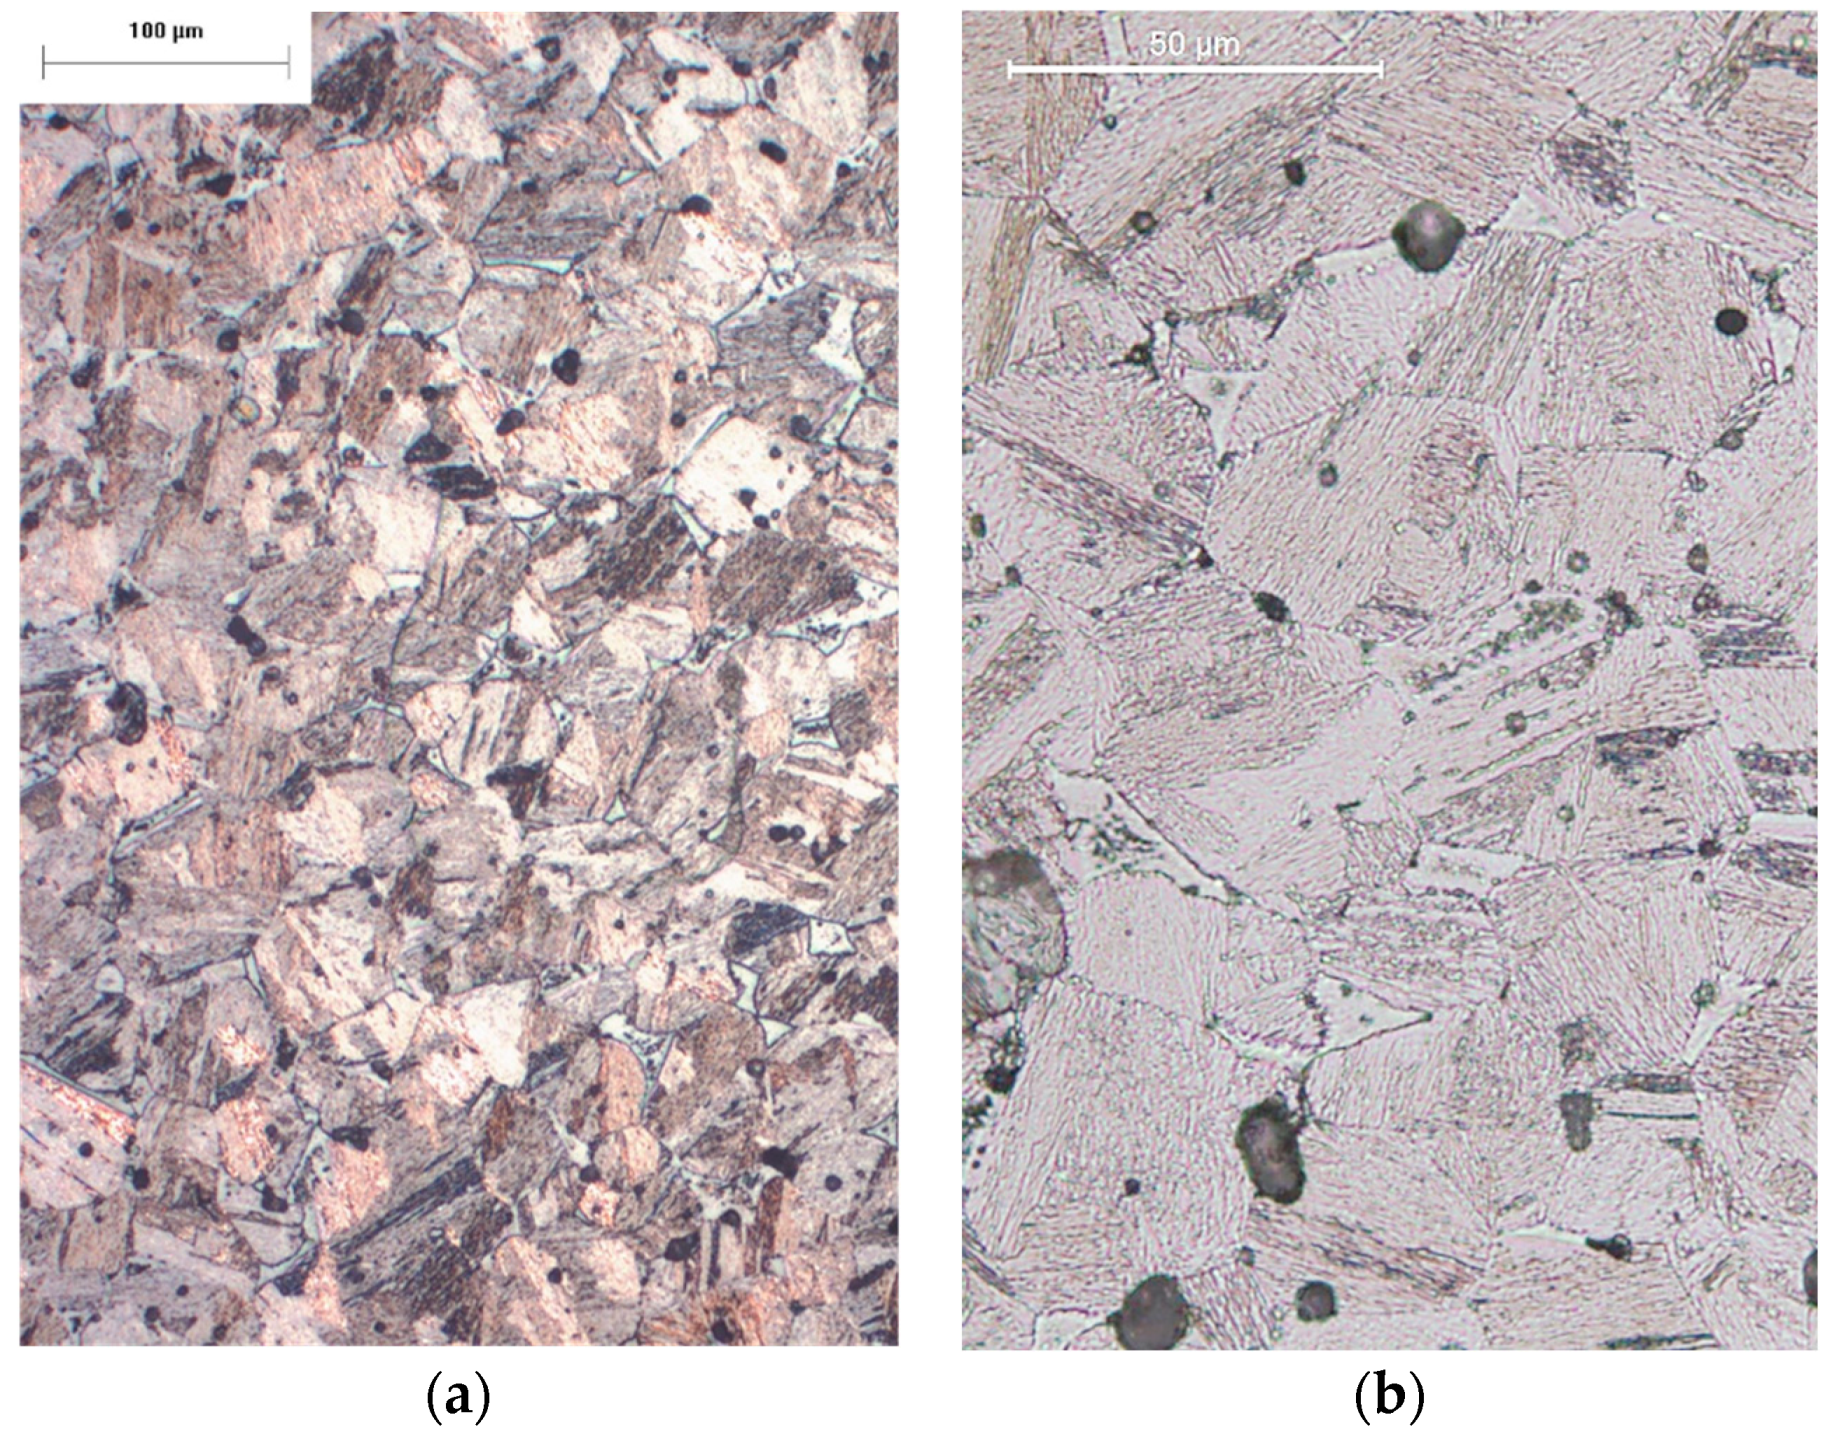
  • In H900 state, the BMD steel exhibits, as expected, a higher creep strength than in H1150 state, although the difference in response gradually vanishes as stress decreases, i.e., time of exposure increases. This behavior can be attributed to progressive overageing of the H900 samples;
  • An extensive population of defects (porosity and silicon-rich oxides) can be observed in the BMD samples; these defects cause an early onset of tertiary stage, and lead to a reduction in the creep life;
  • Comparison with the admittedly scant literature evidence, suggests that the defects above-mentioned cause a 35% reduction in the stress for a given time to rupture for the H1150 state. The reduction was marginally higher (40%) in H900 state;
  • As a whole, the 17-4PH steel remains a material whose creep response is scarcely known. This fact suggests that substantial studies on this subject are required.

Author Contributions

Conceptualization, S.S.; methodology, S.S. and E.S.; validation, A.S., V.D.P., and S.S.; formal analysis, S.S.; investigation, V.D.P. and A.S.; resources, S.S.; data curation, E.S.; writing—original draft preparation, E.S. and V.D.P.; writing—review and editing S.S.; visualization, S.S.; supervision, S.S.; project administration, E.S.; funding acquisition, E.S. All authors have read and agreed to the published version of the manuscript.

Funding

This research was partially funded by the Grant of Excellence Departments, MIUR-Italy (ARTICOLO 1, COMMI 314–337 LEGGE 232/2016).

Informed Consent Statement

Not applicable.

Data Availability Statement

The data presented in this study are freely available on request from the corresponding author.

Conflicts of Interest

The authors declare no conflict of interest.

References

  1. Singh, S.; Singh, G.; Prakash, C.; Ramakrishna, S. Current status and future directions of fused filament fabrication. J. Manuf. Process. 2020, 55, 288–306. [Google Scholar] [CrossRef]
  2. Montani, M.; Demir, A.G.; Mostaed, E.; Vedani, M.; Previtali, B. Processability of pure Zn and pure Fe by SLM for biodegradable metallic implant manufacturing. Rapid Prototyp. J. 2017, 23, 514–523. [Google Scholar] [CrossRef]
  3. Bouaziz, M.A.; Djouda, J.M.; Chemkhi, M.; Rambaudon, M.; Kauffmann, J.; Hild, F. Heat treatment effect on 17-4PH stainless steel manufactured by Atomic Diffusion Additive Manufacturing (ADAM). Procedia CIRP 2021, 104, 935–938. [Google Scholar] [CrossRef]
  4. Nagarajan, B.; Hu, Z.; Song, X.; Zhai, W.; Wei, J. Development of Micro Selective Laser Melting: The State of the Art and Future Perspectives. Engineering 2019, 5, 702–720. [Google Scholar] [CrossRef]
  5. Chemkhi, M.; Djouda, J.M.; Bouaziz, M.A.; Kauffmann, J.; Hild, F.; Retraint, D. Effects of Mechanical Post-Treatments on Additive Manufactured 17-4PH Stainless Steel Produced by Bound Powder Extrusion. Procedia CIRP 2021, 104, 957–961. [Google Scholar] [CrossRef]
  6. Desktop Metal Site. Available online: www.desktopmetal.com (accessed on 21 February 2022).
  7. Di Pompeo, V.; Forcellese, A.; Mancia, T.; Simoncini, M.; Vita, A. Effect of Geometric Parameters and Moisture Content on the Mechanical Performances of 3D-Printed Isogrid Structures in Short Carbon Fiber-Reinforced Polyamide. J. Mater. Eng. Perform. 2021, 30, 5100–5107. [Google Scholar] [CrossRef]
  8. Parenti, P.; Puccio, D.; Colosimo, B.M.; Semeraro, Q. A new solution for assessing the printability of 17-4 PH gyroids produced via extrusion-based metal AM. J. Manuf. Process. 2022, 74, 557–572. [Google Scholar] [CrossRef]
  9. Bajaj, P.; Hariharan, A.; Kini, A.; Kürnsteiner, P.; Raabe, D.; Jägle, E.A. Steels in additive manufacturing: A review of their microstructure and properties. Mater. Sci. Eng. A 2020, 772, 138633. [Google Scholar] [CrossRef]
  10. Sun, Y.; Hebert, R.J.; Aindow, M. Effect of heat treatments on microstructural evolution of additively manufactured and wrought 17-4PH stainless steel. Mater. Des. 2018, 156, 429–440. [Google Scholar] [CrossRef]
  11. Sabooni, S.; Chabok, A.; Feng, S.C.; Blaauw, H.; Pijper, T.C.; Yang, H.J.; Pei, Y.T. Laser powder bed fusion of 17–4 PH stainless steel: A comparative study on the effect of heat treatment on the microstructure evolution and mechanical properties. Addit. Manuf. 2021, 46, 102176. [Google Scholar] [CrossRef]
  12. Mutlu, I.; Oktay, E. Characterization of 17-4 PH stainless steel foam for biomedical applications in simulated body fluid and artificial saliva environments. Mater. Sci. Eng. C 2013, 33, 1125–1131. [Google Scholar] [CrossRef] [PubMed]
  13. Lumley, R.N.; Morton, A.J.; Polmear, I.J. Enhanced creep performance in an Al-Cu-Mg-Ag alloy through underageing. Acta Mater. 2002, 50, 3597–3608. [Google Scholar] [CrossRef]
  14. Kloc, L.; Spigarelli, S.; Cerri, E.; Evangelista, E.; Langdon, T.G. Creep behavior of an aluminum 2024 alloy produced by powder metallurgy. Acta Mater. 1997, 45, 529–540. [Google Scholar] [CrossRef]
  15. Lin, Y.C.; Xia, Y.C.; Ma, X.S.; Jiang, Y.Q.; Chen, M.S. High-temperature creep behavior of Al-Cu-Mg alloy. Mater. Sci. Eng. A 2012, 550, 125–130. [Google Scholar] [CrossRef]
  16. Harvey, P.D. Engineering Properties of Steel; ASM International: Almere, The Netherlands, 1982; ISBN 9781621984801. [Google Scholar]
  17. Yeli, G.; Auger, M.A.; Wilford, K.; Smith, G.D.W.; Bagot, P.A.J.; Moody, M.P. Sequential nucleation of phases in a 17-4PH steel: Microstructural characterisation and mechanical properties. Acta Mater. 2017, 125, 38–49. [Google Scholar] [CrossRef]
  18. Murayama, M.; Katayama, Y.; Hono, K. Microstructural evolution in a 17-4 PH stainless steel after aging at 400 °C. Metall. Mater. Trans. 1999, 30A, 345–353. [Google Scholar] [CrossRef]
  19. Cerri, E.; Evangelista, E.; Spigarelli, S.; Bianchi, P. Evolution of microstructure in a modified 9Cr-1Mo steel during short term creep. Mater. Sci. Eng. A 1998, 245, 285–292. [Google Scholar] [CrossRef]
  20. Spigarelli, S. Microstructure-based assessment of creep rupture strength in 9Cr steels. Int. J. Press. Vessel. Pip. 2013, 101, 64–71. [Google Scholar] [CrossRef]
Figure 1. Schematic of the overall Bound Metal Deposition process: (a) Printing process, (b) Debinding, and (c) Sintering.
Metals 12 00477 g001
Figure 2. Schematic of the creep samples: (a) Geometry; (b) creep sample infills in the slicing software by Desktop Metal.
Metals 12 00477 g002
Figure 3. Creep curves (creep strain vs. creep strain rate) at 482 °C for: (a) D1 H1150; (b) D2 H1150.
Metals 12 00477 g003
Figure 4. Creep curves (creep strain vs. creep strain rate) at 482 °C for D1 H900.
Metals 12 00477 g004
Figure 5. Minimum creep rate as a function of applied stress.
Metals 12 00477 g005
Figure 6. (a) Time to fracture (in s) as a function of minimum creep rate; (b) time to fracture as a function of stress for the BMD steel and for a similar material processed by traditional technologies (data from [16]).
Metals 12 00477 g006
Figure 7. Optical microscopy micrograph of the mirror-polished surfaces: (a) D1; (b) D2 (in one of the location were porosities concentrated).
Metals 12 00477 g007
Figure 8. SEM micrograph of a typical crept fracture surface (D1 material, tested at 550 MPa).
Metals 12 00477 g008
Figure 9. Optical micrographs of the microstructure of the D1 steel after ageing (H1150). Cavities can be easily discerned; the subfigures (a) and (b) show the microstructure at two different magnifications.
Metals 12 00477 g009
Table 1. Chemical composition (wt.%) of the considered 17-4 PH stainless steel.
FeCrCuNiNi + TaMnSiCSON
Bal.16.74.04.50.290.120.450.0310.0010.00950.029
Table 2. Samples and printing parameters used in the present study.
SetParameters
InfillLayer Height [mm]Line Width [mm]OverlapPrinting Speed [mm/s]
Standard (D1)100%0.20.400%30
Dense (D2)100%0.150.440%60
Table 3. Details of the H900 and H1150 precipitation hardening treatments after standard solutioning (1025–1050 °C).
ConditionTemperatureDwell Time, hoursHardness, HRC [16]
H900900 °F (482 °C)142.7–44.5
H11501150 °F (621 °C)431–32.5
Publisher’s Note: MDPI stays neutral with regard to jurisdictional claims in published maps and institutional affiliations.

