Abstract
Metal powder-based additive manufacturing (AM) relies on consistently successful processing of feedstock powder, necessitating through-process predictability in powder properties and behavior. However, routine powder handling and storage may degrade powder performance by influencing flowability and moisture content through exposure to ambient conditions. Therefore, this study aimed to evaluate the effects of repeated environmental exposure on the flowability and moisture content of Al 5056 and Ta powders for AM applications. Using Carney Funnel flow tests, thermogravimetric analysis, and particle size/shape analysis, powder characterization helped elucidate powder property and behavioral changes with exposure. Results indicated inconsistent flowability and moisture content changes for both material types when exposure conditions were altered. Correlational statistics highlighted the most influential particle characteristics on powder behavior after exposure; particle morphology was most impactful for the semi-spherical Al 5056, whereas moisture content and particle size were most significant for the angular Ta. While exposure to laboratory conditions minimally changed powder performance in this study, caution is advised when handling and storing powders in more “extreme” environments. Powder users are urged to implement quality controls alongside powder characterization to pinpoint how specific powders should be treated, handled, and stored in a given environment for successful processing in AM.
1. Introduction
“Additive manufacturing” (AM) has become a ubiquitous term in the manufacturing vernacular partly due to the increased development and accessibility of processing technologies over the past decade. A desirable feature of many AM processes is the ability to rapidly create high-quality parts of complex geometries compared to conventional manufacturing techniques. In addition, most AM processes are based on the premise of a layer-by-layer buildup of feedstock material to create a final bulk product. The feedstock materials commonly used in AM technologies range widely from metallic powder to polymer filament [1,2].
Metallic powder-based AM processes have become increasingly utilized in various use cases, from aerospace to energy to biomedical applications [3,4]. Most metal powder-based processes can be categorized as either (1) powder-fed or (2) powder-bed processes. In powder-fed processes, the metallic powder feedstock is typically transported from a powder feeder to a nozzle, where it is deposited onto a build plate in a single layer at a high temperature in the specific geometry of the desired component. An energy source then melts certain regions of the powder layer to create the structure of the desired component. Successive layers are deposited, melted, and solidified on top of the original layer to create a 3D part. Typical powder-fed processes include laser engineering net shaping and directed energy deposition [4,5]. In powder-bed systems, the feedstock powder is spread across a build plate to create a single layer, whereby an energy source melts a monolayer of powder, similarly to powder-fed systems. Additional powder is then spread across the previous layer of powder, where a new portion of the powder bed is melted, again following a layer-by-layer buildup of material. Powder-bed systems include selective laser melting and electron beam melting [4,5].
Regardless of the type of metal powder-based AM process considered, it is essential to understand the characteristics of the powder feedstock to ensure proper processing, as particular powder properties can significantly influence the successful manufacturing of a part with desired properties and performance. For example, in selective laser melting, powder samples with a narrow particle size distribution (PSD) or a low percentage of fine particles tend to flow well, thus mitigating particle agglomeration and minimizing porosity in the fabricated component [6,7]. Furthermore, while specific powder characteristics, including particle size, PSD, and particle morphology, are fixed for a given powder sample, parameters such as flowability and moisture content are dynamic, changing with the conditions experienced prior to processing. As a consequence of said dynamic nature, the relative importance of controlling powder handling and storage conditions increases to maintain suitable powder properties and behavior for metal powder-based AM processing.
In several studies of metallic powder used in AM applications, intentional exposure of the powder to humid environments has dramatically impacted the powder′s flowability and moisture content; typically, the flowability decreased, and the moisture content increased [8,9,10]. These effects are particularly prominent when powder samples of wide PSDs, small particle sizes, and irregular particle morphologies are exposed to humid conditions [8,11,12]. Furthermore, once the metallic powder has been exposed to the humid environment, it has been shown that the success of the AM process, and potentially the properties of the AM-processed component, can be degraded [13,14]. Fortunately, there is potential for the moisturized powder to be dried and reconditioned to at least partially return it to its original properties [11,14,15]. While previous work has been done to evaluate generalized changes in powder flowability and moisture content, the field’s current understanding of how these evolve with environmental exposure is relatively underdeveloped. As powders are often exposed to humid ambient conditions in various settings, from industrial warehouses to research labs, it is crucial to gain a baseline understanding of how the powder is affected by routine handling and storage protocols. Thus, this study aimed to systematically investigate the effect of repeated environmental exposure of several metallic powder samples under standard laboratory conditions on their flowability and moisture content for end use in AM applications. Fundamental statistical analyses accompany experimental data as a means of identifying linkages between powder handling and storage practices, particle characteristics, and powder behavior. This study was completed to inform powder handling and storage practices for those involved with metal powder and metal powder-based AM processes, highlighting the influential parameters on powder properties to guide future manufacturing, experimentation, and characterization.
2. Materials and Methods
2.1. Materials
Two powders were utilized in this study—aluminum 5056 (Al 5056) powder and pure tantalum (Ta) powder—both of which were treated and sourced by Solvus Global (Worcester, MA, USA). Before the initial powder characterization, the powders were dried in a rotary furnace (Xiamen Tmax Battery Equipments Limited, Xiamen City, China) using a low-temperature heat treatment (under 230 °C) to remove any moisture from the powder and ensure homogeneous powder flowability; this was a proprietary treatment, so no additional details of treatment time and temperature were given. All pre-processing of the powder was completed in an inert argon atmosphere to avoid any environmental contamination prior to characterization. After the bake-out treatment, the larger powder batches were segmented into smaller borosilicate glass vials in 50 g increments. The vials were then sealed in a glovebox with an argon atmosphere to ensure no environmental contamination prior to characterization.
2.2. Powder Characterization
Initial powder characterization was completed in conjunction with the powder packaging in the glovebox. According to the flowability characterization protocols discussed in this section, several flowability measurements per powder type were taken before packaging. Once the samples were removed from the glovebox, a specific powder sample (Lot #0) was characterized for moisture content according to the procedure described in this section. The specifics of the naming schemes associated with powder samples will be discussed further in Section 2.3.
In order to quantify the flowability of the Al 5056 and Ta powders, a Carney Funnel was utilized per ASTM International’s Standard B964-16 (ASTM International, West Conshohocken, PA, USA) [16]. In this method, the time it took for 50 g of powder to flow through the funnel was recorded. This time was then divided into the exact mass of the powder tested to obtain a flow rate in g/s. Each sample was run through the Carney Funnel three times to ensure repeatability. This test was also completed in an inert glove box to avoid contamination. As a note, testing of the flowability of the Al 5056 and Ta powders was initially completed using a Hall Flowmeter Funnel per ASTM International’s Standard B213-20 [17]; however, neither of the powders was able to flow through the 2.54 mm orifice of the Hall Flowmeter Funnel, so the Carney Funnel was used with its larger 5.08 mm orifice following ASTM International’s standards.
The moisture content of the metallic powders was measured using a thermogravimetric analysis (TGA) method. A TA Instruments Series Q50 TGA (TA Instruments, New Castle, DE, USA) was utilized to heat small samples (~10 mg) of metallic powder to an elevated temperature in a nitrogen environment according to a user-specified thermal treatment; in this study, both powders were heated under the same conditions to measure moisture content: the powders were heated from room temperature to 250 °C at 20 °C/min, at which point they were held isothermally for 15 min to drive off all moisture. The mass loss measured throughout this low-temperature treatment is assumed to be equivalent to the moisture loss from the powder sample, and thus the moisture content in the powder; the mass loss in mg was converted to weight percent, based on the mass of the powder tested, and then to parts per million (ppm) for convenience.
Particle size distribution (PSD) and particle morphology were also evaluated in this study using an electron microscope and a particle size/shape analyzer. A Zeiss EVO MA-10 Scanning Electron Microscope (SEM) (Carl Zeiss AG, Oberkochen, Germany) was utilized to qualitatively evaluate the size and shape of the powder samples; the loose powders were mounted on SEM stubs with carbon tape and were imaged at 10 kV at 250× magnification. In addition, a Microtrac FlowSync system (Microtrac Retsch GmbH, Haan/Duesseldorf, Germany) was utilized to quantitatively measure the samples’ particle size and shape through a hybrid laser diffraction and dynamic image analysis method. Before being added to the FlowSync system, powder samples were mixed into a deionized (DI) water and Triton-X 100 surfactant solution. They were then pipetted into the sample loading chamber, where the powders were measured three times for repeatability. Consistent with prior results, this method was well suited for particle characterization for AM applications, leveraging the strength of particle size measurements from the laser diffraction and morphology measurements from the dynamic image analysis [18].
2.3. Environmental Exposure
After the Al 5056 and Ta powders were initially packaged and characterized, they were subjected to a specific set of repeated environmental exposures over a 91-day (or 3-month) period. The details associated with each set of exposures are laid out in Figure 1, which shows the different lots of powder packaged, exposed, and characterized throughout the study. As a note, Figure 1 is a general experimental matrix that does not correspond to any particular material type; this set of experimentation was done on both the Al 5056 and Ta powders.
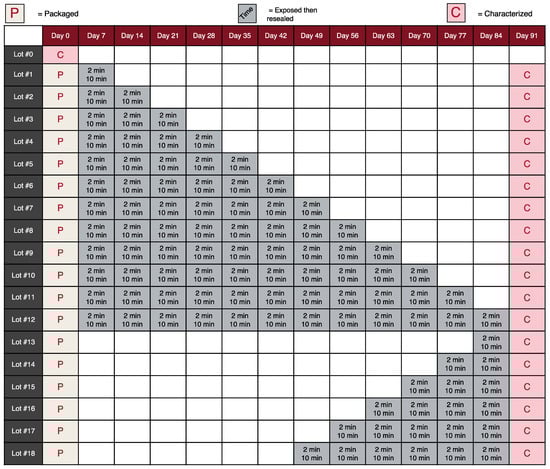
Figure 1.
An experimental matrix of the packaging, exposure, and characterization of the Al 5056 and Ta powder samples in Lots #0 through #18 for the three-month study.
There were 18 lots of powder labeled Lot #1 through #18 for each powder type that underwent unique exposure treatments. All the powder samples were compared to a control sample (Lot #0) that was not exposed to environmental conditions, which was characterized on Day 0; this enabled the determination of the influence of exposure on powder properties and behavior. According to Figure 1, each vial of powder was initially packaged on Day 0 (indicated by a tan box) and was sealed until it needed to be exposed, whether for a prescribed weekly exposure (indicated by a gray box) or for final characterization (indicated by a pink box). Final characterization for flowability and moisture content was completed on Day 91 for all powder lots (apart from Lot #0). On a given exposure date, the powder sample containers were unsealed and opened, thus exposing the samples to the ambient conditions. Powders were intermittently stirred throughout the exposure to ensure homogeneous environmental exposure, prescribed per the experimental matrix in Figure 1. After the given exposure duration was complete, the powder containers were closed and resealed until their subsequent weekly exposure or final characterization; the white boxes in Figure 1 indicate the weeks in which a given lot of powder remained sealed and thus unexposed.
Many factors can be evaluated through the systematic exposure of Lots #1 through #18 of the Al 5056 and Ta powders. Lots #1 through #12 were used to determine the effect of several factors on powder flowability and moisture content: (1) the number of exposures, which varies between 1 to 12 exposures; and (2) the exposure duration, which varies between a shorter exposure time of 2 min and a longer exposure time of 10 min. The exposure durations were selected based upon reasonable exposure times expected in both laboratory and industrial settings with AM processing in mind. Lots #13 through #18 were also utilized to determine the effect of the number of exposures and exposure duration on powder properties and behavior but were mainly designed to show the effect of exposure time concerning initial packaging. Specifically, these samples were exposed between 1 and 6 times and were designated as “late” exposures, given the length of time between initial powder packaging to the time of exposure. The corresponding samples of 1 through 6 exposures immediately after powder packaging, labeled Lots #1 through #6, were called “early” exposures. This comparison of “early” versus “late” exposures could be used to help determine if powders should be used right away after initial packaging or could be used much later after packaging, depending on if the powder properties and behavior degrade with storage time.
One important note about the exposure of the Al 5056 and Ta powder samples is the storage and exposure conditions throughout the study. The powder storage and exposure were completed under “standard” laboratory conditions; this means that temperature was controlled using a generic thermostat to ~20 °C, but the humidity was allowed to vary naturally with no imposed humidity controls. The temperature and humidity were monitored using a DHT22 Temperature and Humidity Sensor (Adafruit Industries, LLC, New York, NY, USA) connected to an Arduino Uno Rev 3 via breadboard, jumper wire, and 4.7 kOhm resister configuration, which ultimately recorded the laboratory conditions every 2 s throughout the study. The specifics of the relevant laboratory conditions during exposure will be discussed later in Section 3.3.
2.4. Statistical Analysis of Experimental Data
Correlational statistics and data analysis was implemented to relate powder behavior (e.g., flowability) to several particle characteristics and environmental exposure conditions as a means of identifying the most influential variables on powder flowability. The features included in this analysis, highlighted in Table 1, are commonly recognized as affecting powder flowability and were thus selected based upon this domain knowledge of the authors. However, these features are not a comprehensive list of measured values, and future experimentation will be performed to expand upon the variables considered in this type of analysis. The complete dataset utilized for correlational statistics is provided in the supplementary document “Compiled Data for Statistical Analysis” (Supplementary Materials).

Table 1.
Select features included in statistical analysis based upon domain expertise.
A typical multivariate linear regression model, based upon ordinary least squares (OLS) regression, was utilized to provide insights into relationships between predictive features (Table 1) and the target variable: flowability. Several subsets of the entire dataset were studied, split based upon the material type. First, the entire dataset was segmented based upon the metal powder at hand, resulting in three datasets: Al 5056 Only, Ta Only, and Al 5056 + Ta. The Al 5056 Only and Ta Only datasets were analyzed to observe material-specific dependencies of flowability on the selected features, whereas the combined Al 5056 + Ta dataset was explored to observe any material-independent relationships between the selected features and flowability that surface from a set of powders with diverse characteristics. Next, several other subsets of data were considered wherein different features were included or excluded from the analysis. Ultimately, several variables from Table 1 were excluded from analysis, given that they resulted in overfitting or diminished physical significance of model results—this will be further discussed in Section 3.4. As a final note, an essential manipulation of the Ta-based dataset was that two lots of powder were removed from consideration based on their anomalous “no flow” condition determined by the Carney Funnel method; this will also be discussed further in Section 3.4.
Though data standardization and normalization are not necessary for OLS regression due to the dynamic nature of the regression coefficients, as well as the invariant nature of OLS regression when compared to that of Least Absolute Shrinkage and Selection Operator (LASSO) regression, for example, it is not uncommon to still perform data pre-processing to ensure model success. In this study, the predictive features were subjected to a preliminary screening using the variance inflation factor (VIF), which detects the degree of multicollinearity between features [19]. While a linear regression technique relies upon the linear dependency of a target variable on its regressors, its predictive success is based upon the assumption that there is a minimal linear dependence between the regressors themselves. If there is a high degree of linear dependence, or multicollinearity, between the predictive features, the statistical significance of model performance will decrease drastically as the variance associated with the determination of regression coefficients increases. Multicollinearity was addressed via VIF analysis to capture how much each predictor variable contributes to the standard error of the OLS model. Several standard practices exist in the application of VIF analysis, namely that a VIF of 1 indicates no multicollinearity between predictor variables and that a VIF greater than 10 indicates deleteriously high levels of multicollinearity. Accordingly, in this work, VIF analysis was applied such that features with VIF greater than 10 were removed from consideration in analysis one by one, recursively eliminating those with the highest VIF until no feature had a VIF greater than 10.
Following the feature selection by VIF analysis for a given dataset, the remaining (suitable) features were subjected to an OLS regression with a 0.33–0.67 test-train split and a random state equal to 1. The resulting mean absolute error (MAE) and root mean square error (RMSE) of the regression, test, and train datasets were extracted (when appropriate) to evaluate overall model performance utilizing the given test-train regime. After the regression, the features selected by VIF analysis were ranked utilizing an F-statistic, calculated via the “sklearn.feature_selection.f_regression” function of the scikit-learn 1.0.1 analysis package [20]. Using this function, the cross-correlation between each predictive feature and the target variable was computed and then converted into an F-statistic. The predictive features were subsequently ranked using the calculated F-statistics, whereby the features with the highest value for a given subset were considered most linearly associated with flowability (and vice versa for lower F-statistics). As a note, mutual information regression (MIR) was also applied to the present experimental data, given that it captures any statistical dependence between the regressor and the target variable (not just linear dependencies). However, given that MIR is a nonparametric analytical technique, the accuracy of its regression was compromised based upon the limited number of samples considered in this study; therefore, MIR was not implemented further, and the F-statistic was the only approach for feature ranking used in this study.
This analysis was executed using the open-source package distribution known as Anaconda® (Anaconda, Inc., Austin, TX, USA). Beyond the reliance upon Anaconda, Inc.’s data science-inspired distribution, Python-based implementation (Python 3.8.1, Python Software Foundation, Beaverton, OR, USA) of statistical data analysis techniques was achieved via Spyder 4.2.5, which serves the open-source community as an integrated development environment for scientific and engineering applications. As for Python packages employed during this analysis and research, pandas, sklearn, numpy, seaborn, and statsmodels were called upon for an array of programmatic purposes. For more information and detailed discussion on the data pre-processing implemented in this study, readers are encouraged to consult [21] for resources on applied predictive modeling.
3. Results & Discussion
Before analyzing the variation of powder properties with environmental exposure, one must first gain a generalized understanding of the characteristics of the Al 5056 and Ta powders studied in this work. A baseline understanding of Al 5056 and Ta particle size and shape was formulated via qualitative analysis using the SEM micrographs of both powder types in Figure 2. In Figure 2a, the inertly gas atomized Al 5056 powder can be characterized by a combination of oblong and roughly spherical particles. The Al 5056 powder also displays a combination of larger and smaller particles, owing to the potential for a rather large PSD. In Figure 2b, the angular morphology of the Ta powder is very evident, as is its relatively wide PSD with the combination of larger and smaller particles; this is logical, given that the Ta powder was likely produced from a hydride-dehydride method. Given this generalized description of the Al 5056 and Ta powders, a more contextualized analysis of the trends in flowability and moisture content can be performed. Further quantitative analysis of particle size and morphology will be discussed in Section 3.3.
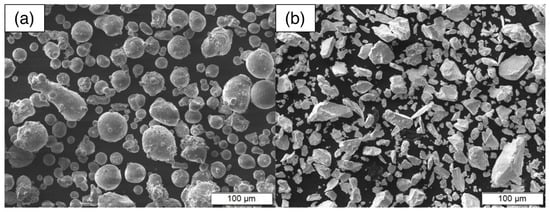
Figure 2.
SEM micrographs of the (a) Al 5056 powder and (b) Ta powder.
3.1. Flowability
The flowability data from Lots #0 through #12 of the Al 5056 and Ta powders, as procured from the Carney Funnel flow test, are presented in Figure 3, where the flow rate (in g/s) is plotted versus the number of exposures for both powder types at each exposure duration. As a preliminary observation, it can be generally stated that there were slight changes in the flow rate of both powder types as the number of exposures was varied for both exposure durations. The plots in Figure 3a,b suggest a potential for a decrease in flow rate as the powder is exposed, which would be an anticipated occurrence [10,22]. However, given the relatively inconsistent linear trend of flow rate with the number of exposures, further experimentation would have to be done to validate this. As a note, the linear trendline in Figure 3b for the 10 min Ta samples does not include the two “no flow” samples at 9 and 10 exposures, which are reported as a flow rate of 0 g/s. This flowability behavior is rather unexpected, given the breakaway from the somewhat linear trend observed with the other samples. Said observations also highlight a limitation of the Carney Funnel flow method, which has also been previously reported for the Hall Flowmeter Funnel flow test, where minimal informative data on the flowability of the powder samples are produced if they are categorized under the “no flow” condition [23]. It is not clear from the present findings why these two samples exhibited the “no flow” condition after exposure.
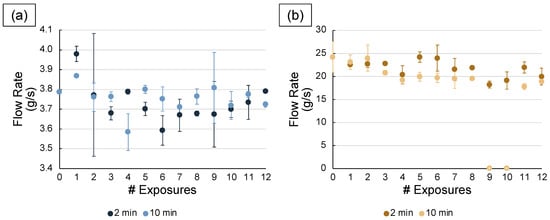
Figure 3.
Flow rate (in g/s) of (a) the Al 5056 powder and (b) the Ta powder for Lots #0 through #12 (0 to 12 exposures) at both exposure durations (2 min and 10 min).
Another noteworthy observation of the flowability data in Figure 3 is the innate difference in magnitude of the flow rates from Al 5056 and Ta. For all the 2 min and 10 min samples, the Al 5056 flow rates scatter around ~3.7 g/s, while the Ta flow rates scattered around ~21.2 g/s. These differences directly highlight the gravity-driven nature of the Carney Funnel flow test, which is heavily dependent on the density of the powder material; given that the density of Ta (16 g/cm3) is much higher than Al 5056 (2.7 g/cm3), a higher flow rate for Ta by the Carney Funnel flow test is expected. However, this may also pose a limitation of implementing the Carney Funnel flow test method, as effects on flowability from PSD, particle morphology, and moisture content, to name a few, are obscured by the density dependence of this flowability metric; further discussions about this will be discussed in Section 3.3.
An exploration of the flowability of the “early” and “late” exposure samples using Lots #1 through #6 and Lots #13 through #18, respectively, of the Al 5056 and Ta powders is also possible through the Carney Funnel test data, which is depicted in Figure 4. Again, flow rates for the “early” versus “late” samples were plotted versus the number of exposures (from 1 to 6 exposures, this time). Figure 4a and Figure 4c depict the flow rates for the 2 min exposure samples of the Al 5056 and Ta powders, respectively, whereas Figure 4b and Figure 4d depict the flow rates for the 10 min exposure samples of the Al 5056 and Ta powders, respectively. Similar to the data in Figure 3, the flow rates for the powder samples highlighted are somewhat inconsistently scattered, with no clear trend between the “early” versus “late” exposures as the number of exposures is increased and the exposure duration is changed. This could prove beneficial for long-term powder storage, as these data suggest there would be minimal changes in powder flowability so long as the powder containers remain sealed and unexposed prior to use.
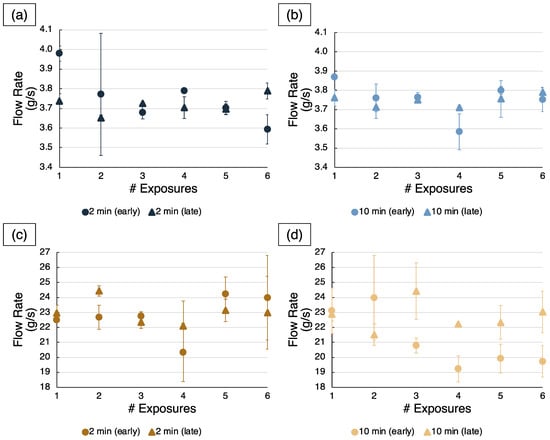
Figure 4.
Flow rate (in g/s) of the Al 5056 powder at (a) 2 min and (b) 10 min exposure durations and the Ta powder at (c) 2 min and (d) 10 min exposure durations for the “early” and “late” exposures from Lots #1 through #6 and #13 through #18, respectively, for each powder type.
3.2. Moisture Content
The study of moisture content in metallic powders is a complex topic, as it is a dynamic characteristic that depends on many factors. While it has shown its importance in impacting the success of metal powder-based AM processes, such as laser powder bed fusion, moisture content is also a driving factor that influences powder flowability [23,24]. The moisture content for Lots #0 through #12 of the Al 5056 and Ta powders, as measured by TGA, is presented in Figure 5. Consistent with the flowability data for both powder types, the moisture content values are somewhat scattered, often in an unexpected way. No discernible trend in moisture content can be observed in either powder type when the number of exposures or the exposure duration is changed. While there may be an indication from some of the linear trendlines in Figure 5 that there should be an increase in moisture content when the powder is repeatedly exposed, this is not a clear trend. With the 10 min Al 5056 data, it does appear that the moisture content values are nearly equivalent or higher than the 2 min values at every number of exposures, which is a logical result given the more prolonged exposure to the humid environmental conditions. However, the change in moisture content between each number of exposures appears illogical at first glance. The scatter presented in this data also appears to be much more extreme than the flowability measurements, with much larger percent differences between each exposure datapoint and its average moisture content across all exposures.
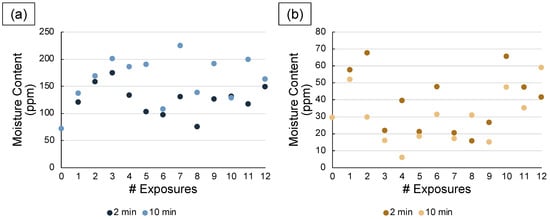
Figure 5.
Moisture content (in ppm) of (a) the Al 5056 powder and (b) the Ta powder for Lots #0 through #12 (0 to 12 exposures) at both exposure durations (2 min and 10 min).
Like the flowability data, there appears to be a dependence of moisture content on the powder’s material system, with a much higher average moisture content for the Al 5056 powders (around ~140 ppm) than the Ta powders (around ~34 ppm). While these differences in moisture content are significantly influenced by particle size/shape characteristics, such as morphological irregularities and small particle sizes, it is plausible that the magnitude of these differences between the Al 5056 and Ta values are due to elemental differences, which may be related to the powders’ affinity to react to the environment by picking up moisture or changing composition [8,11,25]. This apparent material dependency may also arise from a material-specific response to the preliminary bake-out treatment, necessitating tailored thermal pre-processing for a given material type to drive the moisture content towards zero. The origin of these differences is unclear and is worth considering as an avenue of future experimentation; furthermore, future work should be considered to identify if material-dependent handling and storage are necessary to maintain suitable moisture content for metal powder-based AM processing.
A comparison of the “early” versus “late exposures” can also be completed with the moisture content data from the Al 5056 and Ta samples. In Figure 6, the moisture content for the “early” versus “late” samples is again plotted versus the number of exposures (from 1 to 6 exposures, this time). Figure 6a and Figure 6c depict the moisture content values for the 2 min exposure samples of the Al 5056 and Ta powders, respectively, whereas Figure 6b and Figure 6d depict the moisture content values for the 10 min exposure samples of the Al 5056 and Ta powders, respectively. Here, it is apparent that there is again a significant amount of scatter in this data, all around nearly the same moisture content for each set of exposure times and material type; including both the “early” and “late” datasets, the 2 min and 10 min Al 5056 samples averaged ~132.35 ppm moisture and ~165.49 ppm moisture, respectively, while the 2 min and 10 min Ta samples averaged ~49.47 ppm moisture and ~45.70 ppm moisture, respectively. For all the Ta 10 min samples, the “late” exposures had a higher moisture content than the “early” exposures, which would suggest that storing the powder for long periods without intentional environmental exposure could increase moisture content. However, these results are inconsistent with the other data in Figure 6, and future experimentation would be required to validate this claim.
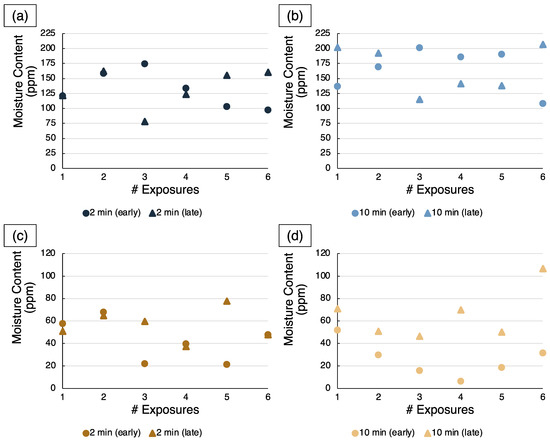
Figure 6.
Moisture content (in ppm) of the Al 5056 powder at (a) 2 min and (b) 10 min exposure durations and the Ta powder at (c) 2 min and (d) 10 min exposure durations for the “early” and “late” exposures from Lots #1 through #6 and Lots #13 through #18, respectively, for each powder type.
3.3. Influential Factors on Powder Properties and Behavior
From the flowability data in Figure 3 and Figure 4 and the moisture content data in Figure 5 and Figure 6, one can confidently say that the properties and behavior of the Al 5056 and Ta powders in this study vary inconsistently as they are exposed to different environmental conditions. Given this, it is essential to investigate what powder characterization can reveal about these inconsistencies. While many factors influence metallic powders′ flowability and moisture content, the most important ones considered herein are (1) the laboratory conditions during exposure and (2) particle size and morphology effects.
The average laboratory conditions—specifically, temperature (in °C) and humidity (in %)—were recorded during each exposure day throughout the study and were plotted in Figure 7. Given that the temperature was controlled in this laboratory, there were minimal changes in temperature across the study, with an average temperature of 21.7 ± 0.5 °C across all exposure days in the study. However, the humidity in the laboratory was not directly controlled, which was evident through the spikes in the humidity curve in Figure 7; considering all exposure days in the study, the average humidity was 26.4% ± 6.7%. While the humidity levels resided within a typical range for laboratory operation between 20% and 40%, particularly towards the end of the study, several spikes and dips in humidity (such as at Days 35 and 42) may prove concerning for consistent moisture content changes and therefore effects on flowability. Given that the changes in powder moisture content are only anticipated to change based upon the ambient conditions during exposure, the humidity appears to be of great importance.
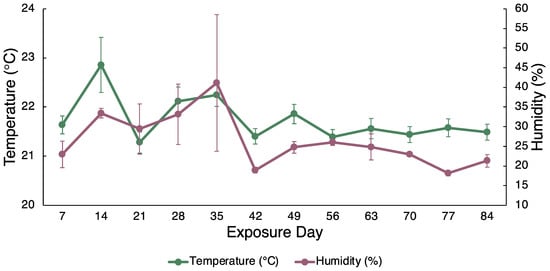
Figure 7.
The average laboratory temperature (in °C) and humidity (in %) on each exposure day throughout the three-month study.
Given that the humidity naturally varied throughout the study, the scattered patterns and inconsistent changes in moisture content of the Al 5056 and Ta powders can be justified, and thus the flowability along with it. However, neither the changes in temperature nor humidity alone directly correlated with any spikes or dips in flowability or moisture content; therefore, it is essential to investigate other root causes of these inconsistencies in powder properties and behavior, such as particle size and morphology effects. Other aspects of the effects of exposure conditions on flowability and moisture content will be considered in Section 3.4 and Section 3.5.
It has been firmly established in the study of powder systems that particle size and morphology greatly influence powder flowability and moisture content. Therefore, the particle size/shape data in Table 2 were extracted after analyzing all Al 5056 and Ta powder samples in the Microtrac FlowSync system using a combined laser diffraction and dynamic image analysis method. In Table 2, several measured and calculated parameters are displayed to describe the PSD and morphology of the Al 5056 and Ta powders. To help analyze the size of the powders, the 10th, 50th, and 90th diameter percentiles—labeled , , and , respectively—were reported, which are commonly used in particle analyses for metal powder-based AM processes. Along with the D-values, the values of the volume percent of particles under both 10 μm and 20 μm in size were provided for both powder types, which indicates the relative quantity of fine particles in the samples. Apart from the measured size parameters procured from the Microtrac system, the unitless parameter was calculated from the , , and values to provide a metric of the breadth of the PSD, with a larger representing a broader PSD and vice versa. was calculated using Equation (1):
Table 2.
Average and standard deviation values of several measured and calculated particle size and morphology parameters of all the Al 5056 and Ta powder samples in Lots #0 through #18.
Several particle morphology parameters were also reported from the Microtrac system, which can be found in Table 2; however, this is not a comprehensive list of the values measured for all powder samples. As an important note, all the shape-related parameters reported from the Microtrac FlowSync system are done utilizing the dynamic image analysis features of the hybrid analysis mode, which provide 2D particle measurements based upon thousands of images taken of various particles in the test sample. For example, the parameter is a value that ranges from 0 to 1 and measures how circular a particle’s cross-section is, with unity representing a perfect circle. The calculation of follows Equation (2), based upon the particle’s and :
The ratio of the particle’s surface area to volume—denoted by —was also of interest because this ratio serves as a metric of a powder’s affinity to adsorbing specific compounds on its surface; this is a commonly utilized metric to observe surface energy-related changes associated with the ratio [26,27]. Given that the Microtrac does not provide 3D measurements, the calculations of surface area and volume are solely approximations based upon the particle’s 2D image profile, resulting in an approximation of the ratio; more accurate estimations of the ratio could be completed using Brunauer-Emmett-Teller (BET) measurements for surface area quantification and 3D particle size/shape analysis for volume calculations. Using the Microtrac FlowSync data, the ratio can be calculated based upon Equation (3):
Equation (3) relies on the term , an area equivalent diameter (calculated from dynamic image analysis data) based upon the diameter measurement of a circle with equivalent area to the 2D image of a specified particle. The calculation for can be done utilizing Equation (4), which is based upon the particle’s :
To begin, the particle size data in Table 2 show a much larger particle size for the Al 5056 powder compared to the Ta powder, with a higher average , , and and lower standard deviation across all Al 5056 samples compared to the Ta samples. Complementary to this, the volume percent of particles under 10 μm and 20 μm is much higher for the Ta samples—7.757% ± 1.128% and 31.418% ± 3.152%, respectively—than the Al 5056 samples—0.155% ± 0.007% and 7.645% ± 0.364%, respectively. Given the tendency of a sample with smaller particles to have trouble flowing and to pick up more moisture, it is not surprising that the Ta powder samples flowed more inconsistently than the Al 5056 samples, particularly with the associated “no flow” conditions [28]. This disparity in particle size can also be visualized through the PSD histogram line plots in Figure 8 for both powder types, where the center of the Ta PSD is shifted to a lower value than the Al 5056 PSD. As a note, Figure 8 was constructed using a single powder sample from one of the Al 5056 and Ta lots, respectively, with a representative PSD.
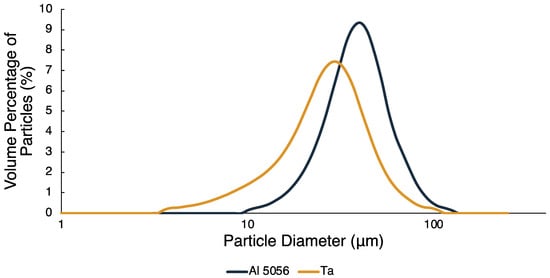
Figure 8.
PSD histogram line plots for a representative sample of the Al 5056 and Ta powders.
The spread of the PSD is also an essential factor in determining powder flowability, which is depicted by the histogram line plots in Figure 8. The PSD for the Ta powder is visually much broader than the Al 5056 powder, with a prominent tail at smaller particle sizes. This broad distribution can be quantified with the parameter in Table 2, which is higher for the Ta powder (1.616 ± 0.261) than the Al 5056 powder (1.109 ± 0.065), as expected. Troubles with consistent powder flowability measurements have also been found with powders of broad PSDs, which aligns well with the flowability data reported in Figure 3 and Figure 4 [29]. As a note, while the Ta samples were expected to flow “worse” than the Al 5056 samples given their smaller particle size and wider PSD, the flow rates produced by testing in the Carney Funnel are higher for the Ta powders than the Al 5056 powders; this reaffirms a limitation of the Carney Funnel flow test method, whereby PSD effects are masked by the material density effects on flow rate.
Particle morphology also plays a critical role in moisture content and flowability values observed with the Al 5056 and Ta powders. As listed in Table 2, the primary morphology parameters considered here for both powder types are and ratio. The of the Ta powder (0.931 ± 0.001) is lower than that of the Al 5056 powder (0.965 ± 0), indicating that the powder is less spherical and thus more irregularly shaped. Moreover, the ratio of the Ta powder (0.374 μm−1 ± 0.013 μm−1) is slightly higher than the ratio for the Al 5056 powder (0.233 μm−1 ± 0.003 μm−1), which usually links to a greater tendency to adsorb moisture during exposure. Given the increased particle irregularity and ratio of the Ta powder compared to the Al 5056 powder, it makes sense that flowability and moisture content values were more inconsistent with the Ta powder than the Al 5056 powder. However, it is important to note that the Al 5056 moisture content values did vary with greater magnitude than the Ta moisture content, which may speak to this apparent material dependence of property and behavior fluctuations with environmental exposure.
3.4. Statistical Analysis
To complement the semi-quantitative analysis presented in Section 3.3 of the alternative factors affecting powder flowability and moisture content, including laboratory conditions and particle size and shape, correlational statistical methods were employed to provide quantitative insights into powder property–behavior linkages. By identifying these connections, powder users will better understand which factors—from powder handling and storage conditions to powder characteristics and pre-processing treatments—affect powder behavior more than others.
In the present statistical analysis, OLS regression (facilitated by Python-based programming) was used as the principal analytical technique, performed on multiple datasets previously mentioned in Section 2.4. The features utilized in the regression-based models, considered for each lot of powder in all three datasets, were based upon the features presented previously in Table 1. However, several features were eliminated from analytical scrutiny, given that their inclusion in the regression model compromised model performance and interpretability. Specifically, the “Median Convexity,” “Number of Exposures,” and “Exposure Duration” were eliminated, as the models overfitted to match these values, given their uniformity across powder lots with “Median Convexity” and their strong linear increase between samples for “Number of Exposures” and “Exposure Duration.” Additionally, the “Average Exposure Temperature” and “Average Exposure Humidity” were removed from consideration as predictive features for flowability; ultimately, the temperature and humidity associated with specific environmental exposures would affect moisture content directly, rather than flowability. Therefore, only the “Moisture Content” variable was considered to account for these temperature and humidity effects, as they are effectively embedded within this feature value; this was done to maintain the physical significance of the implications of this regression-based analysis. Once these features mentioned above were initially eliminated, the ten remaining features in Table 1 were utilized in subsequent analysis.
To ensure that the implemented OLS regression model produced robust and interpretable results, the predictive features utilized first needed to be screened to check for multicollinearity. Hypothetically, if several independent variables were used in the regression with a high degree of linear dependence, model performance would decline with the increased variance associated with the calculated regression coefficients. Ultimately, the VIF metric was calculated to identify multicollinearity between predictive variables, which were eliminated one-by-one iteratively if their values were higher than the threshold value of 10, removing only the highest VIF greater than 10 each time. As a note, if the manner of feature elimination was changed—meaning, if the features were not eliminated in the order of the highest VIF greater than 10 first, with others afterward—then the resulting VIF values may be changed for each dataset and the resulting parameters considered suitable for OLS regression may be altered.
Upon carrying out this feature elimination process for each dataset, the VIF values in Table 3 were produced for each predictive feature. All the features presented in Table 3 for each dataset pass the VIF criterion of being less than 10 and appear to be less than 5, meaning that multicollinearity will most certainly not hinder the predictive nature of the subsequent regression-based analysis. Of the ten features considered for each dataset, only six parameters passed the VIF criterion for the Al 5056 Only and Ta Only datasets, whereas only three passed for the combined Al 5056 + Ta dataset. Interestingly so, the same six features passed for the Al 5056 and Ta datasets but were ordered differently in terms of their VIF statistics, given how linearly independent they were from one another for that specific powder. Accordingly, the “”, “”, “Volume Percent of Particles Under 20 μm in Size”, and “Surface Area to Volume Ratio” were all neglected in subsequent regression models, based upon their calculated VIF values. It is worth noting that the “”, “Moisture Content”, and “” were considered suitable features for regression in all three datasets.
Table 3.
VIF values of the Al 5056 Only, Ta Only, and Al 5056 + Ta datasets for feature screening for multicollinearity.
After the VIF analysis was completed for each dataset, OLS regression was performed according to the details presented in Section 2.4. The regression coefficients calculated were not crucial in this study; however, the resultant MAE and RMSE metrics were necessary for evaluating predictive success and model robustness for the test and train datasets. The MAE values and the RMSE values for the test and train sets are presented in Table 4. With a multivariate linear regression model, the MAE value represents the average of the absolute value of the residuals, denoting the model’s predictive success; this metric is based upon a perfect predictive model with an MAE of zero and larger values indicating worse predictive capacity. Here, for each of the three datasets considered, the MAE values are less than 2, highlighting that the regression models can successfully predict flowability using the selected features. The Al 5056 Only and Ta Only datasets have a slightly lower MAE than the Al 5056 + Ta dataset, suggesting that the material-specific predictions are more accurate than with the dataset consisting of multiple material types. In this statistical analysis, the RMSE values for the test and train sets are also of interest, which corresponds to the standard deviation of the residuals. As this value measures the degree of scattering associated with the predictive errors of all data points in a given dataset, an RMSE of zero indicates a perfectly consistent predictive error, and higher values indicate increasingly scattered error. The RMSE values produced were calculated for both the test and train datasets to ensure that the predictive capacity associated with the test set was comparable to the train set. For the powders analyzed, the RMSE values of both the test and train sets for each dataset are less than 3, indicating relative success in consistently predicting flowability values for each sample. Of utmost importance is that within each dataset, the test and train RMSE values are comparable; this means that the model′s predictive capacity is sound when new data is introduced into the model with the training dataset. It is also worth noting that, again, like the MAE values, the Al 5056 + Ta dataset has higher values than the single material datasets, potentially suggesting that the material-specific flowability predictive models are the most successful.
Table 4.
MAE and RMSE values for each dataset.
Given the MAE and RMSE values in Table 4, one can be confident in the success of the regression model implemented. Therefore, the features considered in the regression model can be ranked based upon their importance in predicting the target variable, owing to the features’ significance in influencing powder flowability on a larger scale. Using the “sklearn.feature_selection.f_regression” package of scikit-learn 1.0.1, the F-statistics for each feature of the Al 5056 Only, Ta Only, and Al 5056 + Ta datasets were calculated, which are presented in Table 5.
Table 5.
F-statistic calculated for the features considered in the Al 5056 Only, Ta Only, and Al 5056 + Ta datasets after VIF analysis.
For each of the three datasets in Table 5, the features are ordered in descending order of their associated F-statistic values. Higher values correspond to an increased importance for model predictions and, therefore, more significant influence on predicting powder flowability. As a generalized observation, it appears that the F-statistic values for the features of the Al 5056 Only dataset are similar to one another. In contrast, the values are much further separated for individual features than others with the Ta Only dataset and the Al 5056 + Ta dataset. This may be a material-dependent property or at least a powder-dependent property, whereby the degree of F-statistic separation for different features may change if another Ta powder was considered, for instance.
With these three datasets, there appears to be some variation in the feature ranking based upon the material type and/or qualitative particle characteristics. For example, with the Al 5056 Only dataset, morphology parameters appear to be most influential in influencing flowability, with the “Median Surface Area” and “Median ” as the highest-ranking features for that powder type. This is contrasted by the results of the Ta Only dataset, where “Moisture Content” and several size parameters, such as “” and “Volume Percent of Particles Under 10 μm in Size”, are ranked the highest. The increased weight of particle morphology in flowability determination versus particle size and moisture content may be a material-dependent phenomenon when considering the innate differences between Al 5056 and Ta. However, it is also plausible that this depends on more holistic differences in the powder characteristics, such as the semi-spherical Al 5056 with a narrower PSD, compared to the angular Ta with a broad PSD. While this reasoning is not clearly distinguishable from the results of this study, the observations from the present work may be used to guide future experimentation to achieve these answers.
Another key observation from the feature ranking results is the importance of the “” parameter in the three datasets, particularly in the Al 5056 + Ta dataset. In this combined material dataset, the “” feature was by far considered the most important parameter in predicting flowability with an F-statistic nearly ten times as large as the next highest F-statistic. This is in stark contrast to the Al 5056 Only and Ta Only datasets, where the “” parameter was considered the least influential of the six features analyzed in both datasets, with the lowest F-statistic compared to the other features. From the results presented here alone, it is not entirely evident why “” ranked so much higher in the Al 5056 + Ta dataset compared to the other two. This is likely a by-product of the significantly reduced number of features considered in the regression models after VIF analysis and feature elimination; because only three features were considered and particle morphology was neglected with these features, it is reasonable to expect that subsequent flowability predictions would be altered. While the rankings from each material-based subset varied quite substantially, the results are all logical, intuitive, and based on fundamental concepts of particle dynamics, owing to the physical interpretability and statistical significance of the regression models after adequate feature selection.
3.5. Ramifications on Additive Manufacturing
While the present characterization results of the Al 5056 and Ta powder flowability and moisture content are helpful from a strictly powder-focused perspective, it is essential to view these results in the context of other stakeholders of the powder community, such as those working with metal powder-based AM processes. It has previously been highlighted that powder properties and behavior such as moisture content and flowability, respectively, influence the success of a given powder-fed or powder-fed AM technique. However, it is essential to consider the influences of these factors as they pertain to the dynamic conditions of environmental exposure. Moreover, it is logical to emphasize the key results of this study and interpret them in a way that can be directly applicable for AM powder users during materials selection, quality control, or generalized powder processing stages.
Firstly, it is necessary to highlight the marginal changes in flowability and moisture content of the Al 5056 and Ta powders with environmental exposures through the current design of experiments—namely, the number of exposures and exposure durations considered in this work. It is reasonable to assume that using similar powder types under comparable laboratory conditions to the present study, one could expect similar properties and behavior for subsequent AM processing. Based on the magnitude of the changes in flowability and moisture content for both material types, one could posit that this would be minimally impactful in the powder processing through AM. However, if different powders were utilized or more “extreme” exposure conditions were encountered, one would potentially observe different results, which could compromise AM processability; this concept will be discussed further in Section 3.6.
Tangentially related to this are the apparent material-dependent or powder sample-dependent changes in flowability and moisture content. From the results in Section 3.1 and Section 3.2, the drastic differences in the average values for the Al 5056 and Ta powders are quite evident. Based on the characterization in this study, it is inconclusive as to whether these differences are intrinsic material qualities or rather artifacts of variations in generalized particle characteristics, such as particle size and morphology differences. However, through the correlational statistics and feature ranking implemented in Section 3.4, it is possible to distinguish the most critical powder characteristics to control. For instance, with the Al 5056 powder, particle morphology-related characteristics were of utmost importance, while with the Ta powder, moisture content and several powder-size-related characteristics were most heavily weighted in flowability determination. That said, when both materials were considered in the pooled material dataset, it was evident that the PSD′s breadth with the “” parameter was most important. In general, given the relative importance of particle size and morphology characteristics on flowability predictions for these sets of powder samples, it is necessary to implement pre-process characterization steps, such as particle size/shape analysis, so that one can understand the powder’s behavior and make informed decisions about how to optimize processing parameters to ensure successful AM processing. Finally, it is vital to keep in mind that the particle size and shape characteristics, in addition to the moisture content, may influence whether a powder sample is sensitive to changes in behavior with environmental exposure, which could detrimentally affect powder processability, further necessitating powder characterization as a means of process control.
3.6. Future Considerations
In this preliminary study, meaningful data has been generated thus far related to metallic powder flowability and moisture content that metal powder-based AM users can leverage to enhance their powder processing. However, from this study, several avenues of future exploration can be capitalized upon to help guide metallic powder handling and storage protocols.
It is critical to acknowledge that powder flowability and moisture content are incredibly nuanced properties. While this study provided a glimpse into understanding the ramifications of environmental exposure on powder properties and behavior, other factors not considered here were found to be rather impactful and should be incorporated in future work. For example, electrostatic charge buildup, usually through tribo-charging, has been shown to negatively impact a material’s flowability, mainly when the material contacted is nonconductive [28]. This would be rather pertinent to metal powder-based AM, as most processes involve the contact of a powder sample with system components as it moves throughout the processing environment, where charge buildup can occur. Moreover, studies have indicated that electrostatic charge can be interdependent with powder moisture content, introducing another factor into this complex field of study that is necessary to acknowledge [30].
In future studies, several design elements of the environmental exposure can be considered to invoke different material responses in both properties and behavior. In this study, the environmental exposure of the Al 5056 and Ta powders was completed in “standard” laboratory conditions, which involved controlled temperature and naturally varied humidity. The exposure conditions here do not necessarily represent the variety of powder handling and storage conditions experienced worldwide, where more “extreme” temperatures and humidity may be observed. Given the gravity of the effect of temperature and humidity on powder properties, such as moisture content, it would be prudent to explore how higher temperatures and humidity would influence subsequent characterization results. By the same token, the exposure duration could also play an important role, which warrants the variation of exposure time to more prolonged periods past 2 min and 10 min.
Additionally, future studies would benefit from adopting alternative methods to measure powder flowability and moisture content. In the present work, the Carney Funnel was used in place of the Hall Flowmeter Funnel to measure particle flowability; this was done to match the methods commonly utilized in the industry to capture particle flow behavior. However, it is important to consider that metal powder-based AM processes are often quite dynamic, which necessitates a dynamic powder measurement technique that can gain insights into the in-process behavior of a powder sample. A promising approach to simulate powder flowability in an AM process is through powder rheology, which mimics AM processing conditions so that AM powder users can understand how the powder will act during processing [31]. TGA was utilized in this study to provide loss-on-drying measurements as a method of moisture determination. While TGA systems can produce extremely sensitive gravimetric measurements, the small quantity of each powder sample analyzed brings into question the representative nature of each powder tested, even if the powder is adequately sampled. Other test methods enable the measurement of larger quantities of powder yet still maintain sensitivity and precision, providing consistently repeatable results for quality moisture determination. One method that has proven relatively successful for moisture analysis of metallic powders is coulometric Karl Fischer titration coupled with oven desorption [12]. It is worth noting that if these measurement methods were to change, it is inevitable that slight variations in the trends of flowability and moisture content with environmental exposure would be observed due to the innate differences between measurement methods. This could have significant ramifications on the results of future studies from a statistical analysis perspective, for instance, whereby the results of feature selection and feature ranking could be dramatically different from those demonstrated in the present work.
Finally, to increase the applicability of a future study to metal powder-based AM processing, it is important to consider several factors directly related to material processing. For example, the composition of the metallic powder can be monitored after exposure to ambient conditions. Given the elemental makeup of water, changes in oxygen and hydrogen may be observed during exposure, as well as the formation of hydroxides and other compounds on the surface of the powder [14]. If any substantial composition changes occur, the material’s processability may be in question, given the association of mechanical, thermal, or electrical properties with composition. Another natural avenue to relate a future study to metal powder-based AM is to utilize the exposed powders in an AM process, which would enable the direct determination of the effect of environmental exposure on powder processability, given the changes in powder properties and behavior.
4. Conclusions
This study aimed to investigate the impact of repeated exposure to ambient conditions of Al 5056 and Ta powders on flowability and moisture content over a three-month study. Preliminary testing results demonstrated a marginal change in powder properties and behavior from the specified number of weekly exposures at the given exposure durations. Deviations from the expected trends in flowability and moisture content values for the Al 5056 and Ta powders were observed. These inconsistent and unexpected values can likely be attributed to specific elements of the experimental design and materials selected, such as the laboratory conditions during exposure and the particle size and morphology characteristics of each powder evaluated. The magnitude of the powder flowability and moisture content values also appeared to have a slight material dependence, indicating that powder handling and storage protocols for metal powder-based AM processing may have to be considered with specific materials in mind.
The outcomes of this study can be considered tools to guide AM powder users towards practicing proper powder handling and storage and executing proper characterization to achieve optimal processing success. It is recommended that quality control measures—such as the statistical methods employed here through VIF analysis, OLS regression, and feature ranking—be implemented with powder characterization. Doing so will allow AM powder users to make robust, unbiased conclusions about selecting and pre-processing powders based upon relevant powder properties and behavior for a given processing environment. While the results presented herein indicated a positive outcome for powder handling and storage—as little degradation of powder properties and behavior with repeated environmental exposure was observed—caution should be taken when applying these results in the context of environments outside the framework established by these experimental conditions. To expand upon the work presented in this study and satisfy the needs of the metal powder-based AM industry, future experiments worth pursuing may include the evaluation of more “extreme” exposure conditions on powder properties and behavior; the utilization of alternative measurement methods for flowability and moisture content characterization; and the testing of powder processability with metal powder-based AM techniques.
Supplementary Materials
The following supporting information can be downloaded at: https://www.mdpi.com/article/10.3390/met12040603/s1, Spreadsheet S1: Compiled Data for Statistical Analysis.
Author Contributions
Conceptualization, J.G. and D.C.; methodology, J.G. and B.C.S.; software, B.C.S.; validation, J.G. and B.C.S.; formal analysis, B.C.S.; investigation, J.G.; resources, D.C.; data curation, J.G. and B.C.S.; writing—original draft preparation, J.G. and B.C.S.; writing—review and editing, J.G., B.C.S. and D.C.; visualization, J.G.; supervision, D.C.; project administration, J.G.; funding acquisition, D.C. All authors have read and agreed to the published version of the manuscript.
Funding
This work was funded by the United States Army Research Laboratory, grant #W911NF-19-2-0108.
Data Availability Statement
The data presented in this study are available in “Compiled Data for Statistical Analysis”.
Acknowledgments
The authors would like to express their gratitude to the staff of Solvus Global for their hard work in assisting with the pre-processing, packaging, and initial testing of the Al 5056 and Ta powders. Additionally, the authors would like to thank WPI student Ashley Schuliger for assisting in developing the framework of statistical analysis employed in this study. Finally, the authors would like to thank Aaron Birt of Solvus Global and Aaron Nardi of VRC Metal Systems, LLC. for their intellectual contributions towards pinpointing the necessity for this type of study in the context of metal powder and additive manufacturing.
Conflicts of Interest
The authors declare no conflict of interest. The funders had no role in the design of the study; in the collection, analyses, or interpretation of data; in the writing of the manuscript, or in the decision to publish the results.
References
- Wong, K.V.; Hernandez, A. A Review of Additive Manufacturing. ISRN Mech. Eng. 2012, 2012, 208760. [Google Scholar] [CrossRef] [Green Version]
- Bikas, H.; Stavropoulos, P.; Chryssolouris, G. Additive manufacturing methods and modelling approaches: A critical review. Int. J. Adv. Manuf. Technol. 2016, 83, 389–405. [Google Scholar] [CrossRef] [Green Version]
- Horn, T.J.; Harrysson, O.L.A. Overview of Current Additive Manufacturing Technologies and Selected Applications. Sci. Prog. 2012, 95, 255–282. [Google Scholar] [CrossRef] [PubMed]
- Frazier, W.E. Metal additive manufacturing: A review. J. Mater. Eng. Perform. 2014, 23, 1917–1928. [Google Scholar] [CrossRef]
- Yakout, M.; Elbestawi, M.A.; Veldhuis, S.C. A Review of Metal Additive Manufacturing Technologies. Solid State Phenom. 2018, 278, 1–14. [Google Scholar] [CrossRef]
- Baitimerov, R.; Lykov, P.; Zherebtsov, D.; Radionova, L.; Shultc, A.; Prashanth, K.G. Influence of Powder Characteristics on Processability of AlSi12 Alloy Fabricated by Selective Laser Melting. Materials 2018, 11, 742. [Google Scholar] [CrossRef] [PubMed] [Green Version]
- Liu, B.; Wildman, R.; Tuck, C.; Ashcroft, I.; Richard, H. Investigation the effect of particle size distribution on processing parameters optimization in Selective Laser Melting process. In Proceedings of the 2011 International Solid Freeform Fabrication Symposium, Austin, TX, USA, 8–10 August 2011; University of Texas at Austin: Austin, TX, USA, 2011; pp. 227–238. [Google Scholar]
- Muñiz-Lerma, J.A.; Nommeots-Nomm, A.; Waters, K.E.; Brochu, M. A Comprehensive Approach to Powder Feedstock Characterization for Powder Bed Fusion Additive Manufacturing: A Case Study on AlSi7Mg. Materials 2018, 11, 2386. [Google Scholar] [CrossRef] [PubMed] [Green Version]
- Tang, H.P.; Qian, M.; Liu, N.; Zhang, X.Z.; Yang, G.Y.; Wang, J. Effect of Powder Reuse Times on Additive Manufacturing of Ti-6Al-4V by Selective Electron Beam Melting. JOM 2015, 67, 555–563. [Google Scholar] [CrossRef]
- Lefebvre, L.P.; Dai, J.; Thomas, Y.; Martinez-Rubi, Y. Metal powder flowability: Effect of humidity and impact on reproducibility of the measurements. In Proceedings of the Additive Manufacturing with Powder Metallurgy Conference 2019, Phoenix, AZ, USA, 23–26 June 2019. [Google Scholar]
- Cordova, L.; Bor, T.; de Smit, M.; Campos, M.; Tinga, T. Measuring the spreadability of pre-treated and moisturized powders for laser powder bed fusion. Addit. Manuf. 2020, 32, 101082. [Google Scholar] [CrossRef]
- Mellin, P.; Zavalis, T.; Tingö, L.; Brodin, H.; Wendel, J.; Berg, S.; Riabov, D.; Strondl, A.; Nyborg, L. Moisture content analysis of metal powders using oven desorption followed by Karl Fischer titration. Met. Powder Rep. 2020, 75, 34–39. [Google Scholar] [CrossRef]
- Mitterlehner, M.; Danninger, H.; Gierl-Mayer, C.; Gschiel, H. Investigation of the Influence of Powder Moisture on the Spreadability Using the Spreading Tester. BHM Berg-und Hüttenmännische Mon. 2021, 166, 14–22. [Google Scholar] [CrossRef]
- Lienhard, J.; Crook, C.; Azar, M.Z.; Hassani, M.; Mumm, D.R.; Veysset, D.; Apelian, D.; Nelson, K.A.; Champagne, V.; Nardi, A.; et al. Surface oxide and hydroxide effects on aluminum microparticle impact bonding. Acta Mater. 2020, 197, 28–39. [Google Scholar] [CrossRef]
- Touzé, S.; Rauch, M.; Hascoët, J.-Y. Flowability characterization and enhancement of aluminium powders for additive manufacturing. Addit. Manuf. 2020, 36, 101462. [Google Scholar] [CrossRef]
- ASTM B964-16; Standard Test Methods for Flow Rate of Metal Powders Using the Carney Funnel. ASTM International: West Conshohocken, PA, USA, 2016; pp. 1–3.
- ASTM B213-20; Standard Test Methods for Flow Rate of Metal Powders Using the Hall Flowmeter Funnel. ASTM International: West Conshohocken, PA, USA, 2020; pp. 1–4.
- Grubbs, J.; Tsaknopoulos, K.; Massar, C.; Young, B.; O’Connell, A.; Walde, C.; Birt, A.; Siopis, M.; Cote, D. Comparison of laser diffraction and image analysis techniques for particle size-shape characterization in additive manufacturing applications. Powder Technol. 2021, 391, 20–33. [Google Scholar] [CrossRef]
- Myers, R.H. Classical and Modern Regression with Applications, 2nd ed.; Duxbury Press: London, UK, 2000; ISBN 978-0534380168. [Google Scholar]
- Pedregosa, F.; Varoquaux, G.; Gramfort, A.; Michel, V.; Thirion, B.; Grisel, O.; Mathiew, B.; Prettenhofer, P.; Weiss, R.; Dubourg, V.; et al. Scikit-learn: Machine Learning in Python. J. Mach. Learn. Res. 2011, 12, 2825–2830. [Google Scholar]
- Kuhn, M.; Johnson, K. Applied Predictive Modeling; Springer: New York, NY, USA, 2013; ISBN 978-1-4614-6848-6. [Google Scholar]
- Marchetti, L.; Mellin, P.; Neil Hulme, C. Negative impact of humidity on the flowability of steel powders. Part. Sci. Technol. 2021, 1–15. [Google Scholar] [CrossRef]
- Spierings, A.B.; Voegtlin, M.; Bauer, T.; Wegener, K. Powder flowability characterisation methodology for powder-bed-based metal additive manufacturing. Prog. Addit. Manuf. 2016, 1, 9–20. [Google Scholar] [CrossRef] [Green Version]
- Jacob, G.; Brown, C.U.; Donmez, M.A.; Watson, S.S.; Slotwinski, J. Effects of Powder Recycling on Stainless Steel Powder and Built Material Properties in Metal Powder Bed Fusion Processes; US Department of Commerce, National Institute of Standards and Technology: Gaithersburg, MD, USA, 2017. [CrossRef]
- Mujumdar, A.; Wei, D.; Dave, R.N.; Pfeffer, R.; Wu, C.-Y. Improvement of humidity resistance of magnesium powder using dry particle coating. Powder Technol. 2004, 140, 86–97. [Google Scholar] [CrossRef]
- Pauzon, C.; Raza, A.; Hryha, E.; Forêt, P. Oxygen balance during laser powder bed fusion of Alloy 718. Mater. Des. 2021, 201, 109511. [Google Scholar] [CrossRef]
- Hryha, E.; Shvab, R.; Gruber, H.; Leicht, A.; Nyborg, L.N. Surface Oxide State on Metal Powder and its Changes during Additive Manufacturing: An Overview. La Metall. Ital. 2018, 3, 34–39. [Google Scholar]
- Ma, Y.; Evans, T.M.; Philips, N.; Cunningham, N. Numerical simulation of the effect of fine fraction on the flowability of powders in additive manufacturing. Powder Technol. 2020, 360, 608–621. [Google Scholar] [CrossRef]
- Habibnejad-korayem, M.; Zhang, J.; Zou, Y. Effect of particle size distribution on the flowability of plasma atomized Ti-6Al-4V powders. Powder Technol. 2021, 392, 536–543. [Google Scholar] [CrossRef]
- Berretta, S.; Ghita, O.; Evans, K.E.; Anderson, A.; Newman, C. Size, shape and flow of powders for use in Selective Laser Sintering (SLS). In High Value Manufacturing: Advanced Research in Virtual and Rapid Prototyping; Taylor & Francis: London, UK, 2013; pp. 1–6. [Google Scholar]
- Clayton, J.; Millington-Smith, D.; Armstrong, B. The application of powder rheology in additive manufacturing. JOM 2015, 67, 544–548. [Google Scholar] [CrossRef]
Publisher’s Note: MDPI stays neutral with regard to jurisdictional claims in published maps and institutional affiliations. |
© 2022 by the authors. Licensee MDPI, Basel, Switzerland. This article is an open access article distributed under the terms and conditions of the Creative Commons Attribution (CC BY) license (https://creativecommons.org/licenses/by/4.0/).