Article

Initiation Behavior of Microscopic Short Cracks in Weld Toe of Structural Steel Q345B

Key Laboratory of Metallurgical Equipment and Control Technology, Wuhan University of Science and Technology, Ministry of Education, Wuhan 430081, China
*
Author to whom correspondence should be addressed.
Metals 2022, 12(4), 618; https://doi.org/10.3390/met12040618
Submission received: 23 February 2022 / Revised: 29 March 2022 / Accepted: 30 March 2022 / Published: 3 April 2022

Abstract

:
Aiming at the base metal (BM) zone, heat affected zone (HAZ) and fusion zone (FZ) of the weld, the tip plastic zone and initiation behavior of microscopic short cracks (MSCs) in the toe of cross-welded joints are studied. Based on the theory of crack tip plastic zone and the fatigue index parameter (FIP), the shape and boundary size of the plastic zone at the tip of MSCs as well as the initiation life were calculated. The results show that the plastic zone was bone-like under plane stress and butterfly-like under plane stress; when the crack length increased from 2 μm to 30 μm, the boundary size of the plastic zone at the MSC tip increased by 15 μm and 2 μm under the action of plane stress and plane strain in the X-axis direction, respectively. As the grain gradient decreased from 0.5 to 0.1, the boundary size of the plastic zone at the tip of the MSC increased about 50%. MSC initiation occurs first in the BM zone, and life of initiation was about several hundred thousand cycles, which was consistent with the experimental result. The MSC expansion rate in BM zone was the fastest, with the average expansion rate about 2.5 × 10⁻³ μm/cycle; the MSC expansion rate in the FZ and HAZ was about 3.1 × 10⁻⁴ μm/cycle.

1. Introduction

Welding is one of the most commonly used methods for manufacturing connected parts. It has the advantages of simple structure, low cost, easy process, superior performance and high cost performance. Welded structures are widely used in various industries, including energy industries such as manufacturing, transportation, and oil and gas. Once cracks occur, they often cannot be discovered in time, which may cause serious harm. Under the action of cyclic loading, fatigue cracks often appear in the local position of the weld, especially the toe position of the weld [1,2,3]. Therefore, it is of great significance to understand the shape and size of the crack tip plastic zone and fatigue initiation behavior of the weld toe, and provide guidance and suggestions for the accurate prediction of the life of the welded structure and the improvement of the welding process.
Fatigue crack propagation is strongly related to the plastic zone at the crack tip. Many scholars have studied the characteristics of the plastic zone at the crack tip and found that these characteristics play an important role in fatigue crack growth. The nonlinear effects of the crack tip, due to the elastoplastic behavior of the material, affect the crack growth rate and path [4,5,6]. Torabi [7] revealed that the complex and time-consuming elastoplastic solution can be replaced by an analytical method based on the linear elastic solution, which can quickly and easily determine the effective plastic zone size near the blunt notch. Zhang [8] proposed an analytical method for solving the stress intensity factor of the plastic zone, and then applied it to obtain the stress intensity factor and plastic zone size for stiffened plates with two and three collinear cracks; the determined stress intensity factor and plastic zone size were compared with values from finite element analysis and the existing literature, but lacked confidence. Fatigue assessment is one of the important factors in assessing structural design life and structural reliability during operation. Especially for welded structures, high stress concentrations, residual stresses, weld geometry and weld quality make the structure more prone to fatigue failure. Therefore, more efficient methods are needed to estimate the fatigue performance of welded structures [9,10,11]. Liu [12], through extensive uniaxial and multiaxial fatigue tests, studied the effects of stress amplitude ratio and phase angle on crack growth and fatigue life of 30CrMnSiA steel. The effect of residual stress on the fatigue-initiated life curve of steel was studied by a microstructure-based fatigue crack initiation modeling method [13]. By using 3D fatigue finite element analysis, two load types were analyzed for cruciform fillet welds, with complete and incomplete penetration, bearer and non-bearer [
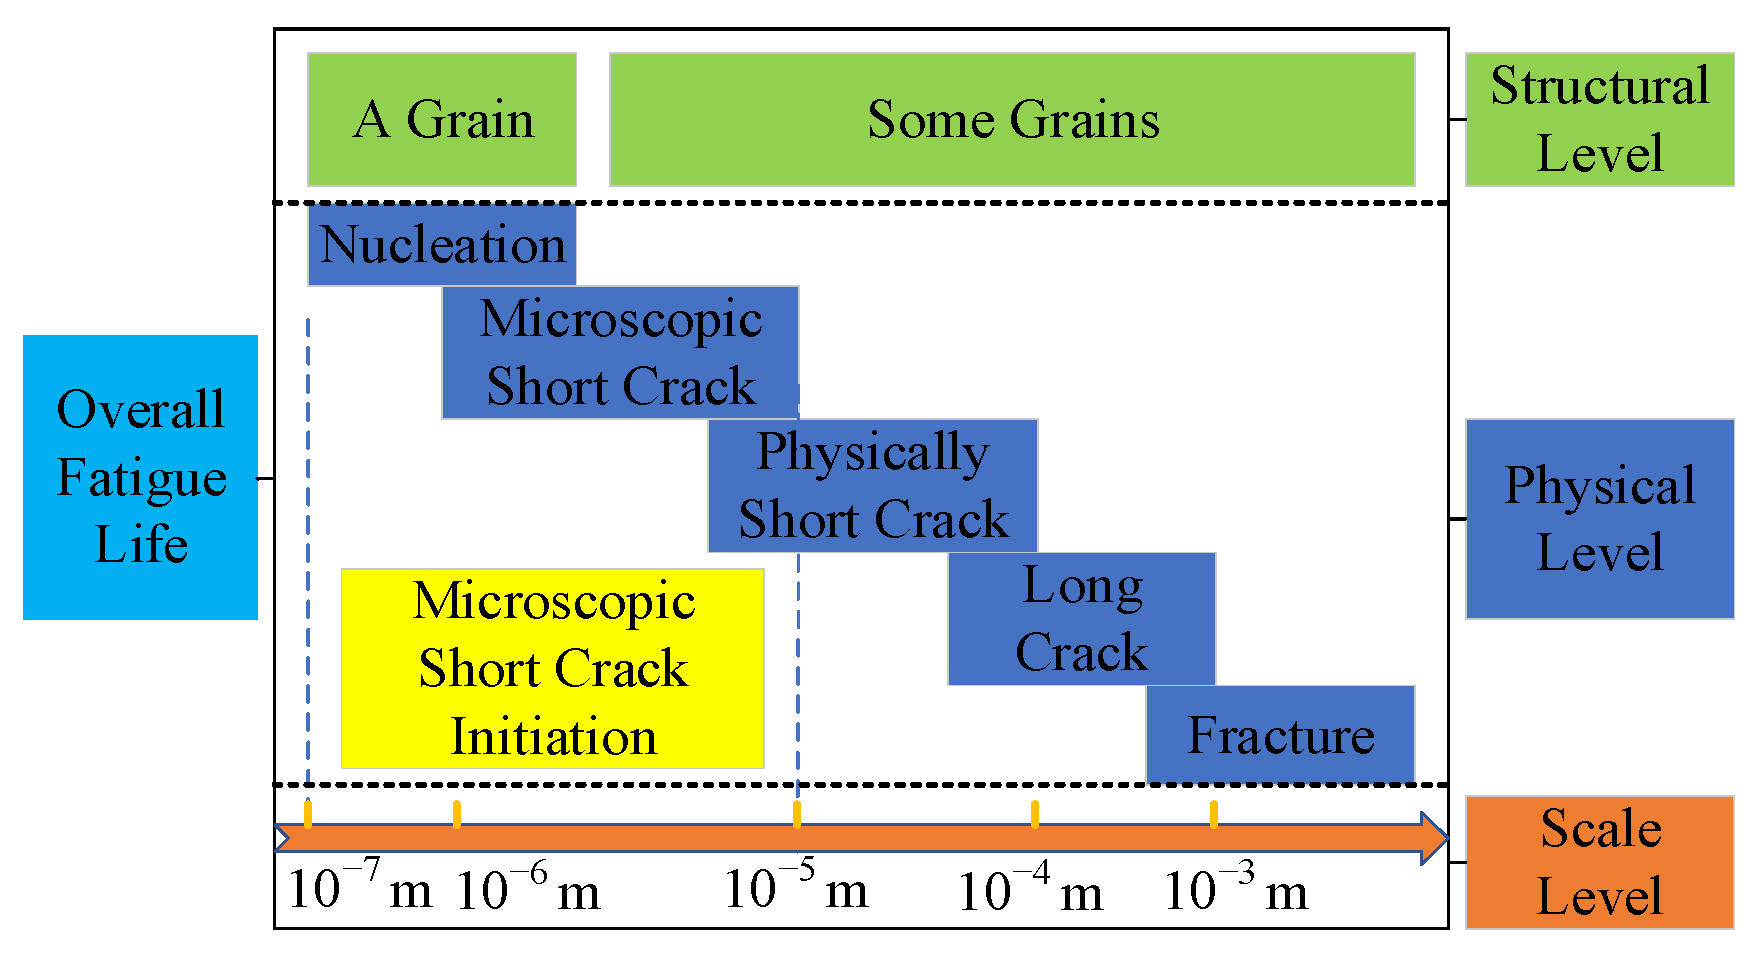
14]. The direct use of fracture mechanics to predict the remaining life of the welded structure is too conservative. It only considers the long crack stage and ignores the short crack stage, which accounts for a relatively large lifetime; the initiation life of microscopic short crack (MSC), which accounts for a relatively large lifetime among short cracks, cannot be ignored [15,16]. Therefore, it is of great significance to study the plastic band and the initiation life of the weld toe MSC tip and its prediction method.
At present, there have been some short crack propagation models, such as the Huffman [17] and Bang [18,19] models. These models cannot consider the microstructure of the material, and there is no partition modeling for the weld toe area; the simulation model is single. Liu [20], through improvements to the Tanaka-Mura model, established a short crack initiation model with different slip irreversibility and slip hardening, but the effect of stress peaks on cracks was ignored. Some scholars established a crystal plasticity model of short crack expansion and determined that plasticity is the driving force for crack expansion [21,22]. Wei [23] conducted simulation and experimental research on the propagation behavior of multiple cracks and found that the crack propagation has a fusion phenomenon. Toribio [24] found that the fatigue crack paths are global uniaxial in both oriented and non-oriented pearlite structures. Based on the plastic irreversible fatigue mechanism of the slip band, a simulation method of MSC was proposed, and the law of crack nucleation and early expansion of MSC was obtained, but this included no subregional modeling [25,26,27]. For different welding processes, the micro-grain gradient has a great influence on the expansion behavior of MSC [28,29]. Fabien [30] proposed a critical plane fatigue index parameter (FIP) based on the Tanaka-Mura model to evaluate the location of crack formation and quantify the driving force. Ferreira [31,32,33] believes that damage caused by cyclic strain accumulates at the crack tip, and it does not require the use of effective stress intensity factor assumptions. Ashton [34] proposed a three-dimensional strain gradient crystal plasticity model to study the microstructure-sensitive grain size effect in crack initiation under fatigue conditions; however, the amount of calculation is very large, and the effect is not very different from the two-dimensional model; thus, this paper will use the two-dimensional model. Mao [35] proposed a multi-scale modeling method based on atom theory to quantify the expansion of transgranular short cracks in the fatigue process of polycrystalline metals. Sun [36] obtained the stress–strain response of grains through the theory of crystal plasticity and found that stress and strain concentration tended to occur at grain boundaries. Takahashi [37] studied the microscopic mechanism of fatigue crack expansion and observed the crack tip of the cross section through various electron microscopes, Unfortunately, the number of samples was too small to be convincing, and there was a lack of data. Yuan [38] used the finite element model to estimate the microscopic short fatigue crack expansion of bridge steel welds, to quantify the fatigue index parameters (FIP) at the level of the slip system, to correlate FIP with the fatigue life of a single grain, and to give each grain the direction of the anisotropic slip band, including the position of the persistent slip band; this method has a great advantage in describing the initiation of MSCs.
For the calculation of the plastic zone, a two-dimensional model can be used, which is conducive to the balance of calculation costs and results. There are many calculation models for crack expansion life, and a single stress or strain model may cause large errors in fatigue life prediction. Many scholars use a unit-by-unit cracking method to simulate MSC behavior, but the amount of calculation is often very large; there are dozens of units in a slip band, and each unit needs to be calculated once for each step of expansion. Some scholars have only established one model when studying the MSC at the weld toe; by default, the grain microstructure of the weld toe area is the same, and there is no butt weld toe sub-region modeling. This simplification reduces the accuracy of fatigue life prediction.
Based on the crack tip plastic zone theory, this paper calculates the shape and boundary size of the MSC tip plastic zone under different crack lengths and analyzes the corresponding laws of the MSC tip plastic zone. The microstructure of the grains in different areas of the weld toe is quite different, which may have a greater impact on the initiation behavior of MSC; if one model is used for simulation, it will be quite different from the real weld toe. In order to make the simulation model closer to the actual situation of the weld toe area, we divided the weld toe area into base metal (BM), heat affected zone (HAZ) and fusion zone (FZ), which are different areas of the weld toe. We modeled and simulated different areas of the weld toe separately, establish multiple models for each area, and perform statistical processing on the data to make the results more accurate. Using the grain-by-grain expansion method, each slip band was used as a unit, and each slip band was calculated once, which improved the efficiency of finite element simulation. Based on the finite element technology and FIP theory, the Voronoi polygon method was used to construct the microstructure of the weld toe, the two-dimensional representative volume element (RVE) model was used to calculate the MSC initiation life, and the evolution behavior of the MSC in different areas of the weld toe was simulated and analyzed.

2. Theory Background

2.1. Evolution Process of Weld Toe Cracks

Under normal circumstances, the overall fatigue life of welded joints can be divided into four stages: nucleation (Nuc) regime, microscopic short crack (MSC) regime, physically short crack (PSC) regime and long crack (LC) regime, as shown in Figure 1 [39].
The overall fatigue life is shown in Equation (1) [40]:
N f = N nuc + N msc + N psc + N lc
where N f is the overall fatigue life, N nuc is the crack nucleation life, N msc is the microscopic short crack life, N psc is the physically short crack life and N lc is the long crack life. In practical applications, the Paris formula is often used to describe the relationship between the crack expansion rate and the crack depth at the LC stage, and N lc is calculated. This method ignores N nuc , N msc and N psc , which leads to an overly conservative life prediction. For high-quality welded structures and high-strength materials, experiments show that the fatigue life of the crack Nuc, MSC and PSC regimes accounts for about 90% of the total fatigue life [41]. Therefore, studying N nuc , N msc and N psc plays an important role in predicting fatigue life more accurately. However, the crack behavior in these three regimes is very complicated, and there is no accepted description method at present. Therefore, from a microscopic point of view, this paper combines the crack nucleation regime and the early MSC expansion regime as MSC initiation, and defines the number of cycles required when the MSC expansion depth reaches 150 μm as the MSC initiation life. Among them, the definition of crack nucleation is the number of cycles experienced by the cracks in the first grain to fully develop and crack completely. On the basis of short cracks, the micro-scale of the MSC initiation regime is mainly considered to study the mechanism of crack nucleation during MSC initiation and early expansion of MSCs.

2.2. Different Areas of Weld Toe

In the welding process, due to the influence of welding process and temperature, the welding seam forms different areas. These regions have great differences in the grain microstructure and material properties, and it is necessary to establish different models of the weld toe region to study separately. The area at a certain distance from the weld toe is the BM zone, where the average grain size is small, mainly irregular ferrite and cementite, and the hardness is large; the content of ferrite is larger than that of cementite, and the shapes are irregular polygons. The area near the weld toe is the FZ, where the grain shape is columnar and the average grain size is larger. The area between the BM zone and the FZ is the HAZ; the grain shape is similar to the BM zone, except that the average grain size is larger. This zone mainly contains ferrite and has a greater hardness than the BM zone [42]. Therefore, the weld toe area was modeled by partition, and different models were simulated separately to ensure that the simulation model is closer to the actual weld toe area and that the simulation accuracy is improved.

2.3. FIP Theory

Generally, fatigue cracks are caused by the accumulation of irreversible damage along the crystal plane on the slip band. Yuan [38] believed that plastic shear strain and peak stress have an important control effect on the initiation of MSC and proposed a new fatigue index parameter, as shown in Equation (2):
F I P ( α ) = Δ γ p ( α ) 2 [ 1 + k σ n ( α ) σ r ]
where F I P ( α ) is the FIP of α slip system, Δ γ p ( α ) is the cyclic plastic shear strain range, σ n ( α ) is the peak stress, σ r is the reference strength, and k is a constant, usually between 0 and 2; for steel weld toe k = 1. Research shows that this F I P ( α ) can effectively replace the traditional crack tip opening displacement range [38].
In the actual MSC early extended simulation research, the FIP calculation method based on the average slip band can be used, that is, F I P ave ( α ) ; the average FIP representing the slip band in the α slip system is used as the control parameter of fatigue behavior. This method, based on average FIP, significantly reduces the amount of simulation calculations [43], as shown in Equation (3):
F I P ave ( α ) = F I P 0 ( α ) [ 1 R G B ( a D st ) m ]
where F I P 0 ( α ) is initial FIP, F I P ave ( α ) is the average FIP of the slip band before crack propagation occurs, and R G B is the resistance of the MSC across the grain boundaries. Considering that the MSC is transgranular and driven by the cyclic plasticity of most grains, R G B is the determining parameter for MSC expansion. This parameter depends on complex grain boundary conditions, such as twist tilt angle, grain morphology, and other material properties. The grain microstructures of the three regions of the weld toe are all BCC structures, and their mechanical behavior is essentially the same. After comprehensive consideration, this paper adopts the average grain boundary resistance: R G B = 0.5 [44]. m is a material parameter related to crack depth; this article mainly studies the initiation behavior of the MSC, and m can be set to 0.
The initiation life of the MSC can be obtained separately; first, based on the above F I P ave ( α ) , N nuc can be calculated, as shown in Equation (4) [45]:
N nuc = α g d gr ( F I P ave ( α ) ) 2
where α g is the irreversibility coefficient, which is 47.1 cycle·µm [38]. d gr is the characteristic length of the microstructure, and for the two-dimensional slip band structure, it can generally be calculated according to Equation (5) [46]:
d gr = D st + ω D nd
where D st is the length of the slip band in the current grain, D nd is the overlap length of the cross slip band in adjacent grains, and ω is the non-orientation factor. In the case of random grain orientation, the slip band orientation between most adjacent grains exceeds 20 , and the non-orientation factor ω is approximately 0; at this time, Equation (5) can be simplified to Equation (6) [47]:
d gr = D st
After the cracks nucleate, the MSC will continue to expand in the adjacent grains, and the early expansion life of the MSC can be calculated at this time. F I P ave ( α ) can still be applied as the main control index for the expansion of MSC, based on the theory of fracture mechanics, the expansion life of MSC completely cracked in a grain can be obtained, as shown in Equation (7) [38]:
N msc = D st ϕ [ A d gr d gr ref F I P ave ( α ) Δ C T O D th ] 1
where ϕ is a measure of the mechanical irreversibility at the crack tip process zone, generally taken as 0.063, ΔCTODth is the minimum crack tip opening displacement range required to identify the occurrence of dislocations, generally taken as 4 × 10⁻⁴ µm [38], A is the proportional constant, which is related to F I P ave ( α ) , and crack tip opening displacement range, d gr ref is the reference distance. Thus, the average grain size can be taken. Therefore, the two-regime lifespan of Equations (4) and (7) composes the initiation life of the MSC.

3. Plastic Zone and Life

3.1. Materials and Experimental Procedure

The test material used in this paper was a Q345B cross-welded joint (Wuhan Iron and Steel (Group) Company, Wuhan, China). Two plates were formed by fillet welding by metal active gas welding, the shielding gas was carbon dioxide, and the welding wire ER50-6 was used for welding, with a diameter of 1.2 mm, a welding current of 220 A, a voltage of 38 V, a speed of 33 cm/min, and gas flow rate of 25 L/min. The welding seam was a transverse bearing weld, the base plate was made of steel plate with a size of 80 mm × 50 mm × 16 mm, the yield strength of the plate was 345 MPa, and the size of the connecting sheet was 180 mm × 50 mm × 8 mm. If the size of the welding leg is too large, it will increase the welding deformation and increase the residual stress; if the size of the welding leg is too small, it is easy to cause incomplete penetration, resulting in insufficient actual bearing capacity. According to the construction requirements of the fillet weld, the size of the fillet was 1.5 t 2 h f 1.2 t 1 , where t 1 was the thickness of the thinner weldment and t 2 was the thickness of the thicker weldment. In this paper, the size of the fillet h f was set to 8 mm.
The chemical composition and basic mechanical properties of specimen BM are shown in Table 1 and Table 2 [23]. The chemical composition of the welding wire is shown in Table 3, and mechanical properties of the deposited metal produced by this material are shown in Table 4 [48].
In order to obtain a clear metallographic picture of the sample, it is necessary to polish the test surface with metallographic sandpaper. There are many kinds of metallographic sandpapers; 80-mesh to 2000-mesh sandpaper was used. The 80-mesh sandpaper was usually used for rough grinding, and then a finer grade of sandpaper was selected to continue grinding until the surface of the test piece was finely ground with 2000-mesh sandpaper. Then, the surface of the sample was polished with a polishing paste with a water-based 0.25. The metallographic etching solution was 4% nitric acid alcohol (20 mL concentrated nitric acid, 500 mL anhydrous alcohol), and the surface of the sample was dripped with a pipette, allowed to sit until the surface turned black, immediately rinsed with water, then dripped with alcohol and dried with a fan until the surface of the test piece was corroded.
Figure 2 shows the weld toe section of welding toe treated by grinding. Observation of the weld toe part through an electron microscope can simplify the process, by dividing the weld toe part into three main areas and intercepting the small area in the middle of the weld as the RVE, as shown in Figure 2. In order to establish the microstructure in the RVE model of the three regions of the weld toe, metallographic experiments on the weld toe material were carried out, and the average size and distribution of the micro grain structure at this position were obtained, as shown in Figure 3 (typical metallographic structure picture).
It can be seen from Figure 3 that the microstructure of the grains in the BM zone and the HAZ are similar, and most of the grains present irregular polygonal shapes with randomness. The crystal grains in the FZ are columnar, which is quite different from the crystal grains in the BM zone and the HAZ. The graphical method was used in this paper [49], and the sum of the areas of all grains in the figure was the area of this region. For columnar grains, the average value of the short sides of the grains was used as the grain size. Based on the graphical method, the average grain size of the BM zone was 21.87 µm, the average grain size of the HAZ was 69.21 µm, and the average grain size of the FZ was 61.24 µm. It was found that the average grain size of the HAZ and FZ was about three times that of the BM zone, which provides a guide for the selection of the RVE side length of each region.

3.2. Calculation of MSC Tip Plastic Zone

Based on the metallographic inspection data, a two-dimensional RVE model was established for the local BM zone of the weld toe. Considering the simplicity of Voronoi polygon modeling, the average grain size was set to 20 µm (similar to the data measured by the metallographic experiment), and the side length was set to 150 µm. This model with multiple grains is a two-dimensional RVE model for studying the plastic zone at the crack tip. Different from the study of the local MSC nucleation and early expansion of the weld toe, there is no slip band in the two-dimensional RVE model; this simplification facilitates the meshing of the finite element model described later. It should be noted that the two-dimensional RVE model of the MSC tip plastic zone studied in this paper is only based on the local BM zone of the weld toe; if the two-dimensional RVE model of other zones is to be established, its special microstructure characteristics need to be considered.
In order to calculate the shape and boundary size of the plastic zone at the crack tip in the RVE model, a crack needs to be preset in the model. Neper software was used to build the grain model, which is a free software under the Linux system. The grain model is shown in Figure 4c. There are many ways to pre-crack; however, no matter which way is used, the shape of the crack tip directly affects the shape and size of the plastic zone. In order to obtain more accurate MSC tip plastic zone simulation results, a simulation comparison study was carried out for different crack tip shapes.
Due to different external loads, the friction at the crack tip generally produces a sharper and rounder crack tip; thus, this paper uses a triangle and a semicircle to represent this. This article mainly considers two types of crack tip shapes, as follows:
(1) Triangular shape. The characteristic of this kind of crack is that the crack tip is sharp, and the crack is generally rectangular, with a length of a and a width of 0.2 μm, which is the fixed crack width. The crack tip is an isosceles triangle with a base of 0.2 µm and a height of 0.1 µm, as shown in Figure 4a.
(2) Semicircular shape. The crack tip of this kind of crack is a semicircle with a radius of 0.1 μm, and the other geometric parameters are the same as those of the triangle crack tip, as shown in Figure 4b. Compared with the triangular crack tip, the semicircular crack tip weakens the sharpness of the crack tip.
Due to the irregularity of the crack tip shape, it is generally necessary to perform geometric segmentation in order to obtain a higher quality mesh in the subsequent meshing. At the same time, geometric segmentation is also used to facilitate the subsequent measurement of the boundary size of the plastic zone. Considering that the boundary size of the plastic zone at the crack tip is related to the angle θ, the angle is also divided here; the angle step is 30°, and the tangent length is equal to the crack length a. In order to obtain accurate calculation results and plastic zone measurement results, the local mesh of the crack tip is refined. The data collection method is to take a data point every 30°, and then connect all the data points with a curve to obtain the approximate shape of the plastic zone at the crack tip, which simplifies the data extraction process. If the boundary size of the plastic zone at the crack tip is measured at each direction angle, more time and cost will be required. The calculation results show that the shape of the plastic zone obtained by the above simplified method is not much different from the unsimplified treatment; thus, the simplified methods specified above are used in the modeling, and the triangle crack tip treatment method is similar.
The load application usually has a force method and a displacement method; the general force load mainly includes concentrated force and pressure. Cracks generally occur at the stress concentration position; assuming that the crack is in the middle of the weld toe, the BM zone in the middle of the weld is selected as the two-dimensional RVE model. Tensile stress was applied to its upper and lower boundaries, ignoring the load on the right boundary, and the shear stress of each boundary was small and not considered. The pressure type was adopted, the stress range was 200 MPa, and the stress ratio was 0. Figure 5 is a schematic diagram of load application.
For the calculation of the boundary size of the MSC tip plastic zone, the model grid has special requirements. The plastic zone calculation model is different from the FIP model, and its notable feature is that there is no slip band in the RVE model. From a certain point of view, this model is more convenient for meshing the finite element model. When calculating the plane stress plastic zone, we used the CPS4 grid element. CPS4 is a four-node bilinear plane stress quadrilateral; this element type is commonly used in 2D plane stress studies. When calculating the plane strain plastic zone, we used the CPE4 grid element. In order to make the contour of the boundary line of the plastic zone smoother and the r p measurement more accurate, the local mesh of the crack tip was refined according to the method described above. The global grid size was set to 0.5 µm, and the grid size of the refined area was set to 0.05 µm. The range of mesh refinement was a circular area with the crack tip point as the center and the crack length a as the radius. This can also be adjusted according to the actual situation to ensure that the calculated plastic zone boundary line is within the refined mesh area.
The simulation calculation of the MSC tip plastic zone can be divided into two steps. First, when the crack length a = 2 µm, the rationality of the simulation method was verified through the theoretical calculation of the Irwin model and the simulation calculation of the two-dimensional RVE model, which includes the verification of different crack tip shapes and the boundary size R of the plastic zone; the simulation calculation includes a triangular crack tip model and a semicircular crack tip model. The shape and boundary size of the plastic zone at the crack tip in the calculation results were compared to determine a suitable two-dimensional RVE model with cracks. Then, we changed the crack length a under the conditions of plane stress and plane strain. A total of 15 two-dimensional RVE models were established to calculate the boundary size of the plastic zone.

3.3. MSC Initiation Life Calculation

Numerous studies have shown that the fatigue cracks of cross-welded joints mainly initiate in the weld toe; therefore, the small cells in the local area of the weld toe can be extracted as the research object of MSC simulation. To simplify processing, a two-dimensional RVE form was adopted. As shown in Figure 2, one can clearly see the contours of the different areas of the weld toe. We selected RVE at the free surface of each area of the weld toe; the RVE and the weld toe direction were perpendicular to each other. The microstructure of the grains in different areas of the weld toe was different, and the grain arrangement was random. In this paper, five RVEs containing random grain arrangement were established for each zone, with the average grain size and number of grains in the same zone being the same. The average grain size and number of grains in different regions were different. In order to consider the crack depth during the initiation of the MSC, the RVE side length of the BM zone was taken as 150 µm. Since the average grain size of the HAZ and the FZ was larger, which was almost three times the average grain size of the BM zone, at the same time, in order to ensure that the calculated data points of each zone of the weld toe were similar, that is, the number of cracked grains was similar, the side length of the RVE in the HAZ and FZ was 450 µm.
Considering the characteristics of the microstructure in different areas of the weld toe, the Voronoi polygon method was used to describe the grain geometry. The Voronoi polygon method is widely used in the research of material microstructure simulation. At this stage, the Voronoi polygon is usually used to simulate the structure of various microscopic grains. We used Neper software (Neper was developed by Romain Quey, this article used version 3.3.) to build a grain model based on Voronoi polygons. Neper is a software package for polycrystal generation and meshing; it can not only build 2D and 3D microstructure models with a large number of grains, but also establish a slip band inside the grain. Seeds are randomly distributed on the slip plane (110) according to the number of grains, and slip bands that are parallel to each other are generated in the grains. This article aims to study the MSC initiation process, and these processes usually occur along the slip band. Thus, the RVE grain model needs to set up the slip band with random directions. According to the RVE side length and the measured average grain size data, the number of grains in the RVE of the BM zone was set to 56, the average grain size was 20 µm, and the number of grains in the RVE of the HAZ was set to 41; the average grain size was 60 µm, the number of grains in the RVE of the FZ was set to 7, and the average grain size was 70 µm. Because the RVE side length of the BM zone was different from the HAZ and the FZ, the slip band width was set to 2 µm for the BM zone and to 6 µm for the HAZ and FZ. In the end, Neper generated the microscopic grain model, as shown in Figure 6.
We imported the RVE model into Abaqus and set the necessary simulation parameters, such as the establishment of the slip band collection, the assignment of material properties, the selection of mesh element types, and the type and size of loading. At the microstructure level, the material properties of each grain were not the same, but from the metallographic experiment, it can be seen that the grains in the different areas of the weld toe are mainly ferrite, which is set as the elastic modulus with normal distribution changes in the article; the average value is 2.11 × 10⁵ MPa, and the variance is 4.43 × 10⁷ (MPa)2. Since RVE was taken from the weld toe section, it can be regarded as a plane strain state, and considering the strong geometric irregularities of the slip band shape, plane strain triangular elements (CPE3) are used to divide the finite element mesh. In order to facilitate the calculation of the FIP average value in each slip band, a separate unit set was established for each slip band. The cross-welded joint bears a unidirectional tensile load. The maximum value was 80 kN, and the nominal stress of the corresponding weld toe section was 200 MPa. Taking the BM zone as an example, the small square of the weld toe is taken as the research RVE. The side length of the square is as mentioned above, and it bears complex loads at the upper, left and lower boundaries; the right boundary was the free boundary. The displacement loading method was adopted; specifically, the displacement calculation result of the local element of the weld toe in the global finite element model was extracted and applied to the edge line corresponding to the RVE. In this study, the global finite element model has an element size of 0.5 mm (500 µm) in the local area of the weld toe, which was greater than the side length of the RVE (150 µm); thus, the boundary load of the RVE can be considered uniformly distributed. The RVE load in the HAZ and FZ was similar to the RVE load in the BM zone.
The simulation process was divided into two parts: crack nucleation and early expansion. First, Abaqus was used to calculate the stress tensor and strain tensor of each element; then, the sum of each element σ n ( α ) and Δ γ p ( α ) in each slip band was calculated according to the grain orientation angle θ . Then, the above values were substituted into Equation (3) to calculate each band FIPave(α). After the crack nucleates, it will affect the stress and strain state of its neighboring grains, leading to FIPave(α) changes. For this reason, when simulating the crack propagation process in the next grain, it was necessary to introduce the influence of the previous grain having cracked. In this paper, the elastic modulus of the slip band in the cracked grain was reduced to one, making it equivalent to a crack, and then the above calculations were repeated to obtain the adjacent grains FIPave(α), and the early expansion process of the MSC could be further obtained. The calculation method for the different areas of the weld toe was similar, and the above calculation process was run and completed in a self-developed Python program. The finite element simulation model of the plastic zone at the crack tip was obtained by comparison, and the theoretical results were compared with the simulation results. Then, the plastic zone with grain gradient was calculated. The life of MSC initiation in different regions of the weld toe was calculated, and the law of MSC initiation behavior was analyzed.

4. Results

4.1. Shape and Boundary Size of MSC Tip Plastic Zone

In order to verify the rationality of the plastic zone simulation results under plane stress and plane strain conditions, the Irwin theory equation was first used to calculate the boundary size and shape of the plastic zone at the crack tip under the two conditions. Then, the finite element method was used to simulate the plastic zone of the crack tip under the same conditions, the shape and size parameters were obtained, and finally the theoretical results were compared with the simulation results to judge whether the simulation method was reasonable. In order to facilitate comparison, theoretical calculations and simulation calculations must be under the same calculation conditions, such as the same applied load, crack length, and material; taking into account the influence of the crack itself and the simplified processing, only the R value in a specific direction was taken.
According to the corresponding parameters, the crack tip stress intensity factor could be calculated from the theoretical equation. Then, the stress intensity factor value was substituted into the calculation equation for the boundary size of the plane stress plastic zone, and the R in the corresponding direction could be obtained. In order to visually display the shape of the plastic zone at the crack tip under plane stress, according to the data of R and θ, the plastic zone shape is obtained by transforming to the Cartesian coordinate system. Using the same method, combined with the boundary size equation of the plastic zone at the crack tip under plane strain, the value of R at a specific angle θ is calculated.
In order to determine a crack tip model with a suitable shape, the boundary size and shape of the plastic zone at the crack tip under plane stress and plane strain under the same working conditions as theoretical calculations are obtained by simulation. The simulation model contains different crack tips, which are triangular crack tips and semicircular crack tips. Comparing the stress cloud diagrams under plane stress and plane strain, it is found that the range of stress concentration under plane stress is larger, indicating that the shape and boundary size of the plastic zone at the crack tip under plane stress and plane strain are very different. According to the actual situation, it is necessary to distinguish the plasticity of the crack tip under plane stress and plane strain. Comparing the stress cloud diagrams of different crack tip shapes under plane stress, it is found that certain differences in the stress cloud diagrams reveal the conclusion that different crack tip shapes have an effect on the plastic zone of the crack tip. The contour line method can be used to show the boundary line of the crack tip plastic zone under plane strain in the simulated stress cloud diagram; the boundary line of the plastic zone at the crack tip is a tortuous contour line. According to the position of the boundary line, combined with different direction angles, the boundary dimension value of the plastic zone at the crack tip can be obtained by measurement.
To investigate the influence of the crack tip shape on the shape and boundary size of the crack tip plastic zone under plane stress and plane strain, in the same working conditions, the plastic zone of different crack tip shapes were compared, as shown in Figure 7a,b. It can be seen from Figure 7a,b that under plane stress and strain, the simulated shape of the plastic zone at the tip of the triangular and semi-circular crack is similar to the theoretically calculated shape, indicating that the method of simulating the plastic zone at the tip of the crack based on the two-dimensional RVE theory is reasonable. The theoretical calculation does not take into account the difference in the properties of micro-grain materials, and it is not sensitive to stress changes, so the shape of the plastic zone in the theoretical calculation is larger than that in the simulation calculation. The simulated triangular and semicircular crack tip plastic zone boundary dimensions are smaller than the theoretical calculation of the crack tip plastic zone boundary size, indicating that the microstructure characteristics have an influence on the crack tip plastic zone. The boundary size of the triangular crack tip plastic zone is generally smaller than that of the semicircular crack tip plastic zone, indicating that the simulation results of the triangular crack tip plastic zone are conservative; thus, the semicircular crack tip model should be used in the study of the MSC tip plastic zone.
To further study the influence of the early expansion of MSCs on the plastic zone, a two-dimensional RVE model and the finite element method were used to establish Voronoi polygonal grain models with different crack lengths to calculate the shape of the plastic zone at the tip of the MSC. Under plane stress and plane strain, 15 crack tip plastic zones with different crack lengths were calculated, and the boundary size of the crack tip plastic zone was plotted on the rectangular coordinates; as the crack length increased, the crack tip plastic zone changed, as shown in Figure 8. It can be seen that under plane stress and plane strain, in the two-dimensional RVE model considering the microstructure characteristics, as the crack length increased, the boundary size of the plastic zone at the crack tip increased, while the shape remained unchanged. The crack length increased with the same length, but the boundary size of the plastic zone at the crack tip increased unevenly, indicating that the anisotropic microscopic grains have a significant effect on the boundary size of the plastic zone at the crack tip. Under plane stress, as shown in Figure 8a, the shape of the plastic zone at the crack tip is “bone”, with a thinner middle and thicker ends. While under plane strain, as shown in Figure 8b, the plastic zone at the crack tip is a “butterfly” shape. When the crack length increased from 2 μm to 30 μm, the boundary size of the plastic zone at the MSC tip increased by 15 μm and 2 μm under the action of plane stress and plane strain in the X-axis direction, respectively.
In the early expansion of the weld toe local MSC, the two-dimensional RVE model was established for the butt weld toe local division, but the transition zone between different areas was ignored; the location of this transition zone is shown in Figure 9a. Through the metallographic experiment, the grain gradient change form of the transition zone can be obtained, as shown in Figure 9b, from the left to the right of the figure, the average grain size gradually increases. In order to consider the influence of the grain gradient on the plastic zone in the study of the plastic zone, five two-dimensional RVE models were established. The grain gradient was reduced in turn, the model side length was 150 µm, and the number of grains was 56. The grain gradient decreased sequentially from 0.5 to 0.1, as shown in Figure 10a–e. The shape of the plastic zone at the crack tip was calculated, and the specific influence of the grain gradient on the plastic zone at the crack tip was obtained through the analysis of the boundary size of the plastic zone at the crack tip.
It can be seen from the foregoing that the shape of the semicircular crack tip is more reasonable. When inserting a 30 μm semicircular crack tip crack on the left boundary of the model, the specific size of the crack was the same as the previous one. The average grain size near the left boundary was relatively small, and the preset crack crossed the grain boundary. The preset crack length can be changed according to the actual situation, and other crack lengths can be used. According to the load calculation, the stress cloud diagrams of the plastic zone at the crack tip of the five models under plane stress and plane strain were obtained.

4.2. Distribution and MSC Path

Take an RVE in the BM zone as an example. Figure 11 shows the distribution of crack nucleation calculations. The red color indicates the area with a larger value. It can be seen from this figure that FIPave(α) has obvious differences between different grains, and within the same grain, FIPave(α) has varying degrees of changes between different slip bands. According to Equation (4), the slip band with the largest FIPave(α) has the shortest life and nucleates first; from this, it can be judged that the yellow line location on the right side of Figure 11 has the first crack nucleation.
According to the method of grain-by-grain cracking [26], the cracks are cracked along the slip bands in the grain, and one grain will be cracked for each calculation step. Continuous calculation will form grain-by-grain cracking. The MSC initiation paths in the three regions of the weld toe are shown in Figure 12. It can be seen from Figure 12 that the MSCs in different areas of the weld toe nucleate on the free surface of the right side of the RVE, which is the position of slip band 1, and then expand along the slip band direction of adjacent grains. The white broken line represents the MSC initiation path, and the numbers (1, 2, 3, etc.) represent the sequence in which MSC initiation expands along the slip band. The slip bands of the early expansion path of the MSC in the BM zone did not form a continuous broken line, as shown in Figure 12a. The FZ is simpler than the BM zone and the HAZ, and the grain arrangement and the direction of the slip zone are simple. The early expansion path of the MSC in the FZ is more continuous than the expansion path of the BM zone and the HAZ; each slip band is connected end to end, as shown in Figure 12c. Roughly speaking, the shape of the early expansion path of the MSC in different areas of the weld toe is very similar, but due to the difference in the local microstructure of the weld toe, the early expansion path of the MSC in the different areas of the weld toe is somewhat different.

5. Discussion

The contour line of the plastic zone at the crack tip under plane stress and plane strain is drawn by the contour method. As shown in Figure 13a–e and Figure 14a–e, the outermost line of the contour was the boundary line of the plastic zone at the crack tip. It can be seen that as the grain gradient decreases, burrs are gradually generated at the boundary of the plastic zone at the crack tip, and the boundary line is discontinuous. Through specific measurement of the boundary line, it was found that as the grain gradient decreased from 0.5 to 0.1, the boundary size of the plastic zone at the tip of the MSC increased about 50%, indicating that under the microstructure characteristics of larger grain gradient, there is a smaller range of the MSC tip into the plastic zone. Huang [50] studied the effect of different loads and materials on the boundary size of the plastic zone at the crack tip but did not consider the effect of the microscopic size of the grains on the plastic zone. This paper also considered the plastic zone size of the crack tip with grain gradient at the junction of different zones of the weld. The boundary size of the plastic zone at the crack tip under the gradient was calculated from the plane stress and plane strain. It was found that the boundary size of the plastic zone under the plane strain was smaller than that under the plane stress; this was consistent with the boundary size of the plastic zone at the crack tip calculated without the grain gradient. The study of the plastic zone at the crack tip with grain gradient has a propelling effect for predicting the local fatigue life of the weld toe. This paper only divided the weld toe into three zones locally and did not consider the initiation behavior of cracks at the transition zone with grain gradient; this will be studied later.
In order to obtain the MSC initiation life in different areas of the weld toe, the RVE calculation data of the HAZ and FZ were normalized; we divided the crack length and life of HAZ and FZ by three, using the data in the BM zone as the standard. The relationship between crack length and life in different areas of the weld toe was obtained, as shown in Figure 15.
It can be seen from Figure 15 that the abscissa is the accumulation of the crack length a of each step, and the ordinate is the accumulation of life. The first point of each broken line was the crack nucleation life, the last point was the MSC initiation life, and the middle point represents the sum of the MSC’s early expansion life and the crack nucleation life. It can be found that the MSC initiation life in different areas of the weld toe is quite different; the MSC initiation life in the BM zone is the smallest. It was concluded that in different areas of the weld toe, MSC initiation first occurred in the BM zone, and the MSC initiation life in the same area of the weld toe was relatively close, indicating that during the MSC initiation stage, the MSC initiation life was mainly affected by the grain microstructure. Generally, the experiment shows overall fatigue life of the same cross-welded joint. As the research object in this article was about 1.218 million cycles [23], the overall fatigue life includes the MSC initiation life. The MSC initiation life in the BM zone of the weld toe calculated by simulation was hundreds of thousands of cycles, while MSC in the HAZ and FZ had a larger initiation life, and some exceeded the overall fatigue life. Therefore, MSC initiation life in the BM zone was more consistent with the experiment, which also proves the rationality of the simulation method in this paper. This also indicates that MSCs were first initiated in the BM zone, rather than in the HAZ and FZ.
Figure 16 is a graph of crack nucleation and its early expansion rate in different areas of the weld toe. The abscissa represents the cumulative life of crack nucleation and early expansion, and the ordinate represents the expansion rate of each grain. From the main data in Figure 16a, there are obvious differences in the expansion rate of MSC in different areas of the weld toe. Among them, the MSC expansion rate in the BM zone is larger than that in the HAZ and FZ. Through numerical average calculation, the MSC expansion rate in the BM zone is about eight times that of the other zones. The lower left corner of Figure 16a is partially enlarged to obtain Figure 16b, and it is found that the MSC expansion rate in the FZ is similar to the MSC expansion rate in the HAZ. Therefore, in the study of weld toe fatigue, the local BM zone of the weld toe is more susceptible to fatigue damage, and MSC initiation is likely to occur first. Usually, the hardness of HAZ is higher compared to other zones. This will cause its plasticity to decrease, so that cracks are easily formed or cracks are easily propagated. However, according to the FIP model, the fatigue performance was comprehensively considered from the stress peak value and the plastic shear strain range; therefore, FIP was more reasonable for life prediction. Some previous studies simply predicted fatigue life from stress or strain [51,52] and did not consider the local microstructure of the weld toe, so the prediction accuracy of fatigue life was not high.
The BM zone average expansion rate was about 2.5 × 10⁻³ μm/cycle, and the MSC expansion rate in FZ and HAZ was about 3.1 × 10⁻⁴ μm/cycle. The crack expansion rate calculated by the simulation was close to the result of Yuan’s research [38]. There were only 15 calculation models in this paper, and the calculation cost was low. The size of this data volume has limitations for the search for laws. Yuan calculated 150 models. The research team will increase the number of models in follow-up research.

6. Conclusions

This paper studies the shape and boundary size of the plastic zone at the tip of the weld toe MSC and the initiation life. Combining the theoretical calculation method and simulation method of the crack tip plastic zone in the two-dimensional RVE model under different crack tip shapes, the theoretical results and simulation results of the crack tip plastic zone shape and boundary size under plane stress and plane strain are compared. The two-dimensional RVE model with cracks was used for further simulation, and the effects of crack length and grain gradient on the shape and boundary size of the plastic zone at the crack tip were studied. Using the methods of RVE and FIP, the Voronoi polygon was established for finite element simulation, and the process of MSC initiation in different areas of the weld toe was simulated. MSC initiation life in the three areas of the weld toe was calculated and analyzed, and the following conclusions were drawn:
(1) The finite element simulation results of the plastic zone at the tip of the weld toe MSC show that with the increase of the crack length, the plastic zone at the crack tip under plane stress presents a “bone” shape, and the plastic zone at the crack tip under plane strain presents a “butterfly” shape. When the crack length increased from 2 μm to 30 μm, the boundary size of the plastic zone at the MSC tip increased by 15 μm and 2 μm under the action of plane stress and plane strain in the X-axis direction, respectively.
(2) After considering the microscopic characteristics of the grains, the boundary of the shaping zone no longer has geometric smoothness. In addition, as the grain gradient decreased from 0.5 to 0.1, the boundary size of the plastic zone at the tip of the MSC increased about 50%.
(3) According to the FIP theory, the two stages of MSC initiation were simulated in the RVE model. Using the method of grain-by-grain expansion, it was concluded that the initiation lives of MSC in the three zones of the weld toe were quite different. MSC initiation occurs first in BM zone, and the life of initiation was about several hundred thousand cycles, which was consistent with the experimental result.
(4) Comparing the expansion rate of the MSC in different areas of the weld toe, it can be seen that the expansion rate of the MSC in the BM zone was faster than that in the HAZ and FZ; through numerical average calculation, the average expansion rate was about 2.5 × 10⁻³ μm/cycle, and the MSC expansion rate in FZ and HAZ was about 3.1 × 10⁻⁴ μm/cycle.

Author Contributions

Conceptualization, L.C., X.C., G.W. and F.Y.; Methodology, L.C. and X.C.; Software, L.C.; Data Curation, G.W. and F.Y.; Validation, L.C., X.C. and G.W.; Formal Analysis, L.C. and X.C.; Investigation, L.C.; Resources, L.C., X.C. and G.W.; Visualization, L.C. and X.C.; Writing—original draft, L.C.; Writing—review and editing, X.C. and G.W.; Supervision, X.C., G.W. and F.Y. All authors have read and agreed to the published version of the manuscript.

Funding

This research was funded by National Natural Science Foundation of China. The person in charge of the funding project was Guoqian Wei professor, with a funding amount of 620,000 RMB (51575408).

Institutional Review Board Statement

Not applicable.

Informed Consent Statement

Not applicable.

Data Availability Statement

The data presented in this study are available on request from the corresponding author. The data are not publicly available, they need to be verified by a large number of experiments, and further research is currently underway.

Conflicts of Interest

The authors declare no conflict of interest.

References

  1. Han, L.; Wang, Y.; Zhang, Y.; Lu, C.; Fei, C.; Zhao, Y. Competitive cracking behavior and microscopic mechanism of Ni-based superalloy blade respecting accelerated CCF failure. Int. J. Fatigue 2021, 150, 106306. [Google Scholar] [CrossRef]
  2. Tang, K.; Du, Z.; Wu, B.; Hou, J. Fatigue behavior prediction of metal alloys based on a unified multiscale crack growth model. Eng. Fract. Mech. 2020, 235, 107132. [Google Scholar] [CrossRef]
  3. Yuan, H.; Zhang, W.; Kim, J.; Liu, Y. A nonlinear grain-based fatigue damage model for civil infrastructure under variable amplitude loads. Int. J. Fatigue 2017, 104, 389–396. [Google Scholar] [CrossRef]
  4. Gao, P.; Lei, Z.; Wang, X.; Zhan, M. Deformation in fatigue crack tip plastic zone and its role in crack propagation of titanium alloy with tri-modal microstructure. Mater. Sci. Eng. A 2018, 739, 198–202. [Google Scholar] [CrossRef]
  5. Hosdez, J.; Langlois, M.; Witz, J.-F.; Limodin, N.; Najjar, D.; Charkaluk, E.; Osmond, P.; Forre, A.; Szmytka, F. Plastic zone evolution during fatigue crack growth: Digital image correlation coupled with finite elements method. Int. J. Solids Struct. 2019, 171, 92–102. [Google Scholar] [CrossRef] [Green Version]
  6. Vojtek, T.; Hrstka, M. How to get a correct estimate of the plastic zone size for shear-mode fatigue cracks? Theor. Appl. Fract. Mech. 2019, 104, 102332. [Google Scholar] [CrossRef]
  7. Torabi, A.; Shahbazian, B. Notch tip plastic zone determination by extending Irwin’s model. Theor. Appl. Fract. Mech. 2020, 108, 102643. [Google Scholar] [CrossRef]
  8. Zhang, B.; Xu, W.; Wu, X.; Yu, Y.; Dong, D. Stress intensity factors and plastic zones of stiffened panels with multiple collinear cracks. Theor. Appl. Fract. Mech. 2020, 110, 102816. [Google Scholar] [CrossRef]
  9. Hong, K.; Oterkus, S.; Oterkus, E. Peridynamic analysis of fatigue crack growth in fillet welded joints. Ocean Eng. 2021, 235, 109348. [Google Scholar] [CrossRef]
  10. Karabulut, B.; Rossi, B. On the fatigue behavior of duplex and high-strength welded cruciform joints. Eng. Struct. 2021, 247, 113161. [Google Scholar] [CrossRef]
  11. Leonetti, D.; Maljaars, J.; Snijder, H. Fracture mechanics based fatigue life prediction for a weld toe crack under constant and variable amplitude random block loading—Modeling and uncertainty estimation. Eng. Fract. Mech. 2020, 242, 107487. [Google Scholar] [CrossRef]
  12. Liu, T.; Shi, X.; Zhang, J.; Fei, B. Crack initiation and propagation of 30CrMnSiA steel under uniaxial and multiaxial cyclic loading. Int. J. Fatigue 2019, 122, 240–255. [Google Scholar] [CrossRef]
  13. Mlikota, M.; Schmauder, S.; Dogahe, K.; Božić, Ž. Influence of local residual stresses on fatigue crack initiation. Procedia Struct. Integr. 2021, 31, 3–7. [Google Scholar] [CrossRef]
  14. Shin, W.; Chang, K.-H.; Muzaffer, S. Fatigue analysis of cruciform welded joint with weld penetration defects. Eng. Fail. Anal. 2020, 120, 105111. [Google Scholar] [CrossRef]
  15. Castelluccio, G.M.; McDowell, D.L. Microstructure and mesh sensitivities of mesoscale surrogate driving force measures for transgranular fatigue cracks in polycrystals. Mater. Sci. Eng. A 2015, 639, 626–639. [Google Scholar] [CrossRef]
  16. Ghomashchi, R.; Costin, W.; Kurji, R. Evolution of weld metal microstructure in shielded metal arc welding of X70 HSLA steel with cellulosic electrodes: A case study. Mater. Charact. 2015, 107, 317–326. [Google Scholar] [CrossRef]
  17. Ribeiro, V.; Correia, J.; Mourão, A.; Lesiuk, G.; Gonçalves, A.; De Jesus, A.; Berto, F. Low-cycle fatigue modelling supported by strain energy density-based Huffman model considering the variability of dislocation density. Eng. Fail. Anal. 2021, 128, 105608. [Google Scholar] [CrossRef]
  18. Bang, D.; Ince, A.; Noban, M. Modeling approach for a unified crack growth model in short and long fatigue crack regimes. Int. J. Fatigue 2019, 128, 105182. [Google Scholar] [CrossRef]
  19. Bang, D.; Ince, A. A short and long crack growth model based on 2-parameter driving force and crack growth thresholds. Int. J. Fatigue 2020, 141, 105870. [Google Scholar] [CrossRef]
  20. Liu, X.; Lu, S. A micro-crack initiation life simulation method by improving the Tanaka-Mura’s model of slip behavior. Int. J. Fatigue 2020, 145, 106108. [Google Scholar] [CrossRef]
  21. Pribe, J.D.; Siegmund, T.; Kruzic, J.J. The roles of yield strength mismatch, interface strength, and plastic strain gradients in fatigue crack growth across interfaces. Eng. Fract. Mech. 2020, 235, 107072. [Google Scholar] [CrossRef]
  22. Xu, Z.; Huang, C.; Wan, M.; Tan, C.; Zhao, Y.; Ji, S.; Zeng, W. Influence of microstructure on strain controlled low cycle fatigue crack initiation and propagation of Ti-55531 alloy. Int. J. Fatigue 2021, 156, 106678. [Google Scholar] [CrossRef]
  23. Wei, G.; Hu, K.; Chen, S.; Yan, M. Experiment and simulation investigation of multiple cracks evolution at the weld toe. Int. J. Fatigue 2020, 144, 106037. [Google Scholar] [CrossRef]
  24. Toribio, J.; González, B.; Matos, J.-C. Macro- and micro-approach to locally multiaxial fatigue crack paths in oriented and non-oriented pearlitic microstructures. Procedia Struct. Integr. 2020, 28, 2396–2403. [Google Scholar] [CrossRef]
  25. Bai, Y.; Guo, T.; Wang, J.; Gao, J.; Gao, K.; Pang, X. Stress-sensitive fatigue crack initiation mechanisms of coated titanium alloy. Acta Mater. 2021, 217, 117179. [Google Scholar] [CrossRef]
  26. Fourel, L.; Noyel, J.-P.; Bossy, E.; Kleber, X.; Sainsot, P.; Ville, F. Towards a grain-scale modeling of crack initiation in rolling contact fatigue - Part 2: Persistent slip band modeling. Tribol. Int. 2021, 163, 107173. [Google Scholar] [CrossRef]
  27. Nishikawa, H.; Furuya, Y.; Kasuya, T.; Enoki, M. Microstructurally small fatigue crack initiation behavior of fine and coarse grain simulated heat-affected zone microstructures in low carbon steel. Mater. Sci. Eng. A 2021, 832, 142363. [Google Scholar] [CrossRef]
  28. Baudoin, P.; Magnier, V.; El Bartali, A.; Witz, J.-F.; Dufrenoy, P.; Demilly, F.; Charkaluk, E. Numerical investigation of fatigue strength of grain size gradient materials under heterogeneous stress states in a notched specimen. Int. J. Fatigue 2016, 87, 132–142. [Google Scholar] [CrossRef]
  29. Castelluccio, G.M.; McDowell, D.L. Microstructure-sensitive small fatigue crack growth assessment: Effect of strain ratio, multiaxial strain state, and geometric discontinuities. Int. J. Fatigue 2015, 82, 521–529. [Google Scholar] [CrossRef]
  30. Briffod, F.; Shiraiwa, T.; Enoki, M. Microstructure modeling and crystal plasticity simulations for the evaluation of fatigue crack initiation in α-iron specimen including an elliptic defect. Mater. Sci. Eng. A 2017, 695, 165–177. [Google Scholar] [CrossRef]
  31. Ferreira, S.E.; De Castro, J.T.P.; Meggiolaro, M.A. A model to quantify fatigue crack growth by cyclic damage accumulation calculated by strip-yield procedures. Frat. Integrità Strut. 2017, 11, 129–138. [Google Scholar] [CrossRef]
  32. Ferreira, S.E.; de Castro, J.T.P.; Meggiolaro, M.A. Using the strip-yield mechanics to model fatigue crack growth by damage accumulation ahead of the crack tip. Int. J. Fatigue 2017, 103, 557–575. [Google Scholar] [CrossRef]
  33. Ferreira, S.E.; de Castro, J.T.P.; Meggiolaro, M.A. Fatigue crack growth predictions based on damage accumulation ahead of the crack tip calculated by strip-yield procedures. Int. J. Fatigue 2018, 115, 89–106. [Google Scholar] [CrossRef]
  34. Ashton, P.; Harte, A.; Leen, S. A strain-gradient, crystal plasticity model for microstructure-sensitive fretting crack initiation in ferritic-pearlitic steel for flexible marine risers. Int. J. Fatigue 2018, 111, 81–92. [Google Scholar] [CrossRef] [Green Version]
  35. Mao, J.; Hu, D.; Meng, F.; Zhou, X.; Song, J.; Wang, R. Multiscale modeling of transgranular short crack growth during fatigue in polycrystalline metals. Int. J. Fatigue 2018, 116, 648–658. [Google Scholar] [CrossRef]
  36. Sun, G.; Chen, Y.; Wei, X.; Shang, D.; Chen, S. Crystal plastic modeling on fatigue properties for aluminum alloy friction stir welded joint. Mater. Sci. Eng. A 2018, 728, 165–174. [Google Scholar] [CrossRef]
  37. Takahashi, Y.; Kobayashi, D.; Kashihara, M.; Kozawa, T.; Arai, S. Electron-microscopic analyses on high-temperature fatigue crack growth mechanism in a Ni-based single crystal superalloy. Mater. Sci. Eng. A 2020, 793, 139821. [Google Scholar] [CrossRef]
  38. Yuan, H.; Zhang, W.; Castelluccio, G.; Kim, J.; Liu, Y. Microstructure-sensitive estimation of small fatigue crack growth in bridge steel welds. Int. J. Fatigue 2018, 112, 183–197. [Google Scholar] [CrossRef] [Green Version]
  39. Tan, H.; Hu, X.; Wu, X.; Zeng, Y.; Tu, X.; Xu, X.; Qian, J. Initial crack propagation of integral joint in steel truss arch bridges and its fatigue life accession. Eng. Fail. Anal. 2021, 130, 105777. [Google Scholar] [CrossRef]
  40. Zhang, W.; Zeng, L. Experimental investigation and low-cycle fatigue life prediction of welded Q355B steel. J. Constr. Steel Res. 2021, 178, 106497. [Google Scholar] [CrossRef]
  41. Natkowski, E.; Durmaz, A.R.; Sonnweber-Ribic, P.; Münstermann, S. Fatigue lifetime prediction with a validated micromechanical short crack model for the ferritic steel EN 1.4003. Int. J. Fatigue 2021, 152, 106418. [Google Scholar] [CrossRef]
  42. Tsutsumi, S.; Fincato, R.; Luo, P.; Sano, M.; Umeda, T.; Kinoshita, T.; Tagawa, T. Effects of weld geometry and HAZ property on low-cycle fatigue behavior of welded joint. Int. J. Fatigue 2021, 156, 106683. [Google Scholar] [CrossRef]
  43. Babazadeh, A.; Khedmati, M.R. Empirical formulations for estimation of ultimate strength of cracked continuous unstiffened plates used in ship structure under in-plane longitudinal compression. Eng. Fail. Anal. 2019, 100, 470–484. [Google Scholar] [CrossRef]
  44. Musinski, W.D.; McDowell, D.L. Simulating the effect of grain boundaries on microstructurally small fatigue crack growth from a focused ion beam notch through a three-dimensional array of grains. Acta Mater. 2016, 112, 20–39. [Google Scholar] [CrossRef]
  45. Cui, C.; Gong, X.; Xia, F.; Xu, W.; Chen, L. Misorientation effect of twist grain boundaries on crack nucleation from molecular dynamics. Eng. Fract. Mech. 2021, 243, 107509. [Google Scholar] [CrossRef]
  46. Macías, J.G.S.; Elangeswaran, C.; Zhao, L.; Buffière, J.-Y.; Van Hooreweder, B.; Simar, A. Fatigue crack nucleation and growth in laser powder bed fusion AlSi10Mg under as built and post-treated conditions. Mater. Des. 2021, 210, 110084. [Google Scholar] [CrossRef]
  47. Gao, T.; Xue, H.; Sun, Z. Effect of transformed β phase on fish-eye ductile crack initiation of a Ti-6Al-4V alloy in very high cycle fatigue regime. Mater. Lett. 2020, 287, 129283. [Google Scholar] [CrossRef]
  48. Lang, Q.; Zhang, X.; Song, G.; Liu, L. Effects of different laser power and welding speed on the microstructure and mechanical properties of TRIP joints in laser-TIG arc hybrid lap filler wire welding. Mater. Today Commun. 2021, 29, 102925. [Google Scholar] [CrossRef]
  49. Flipon, B.; Grand, V.; Murgas, B.; Gaillac, A.; Nicolaÿ, A.; Bozzolo, N.; Bernacki, M. Grain size characterization in metallic alloys using different microscopy and post-processing techniques. Mater. Charact. 2021, 174, 110977. [Google Scholar] [CrossRef]
  50. Huang, X.; Liu, Y.; Huang, X. Analytical characterizations of crack tip plastic zone size for central-cracked unstiffened and stiffened plates under biaxial loading. Eng. Fract. Mech. 2018, 206, 1–20. [Google Scholar] [CrossRef]
  51. Ince, A. A mean stress correction model for tensile and compressive mean stress fatigue loadings. Fatigue Fract. Eng. Mater. Struct. 2016, 40, 939–948. [Google Scholar] [CrossRef]
  52. Xu, B.; Wu, Q. Stress fatigue crack propagation analysis of crane structure based on acoustic emission. Eng. Fail. Anal. 2019, 109, 104206. [Google Scholar] [CrossRef]
Figure 1. Fatigue lifetime stage diagram.
Metals 12 00618 g001
Figure 2. Weld toe three-zone two-dimensional representative volume element.
Metals 12 00618 g002
Figure 3. Weld toe three-zone section metallography.
Metals 12 00618 g003
Figure 4. Schematic diagram of the crack tips: (a) triangular shape crack tip; (b) semicircular shape crack tip; (c) grain model of pre-crack.
Metals 12 00618 g004
Figure 5. Schematic diagram of model loading.
Metals 12 00618 g005
Figure 6. Microscopic grain model of different areas of weld toe.
Metals 12 00618 g006
Figure 7. Comparison of (a) plastic zone under plane stress; (b) plastic zone under plane strain.
Metals 12 00618 g007
Figure 8. (a) Plastic zone of the crack tip with the crack length under plane stress. (b) Plastic zone of the crack tip with the crack length under plane strain.
Metals 12 00618 g008
Figure 9. (a) Local grain gradient position of weld toe. (b) Metallography of grain gradient.
Metals 12 00618 g009
Figure 10. Grain gradient change model: (a) grain gradient of 0.5; (b) grain gradient of 0.4; (c) grain gradient of 0.3; (d) grain gradient of 0.2; (e) grain gradient of 0.1.
Metals 12 00618 g010
Figure 11. Crack nucleation FIPave(α) distribution diagram.
Metals 12 00618 g011
Figure 12. (a) Crack expansion path in BM zone. (b) Crack expansion path in HAZ. (c) Crack expansion path in FZ.
Metals 12 00618 g012
Figure 13. Shape of the plastic zone at the crack tip under plane stress: (a) grain gradient of 0.5; (b) grain gradient of 0.4; (c) grain gradient of 0.3; (d) grain gradient of 0.2; (e) grain gradient of 0.1.
Metals 12 00618 g013
Figure 14. Shape of the plastic zone at the crack tip under plane strain: (a) grain gradient of 0.5; (b) grain gradient of 0.4; (c) grain gradient of 0.3; (d) grain gradient of 0.2; (e) grain gradient of 0.1.
Metals 12 00618 g014
Figure 15. Crack length and life in different areas of the weld toe.
Metals 12 00618 g015
Figure 16. (a) MSC expansion rate and life in different areas of the weld toe. (b) Partial enlarged view.
Metals 12 00618 g016
Table 1. Chemical composition of BM (Q345B steel).
C (%)V (%)Nb (%)Ti (%)Si (%)Mn (%)P (%)S (%)Fe (%)
0.160.100.030.200.351.340.030.0297.77
Table 2. Basic mechanical parameters of Q345B.
Yield   Strength   σ s   ( MPa ) Tensile   Strength   σ b   ( MPa ) Elastic Modulus E (MPa)Poisson’s Ratio μ
3454162.1 × 1050.3
Table 3. Chemical composition of welding wire ER50-6.
C (%)S (%)P (%)Cu (%)Si (%)Mn (%)Fe (%)
0.06–0.15≤0.035≤0.025≤0.500.80–1.151.40–1.85Bal.
Table 4. Mechanical properties of welding wire ER50-6.
Yield   Strength   σ s   ( MPa ) Tensile   Strength   σ b   ( MPa ) Elastic Modulus E (MPa)Poisson’s Ratio μ
4726002.08 × 1050.28
Publisher’s Note: MDPI stays neutral with regard to jurisdictional claims in published maps and institutional affiliations.

