Article

Research on Hot Deformation Behavior of F92 Steel Based on Stress Correction

1
School of Metallurgical Engineering, Anhui University of Technology, Ma’anshan 243002, China
2
Nanjing Develop Advanced Manufacturing Co., Ltd., Nanjing 210048, China
*
Author to whom correspondence should be addressed.
Metals 2022, 12(5), 698; https://doi.org/10.3390/met12050698
Submission received: 25 February 2022 / Revised: 11 April 2022 / Accepted: 13 April 2022 / Published: 19 April 2022
(This article belongs to the Special Issue Advanced Technology in Microalloyed Steels)

Abstract

:
In order to systematically study the stress correction method and hot deformation behavior of F92 stainless steel, the hot compression test was performed using a Gleeble-3500 (DSI USA, Connecticut, CT, USA) at strain rates of 0.01–10 s−1 and deformation temperatures of 750–1150 °C. First, to obtain the truest stress values from the original data, we adopted two stress correction models that did not affect each other, and the order of the two correction models was also different. Second, the adiabatic-friction-corrected stress was used as the input value of the AR model to predict the high-temperature flow behavior of F92 steel. Third, the optimal hot working parameters of F92 steel were determined via modeling and microstructure characterization. The results were as follows: The final correction values for both models were smaller than those from the original data. The stress deviation corrected by model 1 reached a maximum value of 59 MPa at 750 °C and 10 s−1. After establishing the Arrhenius (AR) model, it was determined that the accuracy of stress correction model 2 was stronger than that of model 1. Additionally, the corrected stress improved the predictive power of the AR model. The hot working range of F92 steel falls within a deformation temperature of 850 °C to 1050 °C and strain rate of 0.1 s−1 to 1 s−1. Finally, the AR model was used to describe the high-temperature flow behavior of F92 steel.

1. Introduction

F92 is a novel martensitic heat-resistant steel formed by adding W and a small amount of B to F91 steel, which allows further improvement of high-temperature strength and creep properties [1,2]. The existence of Nb and V elements in F92 leads to the refinement of the microstructure of the material, which increases its strength and toughness [3,4]. The service temperature of F92 steel can reach about 600–650 °C [5]. In the late 20th century, F92 steel was one of the key raw materials used for the manufacture of reactor vessels [6]. Today, many steel grades of the same type have been developed, such as T91, P91, T92, P92, T122, P122, etc., and these are widely used in thermal power stations and boilers due to their good performance. Abson et al. [7] studied the type IV cracking of 9–12% Cr creep-resistant steel after welding. Pandey et al. [8] investigated the effect of normalization temperature on the structural properties of P91 steel. The variation of the martensitic microstructure of 9–12% Cr steel welds was studied [9]. Moreover, Zhang et al. [10] studied the high-temperature deformation behavior and a constitutive model of 14Cr17Ni2 steel. The high-temperature flow stress model and thermal processing diagram of 2Cr12NiMo1W1V supercritical steel were successfully studied by Wang et al. [11]. There have been some studies on the flow behavior of stainless steel [12,13]. As mentioned above, there have been few reports on the hot deformation behavior of F92 steel. The hot deformation process not only determines the optimal range of deformation parameters, but also allows defects to be avoided and losses to be minimized. By comparing two stress correction models in this study (the two models were not related in any way), our aim was to be able to find the truest stress value from the original data. Using the corrected stress with a small error as the input value of the AR model not only improved the prediction accuracy for F92 steel, but also gave the best deformation parameter range combined with microstructure characterization.

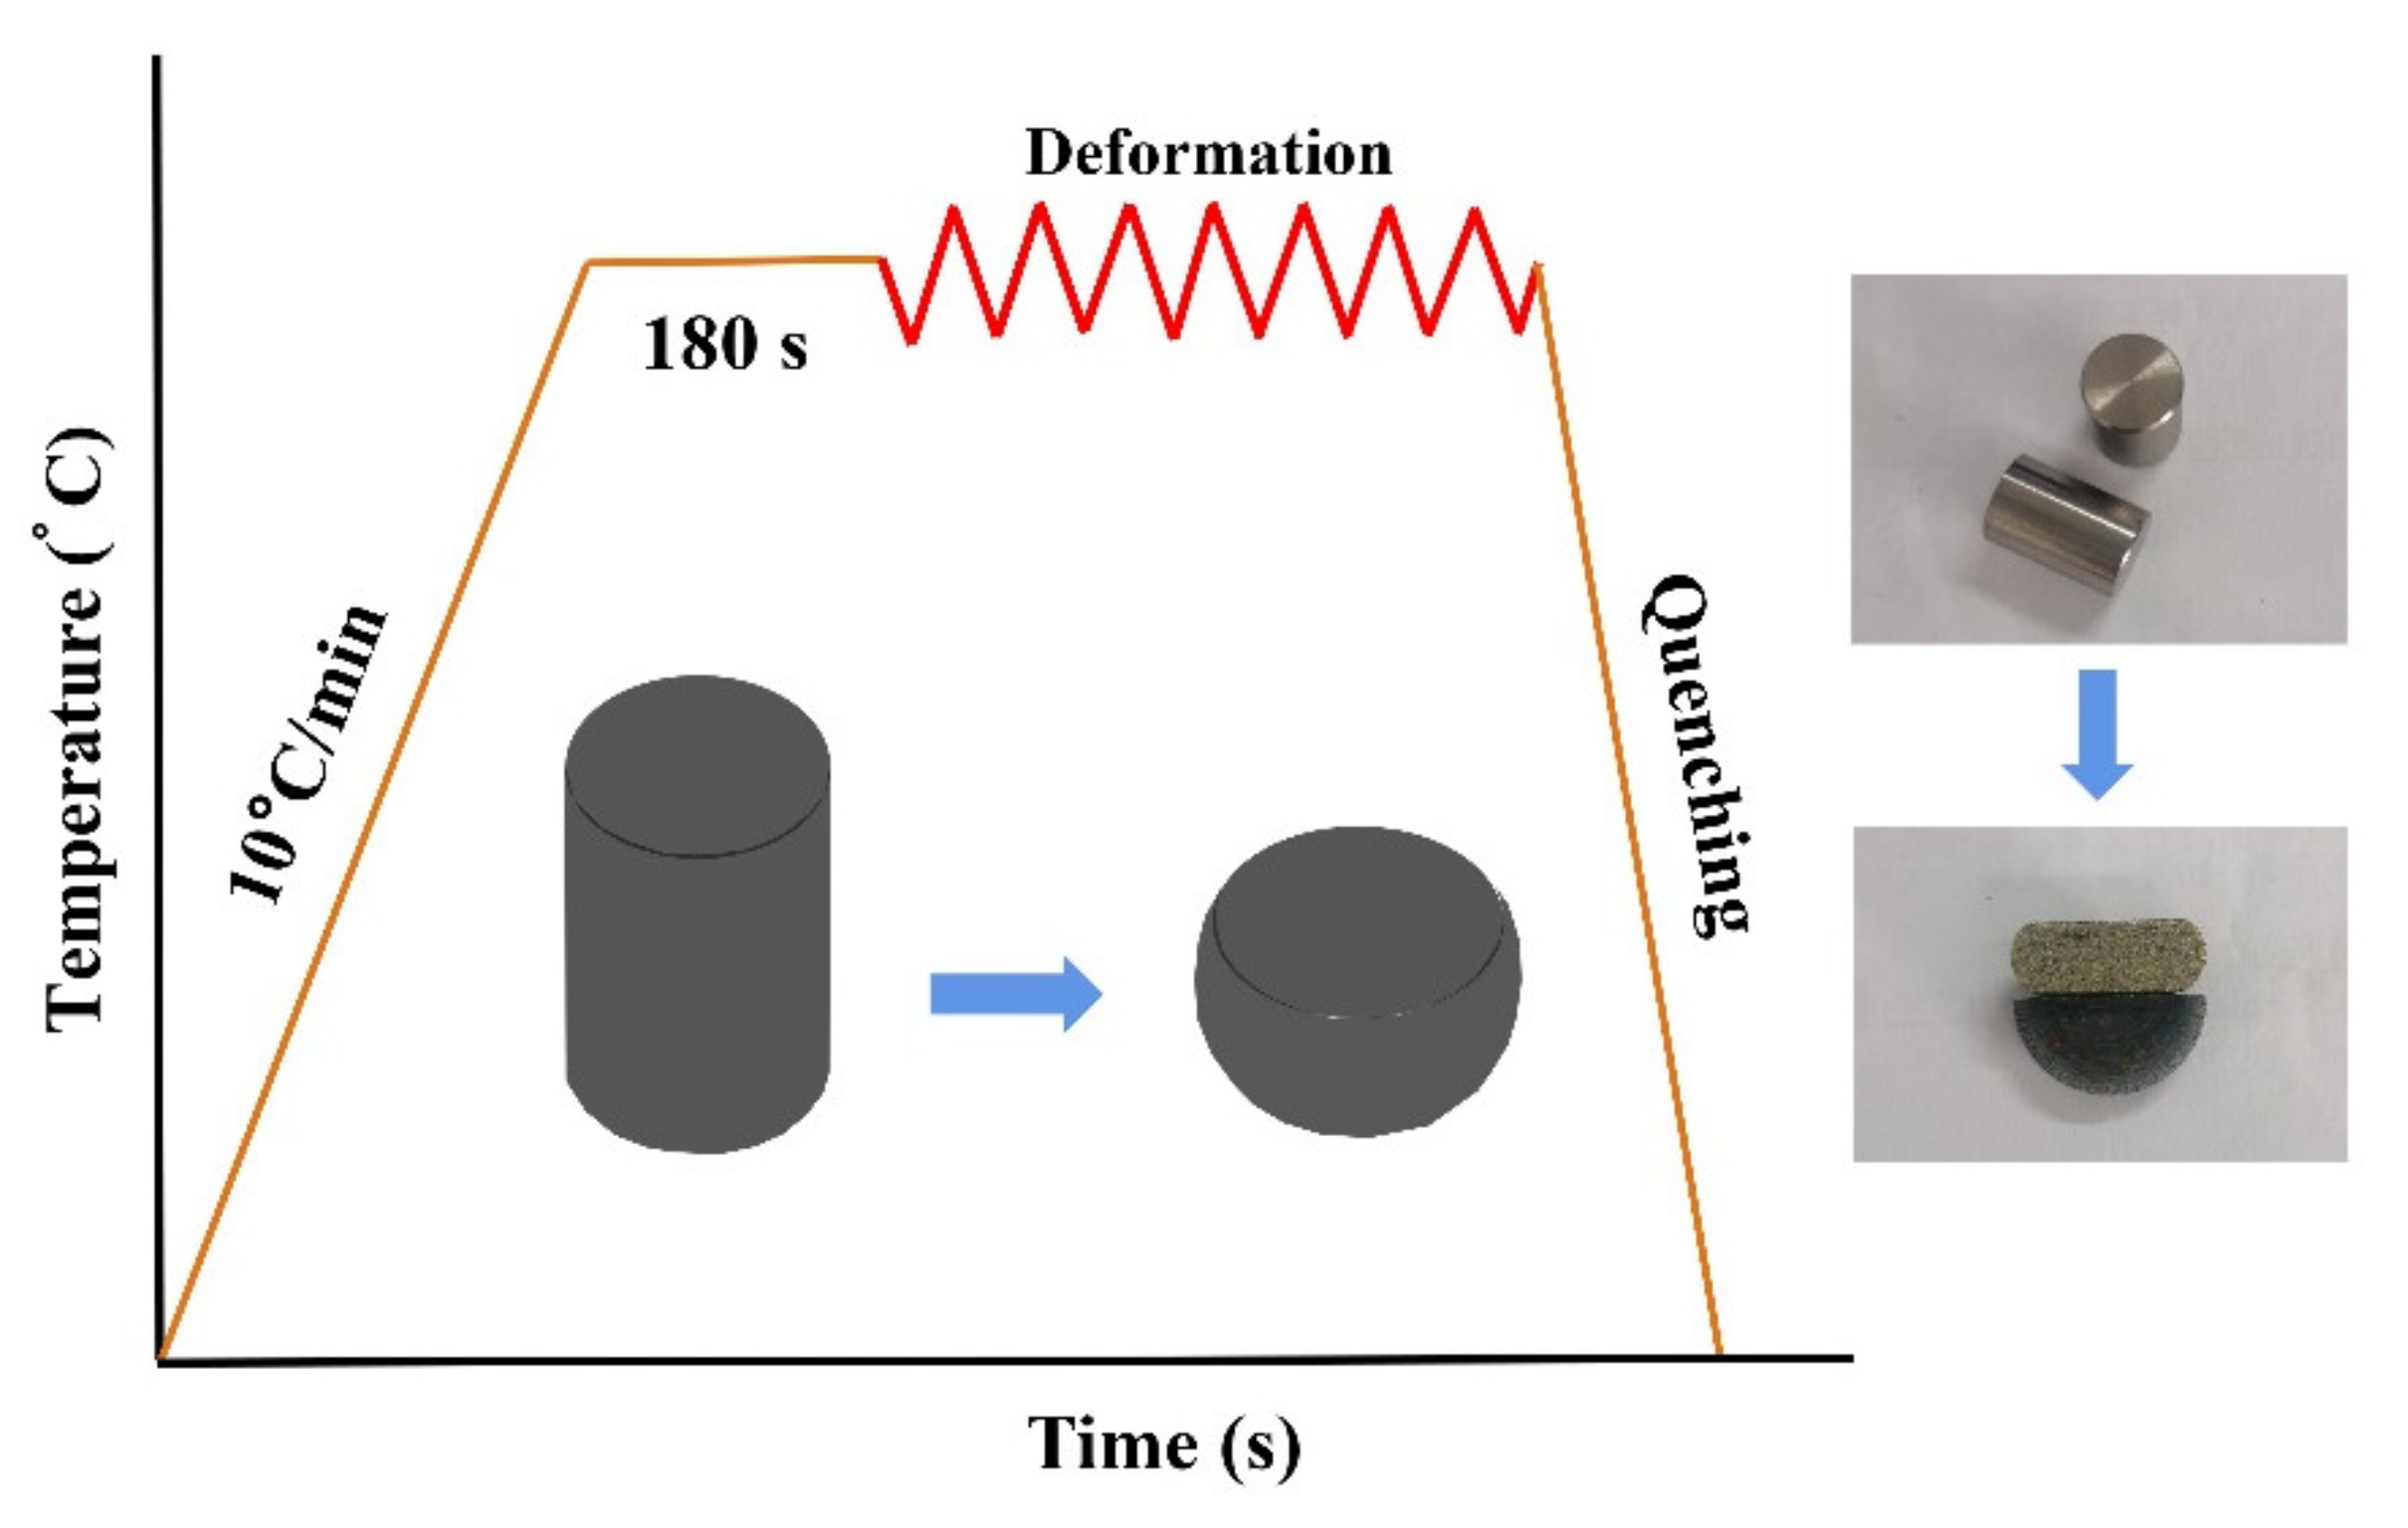
2. Experimental Details

The material used in this study was as-cast F92 steel provided by a commercial supplier. The original metallographic and chemical composition of the F92 steel is shown in Figure 1 and Table 1, respectively. It can be concluded from Figure 1 that the original microstructure was composed of coarse martensite, and the distribution was relatively regular. Smooth cylinders (8 mm in diameter and 12 mm in length) were cut by wire-electrical discharge machining (WEDM). These specimens were first polished and then subjected to isothermal compression in a Gleeble-3500 (DSI USA, Connecticut, CT, USA) thermal simulation. Graphite and tantalum foils were added at both ends of the specimens to reduce the effect of friction as much as possible; moreover, graphite foils were used for temperatures less than 1100 °C and tantalum foils were used for temperatures greater than 1100 °C. The hot deformation behavior of F92 steel was investigated at four strain rates (0.01 s−1, 0.1 s−1, 1 s−1, 10 s−1) and five deformation temperatures (750 °C, 850 °C, 950 °C, 1050 °C, 1150 °C).
Figure 2 shows a more detailed thermal simulation compression experiment scheme. Thermocouples were used throughout the experiment to ensure a constant temperature. After the start of the test, the temperature was raised to the deformation temperature at a heating rate of 10 °C*s, ensuring uniform temperature of the specimen via maintenance of a constant temperature for a period of 180 s. The maximum deformation degree was set to 30%. After the thermal deformation was completed, the specimen was quenched immediately to preserve the deformed microstructure. The supporting machine was responsible for data collection and recording. The compressed specimens were cut along the center with the help of WEDM, and then ground and mechanically polished with sandpaper. The microstructure after the compression was characterized with the aid of a Leica metallurgical microscope (model DM 4000 M, BaHens instrument Co., Ltd., Shanghai, China).

3. Results and Discussion

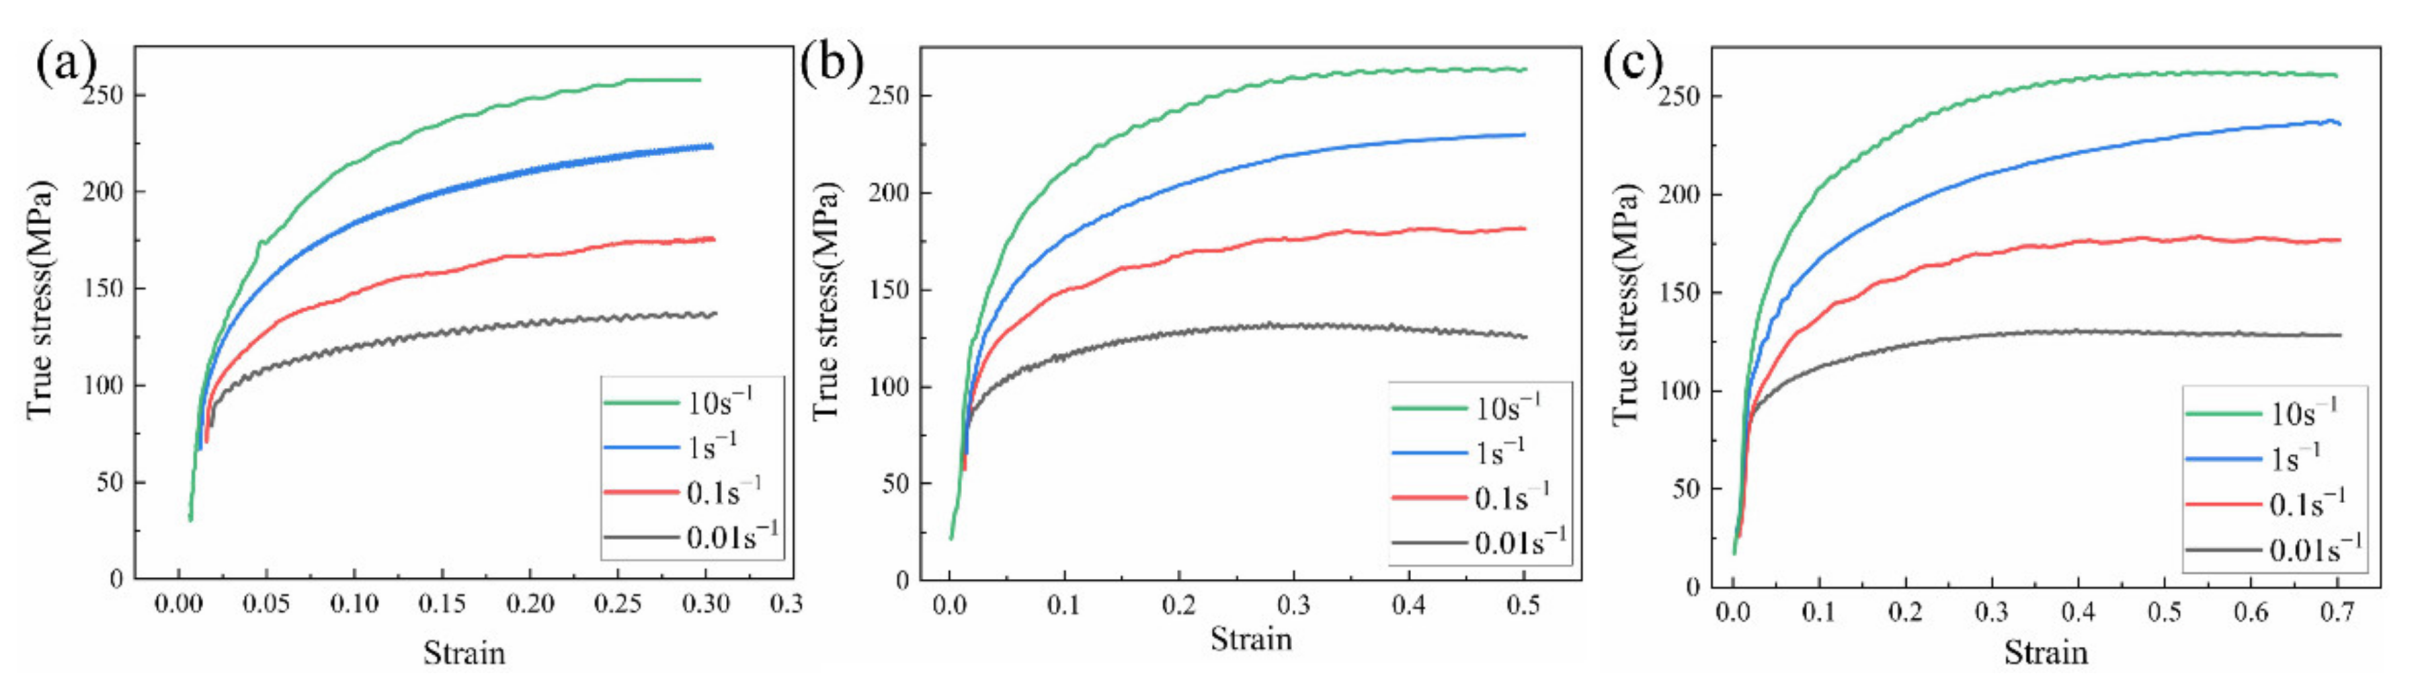
3.1. True Stress–Strain Curve

The true stress–strain curves for different deformations at 950 °C can be obtained from the hot compression experimental data of F92 steel, as shown in Figure 3. As expected, the deformation temperature and strain rate had a significant effect on the flow stress. At a constant temperature, there was a positive correlation between flow stress and strain rate, which may have been related to the following factors: at high strain rates, a certain degree of elastic deformation occurs inside the material, resulting in an increase in the stress value. Secondly, compared with low strain rates, the time required for high strain rates to reach the preset deformation is shorter and the dislocation density increases rapidly, thereby enhancing the work-hardening effect. On the other hand, the dislocation climb and slip movements are not carried out in time, resulting in weakening of the softening effect. Moreover, it is difficult to achieve a balance between hardening and softening effects under a small degree of deformation.

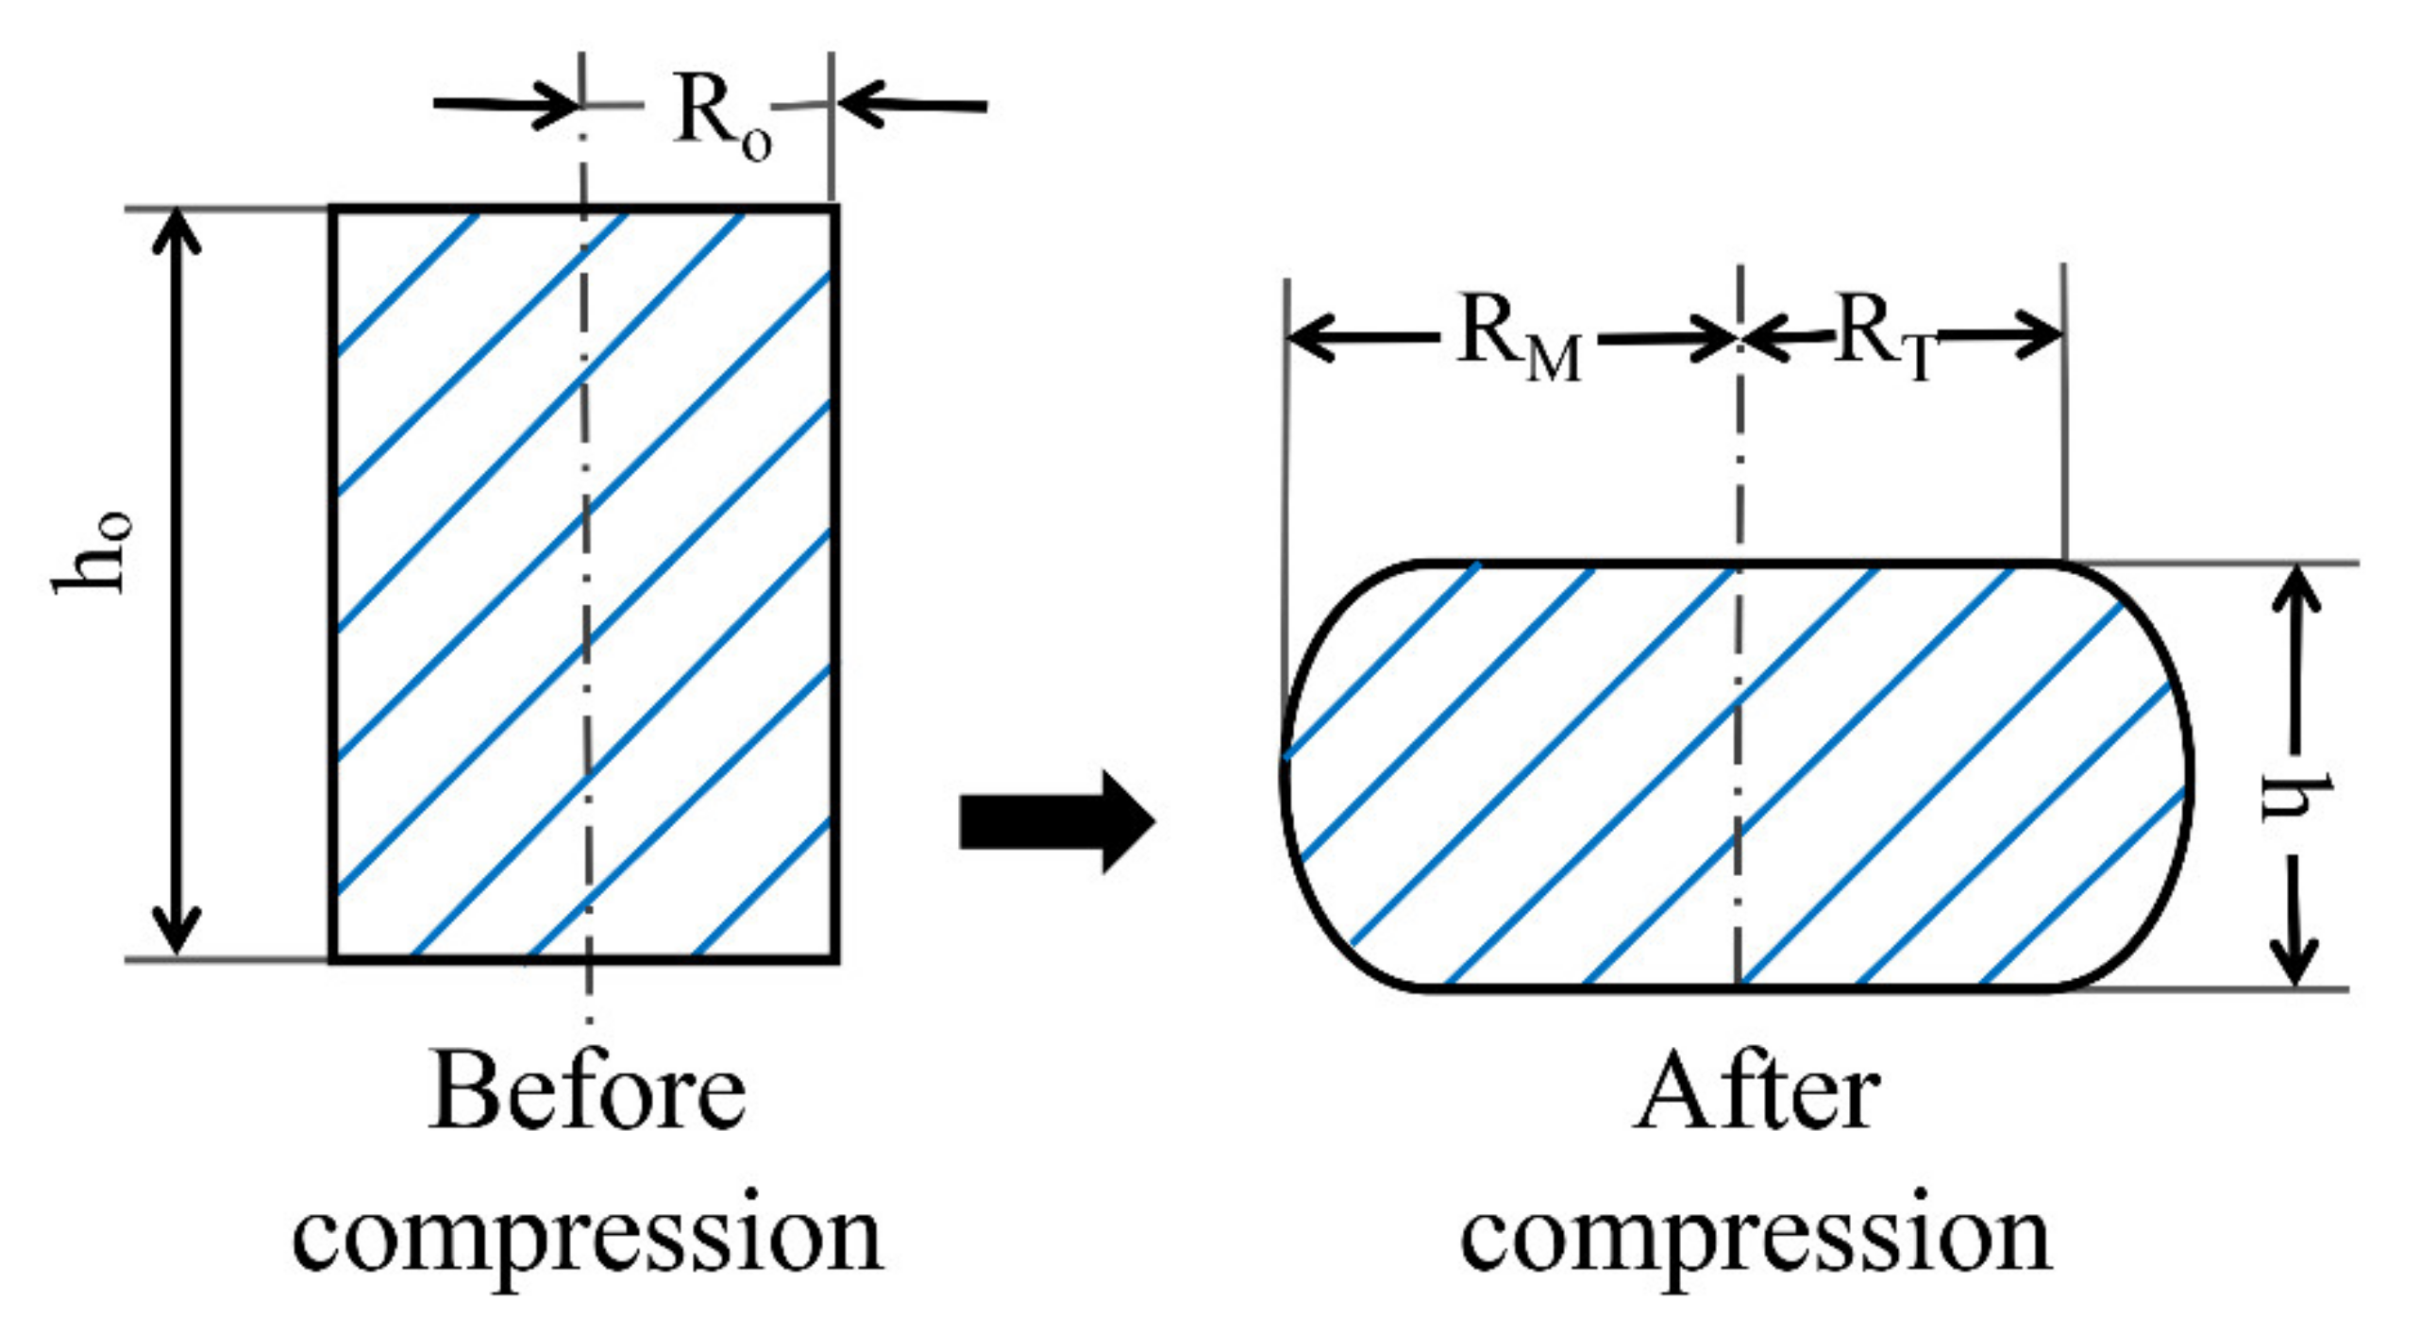
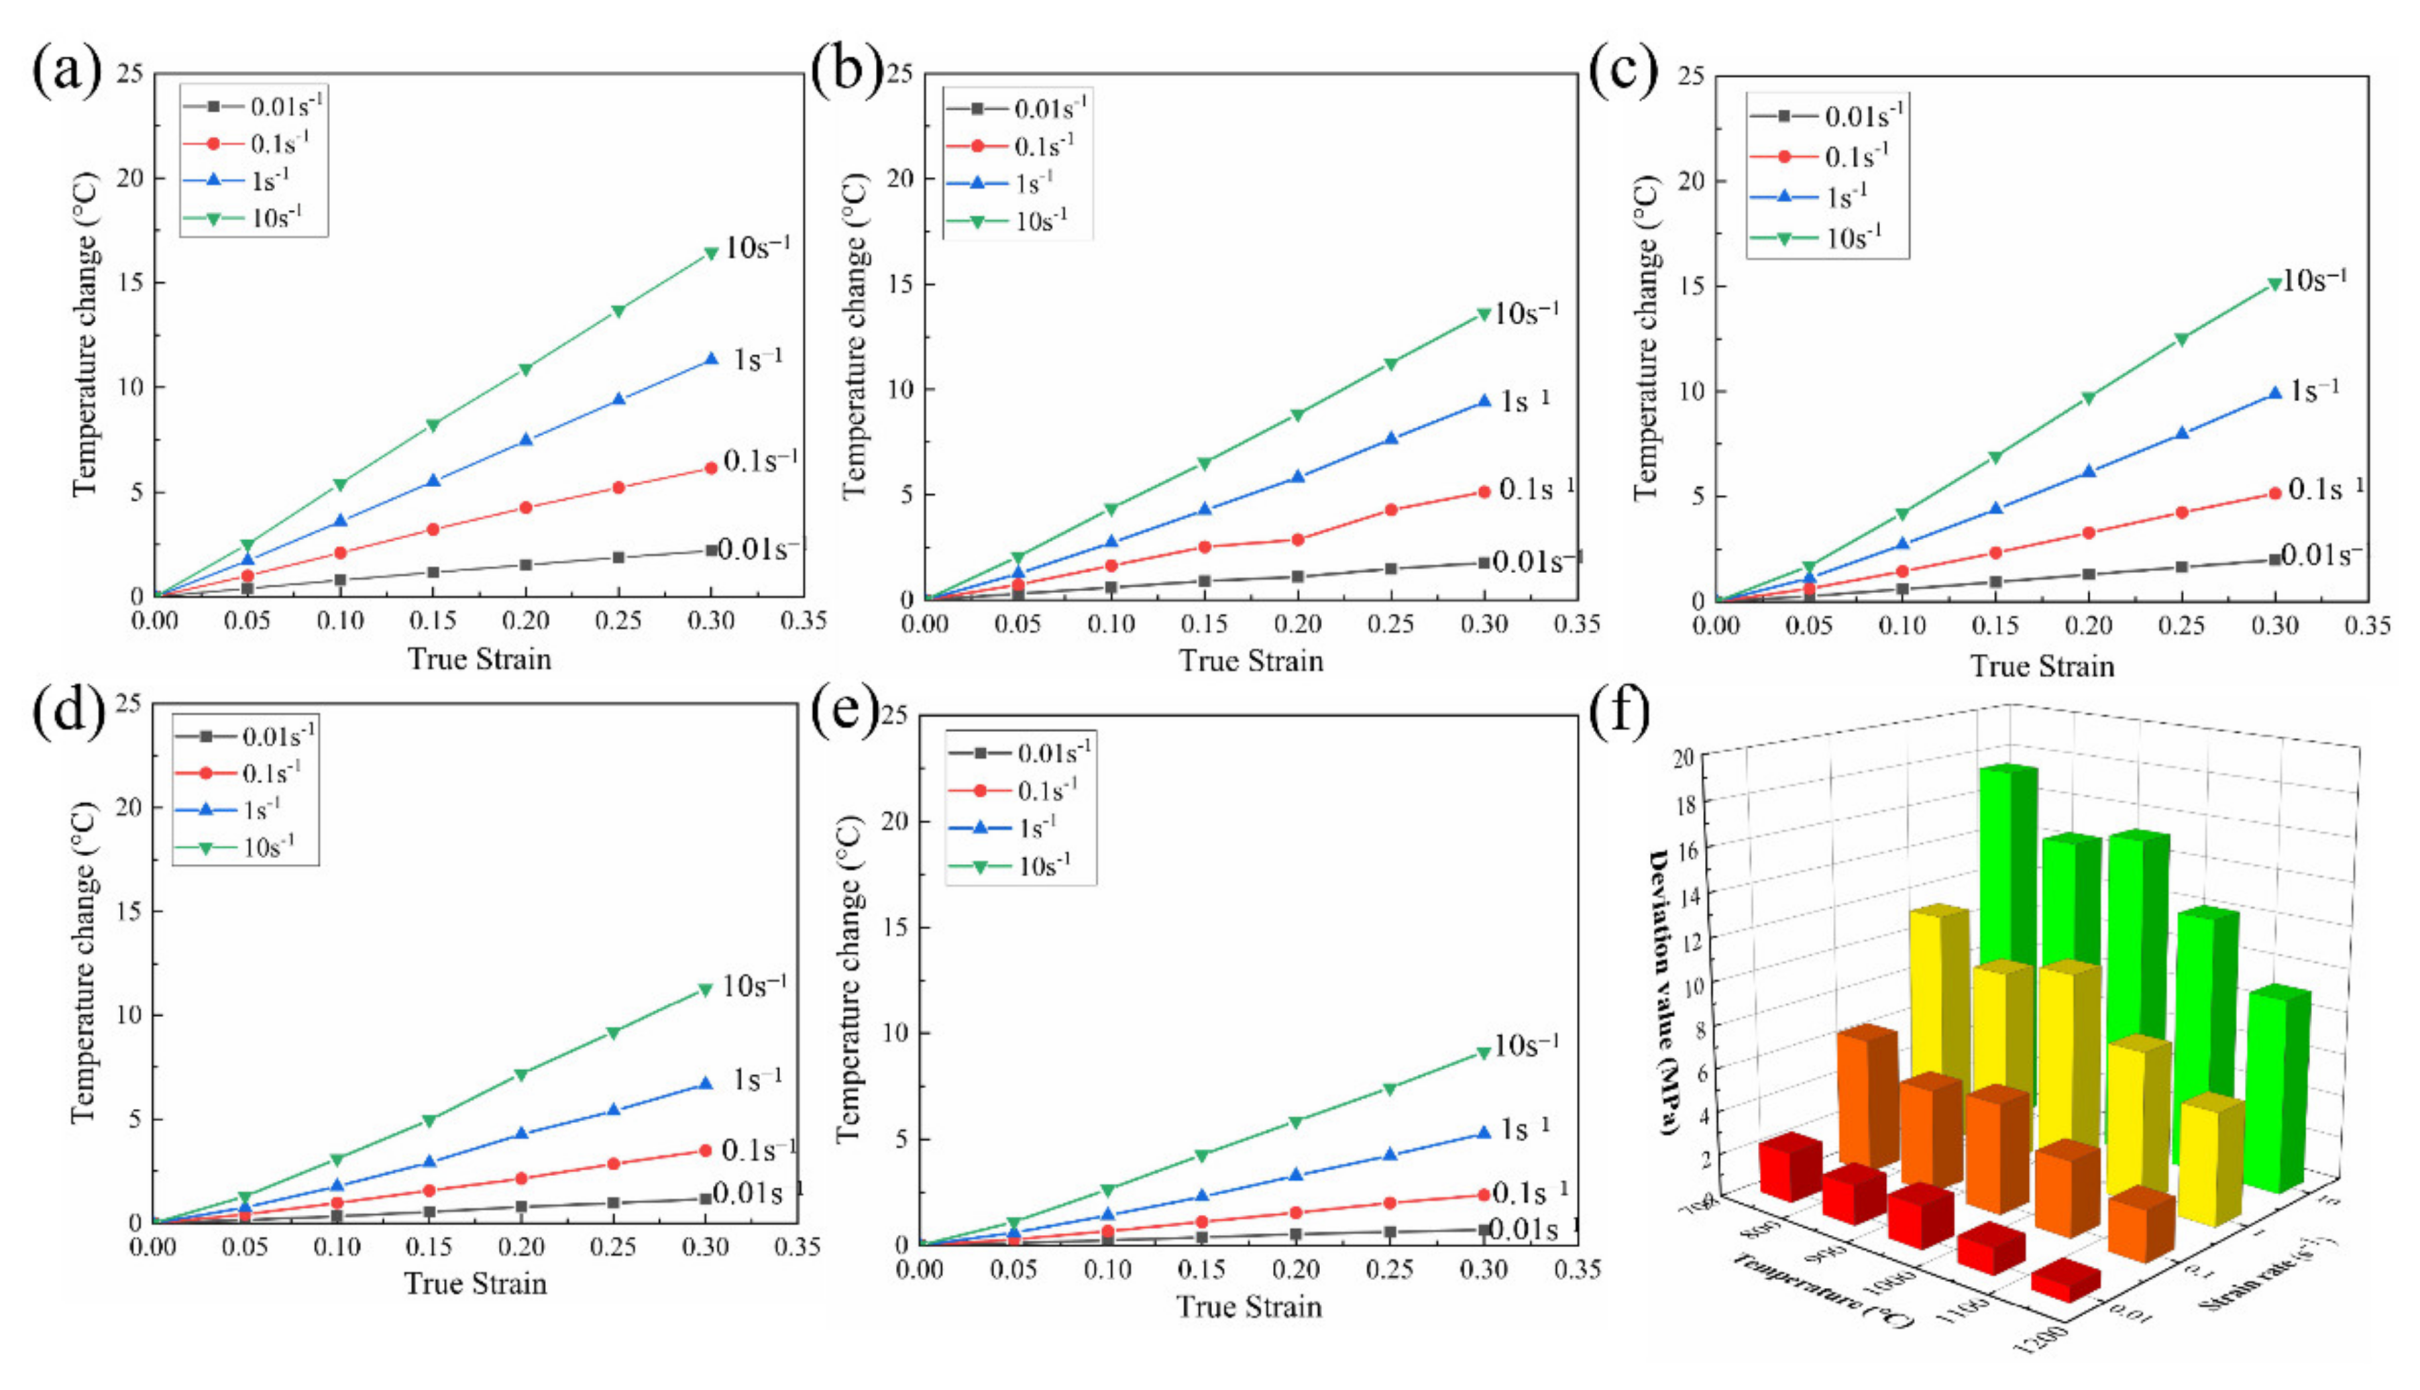
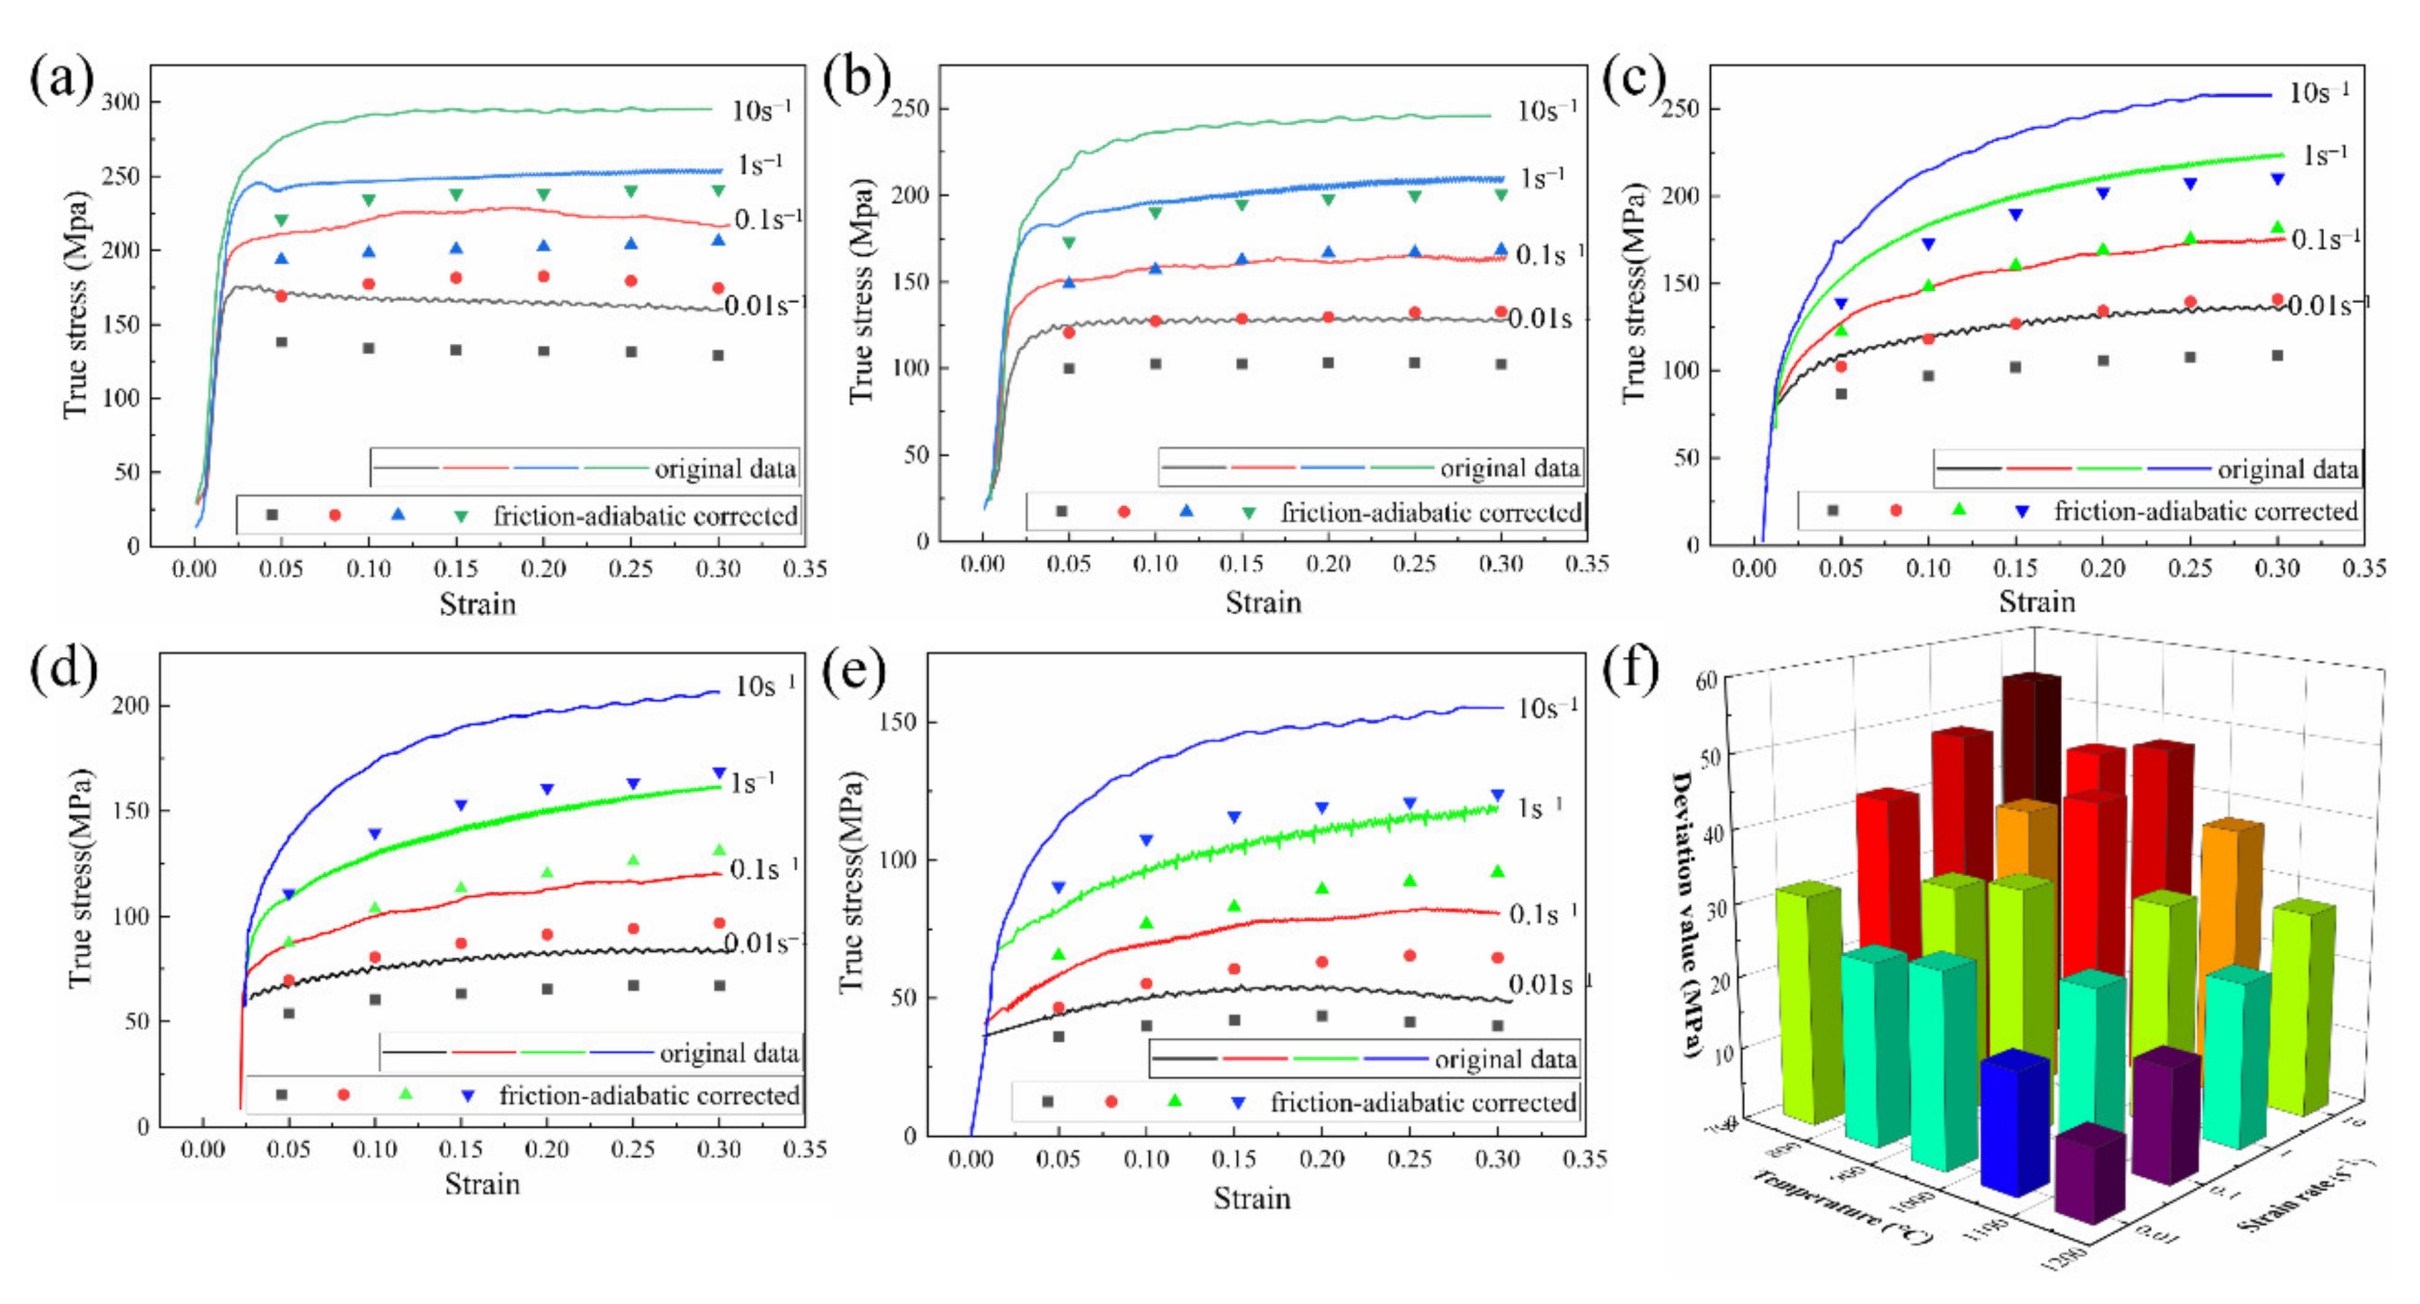
3.2. Stress Correction Model 1

Although graphite foils and tantalum foil spacers were adopted to reduce the friction of the specimen before the thermal simulation compression, a friction effect still exists under large amounts of deformation, which will inevitably hinder the radial flow of metal. This not only changed the uniaxial stress state of the specimen but also caused uneven deformation inside the material, which eventually led to the formation of the “bulging” phenomenon shown in Figure 4. The data acquisition system currently available for Gleeble provides the real stress–strain data obtained under ideal conditions (without considering the existence of friction), which causes the measured value to be higher than the real value. Therefore, it was necessary to make friction corrections for the flow stress values. The expansion coefficient B proposed by Roebuck et al. [14] was used as the basis for determining the need for friction correction, as shown in Equation (1). The meaning of the parameters represented in Equation (1) is shown in Table 2 [14,15].
B = h R M 2 h o R o 2
If, as in the case of B < 1.1, the difference between the real stress and the experimental value is very small, the experimental stress generally does not need to be corrected for friction. However, if B ≥ 1.1, the influence of friction on flow stress cannot be ignored, and friction correction is required [16,17]. According to the judgment mechanism, the B value under different deformation conditions was obtained, as shown in Table 3. It can be seen from Table 3 that all B values were greater than 1.1. Therefore, the obtained experimental stress values required correction for friction.
The friction-corrected values (σf) of F92 steel were calculated according to the friction correction formula summarized by Ebrahimi R. [18]; as shown in Equation (2):
σ f = σ o 2 m R h 2 2 exp 2 m R h 2 m R h 1
In the formula,
m = R / h b 4 / 3 2 b / 3 3
Δ R = R M R T
Δ h = h 0 h
b = 4 R M R T R h h 0 h
R = R 0 h 0 h
R T = 3 h 0 h R 0 2 2 R M 2
The flow stress of F92 steel during the deformation process rises to a peak value first with the dynamic softening effect (including dynamic recrystallization and even dynamic recovery), and then decreases to a relatively stable state. However, a part of the plastic deformation work that the steel undergoes during the hot compression process is converted into the internal energy of the system, and the heat generated by the deformation is not radiated from the sample in time; this temperature rise phenomenon is called temperature rise. To eliminate the influence of temperature rise on the stress of the specimens during the deformation process, the adiabatic correction was used to correct the flow stress of the F92 steel. The temperature rise value of the material can be expressed as in Equation (9). Figure 5 shows the influence of temperature rise changes at 0.3, and it was found that the trend of temperature rise decreased with the deformation temperature. The reason for these changes is that as the deformation temperature decreased, it led to an increase in the plastic deformation work required. In addition, a part of plastic deformation work was partially converted into temperature rise and the temperature rise effect was enhanced. The determination of the parameters used in the adiabatic correction model is shown in Table 4 [19].
Δ T = 0.95 γ ρ C P σ d ε Δ T = 0.95 γ σ ¯ Δ ε ρ C p
As temperature changes cause the real stress of the sample to deviate, it was necessary to perform adiabatic correction on the flow stress data obtained from the experiment. The relationship between the flow stress (σa) corrected by the adiabatic effect and the absolute temperature Δ T can be expressed as Equation (10) [19].
σ a = σ f Δ T d σ f d T ε ˙ , ε
The stress–strain curve after friction-adiabatic correction is shown in Figure 6. It can be seen from the figure that the stress values after friction-adiabatic-corrected stress were generally lower than those from the original data for different strain rates and deformation temperatures. In particular, when the deformation temperature was constant, the stress deviation between the two was more obvious with the strain rate. The stress deviation reached the maximum value of 54 MPa under the combined conditions of deformation temperature of 750 °C and strain rate of 10 s−1. The deformation resistance of steel increases with increasing deformation rate, meaning that the real stress value will be larger and more deformation heat will be generated. Additionally, a large amount of deformation heat is not dissipated quickly when deformation rates are large. These two facts generally lead to large error at high strain rates. When the temperature is constant, the difference of flow stress is positively correlated with the strain rate, and the change of flow stress decreases step by step with the increase of deformation temperature.

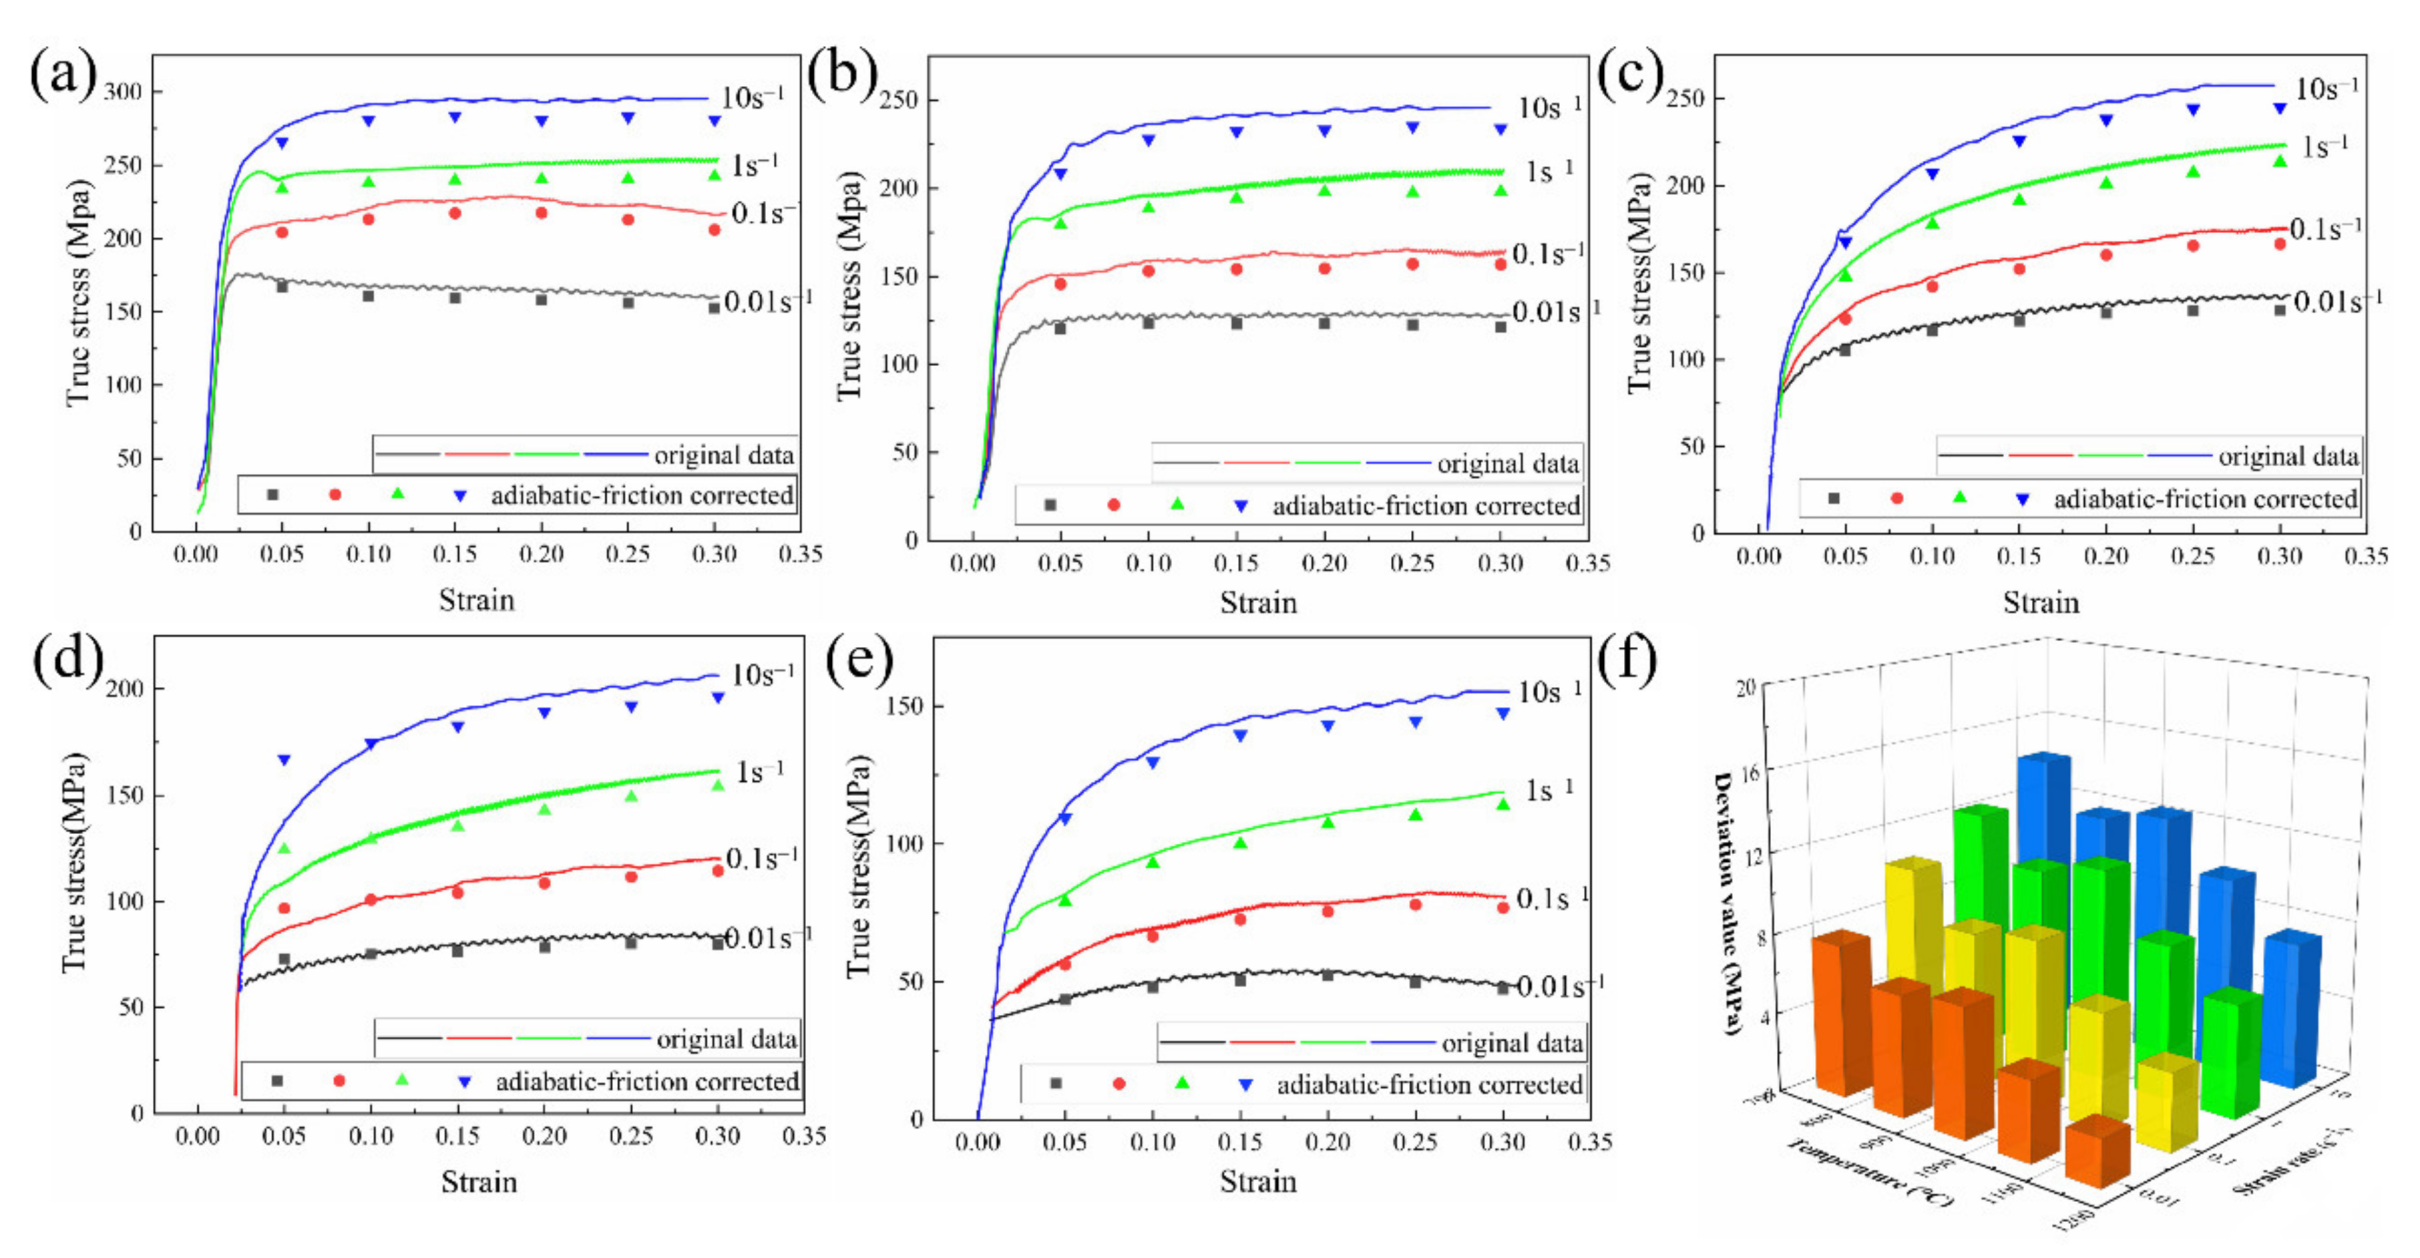
3.3. Stress Correction Model 2

To obtain more accurate true stresses with the help of the second model for stress correction, the original stress data should undergo adiabatic correction and friction correction [20]. As in the above analysis, adiabatic corrections are required due to temperature variations; we applied adiabatic correction in correction model 2 in order to distinguish it from correction model 1. The adiabatic correction used the following formula:
σ a = σ o e Q R 1 T D 1 T R
The meanings of the relevant parameters of Equation (11) are shown in Table 5. Step 1, the influence of different deformation degrees on the Q’ value, was almost negligible (note the similarities of the curves). Therefore, the Q’ value can be obtained by fitting the lnσ–1000/RT curve when the deformation is 0.3. Adiabatic correction stress can be obtained by combining the raw data and Equation (11). In step 2, the widely known Equation (12) is used to correct for the effect of friction on stress [21]; Equation (12) is as follows:
σ = σ T 1 + 2 3 3 × f × r o h o × exp 3 e 2
Since friction existed at the top and bottom of the specimens, the friction coefficient f in this study was taken to be 0.25; the meanings of the other relevant parameters in Equation (12) are shown in Table 5.
The friction-corrected stress was obtained by using the adiabatic-corrected stress as the input value of Equation (12). In step 3, the relationship between the original data and the adiabatic-friction-corrected stress at different temperatures was plotted as shown in Figure 7. Most of the corrected stresses were lower than those from the original data, but the deviation between the two was smaller than for model 1. The stress deviation also reached the maximum value under the combined conditions of deformation temperature of 750 °C and strain rate of 10 s−1, but the maximum value was 14 Mpa. The effect of deformation parameters on stress deviation was similar to that observed for model 1.

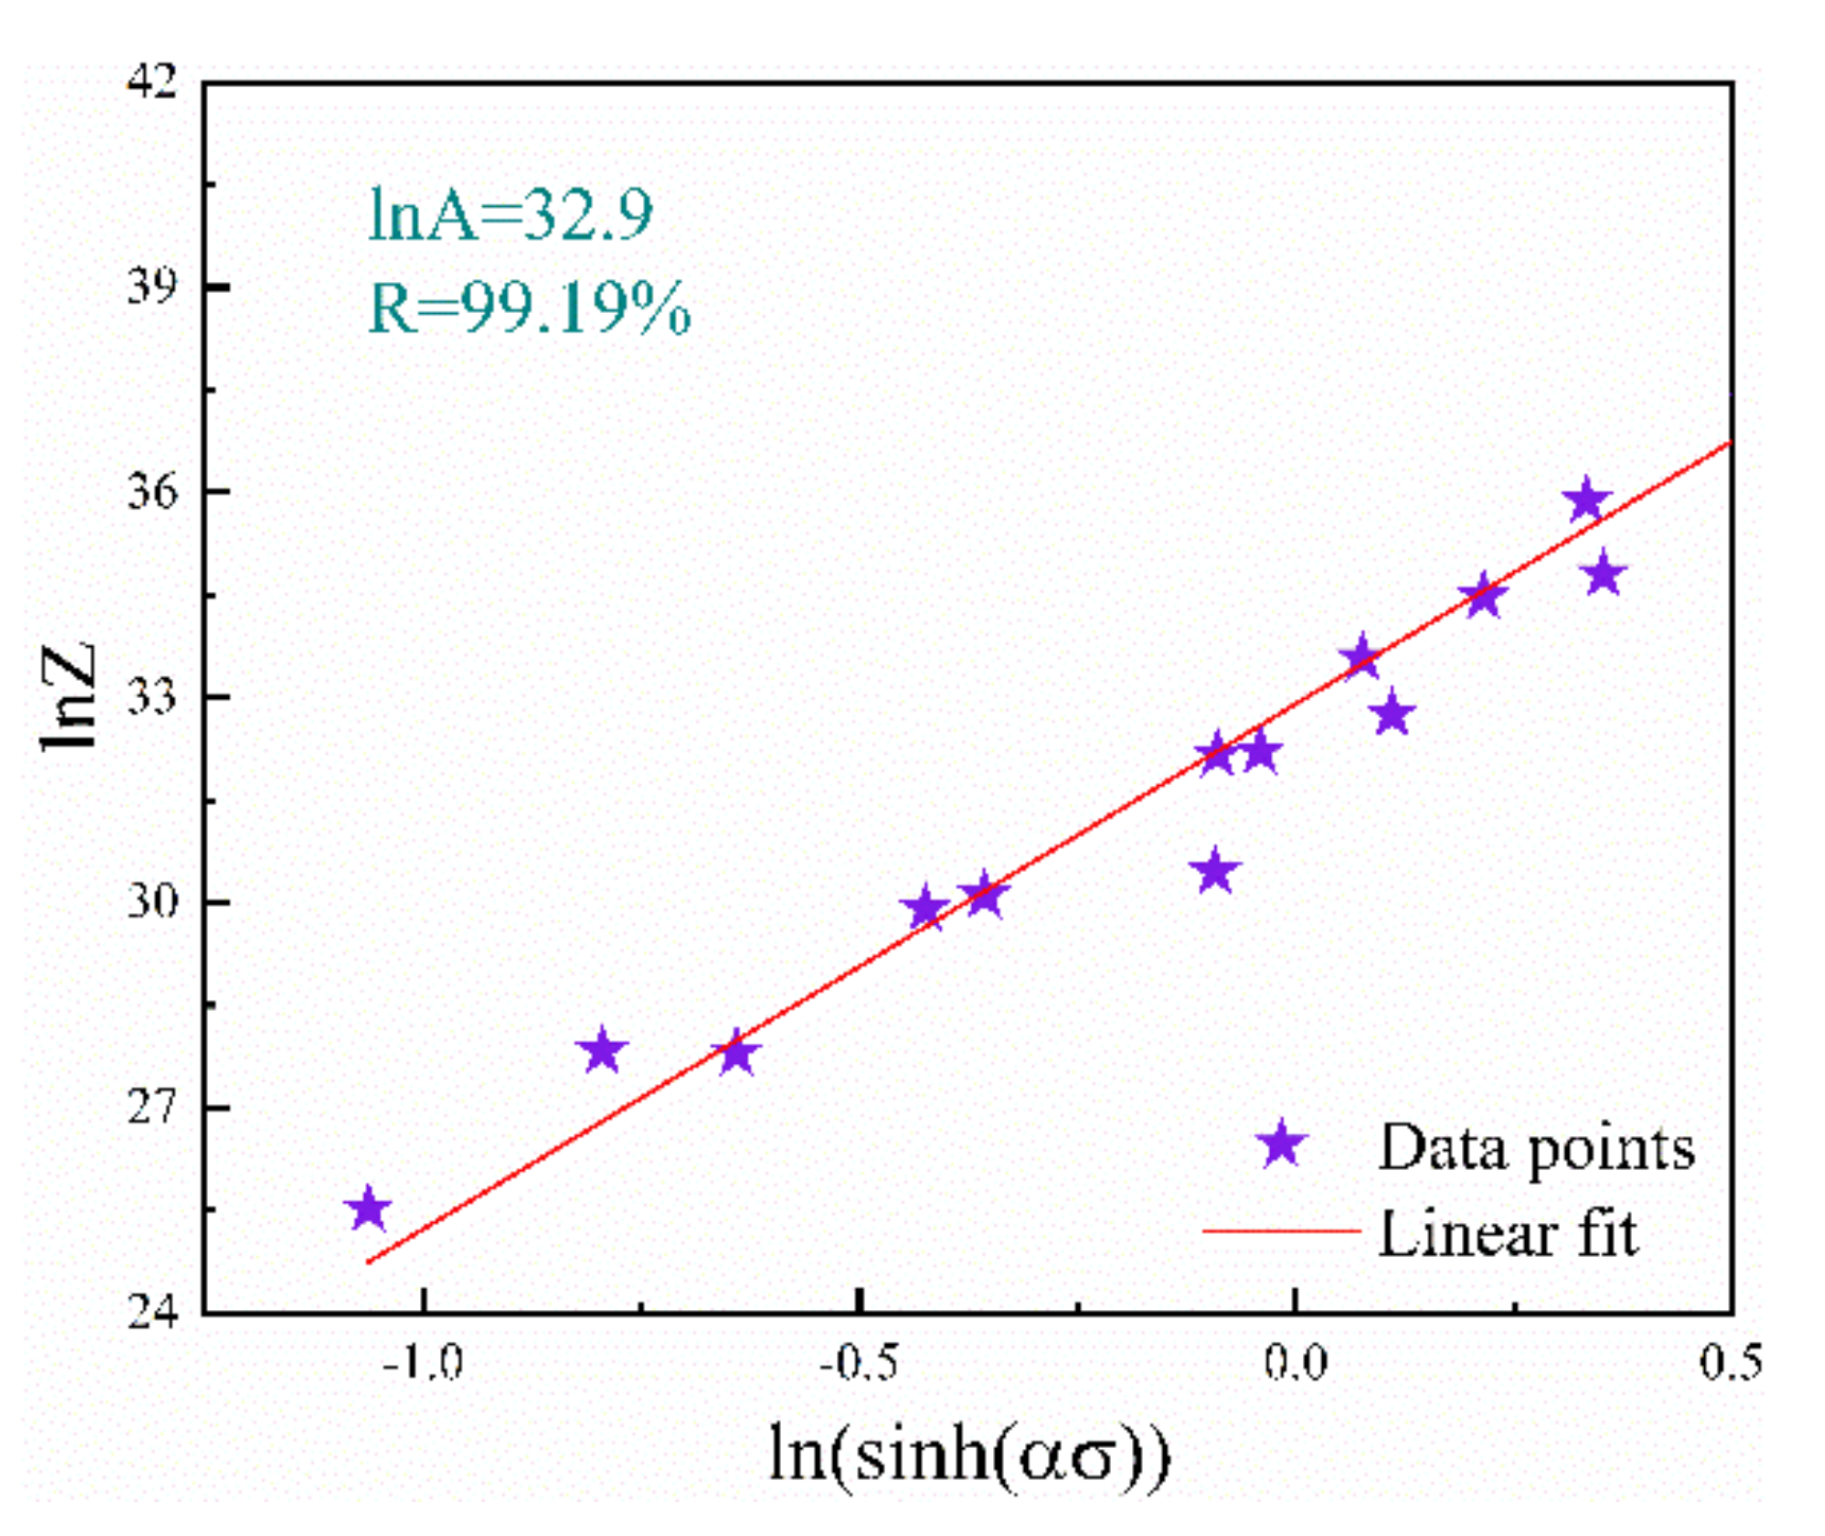
3.4. Arrhenius (AR) Model at Strain of 0.3

The classical Arrhenius hyperbolic sine function is widely used to describe the close relationship between the strain rate, temperature, and stress of metals and alloys during hot deformation. The common Arrhenius Equation [22] is as follows:
ε ˙ = A σ n exp Q R T
ε ˙ = A exp β σ exp Q R T
ε ˙ = A sinh α σ n exp Q R T
The meaning of the letters in the formula are shown in Table 6; the exponential function (suitable for ασ < 0.8), power function (suitable for βσ > 1.2), and hyperbolic sine function equation (suitable for all σ) respectively correspond to Equations (13)–(15). Equations (16) and (17) listed below were obtained by taking the natural logarithms of Equations (13) and (14), respectively.
ln ε ˙ = n 1 ln σ + ln A 1 Q R T
ln ε ˙ = β σ + ln A 2 Q R T
ln ε ˙ = n ln sinh α σ + ln A Q R T
The curve relationship between ln ε ˙ ln σ and ln ε ˙ σ can be obtained by linear regression of the least square method, as shown in Figure 8 and Figure 9. According to Equations (16) and (17), the average value of the slope of the fitting line is taken respectively to obtain the values of n1 = 11.695 and β = 0.091, and then the value obtained from the formula “α = n1/β” is 0.00779. Second, Equation (18) is obtained by taking the natural logarithm of Equation (15).
We can calculate the partial derivative of Equation (18) when the temperature and strain rate are constant to obtain Equations (19) and (20), respectively. The average value of the slope of the fitting line is taken again; as shown in Figure 9, the result is n = 8.435, S = 5.49. Thus, the activation energy Q = RnS = 384.58 kJ/mol.
n = ln sinh α σ ln ε ˙
Q = R n ln sinh α σ 1 / T
In Figure 10, the intercept of the ln Z ln sinh α σ calculated after linear fitting lnA = 32.9, it can be concluded that the natural logarithm of the stress hyperbolic sine term and the natural logarithm of the parameter Z of F92 stainless steel satisfy the linear relationship and can thus be summarized.
The material constants corresponding to the specific strain (when the strain is 0.05, 0.1, 0.15, 0.2, 0.25, 0.3) were calculated by selecting the same method from the process of strain 0.05~0.3. The parameter value was polynomial fitted with the true strain to build a constitutive model with a wider application scope. After repeated operations, a better fit was obtained when the fourth-order polynomial was finally selected. The trial-and-error method can reflect the change in the rule of the material constant and strain, because all data points are evenly distributed on the fitting curve. After all parameters were determined, the AR model as shown in Equation (21) was obtained [23].
σ = 1 α ln ε ˙ A exp Q R T 1 / n + ε ˙ A exp Q R T 2 / n + 1 1 / 2
The comparison between the predicted and adiabatic-friction-corrected values for F92 steel obtained with the help of the AR model is shown in Figure 11. The comprehensive analysis results shown in Figure 11 demonstrate that the AR model gives a good prediction for some combinations of strain rate and temperature, but it does not show high accuracy for partial combinations. Therefore, we introduced the results of average absolute relative error (AARE) and correlation coefficient (R) calculations, as shown in Equations (22) and (23); the aim was to understand the accuracy of the AR model in a deeper way. As can be seen from Figure 12, the AR model gave reasonable accuracy (R = 98.95% and AARE = 7.78%). Therefore, it can be determined that the AR model can be used to describe the flow stress behavior of F92 stainless steel with a high degree of credibility.
R = i = 1 N E i E ¯ P i P ¯ i = 1 N E i E ¯ 2 i = 1 N P i P ¯ 2
A A R E = 1 N i = 1 N E i P i E i × 100

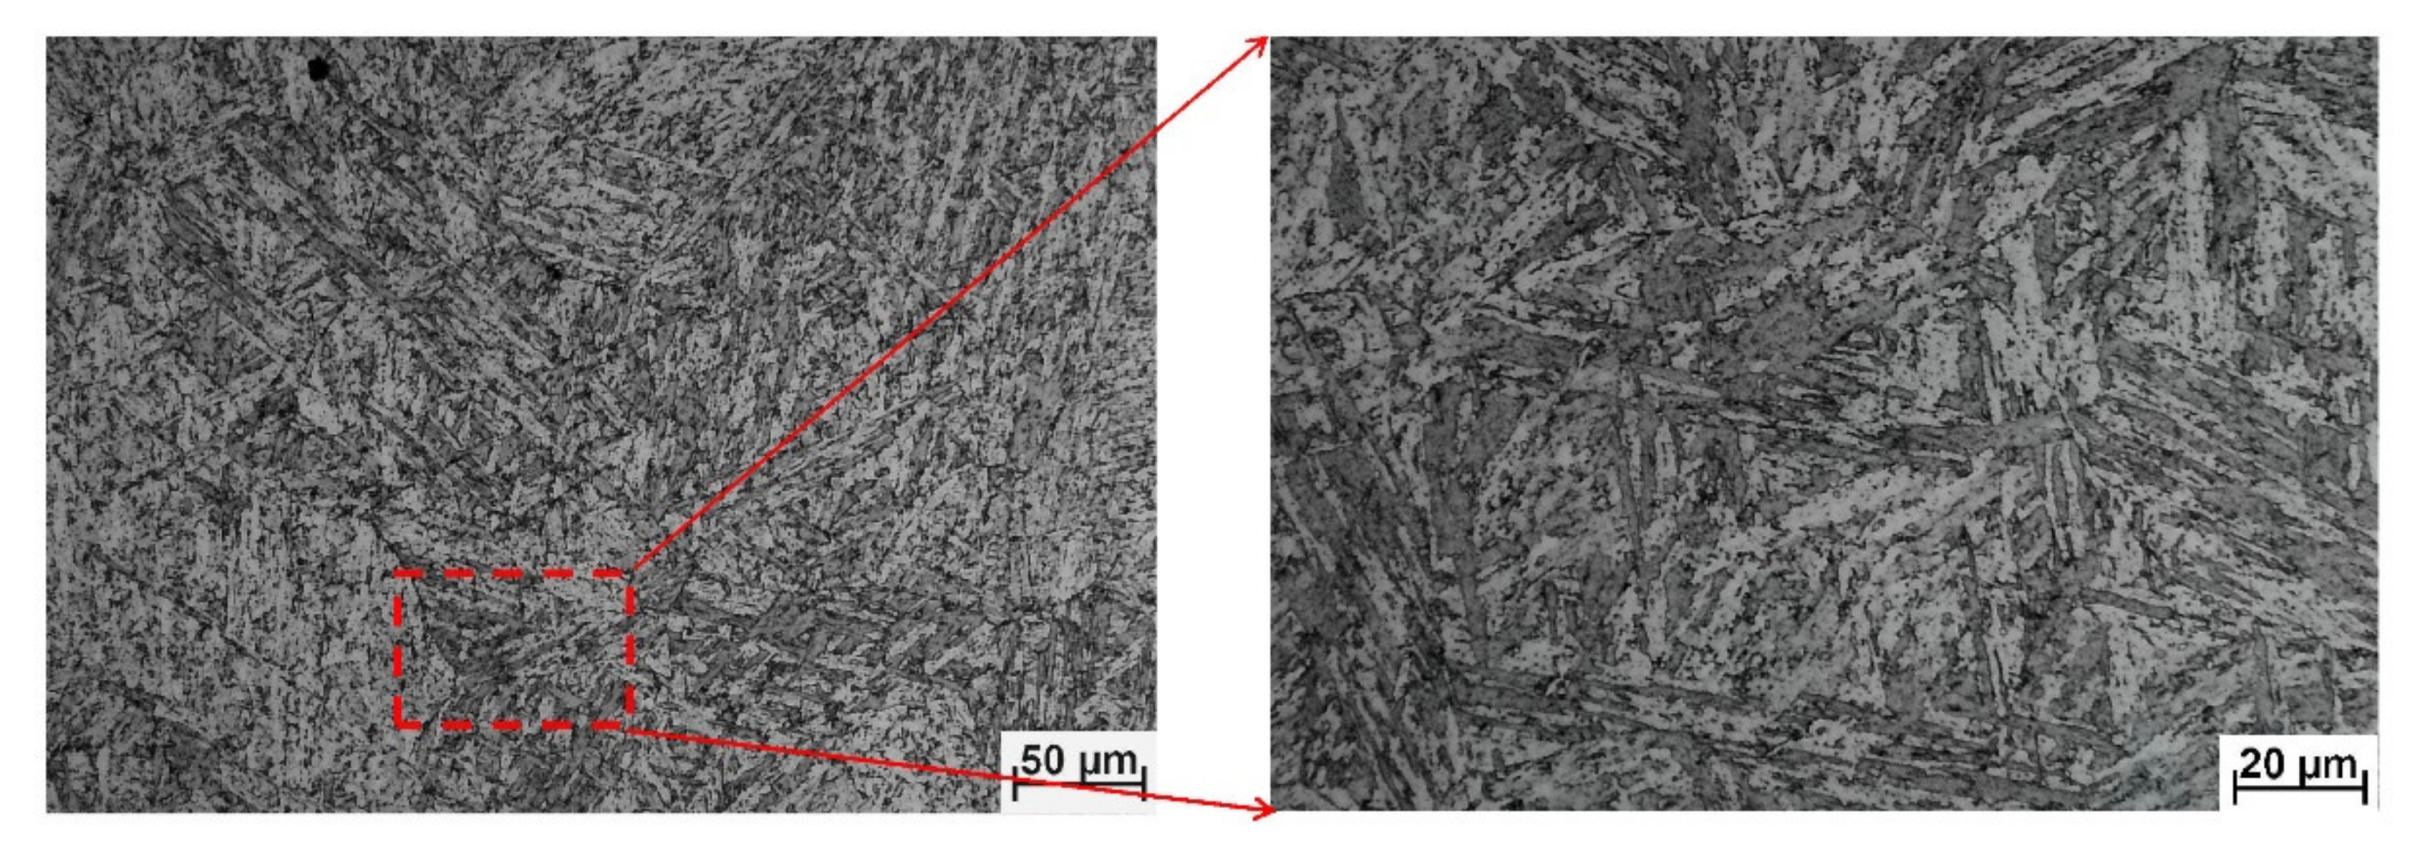
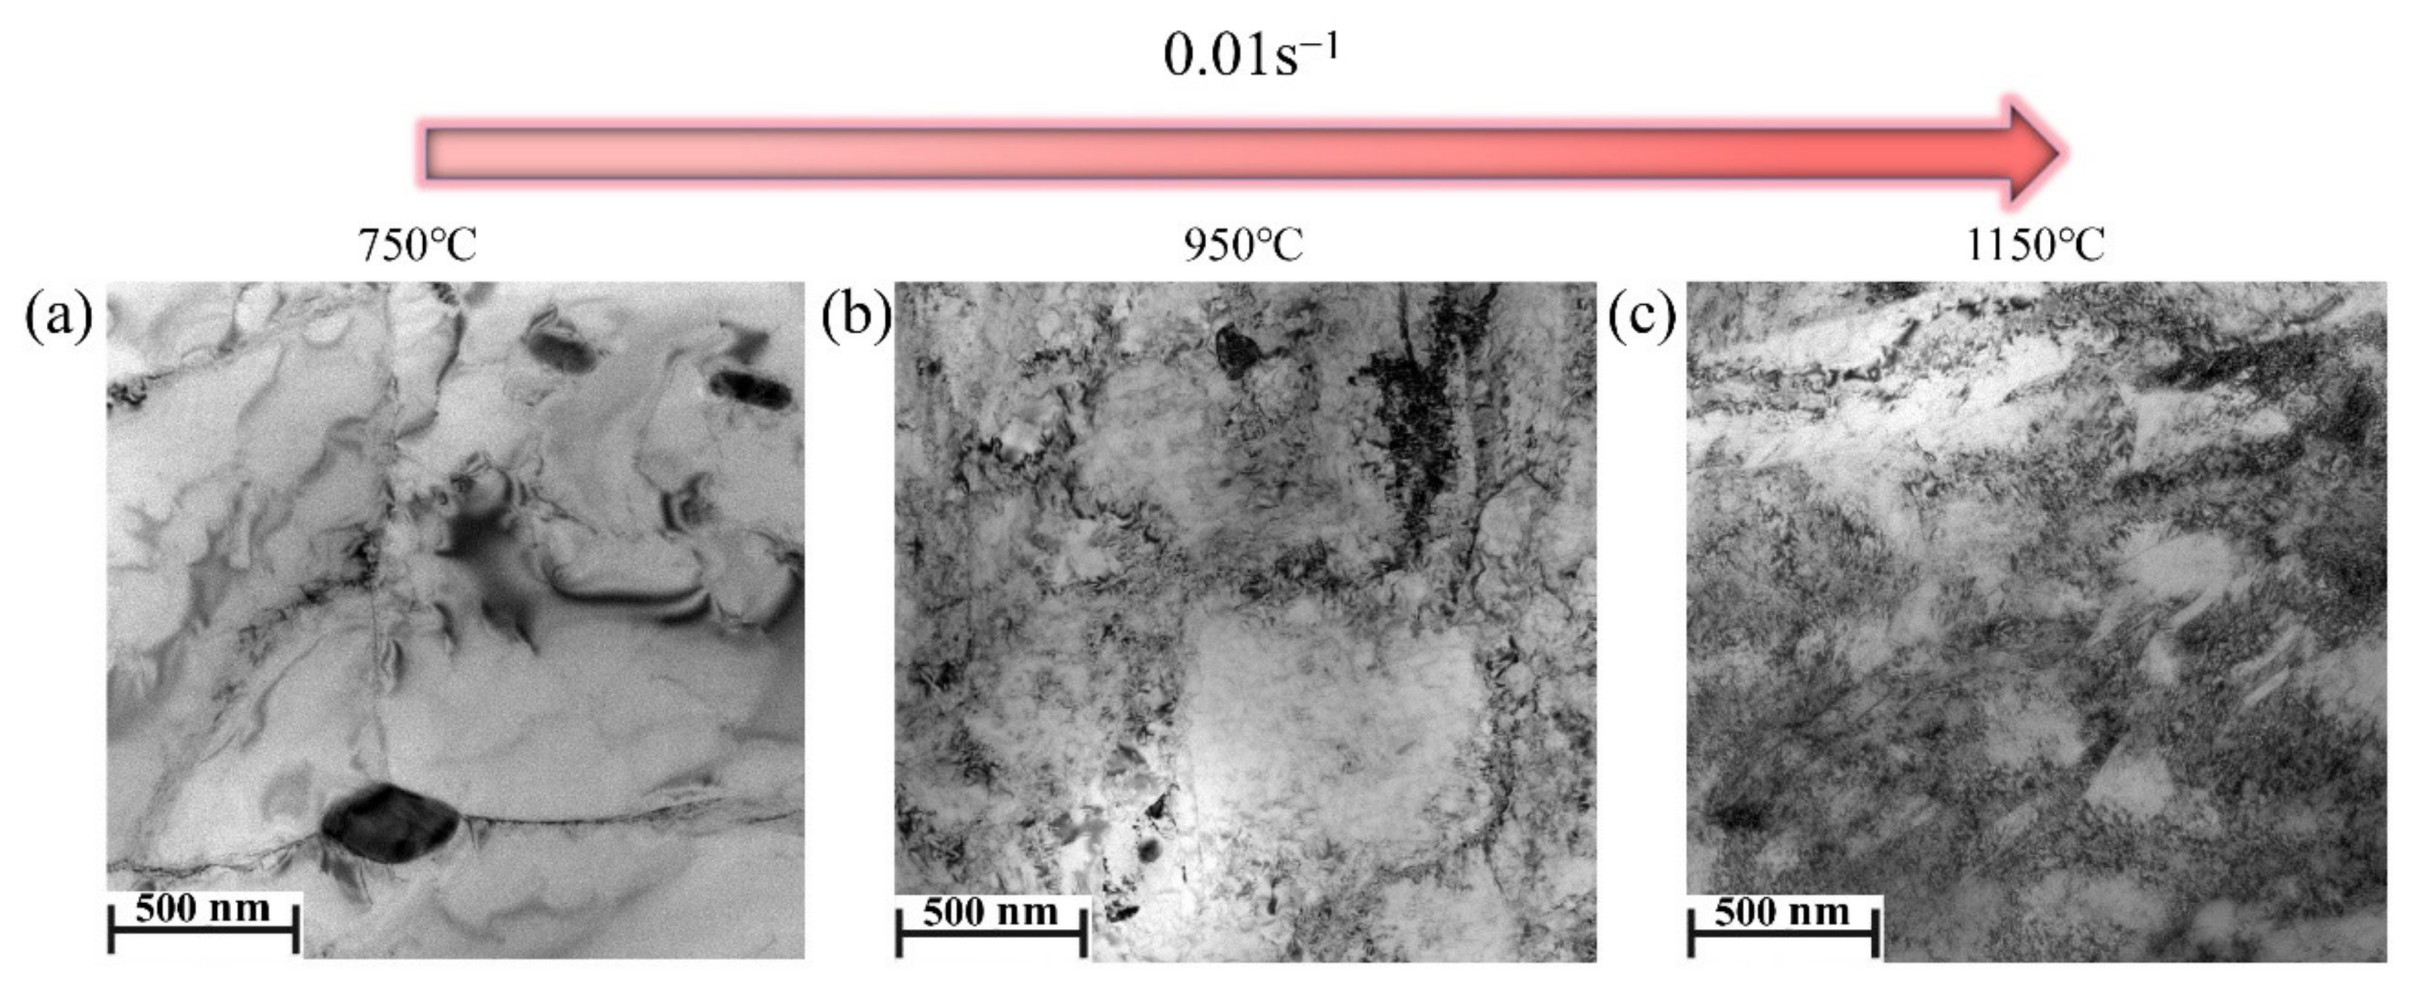
3.5. Microstructure Evolution

Transmission Electron Microscope (TEM) images of F92 steel at three different temperatures are shown in Figure 13 (when the strain was 0.01 s−1). At a temperature of 750 °C and strain rate of 0.01 s−1, the martensitic structure after high-temperature compression was severely deformed. This deformation was elongated along the flow direction and gradually distributed as a “necklace”. A few small recrystallized grains were observed at the flattened austenite grain boundaries, which was attributed to the large deformation resulting in sufficient deformation energy inside the structure accompanied by the slow formation of dynamic recrystallization due to the lower temperature, meaning that no obvious dynamic recrystallization grains were seen. As the temperature rose, we observed that the complete dynamic recrystallization phenomenon occurred as shown in Figure 13b,c, which was consistent with the regularity exhibited by the stress–strain curve shown in Figure 3.
The low strain rate was equivalent to prolonging the deformation time, resulting in the recrystallized grains taking a long time to nucleate and grow, so the size of the recrystallized grains in Figure 13b,c was larger. The vignette effect occurred when the temperature increased to 1150 °C. At this higher deformation temperature, part of the abnormal lath martensite was caused by the irregular austenite grains produced by grain boundary sliding [24,25], leading to cracking of the specimen during deformation. Therefore, a temperature of 1150 °C should be avoided in the selection of hot deformation parameters. Finally, according to the number and size of recrystallized grains, it can be basically determined that the optimal hot working zone of F92 steel is the combination of deformation temperature of 850 °C~1050 °C and strain rate of 0.1 s−1.

4. Conclusions

This study mainly focused on the hot deformation behavior of F92 steel under different parameters. First, to determine the truest stress, two noninterfering stress correction models ((i): friction-adiabatic correction and (ii): adiabatic-friction correction) were used. Next, the modified model 2 was used as the input value of the AR model and microstructure characterization was applied to analyze the high-temperature flow behavior of F92 steel. The conclusions were as follows:
The temperature rise phenomenon of F92 steel (model 1) gradually weakens with increasing temperature (or decreasing strain rate), reaching a maximum value of about 17 °C at the combination of 750 °C and 10 s−1. The difference range of stress after correction by model 1 was 7~53 Mpa, while the range of model 2 was 2~14 Mpa. Furthermore, the change trend of the stress difference was similar in the two models. It was found that the error of model 2 was smaller after comparing the two stress correction models, because the correction of model 2 was based on the temperature of the thermocouple. Moreover, the effect of true deformation was also considered in the friction phase. As the input value of the AR model, the prediction error of the AR model for the hot deformation behavior of F92 steel was significantly reduced from the original 12.5% to the current 7.78%. Therefore, it can be judged that F92 steel stress correction can improve the prediction ability of the AR model for high-temperature flow behavior. The optimal hot working parameters for F92 steel are a deformation temperature of 850 °C to 1050 °C and strain rate of 0.1 s−1, as predicted by the microstructure characterization.

Author Contributions

Writing—review and editing, J.L.; Formal Analysis, R.Y.; Software, G.X.; Funding Acquisition, C.C.; Supervision, Y.H.; Investigation, L.S.; Resources, H.Z. All authors have read and agreed to the published version of the manuscript.

Funding

The author expresses sincere gratitude for the support accepted from the National Natural Science Foundation of China (No. 51805002), a project supported by the Research Fund of Key Laboratory of advanced metal material green preparation and surface technology (AHUT), Ministry of Education, China (Grant No. GFST2020KF03), and for the support given by the Jiangsu Province and Anhui Province Postdoctoral Funds (Grant No. 2019K208 and No. 2019B343).

Institutional Review Board Statement

Not applicable.

Informed Consent Statement

Not applicable.

Data Availability Statement

The data used to support the finding of this study are available from the corresponding author upon request.

Conflicts of Interest

All participating authors announce no conflict of interest in this work. We solemnly declare no existing conflicts of interest, such as commercial or affiliated interests, with the submitted work.

References

  1. Wu, Z.; Zhang, X.; Song, X.; Ma, C.; Qi, Y.; Chen, X. Microstructure and properties of welded joint for T92 ferritic heat resistant steel. J. Alloys Compd. 2017, 140523. [Google Scholar] [CrossRef]
  2. Pandey, C.; Mahapatra, M.M.; Kumar, P.; Thakre, J.; Saini, N. Role of evolving microstructure on the mechanical behaviour of P92 steel welded joint in as-welded and post weld heat treated state. J. Mater. Process. Technol. 2019, 263, 241–255. [Google Scholar] [CrossRef]
  3. Yang, S.D. Research on the F91 valve body’s material welding process. Power Stn. Aux. Equip. 2015, 36, 41–45. [Google Scholar]
  4. Chen, Z.M. Heat treatment of F91 steel and A691gr.1-1/4crcl22 steel pipe welded joint. Welded Pipe Tube 2020, 43, 40–43+48. [Google Scholar]
  5. Paddea, S.; Francis, J.A.; Paradowaska, A.M.; Bouchard, P.; Shibli, I. Residual Stress Distribution in P91 Steel-Pipe Girth Weld Before and After Post-weld Heat Treatment. J. Mater. Sci. Eng. A 2012, 534, 663–672. [Google Scholar] [CrossRef]
  6. Ennis, P.J.; Czyrska-Filemonowicz, A. Recent advances in creep-resistant steels for power plant applications. Sadhana 2003, 28, 709–730. [Google Scholar] [CrossRef]
  7. Abson, D.J.; Rothwell, J.S. Review of type IV cracking of weldments in 9–12% Cr creep strength enhanced ferritic steels. Int. Mater. Rev. 2013, 58, 437–473. [Google Scholar] [CrossRef]
  8. Pandey, C.; Giri, A.; Mahapatra, M.M. Effect of normalizing temperature on microstructural stability and mechanical properties of creep strength enhanced ferritic P91 steel. Mater. Sci. Eng. A 2016, 657, 173–184. [Google Scholar] [CrossRef]
  9. Onoro, J. Martensite microstructure of 9–12% Cr steels weld metals. J. Mater. Process. Technol. 2006, 180, 137–142. [Google Scholar] [CrossRef]
  10. Zhang, J.; Jiang, C.X.; Qiao, B.W. Study on the deformation behavior and constitutive equation of 14Cr17Ni2 steel. Hot Work. Technol. 2018, 47, 38–43. [Google Scholar]
  11. Wang, M.H.; Chen, M.L.; Wang, R.; Wang, G.T. High-temperature flow stress model and hot working diagram of 2Cr12NiMo1W1V supercritical steel. J. Cent. South Univ. 2016, 47, 741–748. [Google Scholar]
  12. Ma, Y.F. Study on Hot Deformation Behavior of 17-4PH Stainless Steel; Jiangsu University: Zhenjiang, China, 2017. [Google Scholar]
  13. Pei, W.J.; Guo, X.Z.; Wang, W.T.; Tao, J. High-Temperature flow Behavior of 316L austenitic stainless steel. J. Plas. Eng. 2014, 21, 104–110. [Google Scholar]
  14. Roebuck, B.; Loveday, M.S.; Chastel, Y.; Fiorucci, G.; dal Negro, T. Measurement of flow stress at high temperature in solid torsion tests. Mater. High Temp. 2006, 23, 119–144. [Google Scholar] [CrossRef]
  15. Obiko, J. Friction correction of flow stress-strain curve in the upsetting process. IOP SciNotes 2021, 2, 014401. [Google Scholar] [CrossRef]
  16. Wan, Z.P.; Wang, T.; Li, Z.; Li, P.H.; Zhang, Y.; Sun, Y.; Hu, L.X. Effect of adiabatic heating and friction effect on flow stress of alloy during hot compression deformation. J. Plas. Eng. 2020, 27, 166–171. [Google Scholar]
  17. Xue, X.W.; Wang, C.X.; Li, Y.; Han, S.; Liu, S.Z.; Yuan, W.H. High temperature plastic deformation behavior of as-cast 300M steel based on friction correction. In Key Engineering Materials; Trans Tech Publications Ltd.: Bäch, Switzerland, 2019. [Google Scholar]
  18. Ebrahimi, R.; Najafizadeh, A. A new method for evaluation of friction in bulk metal forming. J. Mater. Process. Technol. 2004, 15, 136–143. [Google Scholar] [CrossRef]
  19. Cao, Y. Study on Microstructure Evolution and Mechanical Properties of Incoloy 800H Alloy during Hot Working; Northeast University: Boston, MA, USA, 2016. [Google Scholar]
  20. Churyumov, A.Y.; Khomutov, M.G.; Tsar’Kov, A.A.; Pozdnyakov, A.V.; Solonin, A.N.; Efimov, V.M.; Mukhanov, E.L. Study of the structure and mechanical properties of corrosion-resistant steel with a high concentration of boron at elevated temperatures. Phys. Met. Metallogr. 2014, 115, 809–813. [Google Scholar] [CrossRef]
  21. Evans, R.W.; Scharning, P.J. Axisymmetric compression test and hot working properties of alloys. Mater. Sci. Technol. 2001, 17, 995–1004. [Google Scholar] [CrossRef]
  22. Baktash, R.; Mirzadeh, H. A simple constitutive model for prediction of single-peak flow curves under hot working conditions. J. Eng. Mater. Technol. 2016, 138, 021004. [Google Scholar] [CrossRef]
  23. Chen, X.; Liao, Q.; Niu, Y.; Jia, W.; Le, Q.; Cheng, C.; Yu, F.; Cui, J. A constitutive relation of AZ80 magnesium alloy during hot deformation based on Arrhenius and Johnson–Cook model. J. Mater. Res. Technol. 2019, 8, 1859–1869. [Google Scholar] [CrossRef]
  24. Samantaray, D.; Mandal, S.; Bhaduri, A.K. Characterization of deformation instability in modified 9Cr–1Mo steel during thermo-mechanical processing. Mater. Des. 2011, 32, 716–722. [Google Scholar] [CrossRef]
  25. Rao, K.P.; Prasad, Y.V.; Suresh, K.; Hort, N.; Kainer, K.U. Hot deformation behavior of Mg–2Sn–2Ca alloy in as-cast condition and after homogenization. Mater. Sci. Eng. A 2012, 552, 444–450. [Google Scholar] [CrossRef]
Figure 1. As-received micrograph of F92 steel.
Metals 12 00698 g001
Figure 2. The diagram of the thermal simulation compression experiment process.
Metals 12 00698 g002
Figure 3. True stress–strain diagram for different strain variables at 950 °C: (a) 0.3, (b) 0.5, (c) 0.7.
Metals 12 00698 g003
Figure 4. Schematic diagram of F92 steel at a strain of 0.5.
Metals 12 00698 g004
Figure 5. Temperature variation of F92 steel (0.3) at different temperatures: (a) 750 °C, (b) 850 °C, (c) 950 °C, (d) 1050 °C, (e) 1150 °C; (f) temperature deviation chart.
Metals 12 00698 g005
Figure 6. Original stress and friction-adiabatic-corrected stress (0.3) at different temperatures: (a) 750 °C, (b) 850 °C, (c) 950 °C, (d) 1050 °C, (e) 1150 °C; (f) stress deviation chart.
Metals 12 00698 g006
Figure 7. Original stress and adiabatic-friction-corrected stress (0.3) at different temperatures: (a) 750 °C, (b) 850 °C, (c) 950 °C, (d) 1050 °C, (e) 1150 °C; (f) stress deviation chart.
Metals 12 00698 g007
Figure 8. The relationship between ln ε ˙ ln σ and ln ε ˙ σ as the strain is 0.3.
Metals 12 00698 g008
Figure 9. The relationship between ln ε ˙ ln σ and ln(sinh(ασ))—1000/T as the strain is 0.3.
Metals 12 00698 g009
Figure 10. The relationship between flow stress and Z parameter.
Metals 12 00698 g010
Figure 11. Comparison of predicted and corrected stress at different temperatures: (a) 750 °C, (b) 850 °C, (c) 950 °C, (d) 1050 °C, (e) 1150 °C; (f) linear correlation.
Metals 12 00698 g011
Figure 12. The average absolute relative error (AARE).
Metals 12 00698 g012
Figure 13. TEM images at different deformation temperatures: (a) 750 °C, (b) 950 °C, (c) 1150 °C.
Metals 12 00698 g013
Table 1. Chemical composition (wt. %) of F92 steel.
CSiMnPSVNiCrMoAlCuWB
0.120.30.440.010.0020.230.148.650.460.0070.0821.780.003
Table 2. Parameter table of friction correction [14,15].
SymbolDefinitionUnit
Roradius before strain ratemm
hoheight before strain rate
hheight after strain rate
RMradius after strain rate
Table 3. Expansion coefficient B of F92 steel under different deformation conditions.
Strain Rate(s−1)Deformation Temperature (°C)
250300350400450
0.0011.121.171.131.111.13
0.011.141.211.181.151.11
0.11.111.181.141.121.15
11.161.161.111.171.12
101.121.121.191.181.11
Table 4. Parameter table of adiabatic correction.
SymbolDefinitionUnitNumerical Value
Cpspecific heat capacityJ/(g*K)0.5
∫σdεmechanical power
εstrain interval 0.3/0.5/0.7
σ ¯ average stressMPa
ρdensity of experimental materialsg/cm37.75
Ttemperature rise
γadiabatic factor 0 (0.001 s−1), 0.25 (0.01 s−1), 0.5 (0.1 s−1), 0.75 (1 s−1), 1(10 s−1)
Table 5. Meaning of stress correction parameters.
SymbolDefinitionUnitNumerical Value
σaAdiabatic-corrected stressMpa
σoorigin stressMpa
Q’constant coefficientJ/mol23
Runiversal gas constantJ/(mol × K)8.5
TDdeformation temperatureK
TRThermocouple temperatureK
ffriction coefficient 0.25
rooriginal radiusmm4
hooriginal heightmm12
etrue deformation
Table 6. Meaning of letters.
SymbolDefinitionUnit
εstrain rates−1
σflow stressMPa
Qdeformation activation energyJ/mol
Tabsolute temperatureK
Rmolar gas constant8.31 J/(mol*K)
Astructural factormaterial constant
αstress level parameters
nstress index
Publisher’s Note: MDPI stays neutral with regard to jurisdictional claims in published maps and institutional affiliations.

