Article

Thermodynamic Analysis and Experimental Study of Masked Corrosion Protection of 304 Stainless Steel Processed with Nanosecond Pulsed Laser

1
School of Materials Science and Engineering, Jiamusi University, Jiamusi 154007, China
2
School of Mechanical Engineering, Jiamusi University, Jiamusi 154007, China
3
Institute of Manufacturing Engineering, Huaqiao University, Xiamen 361000, China
*
Authors to whom correspondence should be addressed.
Metals 2022, 12(5), 749; https://doi.org/10.3390/met12050749
Submission received: 18 March 2022 / Revised: 19 April 2022 / Accepted: 23 April 2022 / Published: 27 April 2022

Abstract

:
A three-dimensional finite element model of nanosecond pulsed laser processing is developed, given the variation of thermal physical parameters with temperature during the laser processing of metallic materials. The effect of process parameters on the temperature field is analyzed by simulating the temperature field of 304 stainless steel processed by nanosecond lasers. Temperature is the most sensitive to repetition frequency. The effects of power, spot diameter, scanning speed, and scan line spacing on temperature decrease successively. The quantitative analysis of the relationship between processing parameters and temperature provides a basis for the corrosion-resistant mask processing parameters on the surface of 304 stainless steel. The applicable laser processing parameters are given according to the results of the orthogonal simulation experiments; the masks and experimental studies on corrosion resistance are carried out. Experimental results show that the corrosion potential of the mask increased by a maximum of 326 mV and the corrosion current decreased by a maximum of 479 nA/cm2 in the passivation electrolyte. Localized electrolysis of the material surface is carried out using the mask provided by the corrosion-resistant surface, and thus the micro-patterns of more complex shapes are processed. This study offers a new path for the micro electrolytic processing mask process.

1. Introduction

In recent years, due to its unique properties such as high precision, high controllability, low cost, and a slight heat-affected zone, laser processing is widely used in processing technologies such as precision cutting, drilling, etching, welding, and heat treatment of metals, non-metals, and various composite materials. In particular, as short-pulse micro machining has minimal spot diameter and can form special functional surfaces such as corrosion resistance and self-cleaning under rapid heating and cooling conditions, the study of the properties and principles of the surfaces produced by short-pulse laser micromachining has received increasingly widespread attention [1,2,3]. Since the surface microstructure morphology, microstructure, dimensional accuracy, and mechanical properties are all affected by the pulsed laser processing parameters, many scholars have worked on the influence of process parameters on thermal behavior [4,5,6,7], the mechanism of lattice defects, nanocrystallization or amorphization resulting from surface stress [8], surface wear [9,10], and melting and recondensation due to short pulse laser action [11,12,13]. The width of the femtosecond pulsed laser is shorter than the electron-ion energy transfer time and heat conduction time in the sample lattice, and the heat-affected zone is negligible, offering higher accuracy and sensitivity. However, there is no substitute for nanosecond fiber lasers in industrial manufacturing due to their low cost, high efficiency, reliability, and stability [14]. Recently, scholars have delved into the relationship between laser processing parameters and surface micro-nano structures and analyzed the reasons for their specific functions. However, most proposed thermodynamic models assume that the thermal physical parameters do not vary with temperature in order to simplify calculations. Therefore, it is important to consider the phase transition and the variation of thermal properties with temperature and construct a thermodynamic analysis model. This model can be used to reveal the ablation and heat transfer mechanisms of nanosecond lasers. It has important implications for the preparation of micro and nanostructured surfaces with functions such as corrosion resistance and self-cleaning [15,16,17].
Due to the large number of laser processing parameters, many scholars tend to study the effect of individual variables on the temperature field [7,18,19]. The effect of multiple processing variables acting together on the temperature field is considered in this paper, and three-dimensional micropatterns are processed based on the analysis of corrosion resistance.
Taking full account of the variation of thermal physical parameters with temperature, the paper develops a three-dimensional finite element thermodynamic analysis model of the nanosecond pulsed laser for the construction of micro and nano structures on the surface of 304 stainless steel. By designing orthogonal experiments for five processing variables in laser processing, the degree of effect of several process parameters on the temperature field is quantitatively analyzed. Based on the simulation results, suitable process parameters are selected to process the surface of microstructures with corrosion-resistant function, and the corrosion-resistant surface is used as a mask. Ultimately, micro-patterns with a certain etch depth are electrolytically processed.
The remaining sections of the paper are organized as follows. The materials and methods used for the experiments are described in Section 2. A three-dimensional thermodynamic analysis model for nanosecond pulsed laser processing is presented in Section 3. A thermodynamic analysis of the developed model is presented in Section 4. In Section 5, the mask anti-corrosion electrolysis experiments are shown. The conclusions of the paper are summarized in Section 6.

2. Experimental Materials and Methods

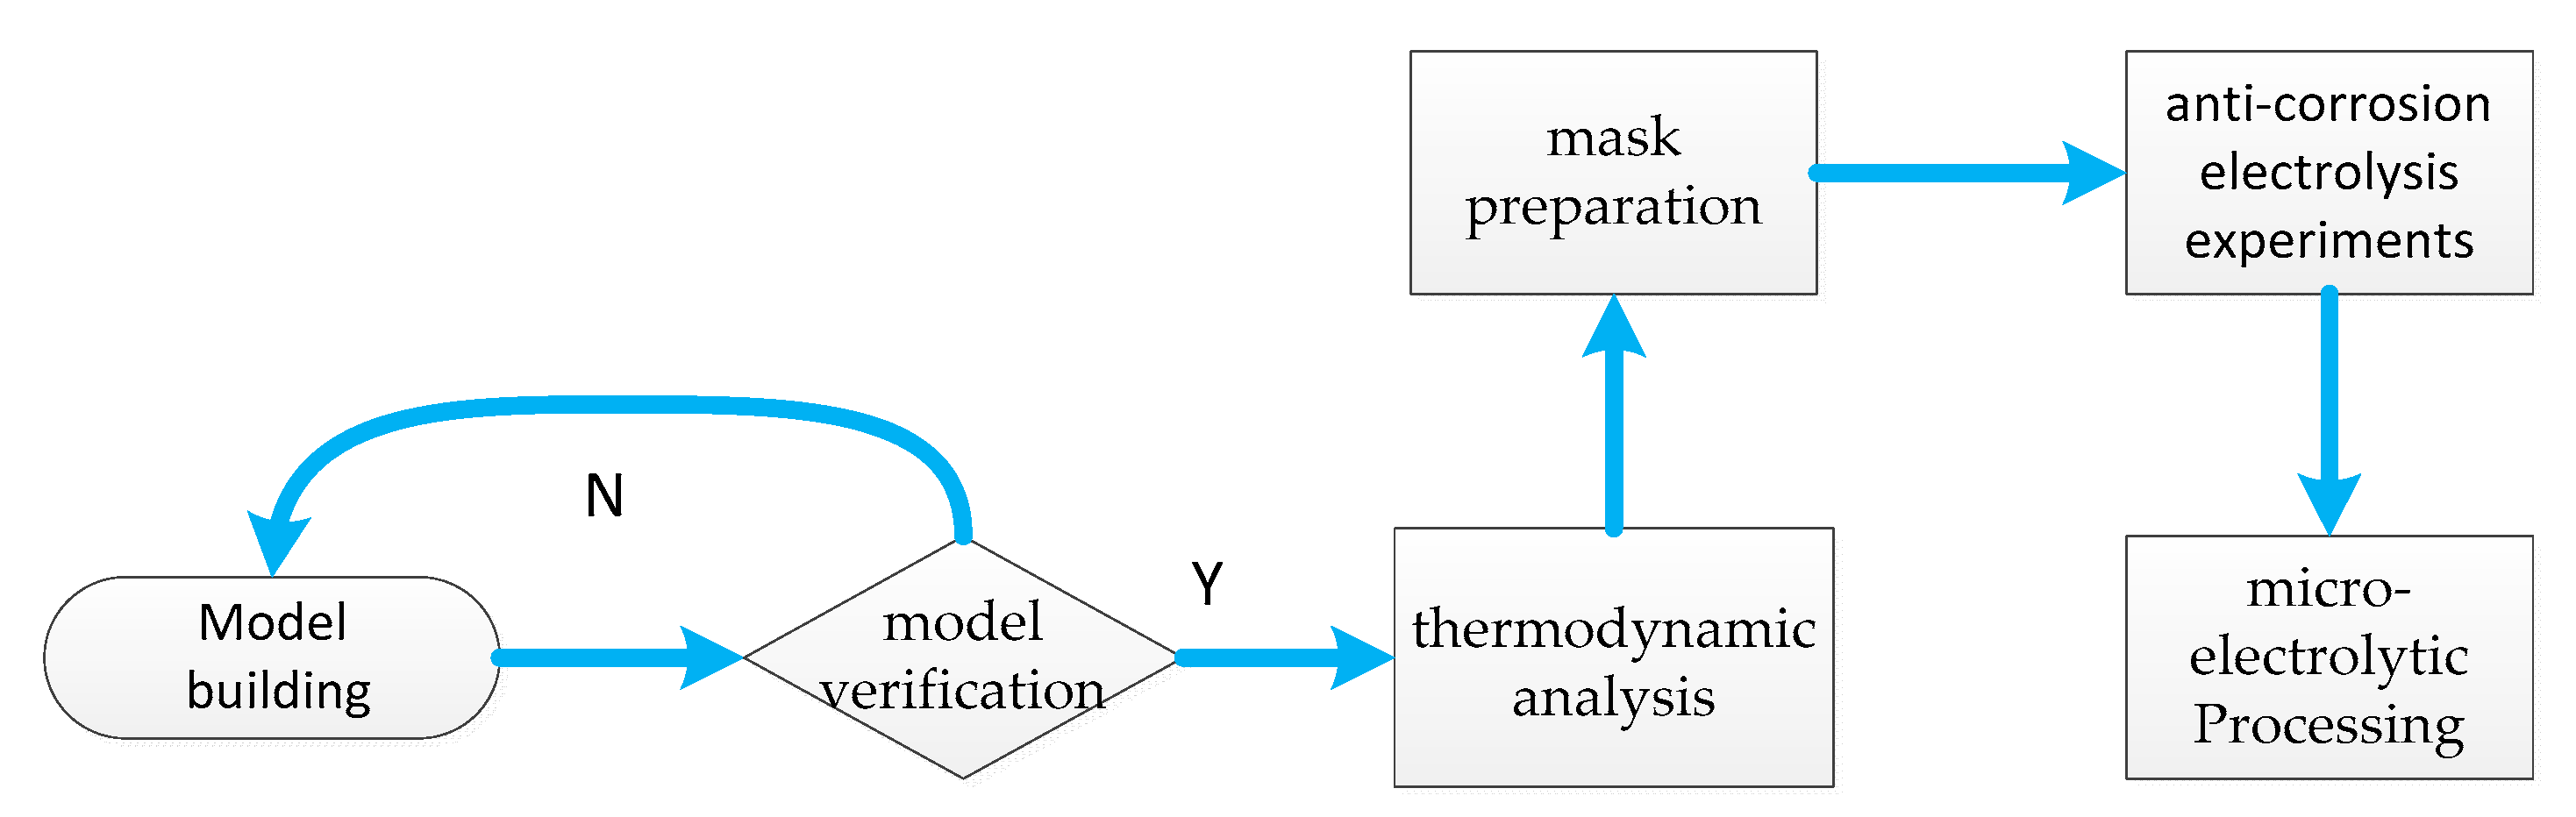
2.1. Experimental Materials and Workflow

In this paper, the material used for the experiments is industrial single-sided polished 304 stainless steel, with a thickness of 1 mm and a size of 10 mm × 10 mm (sample 1) and 20 mm × 20 mm (sample 2). The samples are cleaned in an ultrasonic ethanol bath for 15 min before laser treatment and dried in a clean environment before use. The flowchart of the method is shown in Figure 1.

2.2. The Laser Source and Micro Electrolytic Processing

Laser and micro electrolysis processing is carried out in a self-developed laser mask micro-electrolysis combination system [20]. The device combines a pulsed laser module and a micro electrolysis system with a high-frequency pulsed power supply on the same three-axis feed table. The laser beam of the laser processing system is supplied by a pulsed fiber laser (IPGphotonics®, Auburn, MA, USA) with a maximum power of 20 W. The beam movement is controlled by an oscillating mirror (SCANLAB-SCANcube®, Puchheim, Germany) with a wavelength of 1064 nm, a pulse width of 100 ns, a repetition frequency of 20–200 kHz, and a scanning resolution 0.4 microns. The micro electrochemical machining system consists of a self-developed pulse processing power supply and an electrolyte circulation system. The structure principle of the hybrid processing system is shown in Figure 2.

2.3. Surface Morphology Characterization

Sample 1 is laser-scanned according to the set parameters. The morphology of individual etch pits is observed using a fully automated Zeiss Material Microscope Imager Z2m and is compared with the simulation results. A JSM-6360LV scanning electron microscope (JEOL, Tokyo, Japan) is used to observe the morphology of the micro-pattern formed after micro-electrolytic processing. Filmetrics Profilm3D profilometer (Filmetrics Inc, San Diego, CA, USA) is used to measure the 3D morphology and roughness of the micro-pattern.

2.4. Electrochemical Characterization

Electrochemical tests are carried out on an electrochemical workstation CHI660E (Chenhua Inc., Shanghai, China). The corrosive medium is a 1.8 mol/L NaNO3 solution. The reference electrode is a saturated glycerol electrode, and the auxiliary electrode is a Pt electrode. Sample 2 is the working electrode. The polarization curves test is carried out by scanning from −0.5 mV to the anode at a scanning rate of 1.67 mV/s until the end of steady-state pitting or hyper-passivation corrosion. The values of corrosion potential and corrosion current density are calculated using the Tafel interpolation method.
First, sample 2 is laser scanned over 15 mm × 15 mm. The wire is led from the non-polished surface and encapsulated with epoxy resin to expose the 10 mm × 10 mm polished working surface. The sample edges are carefully encapsulated to prevent crevice corrosion from occurring.

3. Three-Dimensional Thermodynamic Analysis Model for Nanosecond Pulsed Laser Processing

3.1. Numerical Simulation Models

Laser melting and coagulation is a non-stationary, transient heat-conduction process. Nanosecond pulsed laser ablation is a heat-transfer process of thermal energy to the interior of the metal and satisfies the thermal diffusion equation. The model control equation is a non-linear transient analytical equation. In this paper, a 3D geometric model is created using DesignModeler on the ANSYS workbench 18.2 platform (ANSYS Inc., Canonsburg, PA, USA). The geometric figure is a 10 mm × 10 mm × 1 mm cube. The material is 304 stainless steel, and the temperature-dependent thermal property parameters of the material are added in Engineering Data, which is taken from the literature [21].
In order to ensure a good computational accuracy and avoid the overly long computation time due to a too-small mesh, which may result in non-convergence of the solution, we choose the Workbench/Tetrahedrons/Patch conforming method and take into account all faces and edges to refine the mesh within the heat-affected zone. The mesh is further refined in the laser loading range so that there is a sufficient number of meshes in the spot diameter range to ensure the stability of the calculation.
The pulse Gaussian moving heat source within the range defined on the upper surface is determined as a type II boundary condition according to the Beer–Lambert law. Therefore, the mathematical expression for the individual pulsed heat flux is as follows [22]:
I ( r , z , t ) = 2 P A τ π r b 2 exp ( 2 ( x 2 + y 2 ) r b 2 ) exp ( α z )
The heat flow density is averaged over the range of the beam and acts on the surface as follows [23]:
Q ( x , y , t ) = q ( x , y , t ) g ( t )
where g(t) is the pulse time distribution and is a unit step function.
As the interaction of the pulsed laser with the interface is influenced by many factors, the ablation process of the pulsed laser includes functions such as heat transfer, melting, evaporation, and plasma formation. The melt ejection and evaporation resulting from superheating cause the area being treated to melt and recondense and change the laser absorption rate and energy dispersion, so that the actual laser heat flow acting on the surface is significantly lower than the expected calculated values from the model. The laser ablation threshold is 2–3 orders of magnitude higher than the experimentally measured breakdown intensity [24]. Therefore, the plasma attenuation coefficient A is introduced as a correction factor in Equation (1), and A is 100 m−1 [25]. The parameter P is the average power of the pulsed laser, and α is the optical absorption coefficient of the material, which is 0.27 in the study [26]. The parameter τ is the pulse width, rb is the spot radius, and x and y are the position coordinates of a point on the radius of the laser action position.
The initial temperature of the model is set at a room temperature of 25 °C. The latent heat of phase change is considered enthalpy, as the substrate temperature rises above the melting point. Mechanical constraints are free. The heat dissipation conditions are mainly heat exchange between the surrounding area and the air and between the bottom surface and the support material. The four sides and the upper surface of the unloaded laser are convective heat exchange, which complies with the third boundary condition.
λ T x n x + λ T y n y + λ T z n z = κ ( T w T f )
where κ is the convective heat transfer coefficient, λ is the thermal conductivity, Tw is the temperature of the surrounding medium, Tf is the temperature of the known boundary, and nx, ny and nz are normals to each direction.
The above heat sources and boundary conditions are loaded into the 3D finite element model. In this paper, the workbench platform in ANSYS is used for geometric modeling and transient thermodynamic analysis of the model. Therefore, the boundary conditions are imposed as temperature and convection, and a moving heat source is established in the function of the mechanical APDL platform in ansys; the pulsed laser is loaded and solved through the command stream. The model at a certain instant after loading and solving is shown in Figure 3.

3.2. Numerical Simulation Models

The modeling is based on partial assumptions, and the simulation results are compared with similar materials to ensure model validity. The comparison data are taken from the literature [27]. As shown in Figure 3, the simulated temperature follows the same trend as the comparison data at the same peak power density. However, the simulated temperature is slightly higher than the experimental temperature. According to the following equation, we correct the model because the laser heat source is introduced with an average heat flow [28].
  ( x , y , z , t ) = 1 π r b 2 0 r b q ( 2 π r ) d r = 0.865 P π r b 2
The corrected comparison data are shown in Figure 4, where the temperature variation matches the same peak power density. The simulation results tend to be consistent with the comparison data.
To further verify the reliability of the modified model, the samples are laser processed in a stable indoor clean air environment. The power is 5 W and 6 W, with a spot diameter of 50 μm, a scanning speed of 200 mm/s, and a repetition frequency of 20 kHz. The experimental sample 1 is placed on the bench without restraint, the focus is adjusted, and the nanosecond pulsed laser is loaded onto the sample surface.
The simulated results at different power levels and the experimental data are shown in Figure 5. The measured ablation diameter at 5 W is 48.33% of that at 6 W, and the simulated heat flow density is 48.36% of that at 6 W, which shows that the pit diameter and heat flow density increase almost the same amplitude with the increase of power. It is also confirmed that the heat transfer mechanism in nanosecond pulsed laser processing is heat conduction. The heat flow density directly affects the size of the etch pits. The laser energy affects the amplitude of ablation process, which is consistent with the conclusion in reference [29]. The depth of the etch pits is 43.23% of the depth at 6 W, with a slightly smaller variation in depth; this is because the pit depth is affected by the melt weight condensation.
The pit morphology, temperature field distribution, and heat flow density distribution are shown in Figure 6. The etch pit is formed by nanosecond laser ablation, with a depressed center and an upward expansion and elevation. At 6 W, the ablation temperature, heat flow density, and pit size are significantly higher than those at 5 W. The maximum temperature during pulsed laser processing occurs on sub-surfaces. The ablation state is determined by evaporation and melt discharge, with superheating and bubble formation leading to explosive melt injection. The reaction forces caused by the impact and ablation transmitted through the melt lead to melting spattering, which recondenses after highly rapid cooling, resulting in irregular upward expansion of the etch pit edges.
The above analysis verifies the validity of the constructed thermodynamic analysis model for nanosecond pulsed laser processing. The model reflects the heat transfer process of the nanosecond pulsed laser processing process under the processing parameters and reproduces the temperature field under the action of the nano pulsed laser.

4. Thermodynamic Analysis of the Model

4.1. Orthogonal Simulation Experimental Design

To further explore the effect of each processing parameter on the temperature field, a five-factor four-level orthogonal simulation experiment was designed. The corresponding processing parameters, maximum temperatures, and extreme differences of the simulations are shown in Table 1. The factor trend diagrams of the effect of each factor on the temperature field are shown in Figure 7.

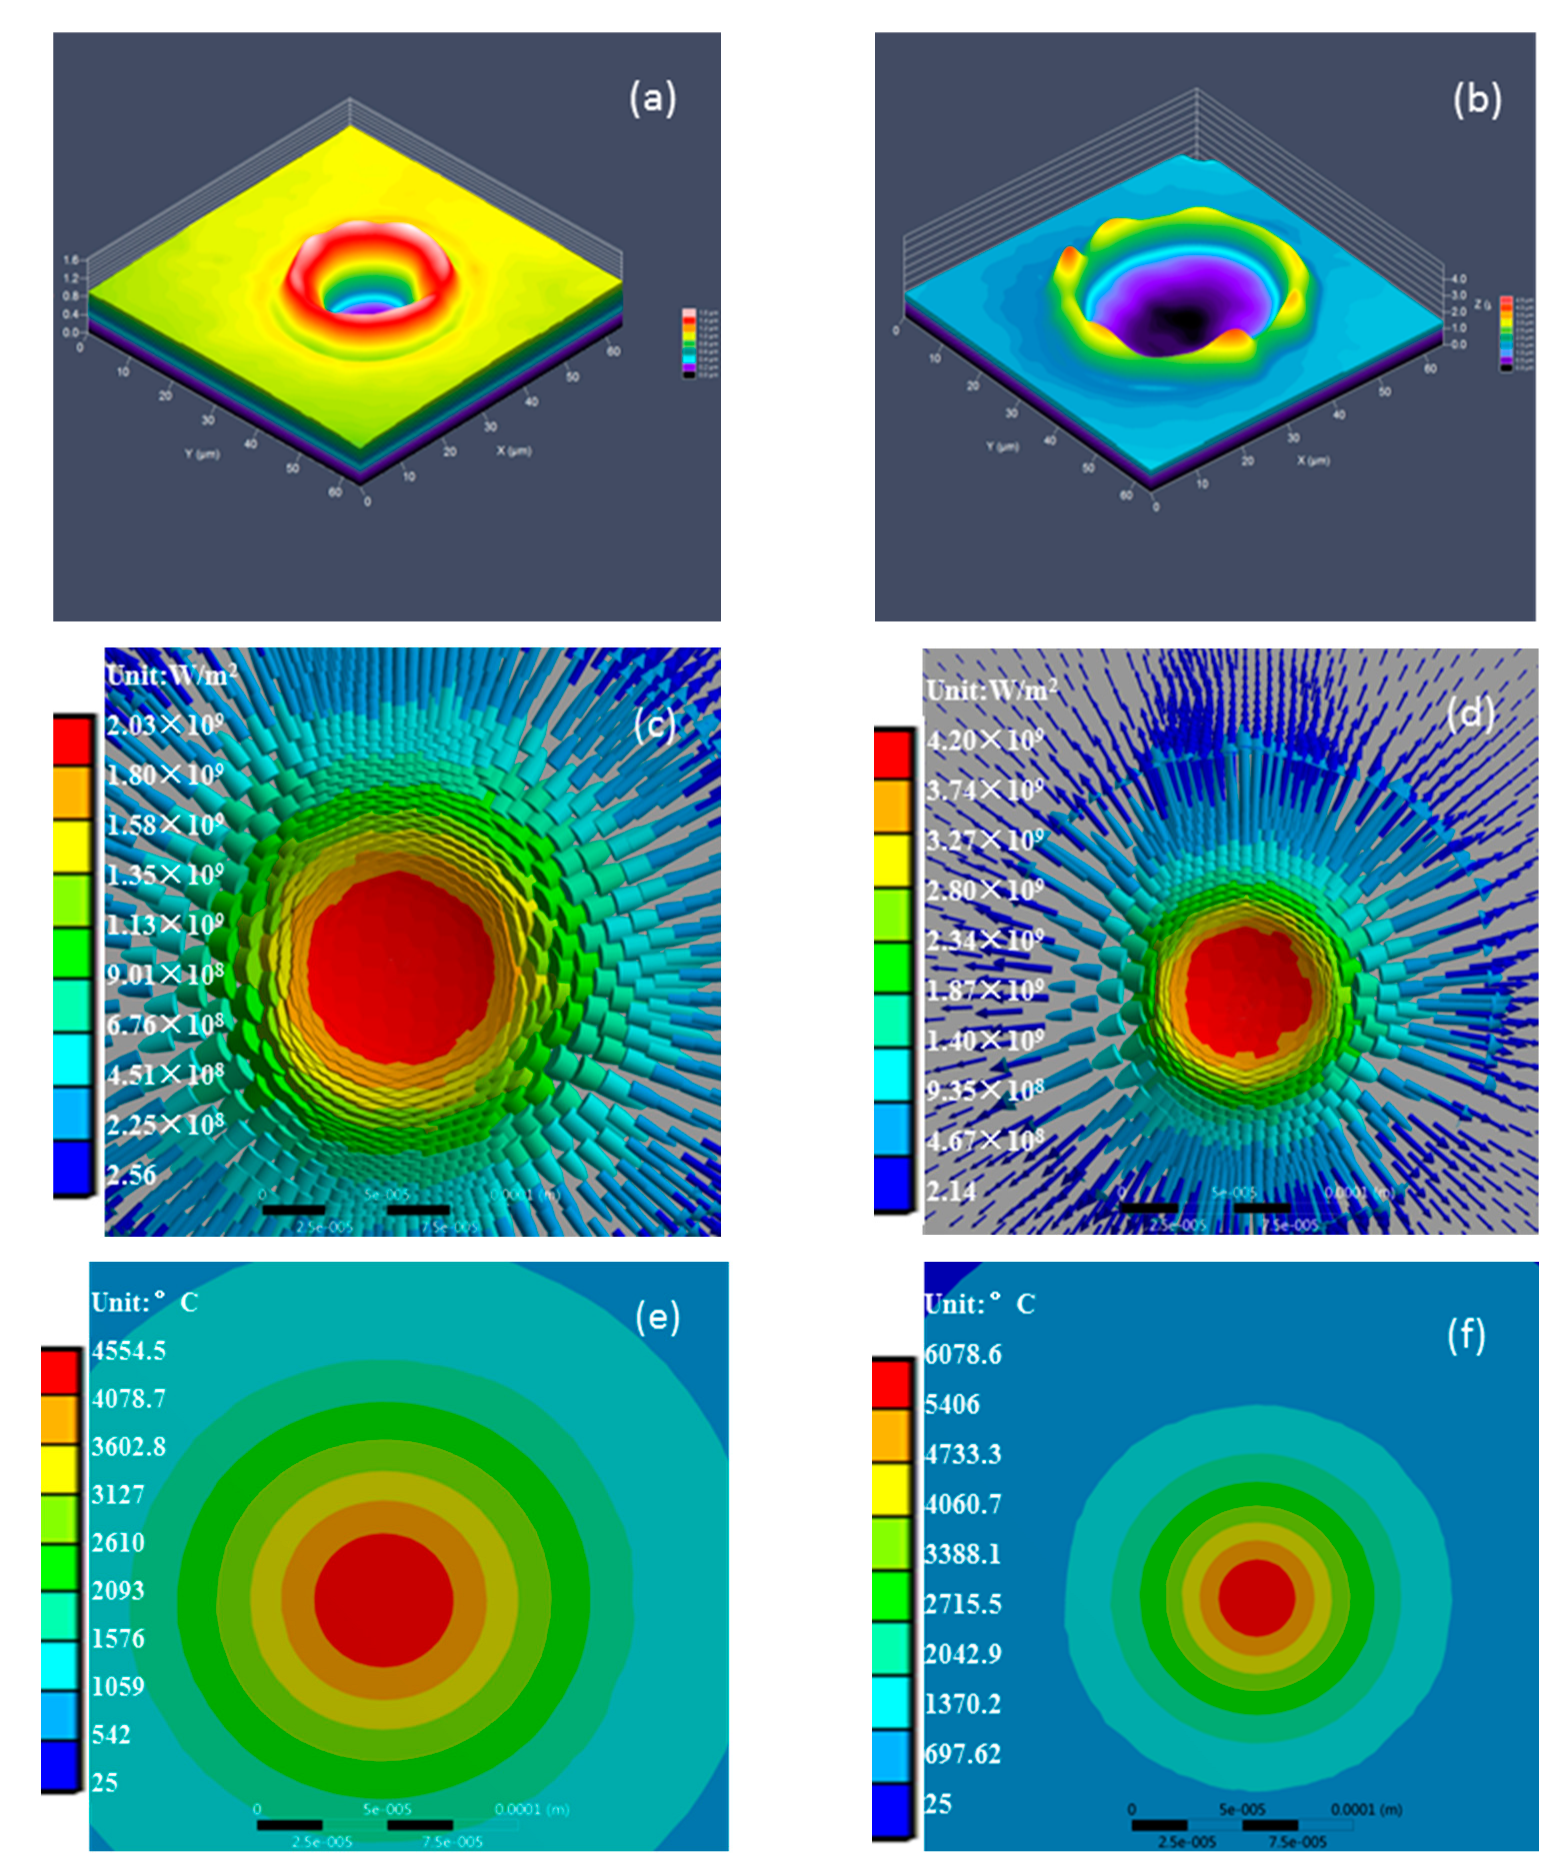
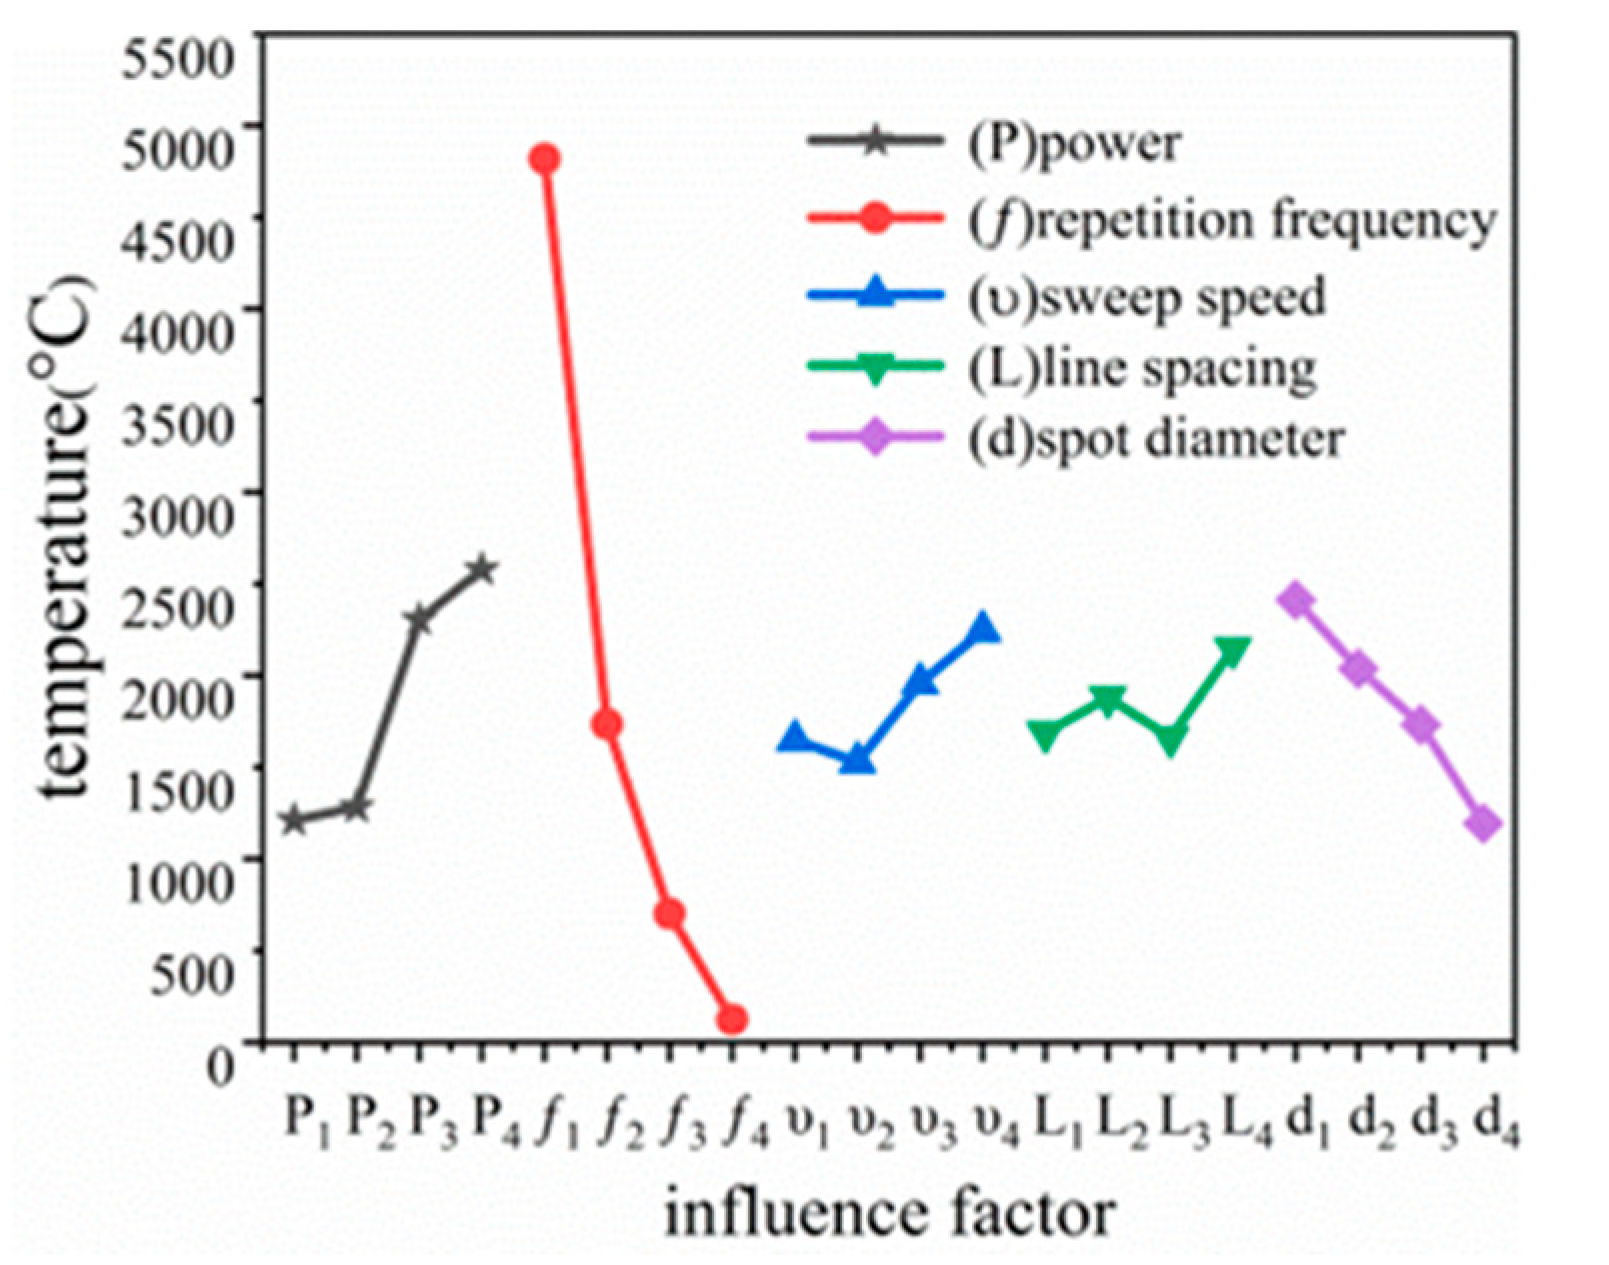
4.2. Experimental Results and Discussion

As can be seen from Table 1, the range of repetition frequency is 4695.25, which is the largest. In contrast, the line spacing has a value difference of 486. The value difference of each factor by size order is repetition frequency, power, spot diameter, scan speed, and scan line spacing. Thus, the temperature is the most sensitive to repetition frequency, and changes in repetition frequency have the most significant effect on the temperature field. The factors that affect the temperature field in descending order are repetition frequency, power, spot diameter, scan speed, and scan line spacing. As can be seen from Figure 7, increased repetition frequency results in the most significant decrease in temperature. It is the most critical factor affecting the temperature field. The temperature increases with the increase of power, while the more significant the spot diameter, the more the temperature decreases.
In contrast, the effect of the secondary factors, scan speed, and line spacing variation on temperature is governed by the variation in the primary factors. Although scan speed and scan spacing have a negligible effect on the temperature field of an individual melt pool, they are still important factors in determining the surface microtopography. They will be essential factors in surface properties through their importance in surface microstructure formation.

5. Masked Anti-Corrosion Electrolysis Experiments

5.1. Mask Preparation and Corrosion-Resistance Testing

In order to further explore the application of producing a functional micro-surface by nanosecond pulsed laser processing, the sample surface under the action of nanosecond pulsed laser should be adequate to produce a micro-structure due to slight ablation, and the irreversible ablation damage to the surface due to excessive peak power density should not affect the use function of the material. Based on the results of the orthogonal experiments, the items in the orthogonal simulation experiments where the ablation temperature reached the melting point of 304 stainless steel are selected. Experiments 7 (2026 °C), 8 (1733 °C), 11 (1799 °C), 12 (1448 °C), and 16 (2124 °C) are selected for sample 2, then laser scanned, processed, and encapsulated for corrosion-resistance testing. The simulated temperature for experiment 12 is slightly below the melting point of 304 stainless steel (1450 °C). However, it is still included in the corrosion performance tests, given the potential for error in the simulated temperature. The unmasked substrate and the experimental polarization curves for each number are shown in Figure 8. The corrosion potentials and electrical currents are shown in Table 2.
It can be seen from Figure 8 and Table 2 that the 304 stainless steel substrate and the laser-machined mask scanned at each experimental parameter show varying degrees of passivation corrosion in a 1.8 mol/L NaNO3 solution. Samples with maximum temperatures close to the melting point show good corrosion resistance. The mask layers with different processing parameters show the highest breakdown potential for experiment 16 compared to the substrate. The breakdown potential is 326 mv higher than that of the substrate. However, the self-corrosion current is slightly higher than that of the substrate. The corrosion currents of experiments 7, 8, 11 significantly negative shift. In experiment 8, although the breakdown potential is not significantly elevated, the self-corrosion current drops significantly, by 479 nA/cm2, indicating the highest quality of the mask, significantly lower corrosion rate, and better corrosion resistance. The current density decreases with increasing potential. This may be due to the fact that ablation close to the melting point of the substrate produces a dense oxide film, which hinders the diffusion of ions and leads to a decrease in corrosion current. Therefore, the best quality of the mask is selected for the laser scanning processing in experiment 8. The laser processing parameters are shown in Table 1, and the processed samples are used for the electrolytic processing experiments.

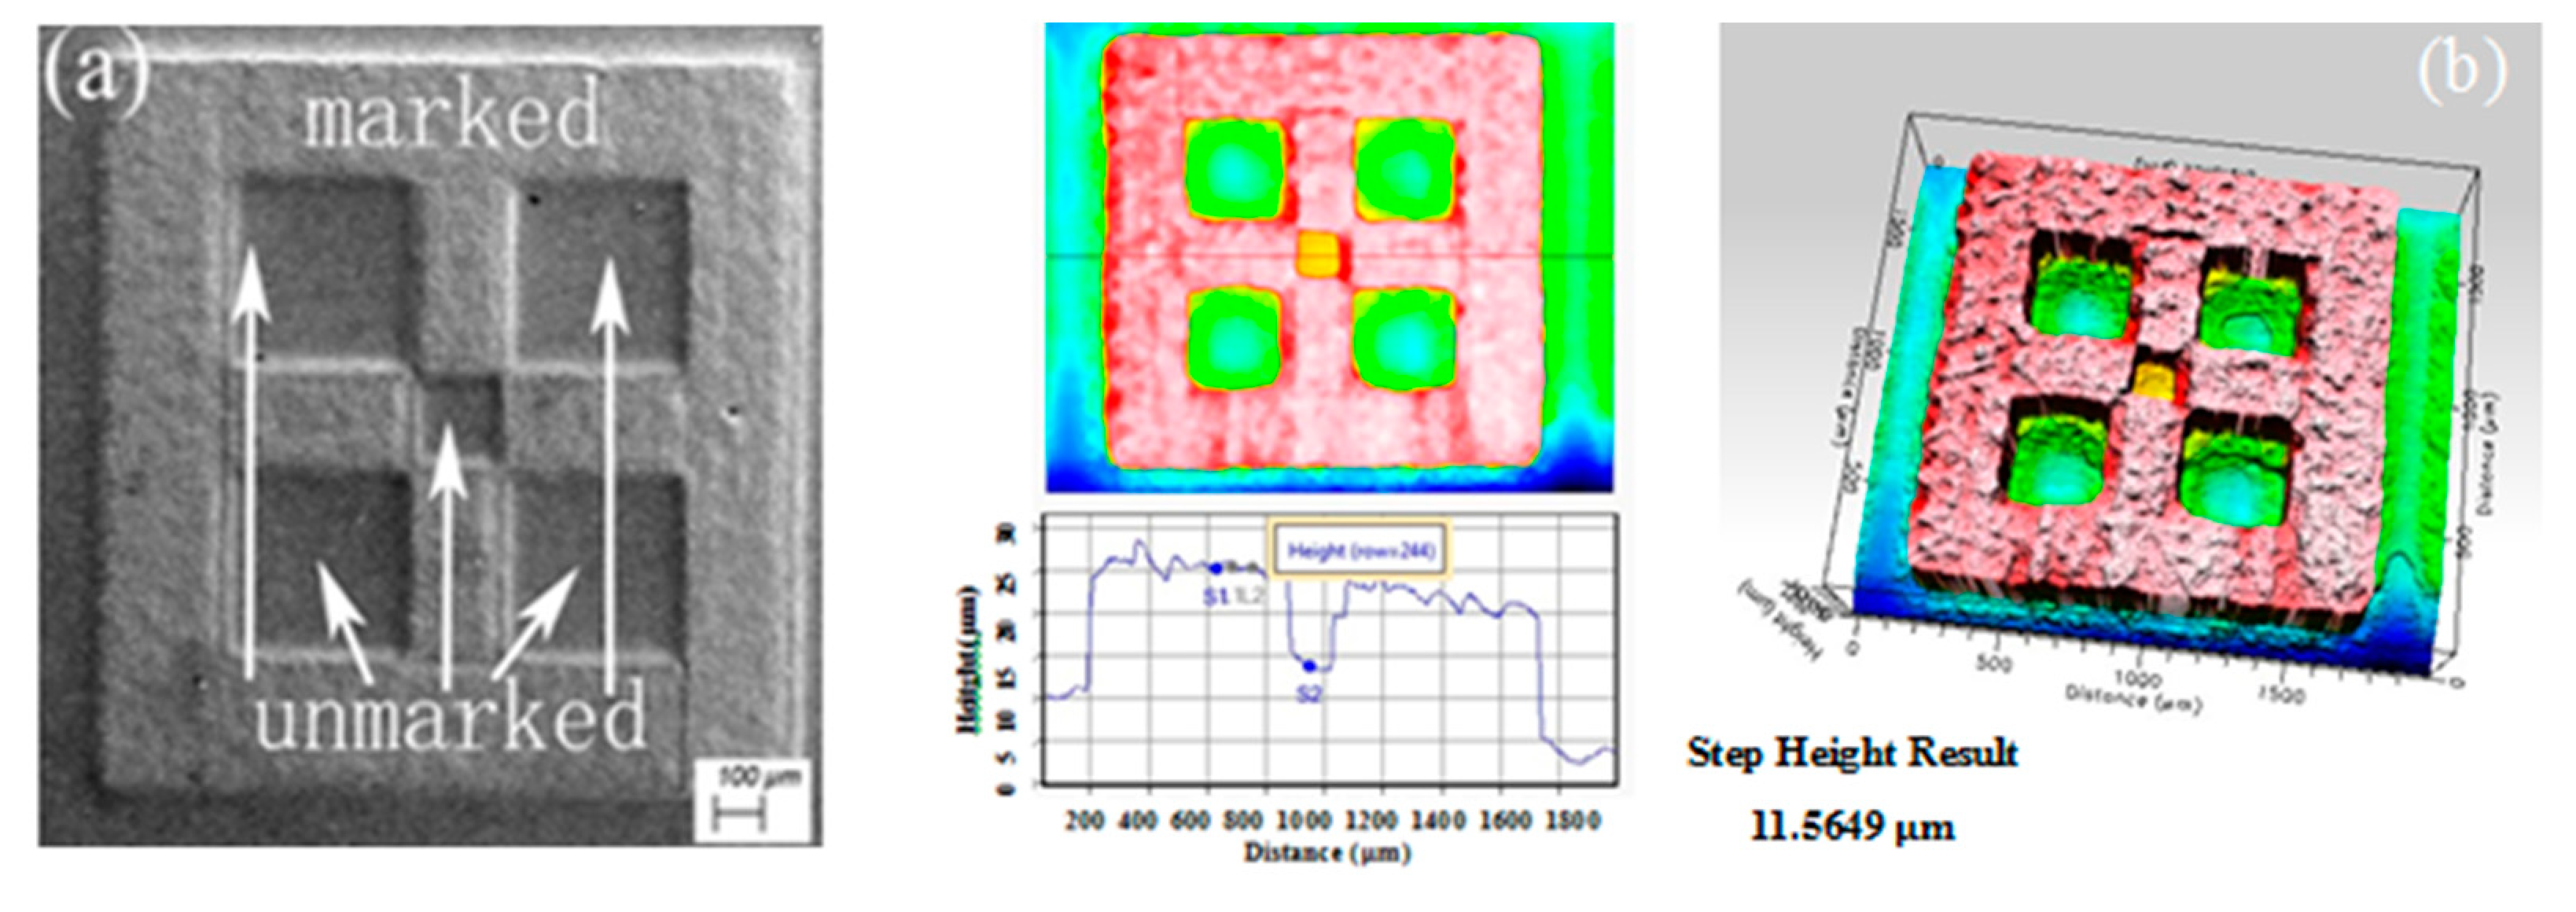
5.2. Micro Electrolytic Processing Experiments

There is no heat-affected layer on the surface during high-frequency pulsed current micro electrolytic machining processing. The transfer of material takes place on an ionic scale, and surface roughness is minor, significantly improving the forming accuracy of micro machining. However, the processing efficiency is low, and complex micro machining of electrodes is required [30,31].
In the self-developed laser mask micro-fine electrolytic composite processing system, the electrolyte is 1.80 mol/L NaNO3. In experiment 8, electrolytic processing parameters scan the sample with a complex pattern of shapes as the anode, and the unique tool chuck mount sheet 304 stainless steel electrode as the cathode. Laser scanning of the surface generated by the mask for the non-machined area cannot be spurious to corrosion. The unmasked part is selectively anodized in the electrolytic process due to its poor corrosion resistance, generating a complex pattern. During the electrolytic process, the processing voltage is 9.5 V, the pulse width 50 µs, the pulse interval 750 µs, the processing gap 220 µm, and the scanning speed 200 µm/s.
Due to the thin protective layer processed by the nanosecond pulsed laser, the etching depth can be increased by multiple positioning rescans and electrolysis. The SEM microscopic image of the processed micropattern by three laser scans and electrolytic etching is shown in Figure 9a. The morphology measured by the 3D optical profilometer is demonstrated in Figure 9b. After electrolysis, the surface of the pattern is smoother, with sharper corners and steeper and straighter height of the pattern. The etch depth at the shallowest point is 11.56 µm, and the most profound etch depth is over 20 µm.
Micro electrolysis experiments have shown that nanosecond pulsed lasers combined with computer-aided mapping techniques can produce arbitrarily complex patterns. It can also be used to produce a mask layer. The complexly shaped micro patterns with good quality can be processed by freely selecting masked area and non-masked area. We chose a set of parameters for the electrolytic processing experiments based on the temperature intervals obtained from the simulation experiments and the results of the electrochemical experiments, and obtained the expected results; however, the mechanism that produces the corrosion resistance is not clear. It may be closely related to the temperature and the uniform denseness of the mask, or it may be related to the change in the chemical composition of the surface after ablation [32,33].

6. Conclusions

A simulation model of a nanosecond pulsed laser moving surface heat source was been developed in this paper, the temperature field under different laser processing parameters was simulated, and a multi-factor simulation experiment was carried out. The effects of the laser processing parameters on the temperature field are, in descending order, repetition frequency, power, spot diameter, scan speed, and scan line spacing. The simulation results also confirm that heat conduction is the heat transfer mechanism for nanosecond pulsed ablation. After the nanosecond pulsed laser processing of 304 stainless steel, a protective film with good corrosion resistance was produced on the sample surface when the power was 5 W, the repetition frequency was 80 kHz, and the spot diameter was 50 μm. Micro-patterns with a certain etch depth were produced on the surface of 304 stainless steel in an electrolytic cell with an electrolyte of 1.8 mol/L, a pulse voltage of 9.5 V, a pulse width of 50 µs, a scan gap of 220 µm, and a scan speed of 200 µm/s, which avoids the fabrication of complex micro-electrodes. It was also demonstrated that nanosecond laser mask micro electrolytic composite processing is a promising solution for micro machining.

Author Contributions

The research idea was proposed by X.L. The modeling, design of the experimental protocol, analysis of data, and completion of the first draft of the thesis were carried out by S.W. The experimental part was completed by S.W., H.T., and D.W., X.L. revised the thesis. All authors have read and agreed to the published version of the manuscript.

Funding

The project is supported by the National Natural Science Foundation of China (51375208). Basic scientific research business expenses were supported by the Education Department of the Heilongjiang Province (2016-KYYWF-0575).

Institutional Review Board Statement

The study did not require ethical approval.

Informed Consent Statement

Not applicable.

Data Availability Statement

Not applicable.

Conflicts of Interest

The authors declare no conflict of interest.

References

  1. Raj, D.; Reddy, B.; Maity, S.R.; Pandey, K.M. Laser Beam Micromachining of Metals: A Review. Mater. Today Proc. 2019, 18, 98–103. [Google Scholar] [CrossRef]
  2. Lei, S.; Zhao, X.; Yu, X.; Hu, A.; Vukelic, S.; Jung, M.B.G.; Joe, H.-E.; Yao, L.Y.; Shin, Y.C. Ultrafast Laser Applications in Manufacturing Processes: A State-of-the-Art Review. J. Manuf. Sci. Eng. 2020, 142, 031005. [Google Scholar] [CrossRef]
  3. Faisal, N.; Zindani, D.; Kumar, K.; Bhowmik, S. Laser micromachining of engineering materials—A review. Micro Nano Mach. Eng. Mater. 2019, 121–136. [Google Scholar] [CrossRef]
  4. Martan, J.; Prokešová, L.; Moskal, D.; Ferreira de Faria, B.C.; Honner, M.; Lang, V. Heat accumulation temperature measurement in ultrashort pulse laser micromachining. Int. J. Heat Mass Transf. 2021, 168, 120866. [Google Scholar] [CrossRef]
  5. Balachninaitė, O.; Tamulienė, V.; Eičas, L.; Vaičaitis, V. Laser micromachining of steel and copper using femtosecond laser pulses in GHz burst mode. Results Phys. 2021, 22, 103847. [Google Scholar] [CrossRef]
  6. Armbruster, O.; Naghilou, A.; Kitzler, M.; Kautek, W. Spot size and pulse number dependence of femtosecond laser ablation thresholds of silicon and stainless steel. Appl. Surf. Sci. 2017, 396, 1736–1740. [Google Scholar] [CrossRef]
  7. Yao, C.; Xu, S.; Ye, Y.; Jiang, Y.; Ding, R.; Gao, W.; Yunan, X. The influence of femtosecond laser repetition rates and pulse numbers on the formation of micro/nano structures on stainless steel. J. Alloys Compd. 2017, 722, 235–241. [Google Scholar] [CrossRef]
  8. Ammarullah, M.I.; Afif, I.Y.; Maula, M.I.; Winarni, T.I.; Tauviqirrahman, M.; Akbar, I.; Basri, H.; van der Heide, E.; Jamari, J. Tresca Stress Simulation of Metal-on-Metal Total Hip Arthroplasty during Normal Walking Activity. Materials 2021, 14, 7554. [Google Scholar] [CrossRef]
  9. Jamari, J.; Ammarullah, M.I.; Saad, A.P.M.; Syahrom, A.; Uddin, M.; van der Heide, E.; Basri, H. The effect of bottom profile dimples on the femoral head on wear in metal-on-metal total hip arthroplasty. J. Funct. Biomater. 2021, 12, 38. [Google Scholar] [CrossRef]
  10. Abd Ali, H.R.; Khalid, E.A.; Alwan, A.S.; Jaddoa, A.A. Effect of Fibre Laser Surface Treatment on Wear Resistance of Gray Cast Iron Astm A48. J. Mech. Eng. Res. Dev. 2021, 44, 141–149. [Google Scholar]
  11. Sedao, X.; Shugaev, M.V.; Wu, C.; Douillard, T.; Esnouf, C.; Maurice, C.; Reynaud, S.; Pigeon, F.; Garrelie, F.; Zhigilei, L.V.; et al. Growth Twinning and Generation of High-Frequency Surface Nanostructures in Ultrafast Laser-Induced Transient Melting and Resolidification. ACS Nano 2016, 10, 6995–7007. [Google Scholar] [CrossRef] [PubMed]
  12. Wu, C.; Zhigilei, L.V. Nanocrystalline and Polyicosahedral Structure of a Nanospike Generated on Metal Surface Irradiated by a Single Femtosecond Laser Pulse. J. Phys. Chem. C 2016, 120, 4438–4447. [Google Scholar] [CrossRef] [Green Version]
  13. Shugaev, M.V.; He, M.; Levy, Y.; Mazzi, A.; Miotello, A.; Bulgakova, N.M.; Zhigilei, L.V. Laser-Induced Thermal Processes: Heat Transfer, Generation of Stresses, Melting and Solidification, Vaporization, and Phase Explosion. In Handbook of Laser Micro- and Nano-Engineering; Sugioka, K., Ed.; Springer International Publishing: Cham, Switzerland, 2020; pp. 1–81. [Google Scholar]
  14. Harilal, S.S.; Freeman, J.R.; Diwakar, P.K.; Hassanein, A. Femtosecond Laser Ablation: Fundamentals and Applications. In Laser-Induced Breakdown Spectroscopy: Theory and Applications; Musazzi, S., Perini, U., Eds.; Springer: Berlin/Heidelberg, Germany, 2014; pp. 143–166. [Google Scholar]
  15. Tangwarodomnukun, V.; Kringram, S.; Zhu, H.; Qi, H.; Rujisamphan, N. Fabrication of superhydrophobic surface on AISI316L stainless steel using a nanosecond pulse laser. Proc. Inst. Mech. Eng. Part B J. Eng. Manuf. 2022, 236, 680–693. [Google Scholar] [CrossRef]
  16. Tran, N.G.; Chun, D. Simple and fast surface modification of nanosecond-pulse laser-textured stainless steel for robust superhydrophobic surfaces. CIRP Ann. 2020, 69, 525–528. [Google Scholar] [CrossRef]
  17. Patil, D.; Aravindan, S.; Sarathi, R.; Rao, P.V. Fabrication of self-cleaning superhydrophobic silicone rubber insulator through laser texturing. Surf. Eng. 2021, 37, 308–317. [Google Scholar] [CrossRef]
  18. Li, Y.; Shi, Y. Influences of Pulse Frequency on Microstructure and Properties in Laser Cladding Layers. China Mech. Eng. 2021, 32, 2108. [Google Scholar]
  19. Dzienny, P.; Stepak, B.; Budnicki, A.; Antonczak, A. The influence of laser pulse duration on periodic surface structures on stainless steel. J. Laser Micro Nanoeng. 2020, 15, 1–4. [Google Scholar]
  20. Li, X.H.; Wang, S.M.; Xue, B.B. Technology of Electrochemical Micromachining Based on Surface Modification by Fiber Laser on Stainless Steel. Mater. Sci. Forum 2017, 909, 67–72. [Google Scholar] [CrossRef]
  21. Mekky, A.H. Computational Modelling for Specific Heat and Thermal Conductivity of Austenitic Stainless Steels Alloys at Solid Phase. Rev. Compos. Matriaux Av. 2020, 30, 23–27. [Google Scholar] [CrossRef]
  22. Banerjee, A.; Ogale, A.A.; Das, C.; Mitra, K.; Subramanian, C. Temperature distribution in different materials due to short pulse laser irradiation. Heat Transf. Eng. 2005, 26, 41–49. [Google Scholar] [CrossRef]
  23. Razavykia, A.; Brusa, E.; Delprete, C.; Yavari, R. An Overview of Additive Manufacturing Technologies-A Review to Technical Synthesis in Numerical Study of Selective Laser Melting. Materials 2020, 13, 3895. [Google Scholar] [CrossRef] [PubMed]
  24. Bäuerle, D. Laser Processing and Chemistry; Springer: Berlin/Heidelberg, Germany, 2011. [Google Scholar]
  25. Rai, R.R.; Elmer, J.W.; Palmer, T.A.; DebRoy, T. Heat transfer and fluid flow during keyhole mode laser welding of tantalum, TiAlV, 304L stainless steel and vanadium. J. Phys. D Appl. Phys. 2007, 40, 5753. [Google Scholar] [CrossRef] [Green Version]
  26. He, X.; Fuerschbach, P.W.; DebRoy, T. Heat transfer and fluid flow during laser spot welding of 304 stainless steel. J. Phys. D Appl. Phys. 2003, 36, 1388. [Google Scholar] [CrossRef]
  27. Yang, J.; Lian, J.; Dong, Q.; Guo, Z. Nanostructured films formed on the AISI 329 stainless steel by Nd-YAG pulsed laser irradiation. Appl. Surf. Sci. 2004, 229, 2–8. [Google Scholar] [CrossRef]
  28. Zeng, K.; Pal, D.; Stucker, B. A review of thermal analysis methods in laser sintering and selective laser melting. In 2012 International Solid Freeform Fabrication Symposium; University of Texas at Austin: Austin, TX, USA, 2012. [Google Scholar]
  29. Demos, S.G.; Negres, R.A.; Raman, R.N.; Shen, N.; Rubenchik, A.M.; Matthews, M.J. Mechanisms governing the interaction of metallic particles with nanosecond laser pulses. Opt. Express 2016, 24, 7792–7815. [Google Scholar] [CrossRef] [PubMed]
  30. Patel, D.S.; Sharma, V.; Jain, V.K.; Ramkumar, J. Reducing overcut in electrochemical micromachining process by altering the energy of voltage pulse using sinusoidal and triangular waveform. Int. J. Mach. Tools Manuf. 2020, 151, 103526. [Google Scholar] [CrossRef]
  31. Volgin, V.M.; Lyubimov, V.V.; Kabanova, T.B.; Davydov, A.D. Theoretical analysis of micro/nano electrochemical machining with ultra-short voltage pulses. Electrochim. Acta 2021, 369, 137666. [Google Scholar] [CrossRef]
  32. Zhang, X.; Yocom, C.J.; Mao, B.; Liao, Y. Microstructure evolution during selective laser melting of metallic materials: A review. J. Laser Appl. 2019, 31, 31201. [Google Scholar] [CrossRef]
  33. Mroczkowska, K.M.; Dzienny, P.; Budnicki, A.; Antonczak, A.J. Corrosion Resistance of AISI 304 Stainless Steel Modified Both Femto- and Nanosecond Lasers. Coatings 2021, 11, 592. [Google Scholar] [CrossRef]
Figure 1. Flowchart of the research work.
Metals 12 00749 g001
Figure 2. The developed device for electrochemical micromachining with fiber laser mask.
Metals 12 00749 g002
Figure 3. The transient thermodynamic model with loaded boundary conditions.
Metals 12 00749 g003
Figure 4. Comparison of the simulation model, modified simulation model, and temperature from the literature.
Metals 12 00749 g004
Figure 5. Simulation model versus experimental data trend graph.
Metals 12 00749 g005
Figure 6. Comparison of the laboratory etch pit morphology with the temperature field and heat flow distribution at different power levels: (a) 3D morphology of the pit at 5 W, (b) 3D morphology of the pit at 6 W, (c) heat flow field distribution at 5 W, (d) heat flow field distribution at 6 W, (e) temperature field distribution at 5 W, and (f) temperature field distribution at 6 W.
Metals 12 00749 g006
Figure 7. The trend of the influence of the temperature field of each factor.
Metals 12 00749 g007
Figure 8. Polarization curves for selected items in the orthogonal experiment table.
Metals 12 00749 g008
Figure 9. SEM image and 3D profile of the masked laser cavity: (a) SEM images of micro-machined mask and non-masked area; (b) 3D contour image of the micro-machined mask and non-masked area.
Metals 12 00749 g009
Table 1. Orthogonal experiments for laser processing simulation.
Experimental
Program
Power
(W)
Repetition
Frequency
(kHz)
Scanning Speed
(mm/s)
Line Spacing
(μm)
Scanning Diameter
(μm)
Maximum Temperature
(°C)
142055505853
24401010602466
34602020701337
4480404080993
55201020804559
6540540702619
7560405602026
85802010501733
96202040607341
106404020504430
11660510801799
12680105701448
137204010707326
14740205803227
157601040503441
16780520602124
Polar difference (R)1367.54695.25715.254861219.75-
Table 2. Corrosion potentials and corrosion currents of substrates and experimental items.
Test ProgramSubstance78111216
Ecorr (mV vs. SCE)−330−328−328−56−146−4
Icorr (μA/cm2)0.480.403.86 × 10−47.06 × 10−30.811.37
Publisher’s Note: MDPI stays neutral with regard to jurisdictional claims in published maps and institutional affiliations.

