Article

Influence of Laser Polishing on the Material Properties of Aluminium L-PBF Components

1
Laser Application Center, Aalen University, 73430 Aalen, Germany
2
School of Computing, Engineering and Built Environment, Glasgow Caledonian University, Glasgow G4 0BA, UK
3
School of Engineering and Design, Technical University of Munich, 85748 Garching, Germany
4
Material Research Institute, Aalen University, 73430 Aalen, Germany
*
Author to whom correspondence should be addressed.
Metals 2022, 12(5), 750; https://doi.org/10.3390/met12050750
Submission received: 17 March 2022 / Revised: 15 April 2022 / Accepted: 21 April 2022 / Published: 27 April 2022
(This article belongs to the Special Issue Advanced Manufacturing of Novel Metallic Related Materials)

Abstract

:
In this study, the influence of laser polishing on the microstructural and mechanical properties of additively manufactured aluminium AlSi10Mg Laser Powder Bed Fusion (L-PBF) parts is analysed. The investigation is carried out on a 5-axis laser cell equipped with 1D Scanner optics driven by a solid-state disc laser at a wavelength of 1030 nm. Laser polishing is performed with pulsed or continuous laser radiation on samples in the initial L-PBF state or after stress relief treatment in a furnace. The metallurgical investigation of the remelting zone with a depth of 101–237 µm revealed an unchanged and homogeneous chemical composition, with a coarsened α-phase and a changed grain structure. The hardness within the remelting zone is reduced to 102–104 HV 0.1 compared to 146 HV 0.1 at the L-PBF initial state. Below the remelting zone, within the heat affected zone, a reduced microhardness, which can reach a thickness up to 1.5 mm, occurs. Laser polishing results in a reduction in residual stresses and resulting distortions compared to the L-PBF initial state. Nevertheless, the re-solidification shrinkage of the polished surface layer introduces additional tensions, resulting in sample distortions well above ones remaining after a stress relieve heat treatment of the initial state. The mechanical properties, analysed on laser polished flat tensile specimens, revealed an increase in the ultimate elongation from 4.5% to 5.4–10.7% and a reduction in the tensile strength from 346 N/mm2 to 247–271 N/mm2 through laser polishing. Hence, the strength resulting from this is comparable to the initial L-PBF specimens after stress relieve heat treatment.

1. Introduction

An additive manufacturing method for complex metal parts is the Laser Powder Bed Fusion (L-PBF). The layer-wise powder-based melting process with typical beam diameters between 50 and 100 µm in combination with fast beam velocities in the range of 400–1500 mm/s generates small melt pools with extremely high cooling rates, resulting in a very fine grain size. Furthermore, the hardness and the static mechanical properties of the additive manufactured aluminium parts are increased in comparison to conventional manufactured parts [1]. Due to the layer-wise manufacturing process, high thermal differences between the layers of the solid part below and the melt pool within the overlapping weld lines of the topmost layer occurs. Thus, the shrinkage by material solidification and cooling is impeded by the underneath solid layers and introduces residual stresses, which can reach the material’s yield strength and result in plastic deformation, delamination or distortion. These effects can be reduced by pre-heating the built platform, which also causes a decrease in material hardness [2]. Another approach of reducing these detrimental effects is stress relief treatment/annealing of the printed components after the built process but before cutting off from the built platform.
Due to this fast-cooling precipitation hardening, hypo-eutectic aluminium silicon magnesium alloys such as AlSi10Mg exhibit, after manufacturing by L-PBF in the as-built state, a high mechanical strength of up to R m = 477 MPa, accompanied with a high hardness value of up to 134 HV and a reduced max elongation [1].
As the main disadvantage, the L-PBF process generates a surface with residual powder particles or agglomerates, which are sintered together. This increased roughness is insufficient for industrial applications in the die field of cleanroom applications, food industry or medical implementation [3,4,5]. The resulting roughness is affected by the geometry of the part and its orientation in the manufacturing process [6,7,8]. Furthermore, the high surface roughness and subsurface failures cause a decreasing fatigue performance [9].
Laser polishing is a volume-maintaining and contact-free technology, which causes the flattening of surface-by-surface remelting of a thin layer and material relocation from the surface elevations to the surface depressions, driven predominantly by surface tensions [10]. Laser polishing is commonly carried out with pulsed or continuous laser radiation in combination with a beam diameter of several hundred microns [11]. In order to reach high roughness reduction rates, high pulse and track overlaps are required, which result in a widespread thermal input and heat affected zone below the remelting zone. Laser polishing of additive manufactured metal parts revealed high roughness reduction rates on a broad range of metal alloys such as Cobalt-Chromium alloys (CoCr) [12,13,14], Inconel 718 [15,16], tool steel H13 [17], maraging steel 1.2709 [18], Titanium Ti6Al-4V [19,20,21] and corrosion resistant steel 316 L [22,23]. The laser polishing of L-PBF-aluminium AlSi10Mg parts with different laser operation modes has already been comprehensively investigated with roughness reduction rates above 98% Ra of the initial surface roughness [24,25,26,27,28,29]. Due to low laser beam absorption of Al-Si alloys and, at the same time, high process energy losses due to comparatively high thermal conductivity, high intensities and energy densities are required for laser polishing. Hofele et al., 2021, revealed that following process parameters (pulse duration of 0.3 ms, beam intensity of 1285 W/mm2, energy density (energy input per square area) 76.5 J/mm2) enable the highest roughness reduction from Ra = 7.9 µm to Ra = 0.66 µm on vertically built specimens. This result can be further improved by multiple polishing passes [25]. It was also shown that the remelting depth is in the range of 130–160 µm [28]. With continuous laser radiation, a suitable laser beam intensity of 1057 W/mm2 and an energy density of 42 J/mm2 was found and a roughness Ra = 0.23 µm with single polishing was reached [25]. Varied beam intensities between 0.9 kW/mm2 and 1.6 kW/mm2 result in remelting depths from approximately 50–150 µm [28]. Polishing with a CO2 laser ( λ = 10.6 µm) enabled the highest roughness improvement of 85% from Sa = 22.3 µm to 7.9 µm with an energy density of 330 J/mm2 [26]. The porosity of the remelting zone on vertical printed specimens varied between 0.98% and 1.7%.
To sum up, due to the high thermal conductivity of aluminium alloys, high energy densities are necessary to create a sufficient melt pool depth for a high roughness reduction rate. The influence of laser polishing of additive manufactured aluminium alloys on the microstructure formation and mechanical properties within the remelting zone and heat affected zone, as well as changes in the residual stresses due to global heating of the part and shrinkage by solidification and cooling down of the remelting zone, is still an open field for investigation.
This paper deals with investigations on the influence of laser polishing with pulsed and continuous laser radiation on the material properties of AlSi10Mg. Therefore, the microstructure of the resulting remelting zone and the chemical composition and microhardness is analysed. The influence of laser polishing on the residual stresses and distortion of the parts is investigated on a printed cantilever geometry in the initial L-PBF state and annealed state. The influence of the surface remelting process on the mechanical properties are characterized on tensile specimens.

2. Applied Methods and Experimental Design

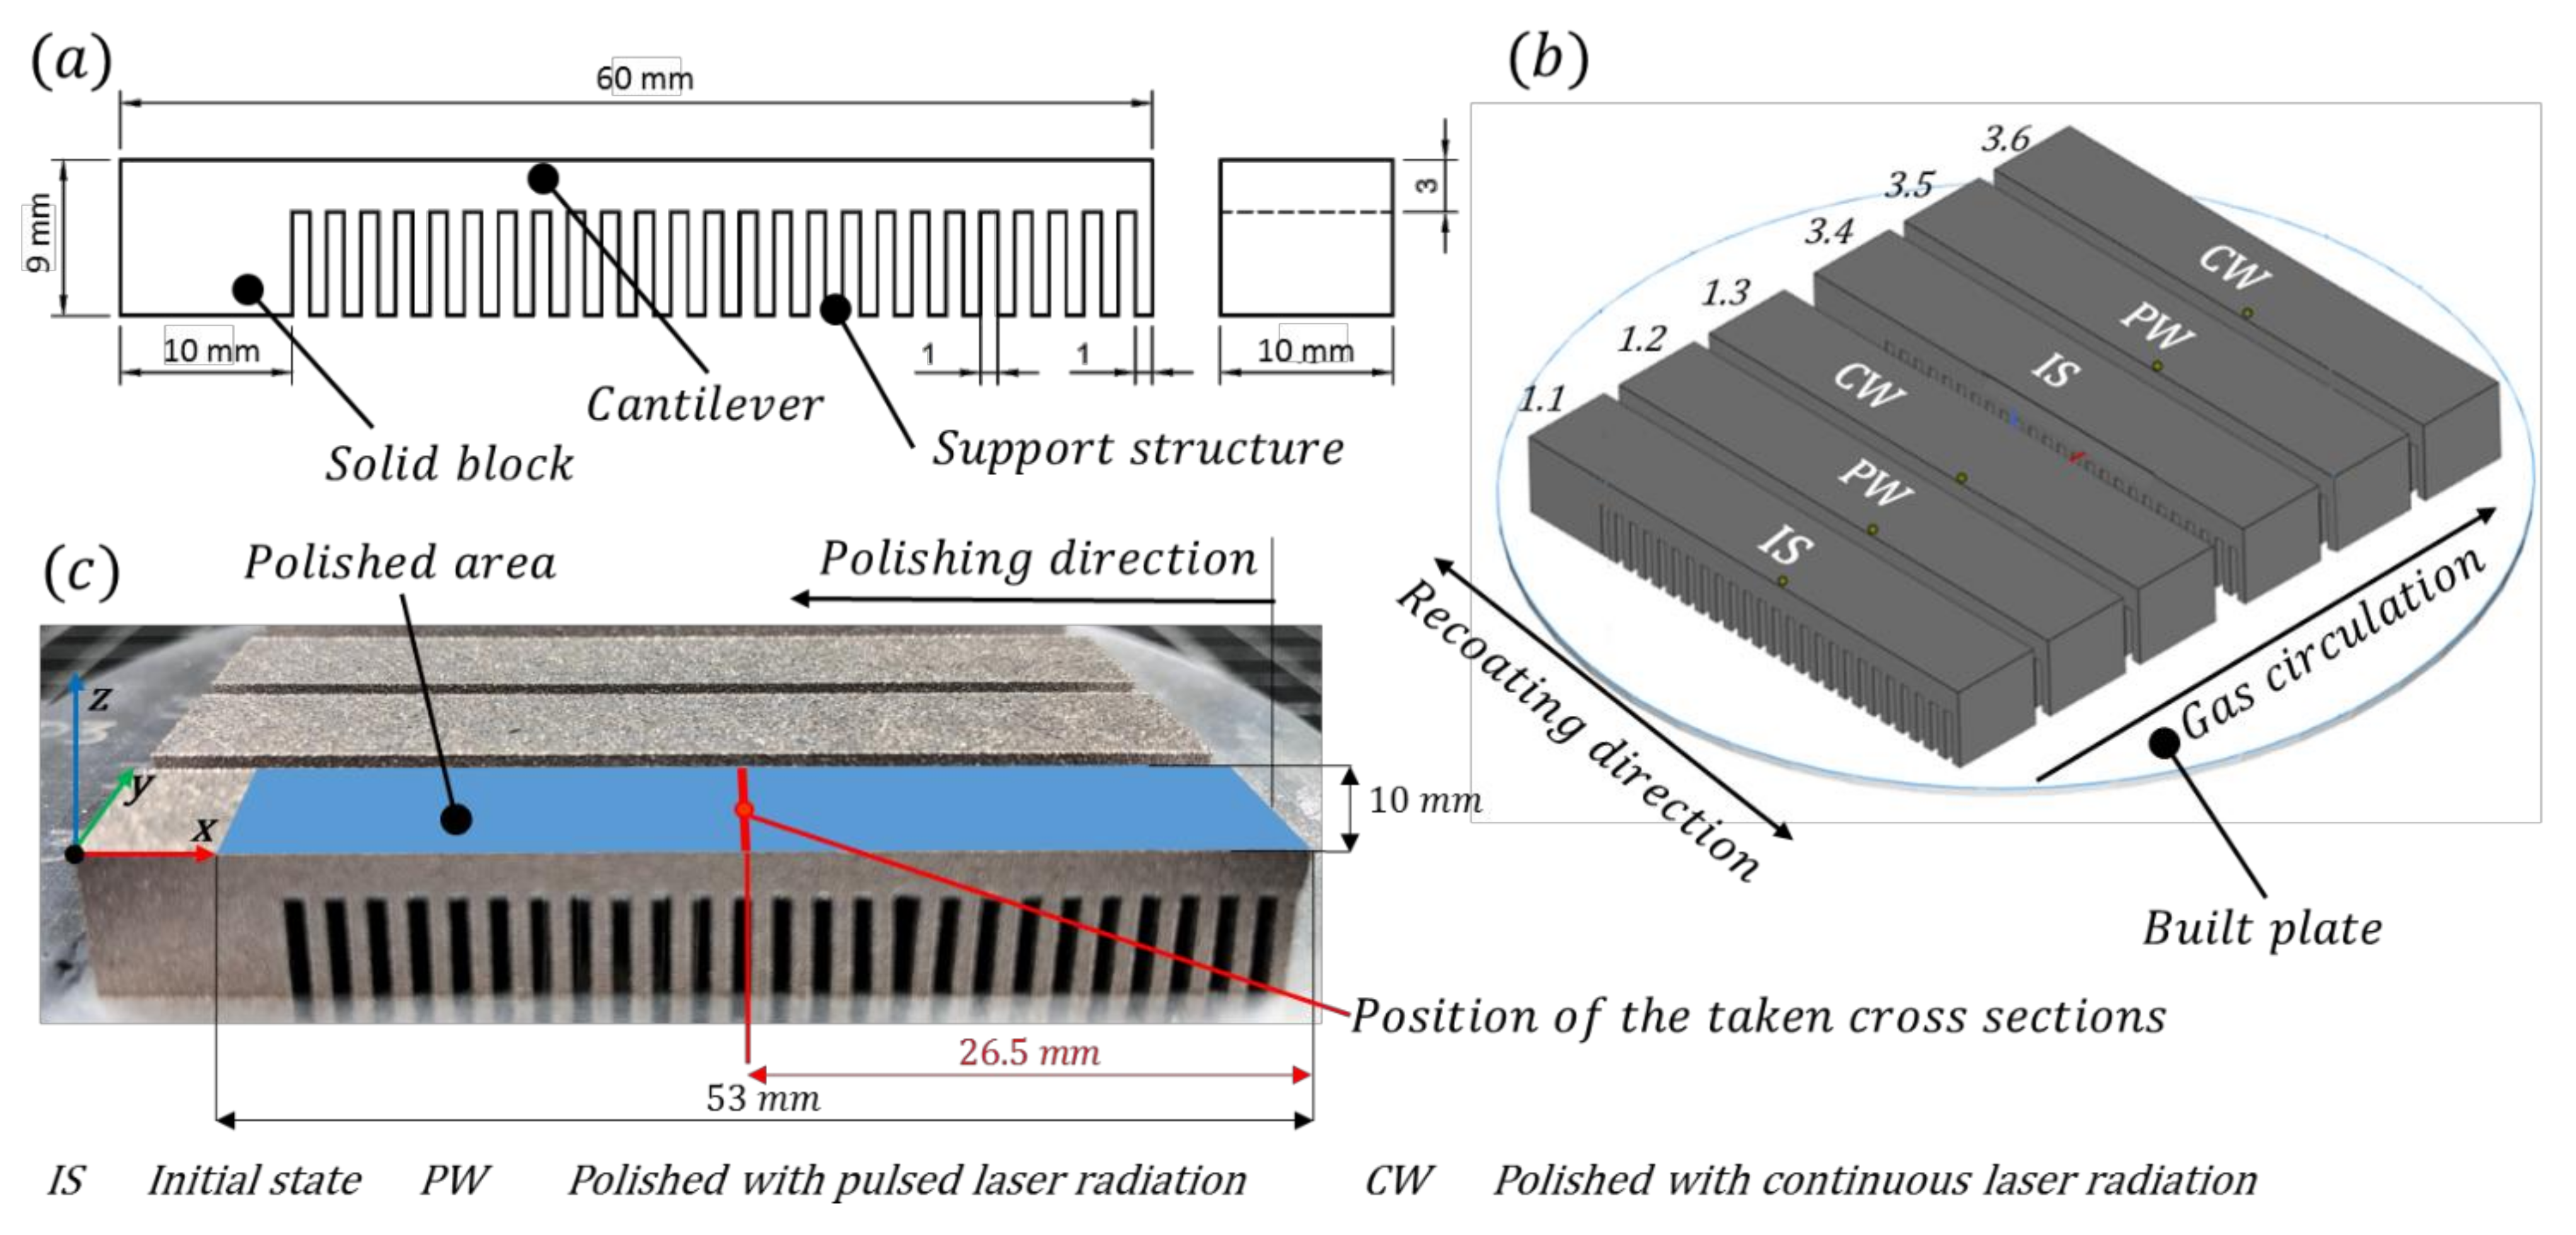
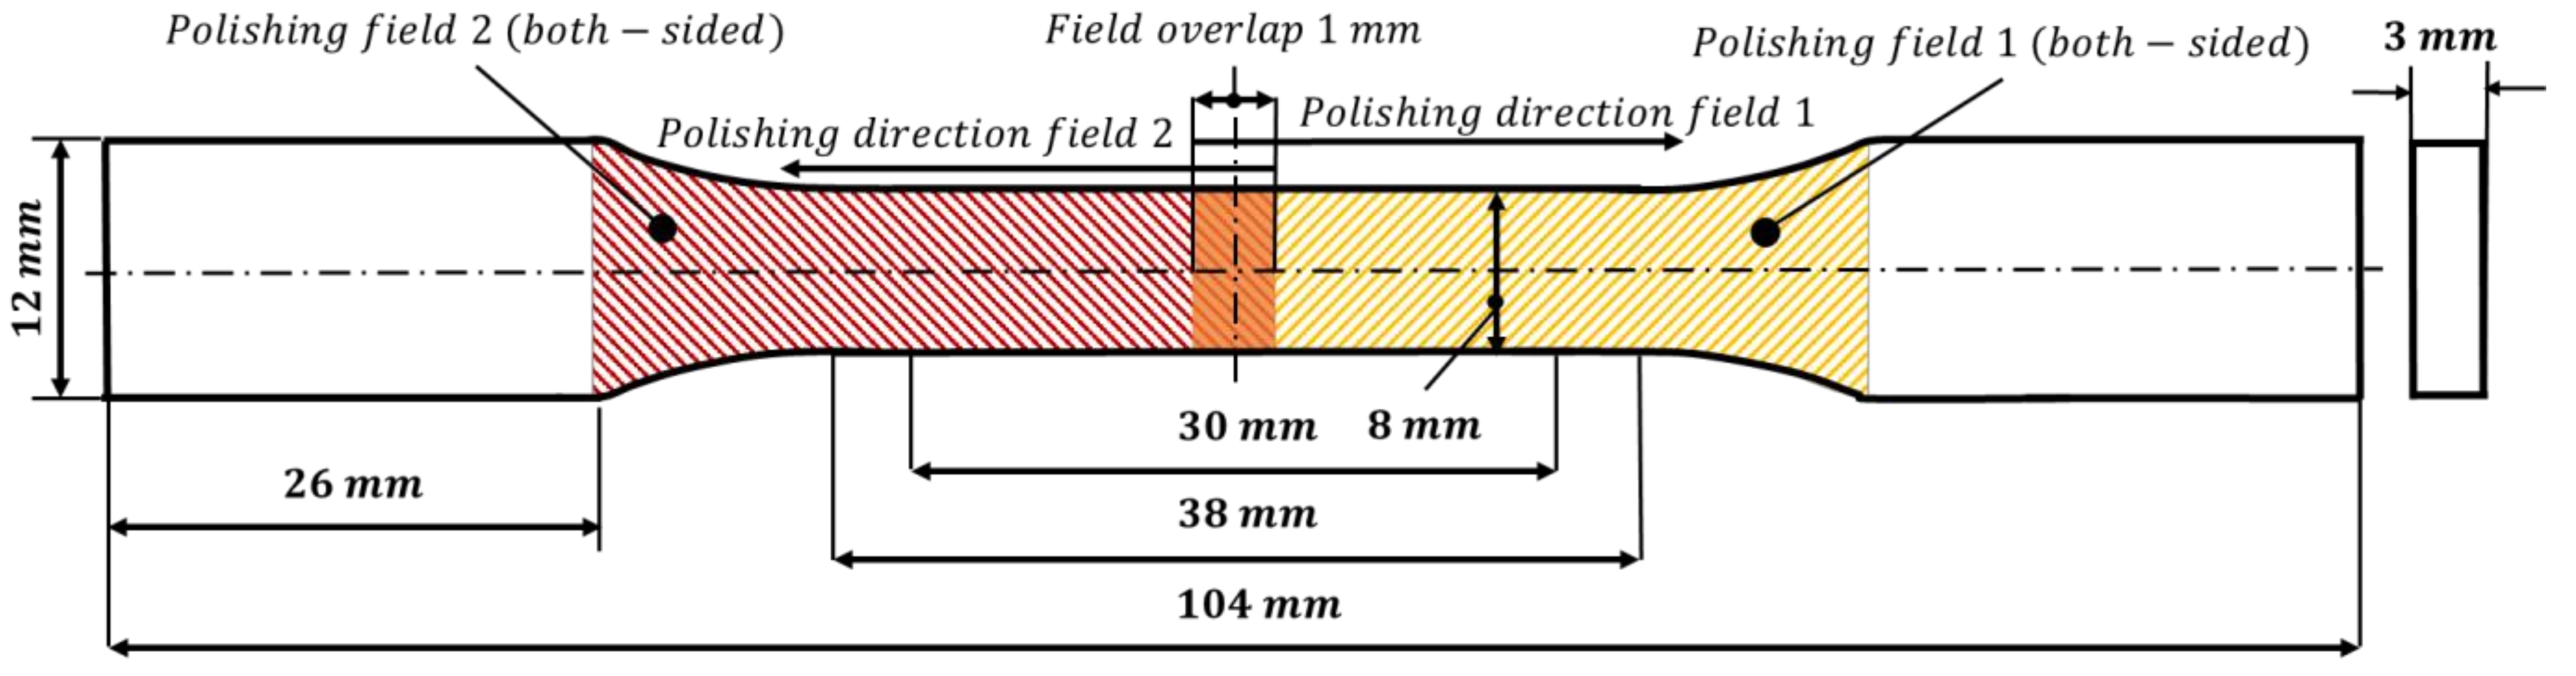
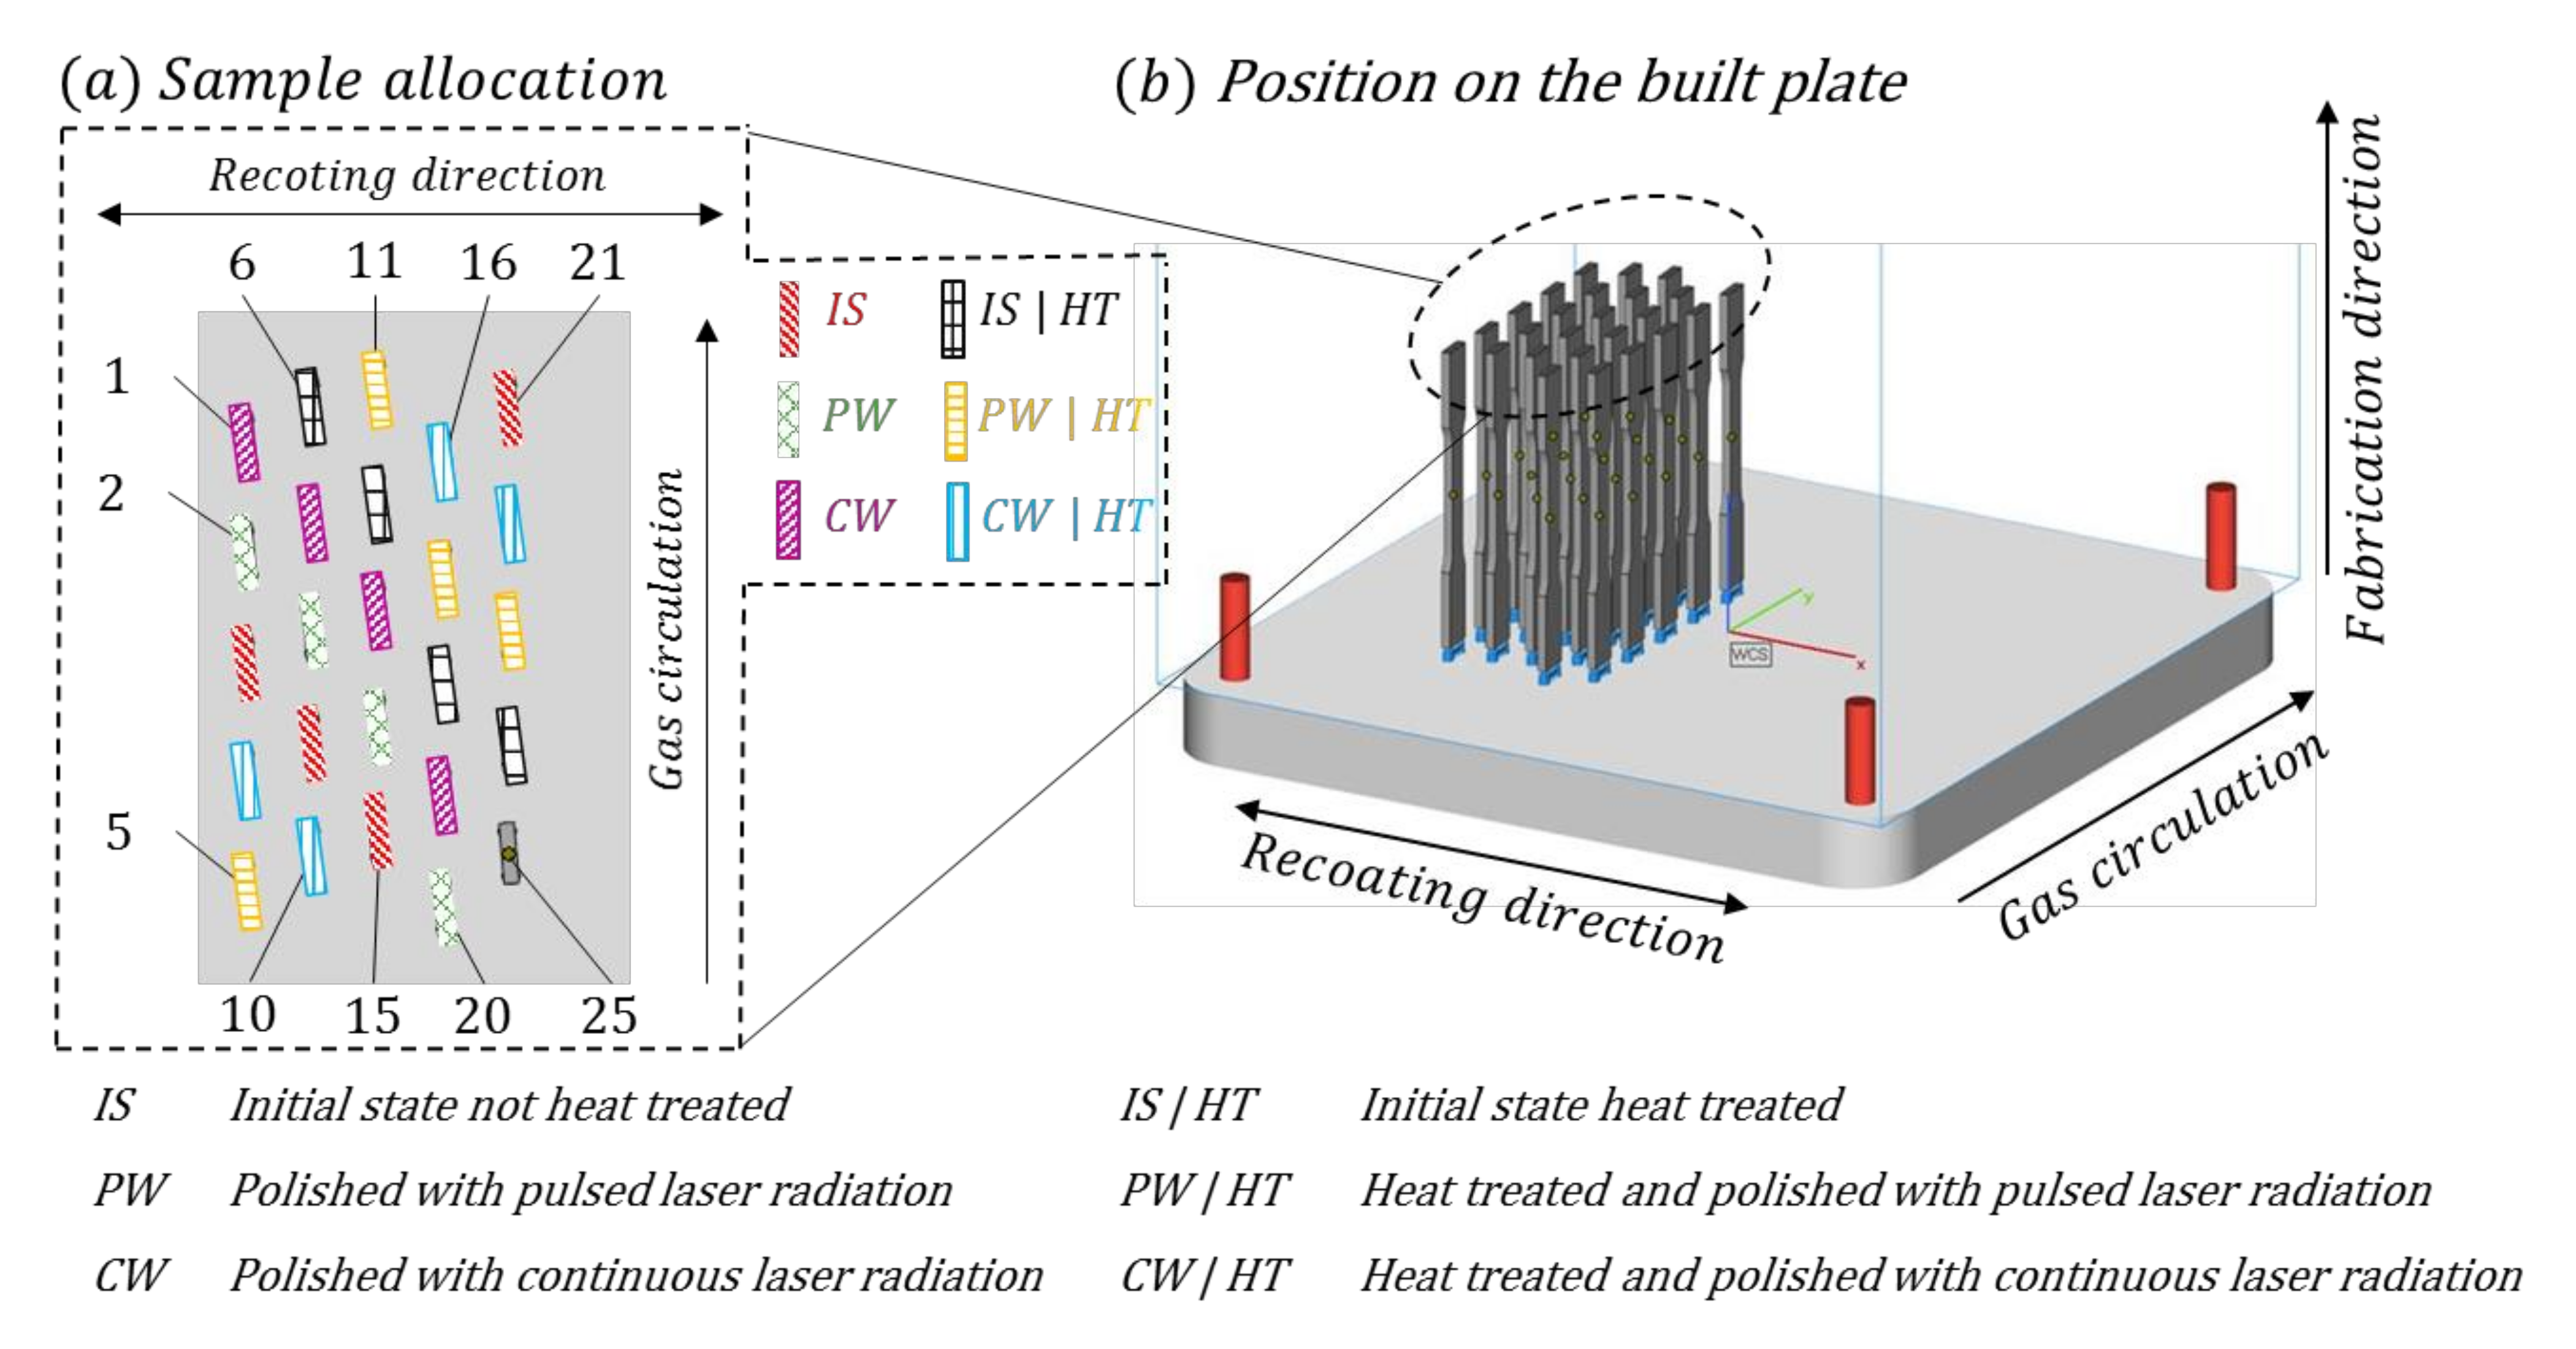
2.1. Material and Samples

The experimental investigations in this study are executed on the aluminium alloy AlSi10Mg. The chemical composition of the used powder, according to the test report of the delivered powder batch in comparison to DIN ISO 1706:2020 [30], is given in Table 1.
The influence of laser polishing on residual stresses and distortion, as well as the resulting material structure and hardness, is analysed by means of a horizontal printed cantilever, see Figure 1. In this, the layer wise L-PBF process introduces rising tensions with increasing cantilever thickness [31]. The specimen with a dimension of 60 mm in length and a width of 10 mm consists of a solid block, which is directly printed on the built platform and a cantilever with a thickness of 3 mm, which is connected to the built platform by support structures, see Figure 1a. Six specimens, positioned nearly in recoating direction, are printed on a built platform (see Figure 1b). L-PBF is carried out on a TRUMPF TruPrint 1000 Multilaser (TRUMPF, Ditzingen, Germany) with a cylindrical fabrication volume (diameter = 100 mm; height = 100 mm). The TruPrint 1000 is equipped with two 200 W fibre lasers with a focal diameter of 55 µm for a parallel layer exposure. The used aluminium powder has a powder grain diameter D10 of 25.4 µm and D90 of 56.3 µm. The average powder grain diameter D50 amounts to 39.5 µm. The aluminium powder grain diameter was measured by the manufacturer at D10 25.4 µm and D90 56.3 µm. The average powder grain diameter D50 amounts to 39.5 µm. Printing of the specimens was executed with recommend process parameters from TRUMPF with a slicing thickness of 20 µm. The outer contour was exposed with a laser power of 175 W and a beam velocity of 2000 mm/s. The core of the part is treated with 175 W, a beam velocity 1400 mm/s and hatch distance of 120 µm.
After 3D printing, the analyzation of the chemical composition of the printed part revealed an almost unchanged composition of the main alloying elements Si = 10.77%, Mg = 0.29% and Fe = 0.12%, see Table 1.
From a manufacturing batch of six specimens, two specimens each for the initial state (IS), pulsed laser radiation (PW) and continuous laser radiation (CW) were used, see Figure 1b. The area and dimension of the rectangular polished area can be taken from Figure 1c. To reveal the differences in the treatments, as well as the process variations, four built platforms were used. To be able to differentiate between stresses and distortions introduced by laser polishing and the freeing of existing residual stresses from the L-PBF process, two print jobs underwent stress-relief annealing in a furnace at 300 °C for 2 h before laser polishing. Two additional built platforms with cantilevers were used for the material investigations. The cross sections were taken from the central position of the laser polished area. A complete sample allocation in terms of heat treatment, performed laser polishing and usage is given in Table 2.
The influence of laser polishing on the mechanical properties of L-PBF AlSi10Mg parts was investigated on flat tensile specimens with a dimension of 12 mm width and 104 mm length and a material thickness of 3 mm, according to DIN 50125:2016-12, see Figure 2. There, laser polishing was executed in the tapered zone on both sides. The polishing area was divided into two polishing sections with a field overlap of 1 mm. Polishing starts at the middle of the area to be treated, which is close to the centre and is executed longitudinally outwards until the area for clamping is reached.
The flat tensile specimens are built up by L-PBF on a SLM280HL from SLM Solutions in a vertical direction, see Figure 3b. The machine has a fabrication chamber with a size of 280 × 280 × 280 mm3. A 400 W Yb-fibre laser with a beam diameter of 70 µm was implemented. The used AlSi10Mg powder has a powder grain diameter D10 of 26.4 µm and D90 of 71.0 µm. The average powder grain diameter D50 amounts to 43.1 µm. The samples were built with recommended fabrication parameters from SLM Solutions and a built platform pre-heating nominally at 200 °C. Printing was carried out with a slicing thickness of 50 µm. The exposure on the outer contour was carried out with a laser power of 350 W and scanning velocity = 600 mm/s. The core of the part is built with 350 W laser power, 1150 mm/s scanning velocity and 170 µm hatch distance.
The investigation on the mechanical properties was divided into six different post-treatment states with four samples per group, see Figure 3a. Therefore, one half of the samples were heat treated (HT) in a furnace at 300 °C for two hours self-cooled over 83 min to 100 °C afterwards to reduce the internal stress, comparable to [32,33,34]. Laser polishing was executed with pulsed and continuous laser radiation with and without the heat treatment in advance. As a reference, tensile samples in the L-PBF initial state without laser polishing were tested.
The specimens were pre-treated by laser cleaning directly before laser polishing, in order to ablate the existing oxide layer and reduce the adhering powder particles from the surface. Laser cleaning was carried out with a short pulse laser TRUMPF TruMark 5020 (TRUMPF, Ditzingen, Germany). Process parameters based on Hofele et al. [35] with an average laser power of 20 W, a pulse duration of 70 ns, a pulse frequency of 65.5 kHz and a beam diameter of 122 µm were applied. A hatching with a track offset of 70 µm in combination with a scanning velocity of 3000 mm/s was used. The laser cleaning cycle was performed three times.

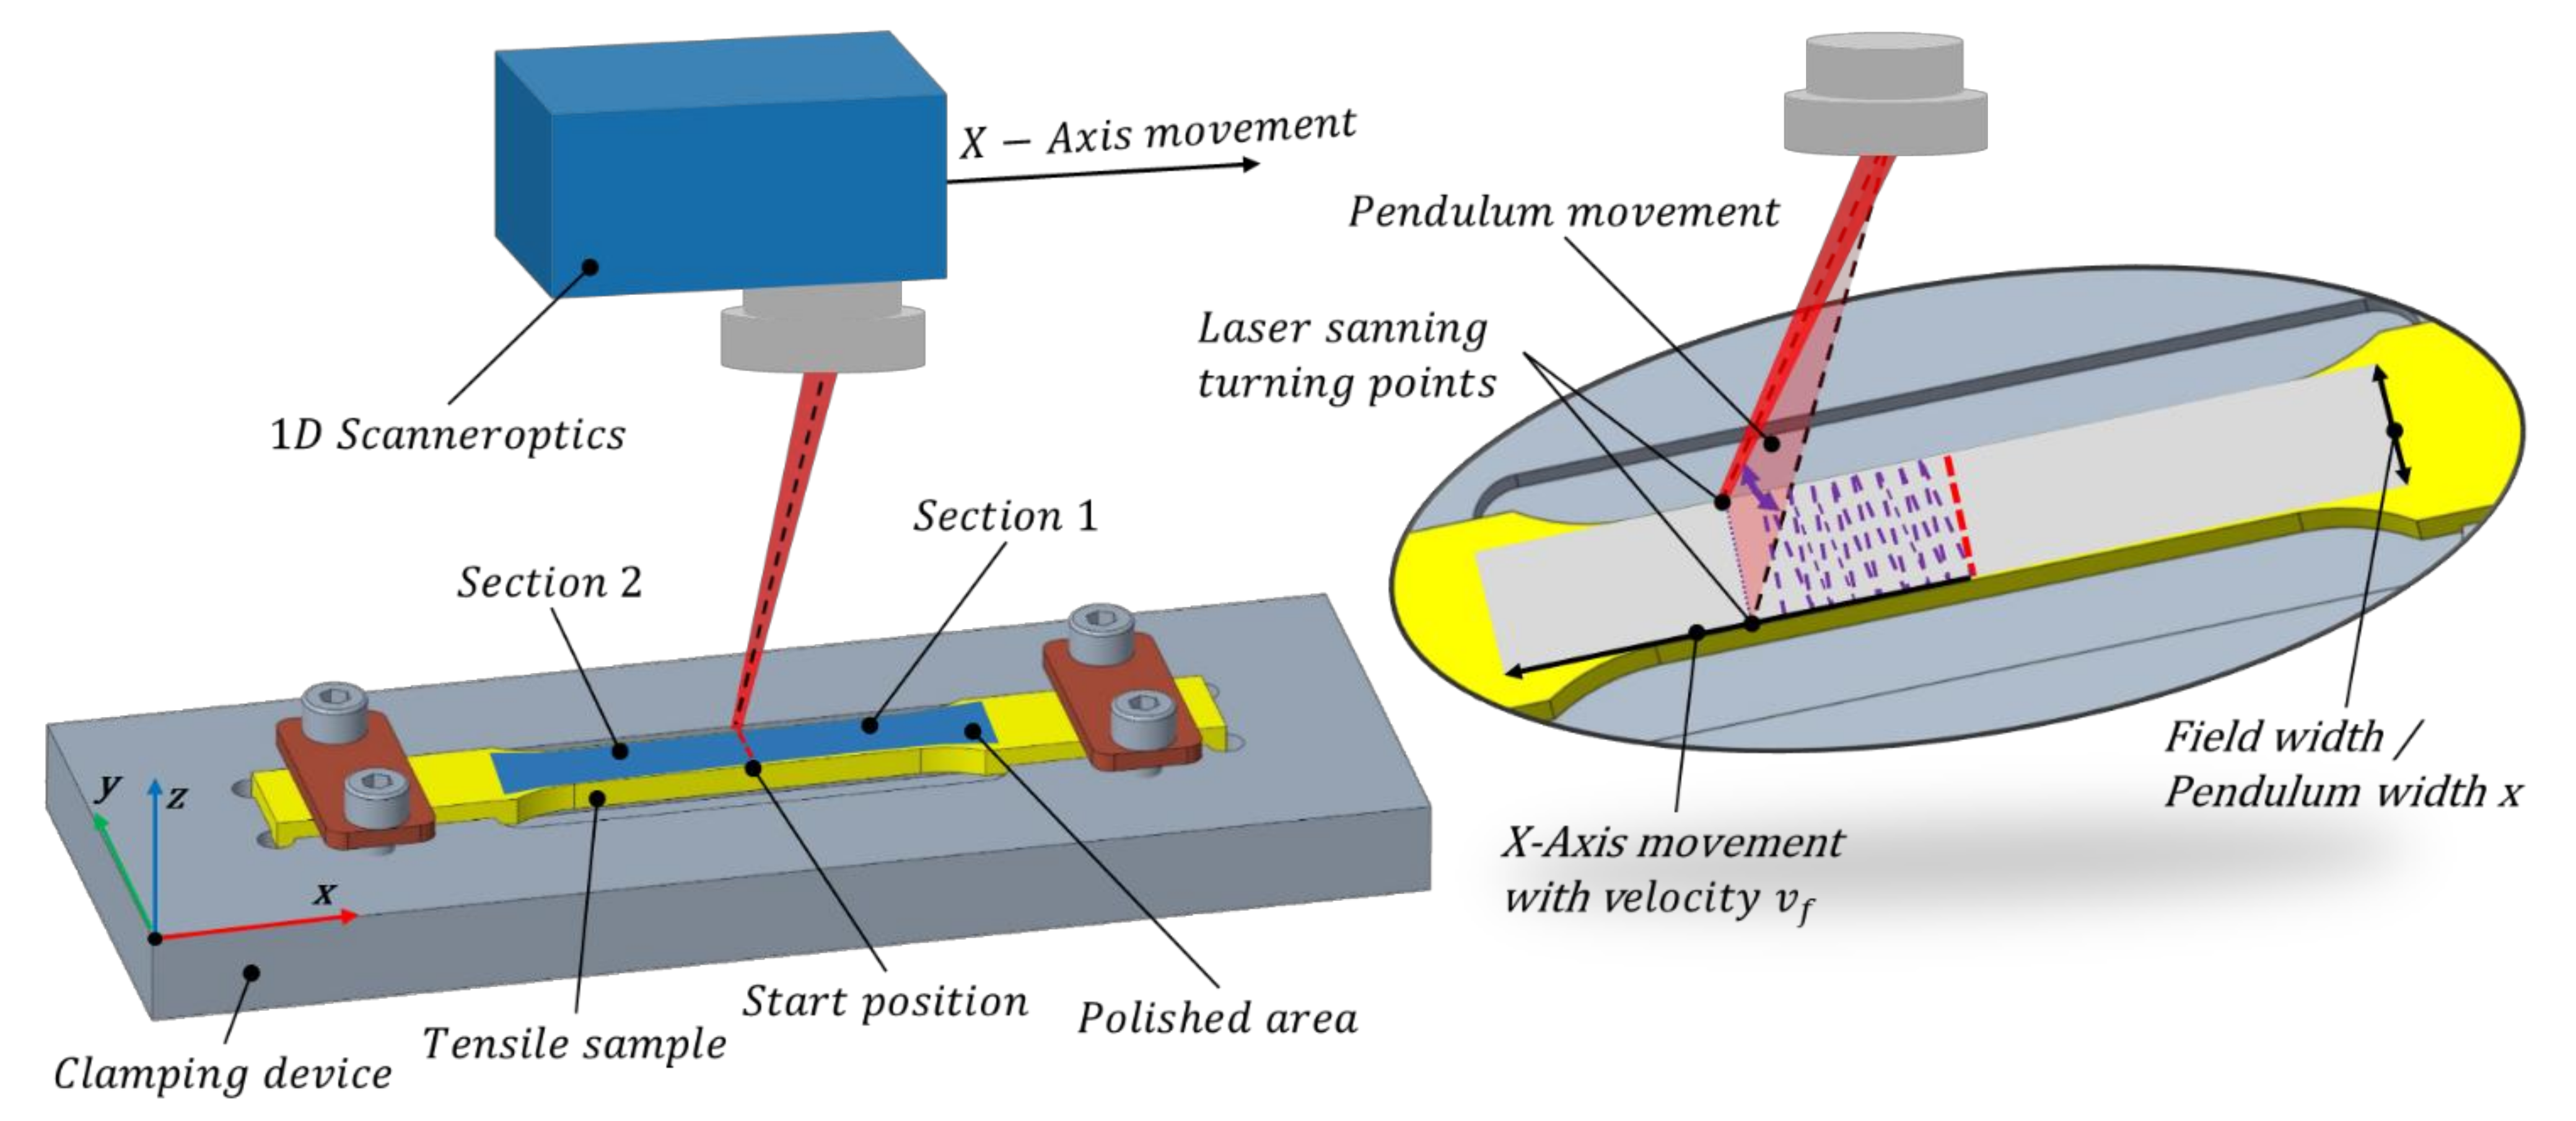
2.2. Applied Laser Polishing Setup

A TRUMPF TruDisk 4002 (TRUMPF, Ditzingen, Germany) with a wavelength of 1030 nm, a max. output power of 4000 W and a gradient index fiber with a diameter of 200 µm and a numerical aperture NA of 0.1 was used. The laser polishing was conducted in a 5-axis TRUMPF Laser Cell TLC 40 (TRUMPF, Ditzingen, Germany), see Figure 4.
The laser polishing was conducted in a process chamber under a purified inert gas atmosphere with monitored residual oxygen concentration with a ORBITALSERVICE PRO2 plus (Orbitalservice GmbH, Heimbuchenthal, Germany). The deflection of the laser beam in y-direction is achieved by one-dimensional (1D) FRAUENHOFER IWS SAO 1.06/1D scanner optics (Fraunhofer IWS, Dresden, Germany), which offers a maximum pendulum frequency f P of 300 Hz, see Figure 4. The focusing lens exhibits a focal length of 230 mm, which results in a focal diameter of 450 µm. The average pendulum speed vP,avg in the focal plane at a pendulum width x can be calculated by Equation (1)
v P ,   a v g = 2 · x · f P
Figure 5 gives a schematic illustration of the one-dimensional scanner beam deflection, in conjunction with the axis machine movement in X-direction. During laser polishing, the vertical printed tensile specimens were mounted horizontally in a clamping device. The X-direction is equal to the fabrication direction of the L-PBF process. Consequently, the laser beam was oriented perpendicular to the vertically built surface.

2.3. Used Process Parameters for Laser Polishing

Laser polishing was executed with pulsed and continuous laser radiation with one polishing pass. During polishing, the process chamber was flooded with Argon. The process started with a residual oxygen content below 50 ppm. Polishing was carried out with a defocussed laser with a focal position z of 12 mm above the surface and a laser beam diameter at the workpiece of dl = 1298 µm. The process parameters for the cantilever tests and the tensile tests can be taken from Table 3. Basic process parameters for both laser operation modes were taken from Hofele et al., 2021 [25]. In order to improve the polishing result, depending on the geometric shape of the specimen, different laser powers for the cantilevers and the tensile specimens were taken at the continuous laser operation mode.
For the optimisation of the remelting process on the edges of the specimens, individual power curves over the scanner pendulum movement for the tensile tests and cantilever tests were implemented, see Figure 6. The cantilever specimens are treated with a laser power at the turning points of 1320 W with pulsed laser polishing (PW) and 640 W with continuous laser polishing (CW). At the tensile specimens, the laser power at the turning points was reduced to 720 W (PW) and 360 W (CW), respectively.

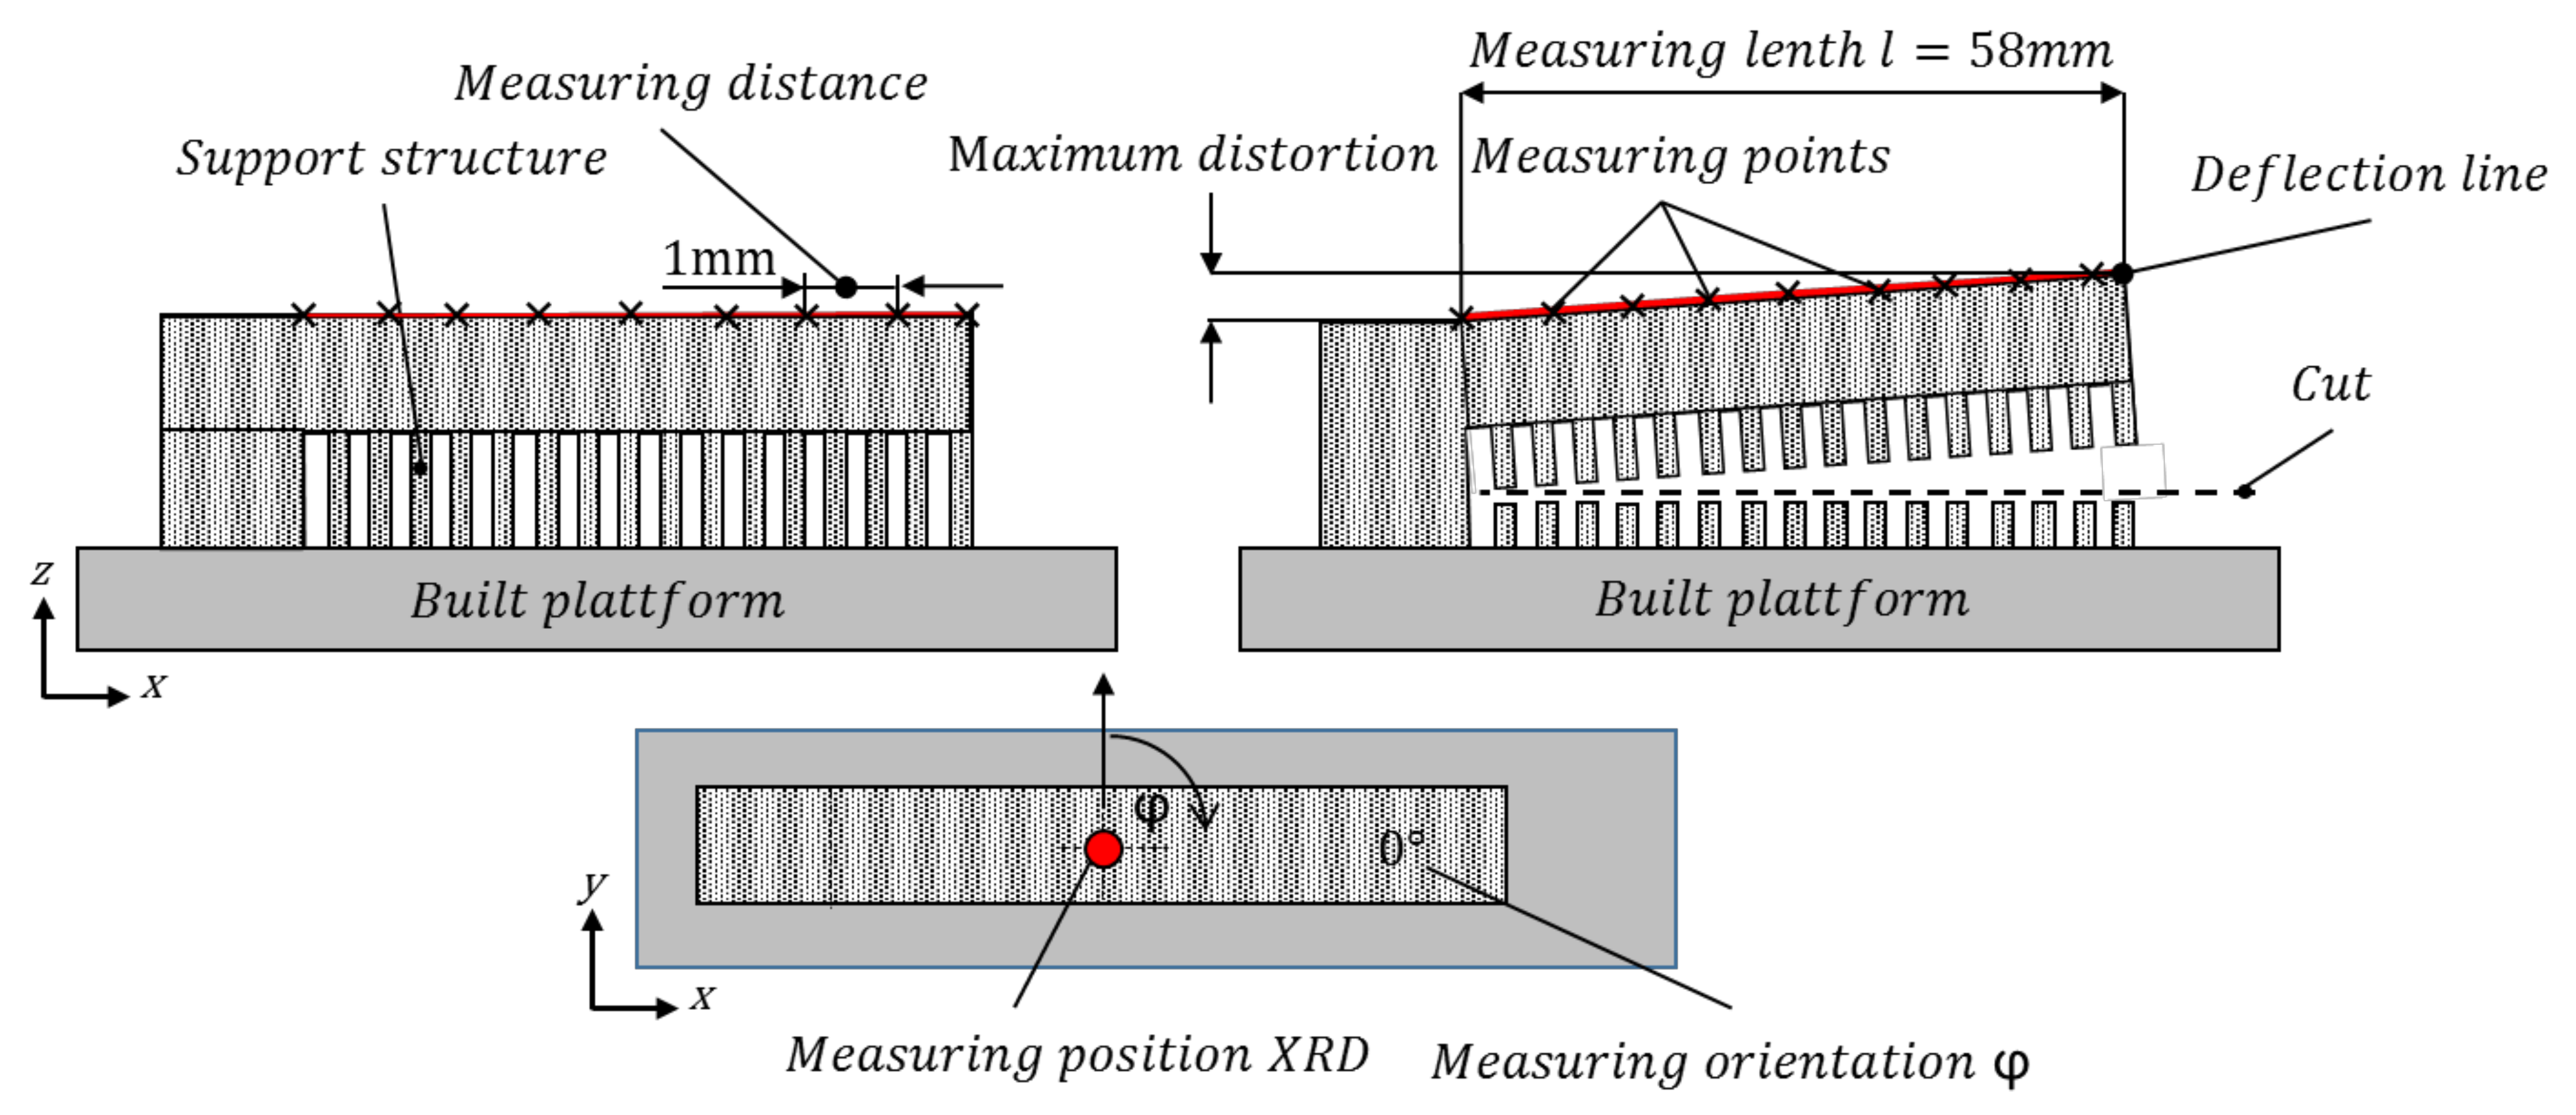
2.4. Measurement Devices and Evaluation Methods

The surface roughness Ra is measured tactilely by means of MAHR MarSurf M400 perthometer (Mahr GmbH, Göttingen, Germany). According to EN ISO 4288:1997 [36], for the initial surface with Ra >> 2 μm, a cut-off wavelength of 2500 μm is used, whereas for the polished surfaces with Ra < 2 μm the cut-off wavelength is set to 800 μm. The linear measurement takes place on the tensile specimens in a loading direction (in fabrication direction). The roughness of the cantilevers is analysed lengthways (in x-direction).
The chemical composition of the printed parts is analysed by means of an elemental emission spectrometer of type BRUKER Q4 Tasman (Bruker, Billerica, MA, USA).
The surface behaviour and the failure plane is analysed using an optical microscope of type CARL ZEISS Axio Zoom V16 (Carl Zeiss AG, Jena, Germany) with a 50-fold magnification. This analysis is complemented by scanning electron microscopy (SEM) and energy dispersive X-ray spectroscopy (EDX) on a CARL ZEISS Sigma 300VP microscope. The remelting zone geometry and relative porosity is analysed on polished and etched cross sections with a 200-fold magnification by use of a CARL ZEISS Vario Axio Imager.Z2 Vario. The porosity is measured via threshold-based image analysis using the ZEISS Zen core software (3.2).
The micro hardness is analysed by means of a STRUERS Durascan 70 G5 with Vickers (EMCO-TEST Prüfmaschinen GmbH, Kuchl, Austria), according to DIN EN 6507-1 [37], with a load of 0.1 N (HV 0.1), in order to realize hardness indentations within the small remelting zone. Thereby, it should be noted that the measured hardness values can be increased compared to hardness tests determined with a higher test load.
The height profile and the distortion of the cantilever was measured tactilely with a CARL ZEISS DuraMax coordinate measuring device with a measurement accuracy of 2.4 µm before laser polishing, after laser treatment and cutting of the support structure. The tactile measurement was carried out in an interval of 1 mm over a length of 56 mm, starting at the start position of L = 2 mm up to the end position of L = 58 mm, see Figure 7. Two parallel measuring lines were created on each cantilever and averaged afterwards. After laser processing, the cantilevers were separated from the substrate plate at their support structures with a water-cooled cutting machine (STRUERS Discotom-100, Struers, Willich, Germany) and tactilely measured again.
A strain-controlled Schenck RSA 100 universal tensile testing machine (Schenck, Germany) with a maximum load of 100 kN, equipped with a corresponding load cell was used to carry out the tensile tests. The tensile tests were carried out with a test speed of 5 mm/min based on DIN EN ISO 6892-1 [38]. In addition, the strain of the sample was measured with a built-in extensometer with a measuring length of 2 mm.
The residual stress of the cantilevers in the initial and annealed state was analysed non-destructively, employing X-ray diffraction (XRD) according to DIN EN 15305. Measurements were conducted on a Stresstech Xstress 3000 G2R (Stresstech Ltd., Jyväskylä, Finland) equipped with a Cr-tube (operated at 30 kV, 8 mA), a 3 mm pinhole collimator (9.9 mm away from the cantilever surface), and two position-sensitive detectors with V-filters mounted in front of these. The x- and y-centre of the supported section on the top surface of the respective cantilever coincided with the goniometer centre and, hence, represented the measuring position, see Figure 6. The instrument operates in modified χ -geometry, where χ describes the angle between the normal to the sample surface and the normal to the diffracting lattice plane. It was set up to record the {222}-fcc-peak for various χ -angles between −45° and 45° in a specific tilt-plane, which is normal to the cantilever surface and contains the goniometer centre. The peak position was subsequently determined by fitting pseudo-voigt-functions (applied separately to the K α , 1 and K α , 2 component) to the records. Finally, an evaluation of these position values with a simplified triaxial model ( σ 33 = 0 ), relying on the diffraction elastic constants E = 70,600   MPa and ν = 0.34499 , yielded the normal and shear residual stress values just below the sample surface in the direction of the tilt plane. Repeated measurements at orientation angles φ   of 0°, 30°, 60°, 90° and 150° between the tilt-plane and the traverse axis of the cantilever (y-axis) access residual stress values in the respective direction.

3. Results and Discussion

3.1. Influence of Laser Polishing on the Internal Stress and Distortion

The investigations on the cantilevers were carried out according to Figure 1 at a L-PBF built platform with two unprocessed and two polished samples in each case with pulsed and continuous laser radiation, see Figure 8. Polishing with pulsed laser radiation revealed a homogeneously treated surface. CW laser polishing exhibits, after polishing, still visible surface structures on the surface, see Figure 8. When comparing the surface appearance in contrast to the laser cleaned unpolished area, pulsed mode polishing results in a darker surface, which was already noticed elsewhere [25].
The cantilever specimens exhibit an average roughness Ra in the L-PBF initial state of Raavg = 8.68 µm. Laser polishing with continuous laser radiation (CW) can reduce it to Raavg = 2.56 µm. With pulsed laser radiation an average roughness reduction to Raavg = 0.87 µm was reached, see Table 4.
In comparison to laser polishing of vertical built surfaces, where a roughness reduction rate of 91.6% with pulsed mode polishing and 95.8% with CW-polishing is reached on 2 mm thick samples [25], the roughness reduction ability on the top surface with a different initial microstructure was reduced. At pulsed mode polishing (PW), an average roughness reduction rate of 90.0% is achieved. With continuous laser radiation (CW), set up with a laser power of 1000 W, the average roughness reduction rate decreased to 70.5%.

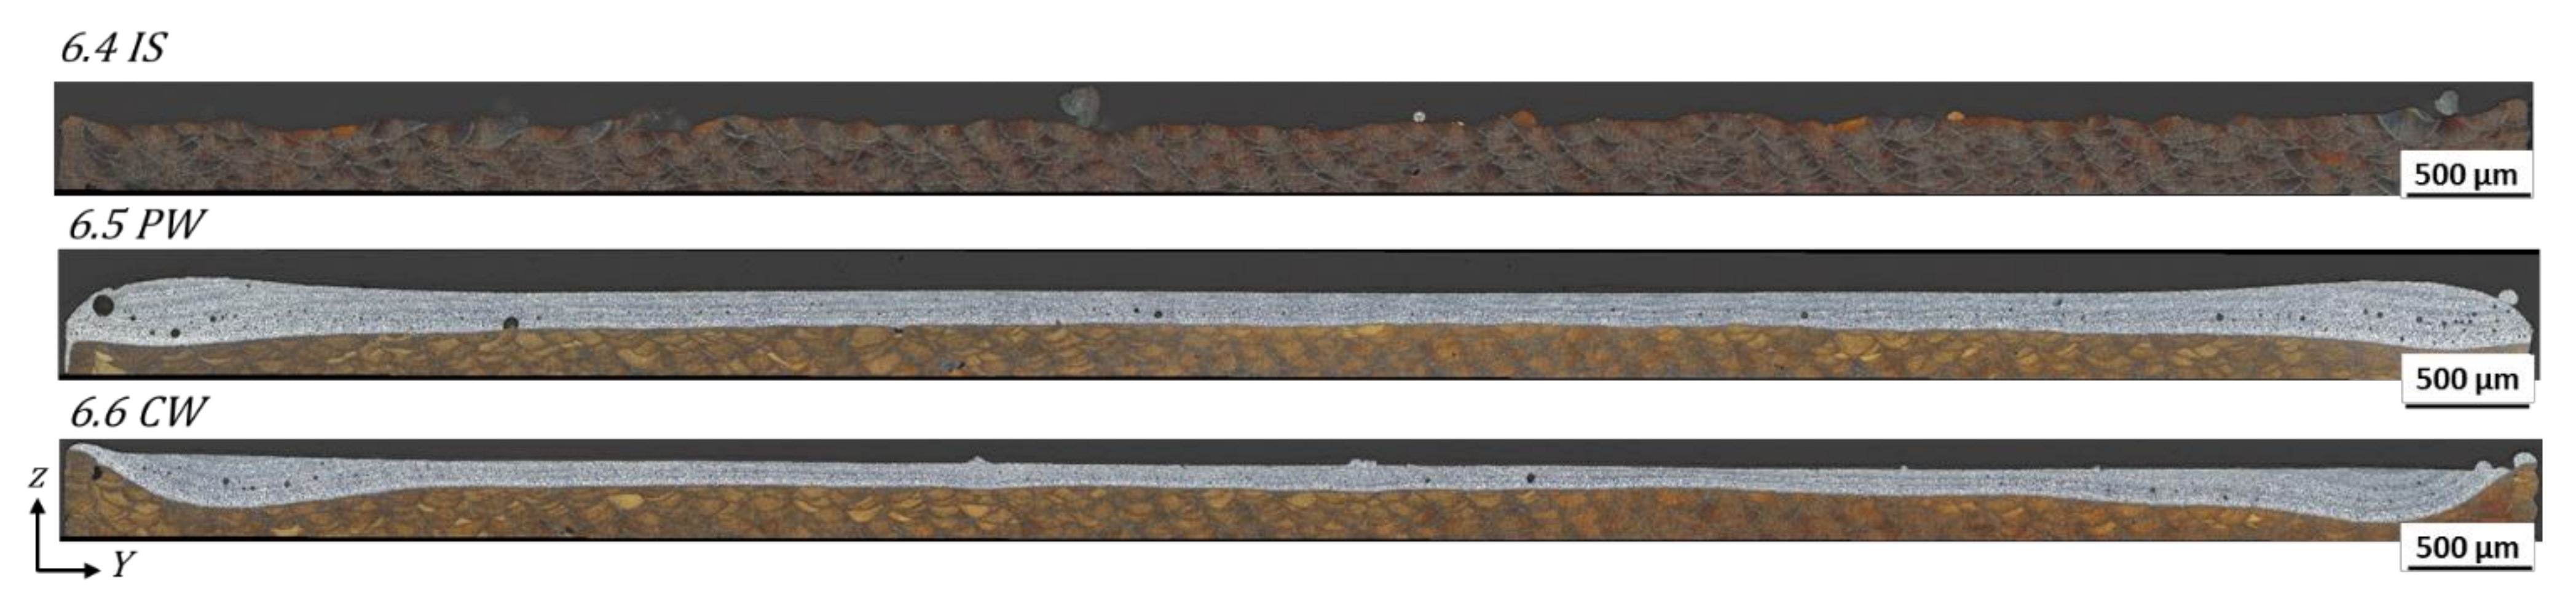
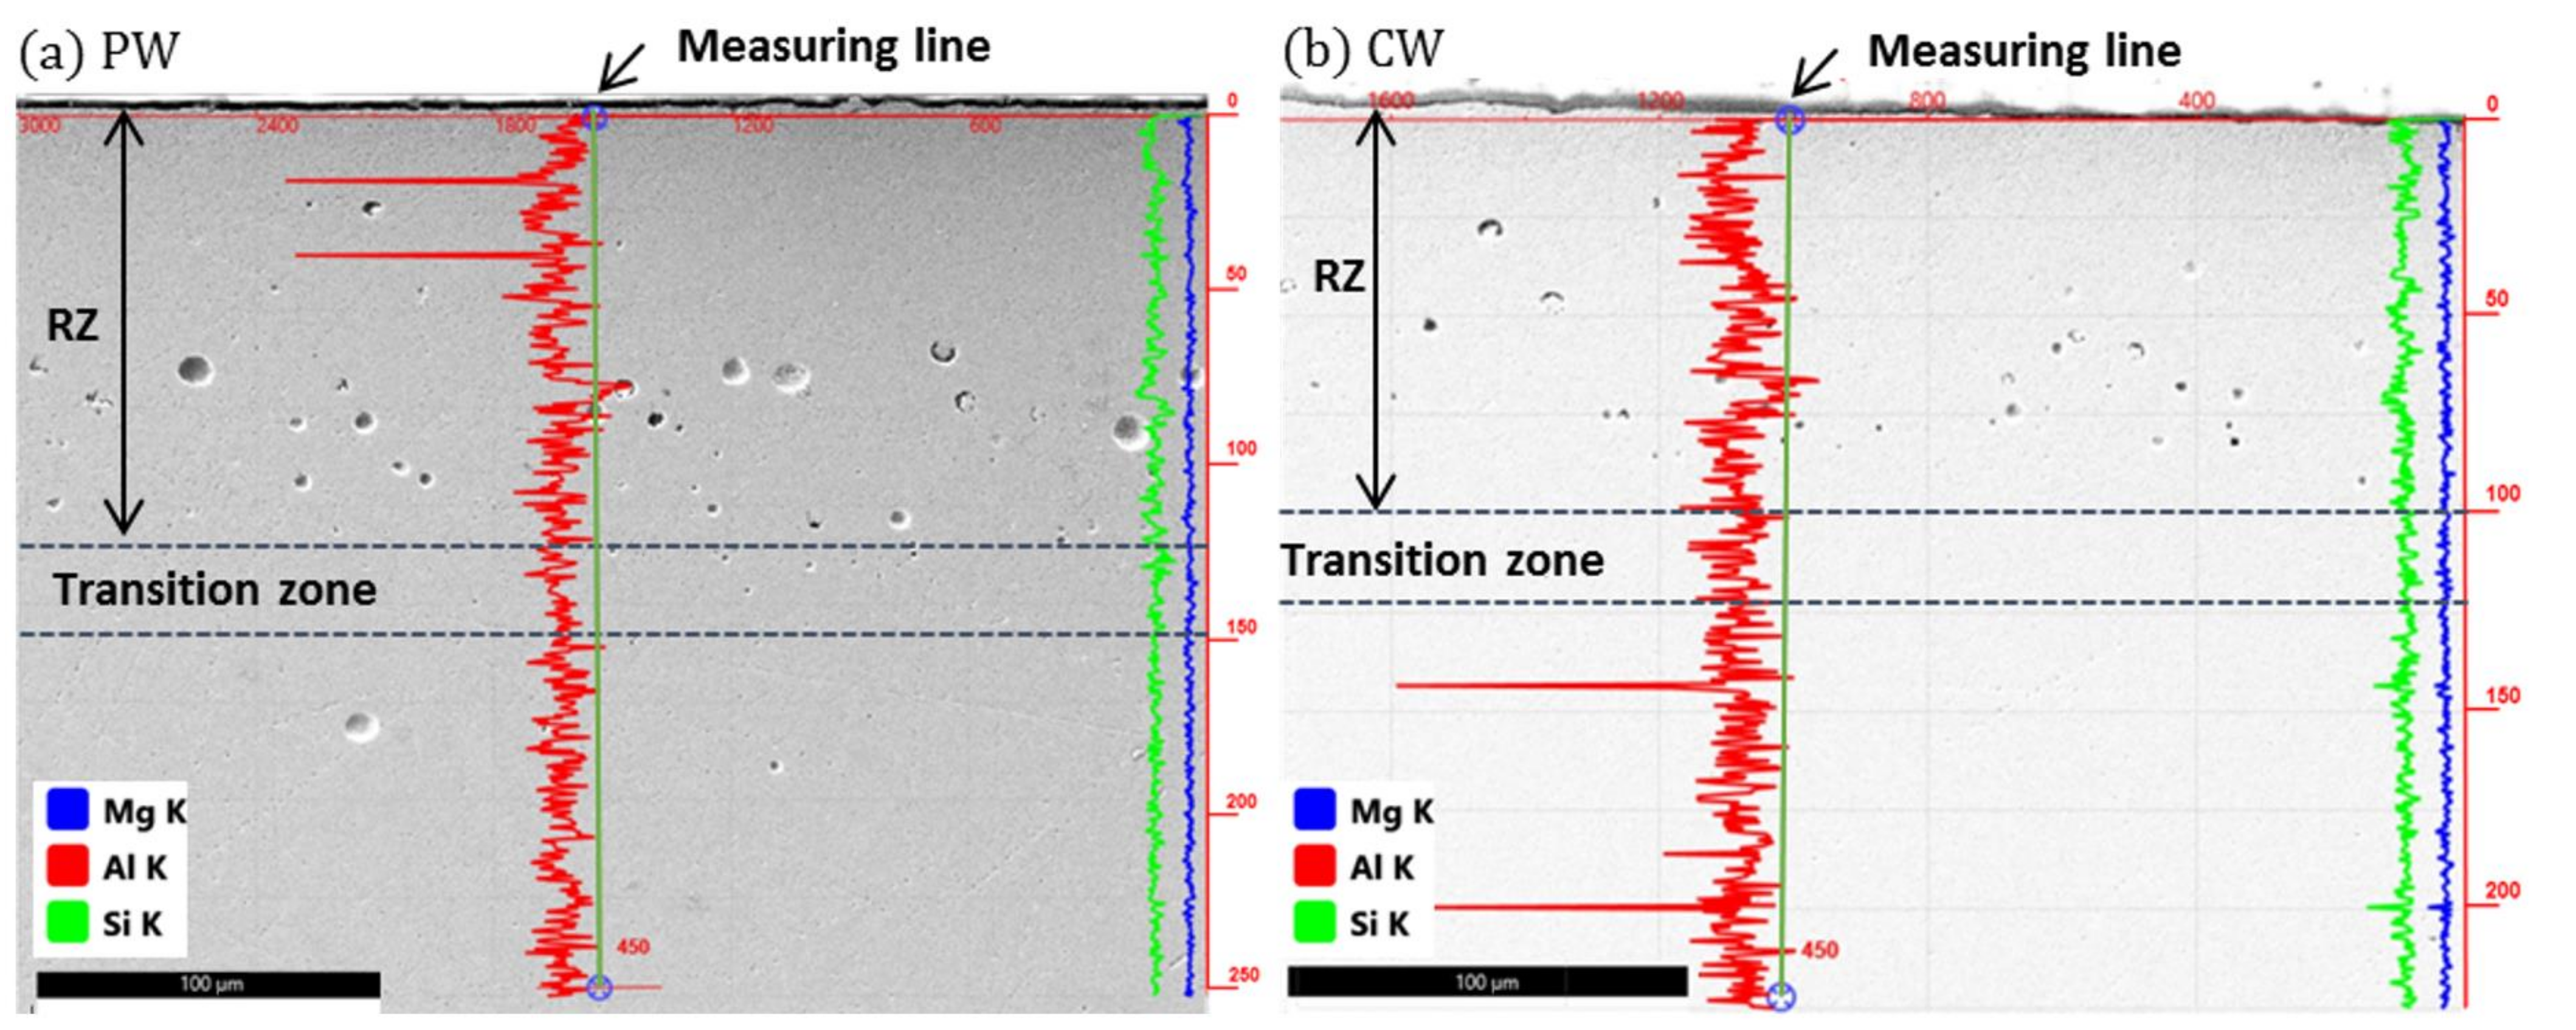
3.1.1. Analyzation of the Remelting Zone

The resulting remelting zone, analysed by cross sections at the centre of the polishing length, shows considerable differences between the laser operation modes, see Figure 9. With pulsed laser radiation, a material accumulation in combination with a rounding of the edges can be observed. With CW laser polishing, a flat surface profile with an increased melt pool depth at the turning points of the laser beam deflection can be seen. Starting from the maximum remelting depth, the remelting depth decreases continuously up to the component edge. The remelting zone at the analysed cross sections exhibits sporadic pores. The porosity measurement revealed for pulsed mode polishing (PW) a relative porosity of 2.2% and, with continuous laser radiation (CW), a porosity of the remelting zone of 1.3% in the considered cutting plane.
The remelting depth s, measured according to the schematic illustration in Figure 10, is characterized with nine measuring points with a measuring point distance of 1 mm. When comparing the average remelting depth, polishing with pulsed laser radiation (PW) results in a considerably deeper remelting depth. Thus, at pulsed mode polishing, the remelting depth is in the range of 132–237 µm. CW laser polishing results in a remelting depth of 101–218 µm. Furthermore, heat treatment in a furnace before laser polishing has no significant influence on the remelting process.

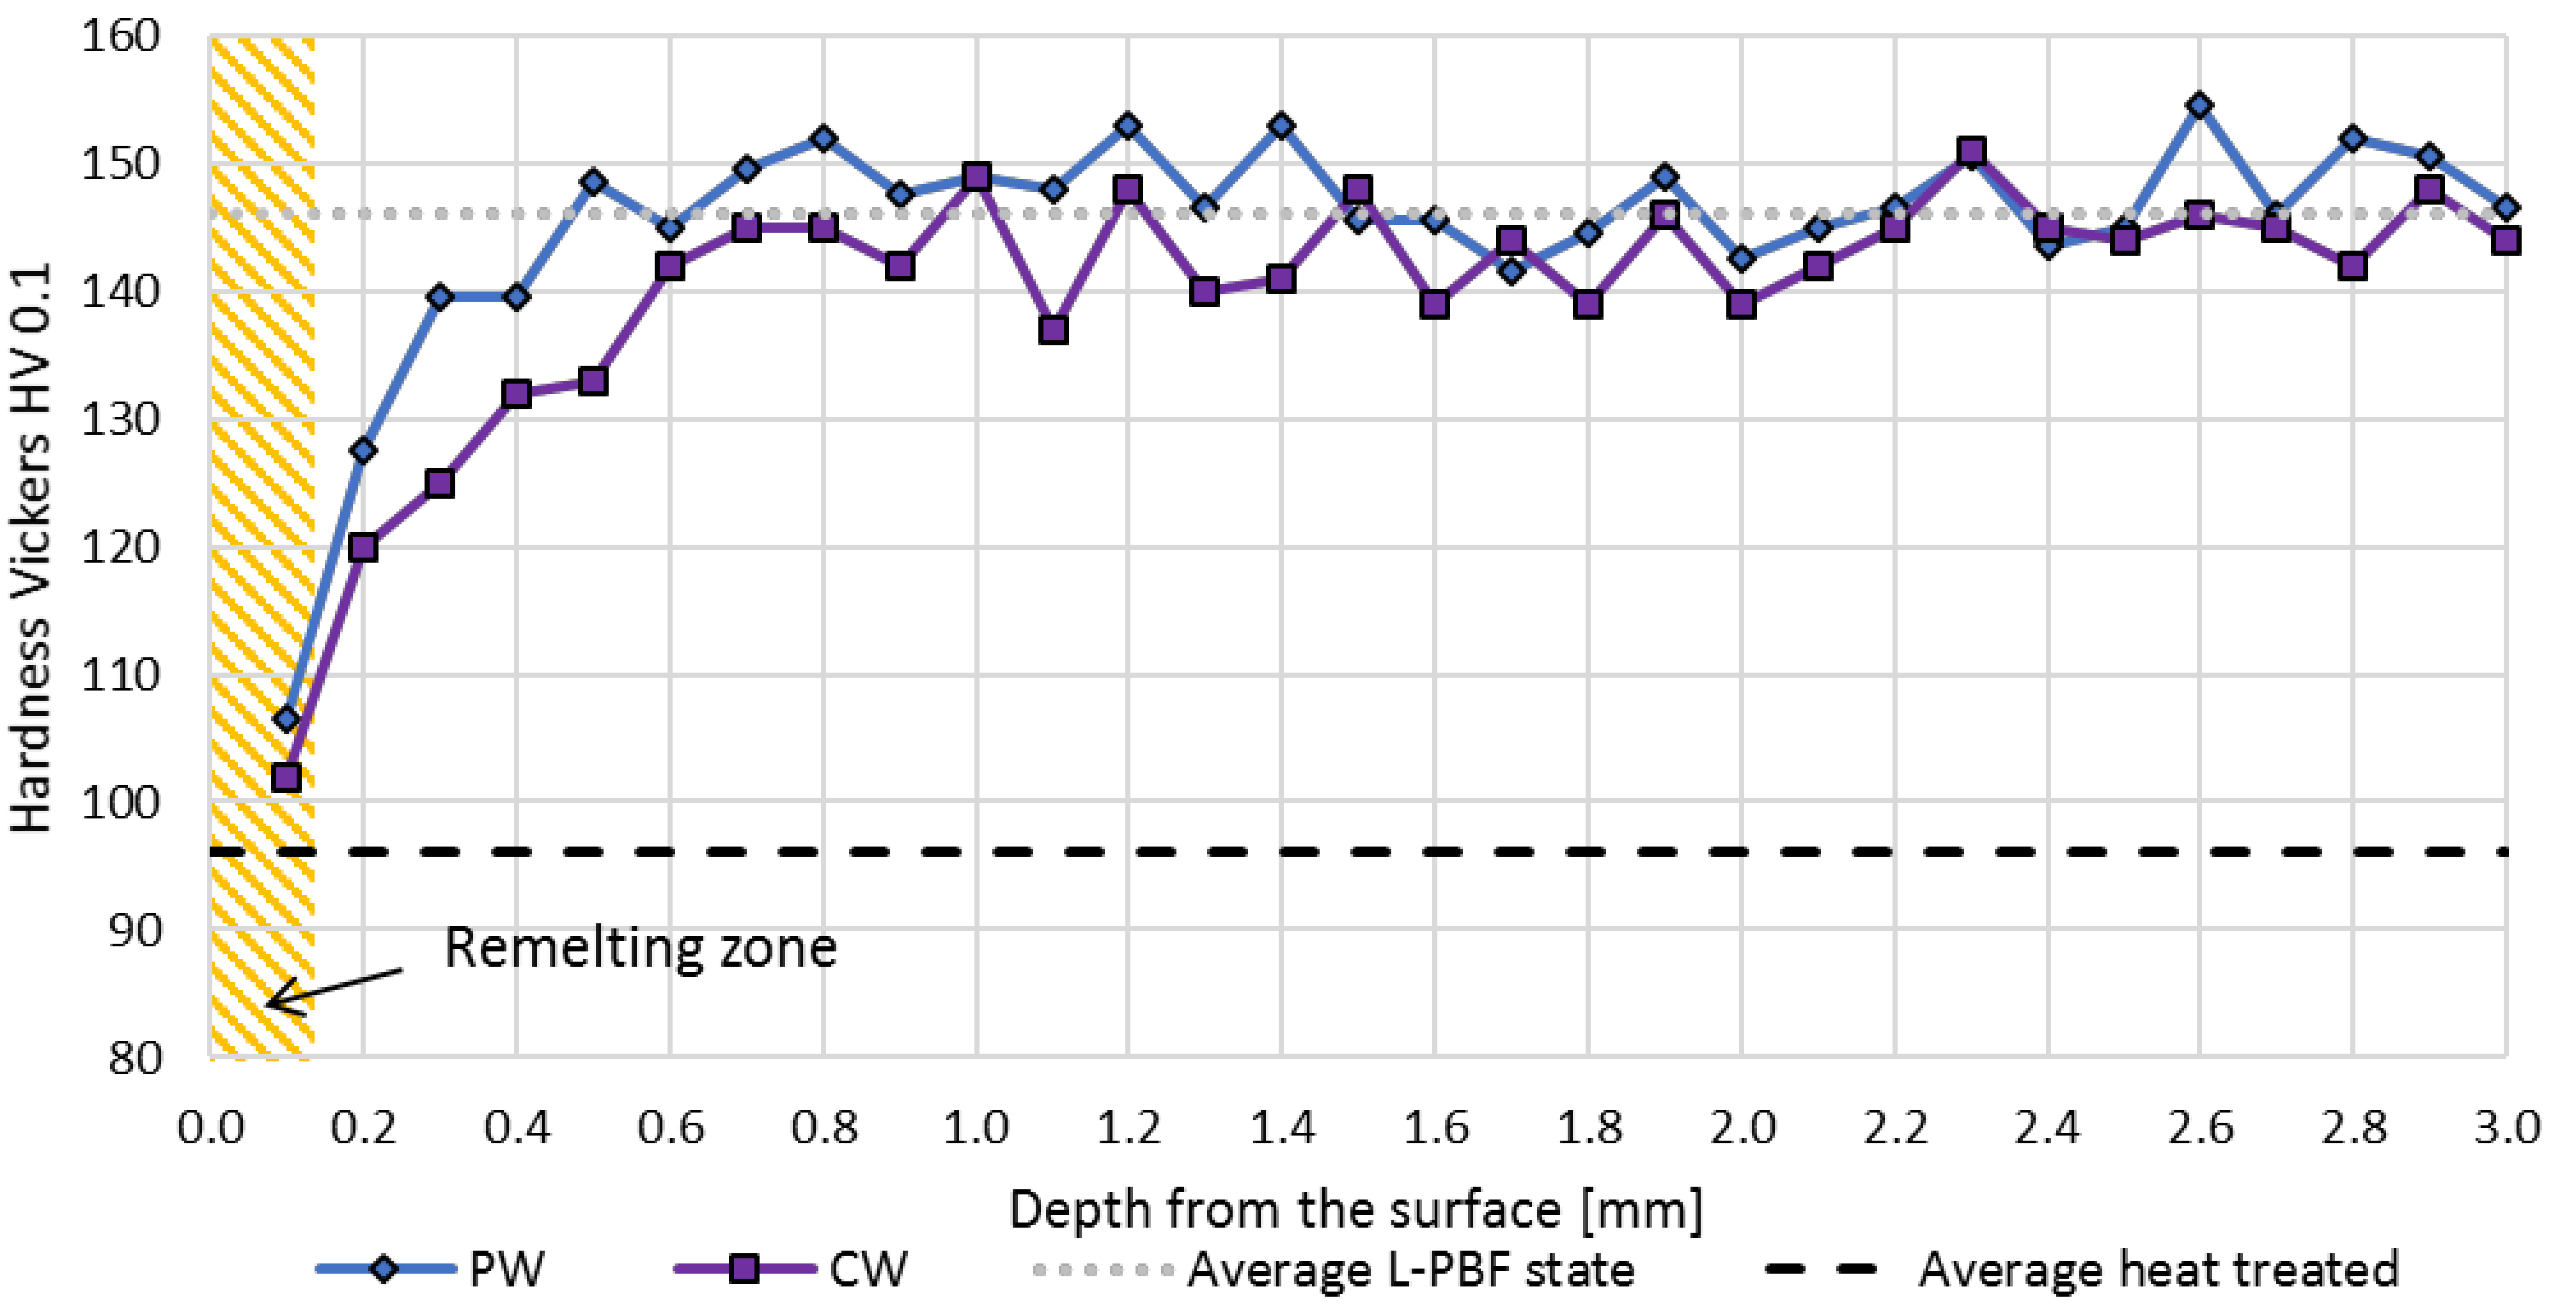
3.1.2. Microstructure and Hardness

The microstructure of the hypoeutectic aluminium-silicon alloy (AlSi10Mg) at the etched cross sections of the initial L-PBF parts (IS), the resulting changes of the material structure due to heat treatment (IS, heat treated), and the resulting microstructure in the remolten surface layer by polishing with pulsed laser radiation (PW) and continuous laser radiation (CW) are given in Figure 11. In the initial state, the component consists of the typical superimposed weld tracks of the L-PBF process, see Figure 11a. Due to the extremely fast scanning speed of 1400 mm/s at L-PBF, a fine microstructure with very small dendrites of the α-phase (bright coloured) occurs. At the borders of the melting zone of each weld seam due to remelting between the laser beam paths and layers, a zone with slightly increased microstructures of primary Al-phase exists with a width of 2–8 µm, comparable to [39]. Annealing at 300 °C for 2 h causes a reduction in the visible transition zones between the welding paths, see Figure 11b. There, the differences in the microstructure between the aluminium α-phase and eutectic phase are equalised by diffusive dissolution, which was also observed and discussed at [39,40]. Laser polishing with both laser operation modes (PW and CW) results in significant structural change. The re-melting iterations during laser polishing with the used track overlaps of 93.7% (CW) and 94.9% (PW), respectively, leads to a coarsening of the material structure, which tends to from a structure known from cast parts. The dendritic structures of the α-phase are predominantly vertically aligned due to their growth from the melting zone bottom, where the solidification starts from the bottom to the top. For pulsed mode polishing, and as the presented cross section is almost perpendicular to the pendulum movement, the remelting zones of the overlapping laser pulses become visible (marked in a red dotted line of Figure 11c). In addition to the L-PBF scanning paths at the border of each single remelting zone, a coarsened α-phase can also be observed. At laser polishing with continuous laser radiation, a surface parallel layered remelting zone exists due to multiple remeltings caused by the track overlap of 93.7%, superimposed with the existing gaussian-like laser beam intensity profile, see Figure 11f. Polishing with both laser operation modes results in the formation of scattered pores with dimensions below 20 µm.
A more detailed view of the existing microstructures is given by the SEM images of the etched cross sections in Figure 12. While at the L-PBF initial state structures of the aluminium α-phase are in the dimension of sub microns (dark grey areas at the bottom of Figure 12b,d), a considerably larger microstructure of the α-phase and eutectic phase (bright structures), which exists at the remelting zone of laser polishing. With pulsed mode polishing (PW), at the transition zone between the remelting area of each pulse, a partly melted zone and heat affected zone exists, which causes a changed microstructure, visible in the outlined area 2 in Figure 12a. There the eutectic phase is partly changed from lamellar to a predominant spherical shape. At continuous mode polishing, similar transition zones, see, e.g., area 3 in Figure 12c, are created due to the iterative remelting caused by the used track overlap of 93.7%. With both laser operation modes, a closed bright surface layer is visible, which may consist of Silicon or an oxide layer by reaction of the melt pool with the residual oxygen in the process chamber, see the marker labelled with number 4 in Figure 12.
The EBSD analysis shows that in the L-PBF initial state, the individual weld tracks consist predominantly of elongated grains in the dimension of the major axis of 15–40 µm, which are preferentially oriented in a built direction, see Figure 13. Sporadic epitaxial grain grown over several weld tracks can be seen at the L-PBF base material, with grain sizes in the major axis of up to 110 µm (Figure 13 position 3) and into the remelting zone of the polishing process, see Figure 13 position 4. At the edge of the individual overlapping weld tracks, a finer structure with equiaxed grains smaller than 10 µm exists due to the heat affection by subsequently added and adjacent weld tracks. The same effect can be seen in the transition area between the laser-polished remelting zone and the L-PBF base material. Within the polished remelting zone, the shape of the grains changes towards the surface from columnar to equiaxed. Directly beneath the surface, small grains with dimensions below 15 µm are created. Overall, fundamental differences in the formed grains between the used laser operation modes CW (Figure 13a), where a constant melt pool is created, and PW (Figure 13b), with a pulsed discontinuous energy input, do not exist.
The influence of laser polishing on the material hardness, analysed in a vertical direction with a measurement point distance of 0.1 mm through the material thickness of 3 mm, is given in Figure 14. At a depth of 0.1 mm below the surface, within the remelting zone (RZ), the material hardness amounts to 102 HV 0.1 with CW-polishing and 106 HV 0.1 with PW-polishing, which is a hardness reduction of 40–44 HV 0.1, in comparison to the average L-PBF state, and tends to reflect the average hardness after heat treatment of 96 HV 0.1. Underneath the remelting zone within the heat affected zone, a hardness reduction up to a depth of 0.4 mm with PW-polishing and 0.6 mm with CW-polishing occurs.
When focusing on the surface near the area measured in a measuring line 0.1 mm below the surface, the average micro hardness of the initial L-PBF state (as-built) amounts to 146 HV 0.1, see Table 5. Therefore, this lies above the collected hardness variations of 84–134 HV 1, depending on the used scanning parameter, orientation of the parts on the built platform, and pre-heating of the built platform given by Sert et al. [1]. Within the remelting zone after laser polishing, an average hardness reduction of 42–44 HV 0.1 can be observed. Between the different polishing strategies with pulsed and continuous laser radiation, no significant differences can be observed. Annealing (300 °C, 2 h) results in a hardness reduction of 50 HV 0.1 to an average value of 96 HV 0.1, which range on the same hardness level as presented by [32], where 93.1 HV 1 was measured after identic annealing conditions starting from 119 HV 1 (as built). If laser polishing is executed after annealing (heat treated state) a hardness increase within the remelting zone to an average hardness of 116 HV 0.1 (CW-polished) and 115 HV 0.1 (PW-polished) occurs, which is considerably higher compared to laser polishing the initial L-PBF state (as-built).
For a qualitative comparison of the chemical composition of the remelting zone and the initial L-PBF material, areal measurements using EDX at the cross section are carried out. Through laser polishing with both laser operation modes, the average chemical composition between the surface near the remelting zone and the L-PBF initial microstructure is unchanged, see Table 6. Between both operation modes, slight differences regarding the silicon content can be measured.
An EDX line scan from the polished surface through the remelting zone and the transition zone into the initial L-PBF material was performed in order to analyse homogeneity and find segregation, see Figure 15. Based on the three main alloying elements Al, Si, and Mg, the measurements reveal a homogeneous material composition throughout the sample, including the remelting zone (RZ) and the initial L-PBF core for both laser operation modes.

3.1.3. Analyzation of Residual Stresses and Distortions

In the initial L-PBF state, the cantilever geometry exhibits high residual stresses in tension between 118 and 162 MPa (see Figure 16) and negligible ones in shear of 3.5–0.1 MPa for all the measured directions parallel to and just below the sample surface. Generally, the directional dependence of these stresses is not pronounced. The highest tensile stress value is found to be on an φ-angle of 60° in relation to the transversal direction of the cantilever. The principal stresses are calculated to be σ 1 = 162 MPa and σ 2 = 118 MPa. In contrast to the initial state, specimens after stress relief treatment/annealing at 300 °C for 2 h, while still attached to build the platform, exhibit almost no residual stresses. Their measured residual tensions are in the range of 0.7–9.9 MPa, which is mostly within the precision 6   MPa , 6   MPa interval, tolerated as a stress-free state during calibration. The accuracy and precision of all these measurements could, additionally, be affected by minor violations of the fundamental assumptions applied for the residual stress calculations regarding the roughness, microstructure, and finite geometry of the samples. Hence, the presented residual stress values are qualitative in nature.
For cantilevers in the polished state, regardless of the laser operation mode, the XRD peak intensities varied heavily with the applied χ -angles. This could indicate the presence of a strong texture and, hence, a major violation of the fundamental assumptions. Stress values for these states are therefore not presented here.
After disjoining the support structures between the cantilever and the built platform, the relieve and redistribution of residual stresses within the cantilever results in distortion and a bending upwards motion. The widening of the kerf and the bending of the cantilevers at the front side is shown in Figure 17. Without heat treatment, the specimens in the initial state exhibit the highest distortion. With pulsed laser polishing (PW), the bending is visibly reduced. CW laser polishing results in further reduction in the distortion. The cantilevers on the built platform, after heat treatment/annealing, exhibit a strongly reduced distortion in the initial state (IS) without laser polishing. Laser polishing afterwards causes increased bending in comparison to the annealed state without laser polishing, see Figure 17b.
The displacement as a function of the length of the cantilever, given by the differences in the height profile of the surface after post processing of the cantilevers by annealing, and laser polishing before and after cutting of the support structures, is shown in Figure 18.
The displacement due to residual stresses, introduced by the L-PBF 3D printing process, can be decreased at the frontside of the cantilever (measuring length = 58 mm) from 1.64 mm to 0.26 mm by annealing in a furnace at 300 °C for two hours. Laser polishing also leads to a reduced maximum displacement of 0.42 mm with CW-polishing and 0.89 mm at the pulsed mode (PW). Thus, the remelting process of laser polishing with its large melt pool with a laser beam diameter dl of 1298 µm compared to the beam diameter of 55 µm L-PBF machine (TruPrint 1000) and the widespread energy input due to high pulse and track overlaps results in a reduction in residual stresses. The laser polishing process at itself introduces new residual stresses in the form of tensile stresses in the treated surface layer due to the areal heating and remelting of the surface layer and the solidification and cooling shrinkage. Therefore, laser polishing of the annealed state (heat treated) results in an increasing maximum displacement of 0.70 mm with CW-laser polishing and 1.08 mm with PW-laser polishing. The differences between the laser operation modes can be explained with the increased remelting depth at PW laser polishing, which results in an increased shrinkage zone. Full results are given in Table A1 in Appendix A.

3.2. Mechanical Properties Affected by Laser Polishing

The vertical printed tensile specimens exhibit a varying initial roughness Ra of 8.7–15.0 µm, measured in a fabrication direction at the tapered test area, Figure 19. Continuous mode laser polishing (CW) can reduce the roughness Ra to 2.1–2.8 µm, respectively, to Ra = 1.4–2.4 µm at the annealed specimens. Pulsed mode laser polishing (PW) achieves lower roughness values of 0.63–0.78 µm and 0.59–0.67 µm in the annealed state.

3.2.1. Analyzation of the Remelting Zone

At the centre of the treated area, which is equal to the starting position of the laser treatment, pulsed mode laser polishing of the tensile specimens results in a deeper remelting zone compared to CW-polishing, in combination with pronounced edge rounding of the specimens due to the increased melt pool, see Figure 20. With continuous laser radiation, the surface exhibits several adhering material accumulations, which may be a result of material ejection out of the melt pool.
The relative porosity within the remelting zone at the starting position, measured at the cross sections of Figure 20, amounts with continuous laser radiation (CW) 2.77% and with pulsed laser radiation (PW) 2.02%. The pore size, given by the equivalent pore size diameter, with CW polishing is in the range of 0.6–19.9 µm and 0.6–30.3 µm, respectively, with PW polishing, see Table 7.
With ongoing laser polishing, the remelting depth s, measured through the centre of the specimens in the fabrication direction and polishing direction, respectively, strongly increases, see Figure 21a. Thus, the remelting depth s increases with increasing polishing length l within the polishing segment at CW-laser polishing from s = 81 to 296 µm. At PW laser polishing, the remelting depth s increases from 98 to 165 µm.
Furthermore, with increasing remelting depth s a rising relative porosity can be detected, measured in the polishing direction, see Figure 22. Especially with CW polishing, large pores up to a diameter of 156 µm are created in the remelting zone (Figure 22a). Overall, the average relative porosity amounts to 8.7% with continuous laser radiation and 3.5% with pulsed laser radiation.
In contrast to the microstructure at the starting position (Figure 20), especially with continuous laser radiation, an elementary change into a cast-like microstructure can be seen. With the ongoing laser polishing process (with increasing polishing length l) due to thermal through heating, accompanied with a decreasing cooling rate, an increasing melt pool size and remelting depth occurs. With reaching a melt pool solidification time greater than the period of one pendulum movement of the fast-scanning axis, the melt pool, created by the polishing process, changes from a discontinuous melt bath over the fast scanner pendulum axis into a continuous melt bath over the whole pendulum width and an ongoing solidification front behind the axis movement in the x-direction.
The material hardness is measured within a distance from the surface between 0.1 and 1.5 mm and a measuring point spacing of 0.1 mm. The hardness within the tensile specimens at the L-PBF initial state and annealed state is almost constant over the material thickness, see Figure 23. The average hardness in the initial L-PBF state amounts to 117 HV 0.1, which is considerably lower compared to the printed cantilevers due to platform heating of 200 °C. In the annealed state, the average hardness amounts to 81.5 HV 0.1. With laser polishing, the average material hardness, measured at the starting point of the process (close to the centre of the tensile specimen), amounts to 103.9 HV 0.1 with continuous laser radiation and 102.9 HV 0.1 polished with pulsed laser radiation, respectively. At the position with the highest remelting depth s, the average hardness further decreases to 85.5 HV 0.1 (CW) and 84.8 HV 0.1 (PW) compared to the starting area of the polishing process. So, it is likely to be that due to thermal heating effects, the heat affected zone below the remelting zone increases and causes a decrease in the material hardness with the increasing melt pool depth.

3.2.2. Tensile Strength and Fracture Strain

The resulting load elongation curves of the tensile tests are given in Figure 24. The highest tensile strength Rm of 337–355 N/mm2 is achieved with the initial L-PBF state at ultimate elongations between 3.4 and 4.5%. Heat stress relief treatment results in a reduction in tensile strength in the range of 241–243 µm, but in an almost three-times higher elongation at break AB of 11.5–13.4%. A strong decrease in the average tensile strength R ¯ m to values of 252 N/mm2 and 271 N/mm2 for CW and PW, respectively, is also induced by laser polishing. While PW laser polishing results in an almost doubled ultimate elongation, samples after CW laser polishing have only slightly improved ductility. With an additional heat treatment before laser polishing, a further reduction in average yield strength Rp0.2 and tensile strength R ¯ m to values of 247 N/mm2 for CW laser polishing and 249 N/mm2 for PW laser polishing is yielded, but in doing so, the maximum elongation at break further increases, see Figure 24. A full list of the specific values is given in Table A2 in Appendix A.
While the tensile specimens in the initial state (IS) exhibit no necking accompanied with a reduction in the tension before fracture, annealing and laser polishing results in a visible material flow by necking in the surrounding area of the fracture, see Figure 25. Without laser polishing, the position of break between the specimens with and without (IS) heat treatment (IS, heat treated) strongly varies between the specimens. The polished samples exhibit similar breaking positions around the area, with the greatest remelting depth independent from the applied heat treatment.
The fracture surface of the tensile specimens shows similar fracture characteristics, with some sporadic pores at the core of the parts, see Figure 26. The outer melting contour of the L-PBF process at the initial state (IS) and heat treated state (IS, heat treated) is highly dense, see Figure 26a,b. The deep sections of the remelting zone, created by the laser polishing process, exhibit increased porosity and pore diameters, which are partly larger than 100 µm, compared to measurements at the starting position of polishing (Table 7) and the L-PBF core of the specimen. This increase in surface near porosity leads to a reduction in the cross-sectional area. In addition, the elongation at break is particularly reduced by large pores due to the acting notch stresses. The measured relative porosity in the fracture plain is given in Table 8. In the initial state the relative porosity of the complete fracture plane amounts 0.21% and 0.45% prior and post heat treatment, respectively. CW polishing causes an increased porosity of 1.67% and 1.71% with prior heat treatment. Pulsed mode polishing results in a porosity of 0.70–0.81%.
The relative reduction in the fracture area compared to the nominal cross section area of 24 mm2 amounts to 12.35% for the IS specimens and up to 24.2% for the heat-treated state without laser polishing. This relative reduction varies between 18.2 and 21.4% after polishing and, thus, ranges between the initial state (IS) and the heat-treated state (IS, heat treated).

3.3. Comparison and Classification of Laser Polishing as a Surface Treatment Method for AM Parts

Depending on the used process parameters and powder, built platform heating, built orientation and post heat treatment, a wide variety of the mechanical material properties can be reached in L-PBF parts, comprising AlSi10Mg alloys [1]. According to Sert et al., values presented in the literature for the yield strength Rp0.2, manufactured without built platform pre-heating, range between 206 and 319 MPa and the tensile strength Rm between 325 and 477 MPa [1]. The used vertically printed specimens from this study in the initial state (as built) achieve average strength and elongation values of Rp0.2 = 192 N/mm2, RM = 346 N/mm2, AB = 3.9% and are, hence, lower than comparative ones, see Figure 27 [32,33,34]. After processing with the identic heat treatment (300 °C, 2 h), the yield and tensile strength with Rp0.2 = 125 N/mm2, RM = 242 N/mm2 is still below that stated in the literature, while the ultimate elongation AB of 12.6% ranges in the middle.
Due to the physical properties of aluminium alloys with their comparatively high thermal conductivity of 130–150 W/m∙K [41], thermal based surface treatment techniques have a high process energy loss into the bulk material, which results in a deep heat affected zone and global heating of the part. Thus, laser polishing as a thermal surface post processing technique requires a high energy density ED of 30–76 J/mm2. Due to this, laser polishing not only acts as a surface smoothing process, but also as a heat treatment. On the tensile specimens examined here with a material thickness of 3 mm, a hardness reduction over the complete cross section after polishing from both sides was observed, which was, in its amount, comparable to the reductions achieved by conventional stress relief heat treatment in a furnace. That is why the yield and tensile strength of the parts after laser polishing are on the same level as specimens after a stress relief heat treatment, see Figure 27. Furthermore, it is noteworthy that polishing the top layers of L-PBF parts causes a considerable reduction in residual tensions close to the surface. The ultimate elongation at break can be enhanced even more with a heat treatment prior to polishing, irrespective of the laser operation mode. Typically known from the literature, a reduction in the surface roughness results in an increase in ultimate elongation due to a reduction in notch stresses and crack initiation sites. However, this is not applicable here as the state with a heat treatment prior to laser polishing with PW (and CW) reaches only 76% (and 62%, respectively) of the ultimate elongation AB determined on reference samples, which were also heat treated but still had the initial L-PBF roughness. This suggests that the insertion of the increasing surface near porosity superimposes the effect of surface smoothing regarding the mechanical performance.

4. Conclusions

In this study, the material influence by laser polishing of additive manufactured AlSi10Mg is investigated. The dimensions and porosity of the resulting remelting zone, as well as the microstructure, chemical composition and hardness, were analysed. Additionally, the residual stresses induced by the L-PBF process and the influence on these by post processing through laser polishing are examined on printed specimens in a cantilever geometry. Furthermore, the influences of a reduced surface roughness due to laser polishing, which is accompanied by microstructural changes in the remelting zone, on the mechanical properties are analysed by means of tensile testing. The following correlations and findings can be summarised:
  • The chemical composition of the remelting zone is unaltered and homogeneous compared to the untreated specimens and the bulk material.
  • Due to larger melt pools and slower cooling rates, the remelting zone exhibits a considerably coarser eutectic microstructure in comparison to the L-PBF initial state.
  • Due to high pulse and track overlaps, which causes recurrent melting, a layered microstructure within the remelting zone occurs that is distinct from the one at the transition and heat affected zones close to the remelting borders.
  • Laser polishing causes a change from predominantly lamellar grains to uniform grains and a changed orientation independent of the laser operation modes. The average grain size in the remelting zone is comparable to the L-PBF base material. With both laser operation modes, an area at the border of the remelting zone with a smaller grain size of less than 10 µm, comparable to the remelting borders of the L-PBF weld tracks, is formed. Sporadic epitaxial grain growth can be seen between the initial L-PBF material and the remelting zone.
  • The material hardness of 146 HV 0.1 measured on samples in the initial L-PBF state, manufactured without pre-heating of the built platform, is reduced by 28.8–30.1% within the surface near the remelting zone. Polishing after annealing increases hardness to values above the ones measured in the remelting zone without any heat treatment.
  • Within the heat affected zone underneath the remelting zone, a zone with reduced hardness values extends four to six times of the remelting depth.
  • Starting from the initial L-PBF state with a high internal stress of 118–162 MPa, laser polishing results in a reduction in the residual stresses and, thus, the resulting distortions. With a max. displacement of 0.89 mm, polished with pulsed laser radiation, and 0.42 mm with continuous laser radiation, the resulting deformation is reduced by a factor of 2–4 compared to the L-PBF state, exhibiting 1.64 mm. In turn, polishing after stress relief treatment (with residual internal stress below 10 MPa close to the surface) introduces residual stresses and, hence, distortions due to the shrinkage of the remelting zone.
  • Yield strength after laser polishing is Rp0.2 = 131–138 N/mm2 and tensile strength Rm is 252–271 N/mm2. Hence, laser polishing results in comparable values to annealing of the L-PBF initial state.
  • Starting from the L-PBF initial state, the ultimate elongation AB is increased by means of laser polishing from 3.9% to 4.8–7.4%. Due to the introduction of surface near a relative porosity of 3.5% (PW) and 8.7% (CW) within the remelting zone, polishing after previous heat treatment causes a reduction in the ultimate elongation from 12.6% to 7.9% after CW polishing and 9.6% after PW polishing.
  • The mechanical performance after laser polishing is mainly influenced by the hardness reduction over the complete profile, the increased surface near porosity, and the coarsening of the microstructure. Improvements in the surface roughness by laser polishing and, hence, a decrease in notch stress originating at the surface have subordinate influences at parts with a material thickness of less than 3 mm.

Author Contributions

Conceptualization, M.H.; methodology, M.H., A.R., P.H.; validation, M.H., A.R., P.H.; investigation, M.H., A.R., P.H., T.S.; writing—original draft preparation, M.H., P.H., J.S.; writing—review and editing, M.H., P.H., T.S., J.S., D.K.H., A.K.M.D.S., H.R.; visualization, M.H., A.R., J.S.; supervision, D.K.H., A.K.M.D.S., H.R. All authors have read and agreed to the published version of the manuscript.

Funding

This research was partly funded by German Federal Ministry of Economic Affairs and Energy, program ‘ZIM’ (3D-LaPol, grant no. 16KN053056), the German Federal Ministry of Education and Research, program ‘FH-Impuls’ (AddFunK, grant no. 03FH4I04IA) and “FH-Invest” (Project FlexLight 4.0, Grant no. 13FH114N6).

Institutional Review Board Statement

Not applicable.

Informed Consent Statement

Not applicable.

Data Availability Statement

The data, presented in this study, are available on request from the corresponding author.

Acknowledgments

The authors would like to thank Michael Sedlmajer and Markus Merkel from the Institute of Virtual Product Development at Aalen University for manufacturing the tensile specimens.

Conflicts of Interest

The authors declare no conflict of interest.

Appendix A

Table A1. Maximum distortion at the front side of the cantilevers (measuring length = 58 mm) depending on the type of post-treatment.
Maximum Distortion at the Frontside (mm)Average of 4 SpecimensMinimumMaximum
IS1.641.591.69
IS, heat treated0.260.220.30
CW0.420.030.77
CW, heat treated0.700.520.90
PW0.890.661.12
PW, heat treated1.080.751.44
Table A2. Mechanical properties of the tensile specimens depending on the post-treatment.
StateYield Strength Rp 0.2 (N/mm2)Tensile Strength Rm (N/mm2)Ultimate Elongation AB (%)
AverageMinMaxAverageMinMaxAverageMinMax
IS1921881953463373553.93.44.5
IS, heat treated12512212724224124312.611.513.4
CW1311271342522482564.83.75.4
CW, heat treated1191171212472422507.96.58.5
PW1381341442712632817.46.88.0
PW, heat treated1231211242492442529.68.710.1

References

  1. Sert, E.; Öchsner, A.; Hitzler, L.; Werner, E.; Merkel, M. Additive manufacturing: A review of the influence of building orientation and post heat treatment on the mechanical properties of aluminium alloys. In State of the Art and Future Trends in Material Modeling; Altenbach, H., Öchsner, A., Eds.; Springer International Publishing: Cham, Switzerland, 2019; pp. 349–366. ISBN 978-3-030-30355-6. [Google Scholar]
  2. Buchbinder, D.; Meiners, W.; Pirch, N.; Wissenbach, K.; Schrage, J. Investigation on reducing distortion by preheating during manufacture of aluminum components using selective laser melting. J. Laser Appl. 2014, 26, 12004. [Google Scholar] [CrossRef]
  3. Van Hooreweder, B.; Lietaert, K.; Neirinck, B.; Lippiatt, N.; Wevers, M. CoCr F75 scaffolds produced by additive manufacturing: Influence of chemical etching on powder removal and mechanical performance. J. Mech. Behav. Biomed. Mater. 2017, 70, 60–67. [Google Scholar] [CrossRef] [PubMed]
  4. Hassanin, H.; Elshaer, A.; Benhadj-Djilali, R.; Modica, F.; Fassi, I. Surface finish improvement of additive manufactured metal parts. In Micro and Precision Manufacturing; Gupta, K., Ed.; Springer International Publishing: Cham, Switzerland, 2018; pp. 145–164. ISBN 978-3-319-68801-5. [Google Scholar]
  5. Lee, J.-Y.; Nagalingam, A.P.; Yeo, S.H. A review on the state-of-the-art of surface finishing processes and related ISO/ASTM standards for metal additive manufactured components. Virtual Phys. Prototyp. 2021, 16, 68–96. [Google Scholar] [CrossRef]
  6. Hitzler, L.; Janousch, C.; Schanz, J.; Merkel, M.; Mack, F.; Öchsner, A. Non-destructive evaluation of AlSi10Mg prismatic samples generated by selective laser melting: Influence of manufacturing conditions. Mater. Sci. Eng. Technol. 2016, 47, 564–581. [Google Scholar] [CrossRef] [Green Version]
  7. Yasa, E.; Kruth, J.-P. Microstructural investigation of Selective Laser Melting 316L stainless steel parts exposed to laser re-melting. Procedia Eng. 2011, 19, 389–395. [Google Scholar] [CrossRef]
  8. Hitzler, L.; Janousch, C.; Schanz, J.; Merkel, M.; Heine, B.; Mack, F.; Hall, W.; Öchsner, A. Direction and location dependency of selective laser melted AlSi10Mg specimens. J. Mater. Process. Technol. 2017, 243, 48–61. [Google Scholar] [CrossRef]
  9. Hitzler, L.; Sert, E.; Merkel, M.; Öchsner, A.; Werner, E. Fracture toughness and fatigue strength of selective laser melted aluminium–silicon: An overview. In TMS 2019 148th Annual Meeting & Exhibition Supplemental Proceedings; Springer International Publishing: Cham, Switzerland, 2019; pp. 407–412. ISBN 978-3-030-05860-9. [Google Scholar]
  10. Willenborg, E. Polieren von Werkzeugstählen mit Laserstrahlung. Ph.D. Thesis, Technical University Aachen, Aachen, Germany, 2005. [Google Scholar]
  11. Nüsser, C.; Kumstel, J.; Kiedrowski, T.; Diatlov, A.; Willenborg, E. Process- and Material-Induced Surface Structures during Laser Polishing. Adv. Eng. Mater. 2015, 17, 268–277. [Google Scholar] [CrossRef]
  12. McDonald, M.W.; Gora, W.S.; Stevenson, S.G.; Weston, N.J.; Hand, D.P. Practical implementation of laser polishing on additively manufactured metallic components. J. Laser Appl. 2020, 32, 42019. [Google Scholar] [CrossRef]
  13. Yung, K.C.; Wang, W.J.; Xiao, T.Y.; Choy, H.S.; Mo, X.Y.; Zhang, S.S.; Cai, Z.X. Laser polishing of additive manufactured CoCr components for controlling their wettability characteristics. Surf. Coat. Technol. 2018, 351, 89–98. [Google Scholar] [CrossRef]
  14. Richter, B.; Blanke, N.; Werner, C.; Vollertsen, F.; Pfefferkorn, F.E. Effect of Initial Surface Features on Laser Polishing of Co-Cr-Mo Alloy Made by Powder-Bed Fusion. JOM 2019, 71, 912–919. [Google Scholar] [CrossRef]
  15. Li, Y.; Zhang, Z.; Guan, Y. Thermodynamics analysis and rapid solidification of laser polished Inconel 718 by selective laser melting. Appl. Surf. Sci. 2020, 511, 145423. [Google Scholar] [CrossRef]
  16. Temmler, A.; Pirch, N.; Luo, J.; Schleifenbaum, J.H.; Häfner, C.L. Numerical and experimental investigation on formation of surface structures in laser remelting for additive-manufactured Inconel 718. Surf. Coat. Technol. 2020, 403, 126370. [Google Scholar] [CrossRef]
  17. Breidenstein, B.; Brenne, F.; Wu, L.; Niendorf, T.; Denkena, B. Effect of Post-Process Machining on Surface Properties of Additively Manufactured H13 Tool Steel. HTM 2018, 73, 173–186. [Google Scholar] [CrossRef]
  18. Černašėjus, O.; Škamat, J.; Markovič, V.; Višniakov, N.; Indrišiūnas, S. Surface Laser Processing of Additive Manufactured 1.2709 Steel Parts: Preliminary Study. Adv. Mater. Sci. Eng. 2019, 2019, 7029471. [Google Scholar] [CrossRef] [Green Version]
  19. Li, Y.-H.; Wang, B.; Ma, C.-P.; Fang, Z.-H.; Chen, L.-F.; Guan, Y.-C.; Yang, S.-F. Material Characterization, Thermal Analysis, and Mechanical Performance of a Laser-Polished Ti Alloy Prepared by Selective Laser Melting. Metals 2019, 9, 112. [Google Scholar] [CrossRef] [Green Version]
  20. Yuan, J.; Liang, L.; Lin, G. Study on processing characteristics and mechanisms of thermally assisted laser materials processing. Surf. Coat. Technol. 2019, 378, 124946. [Google Scholar] [CrossRef]
  21. Marimuthu, S.; Triantaphyllou, A.; Antar, M.; Wimpenny, D.; Morton, H.; Beard, M. Laser polishing of selective laser melted components. Int. J. Mach. Tools Manuf. 2015, 95, 97–104. [Google Scholar] [CrossRef] [Green Version]
  22. Chen, L.; Richter, B.; Zhang, X.; Bertsch, K.B.; Thoma, D.J.; Pfefferkorn, F.E. Effect of laser polishing on the microstructure and mechanical properties of stainless steel 316L fabricated by laser powder bed fusion. Mater. Sci. Eng. A 2021, 802, 140579. [Google Scholar] [CrossRef]
  23. Obeidi, M.A.; McCarthy, E.; O’Connell, B.; Ul Ahad, I.; Brabazon, D. Laser Polishing of Additive Manufactured 316L Stainless Steel Synthesized by Selective Laser Melting. Materials 2019, 12, 991. [Google Scholar] [CrossRef] [Green Version]
  24. Schanz, J.; Hofele, M.; Hitzler, L.; Merkel, M.; Riegel, H. Laser Polishing of Additive Manufactured AlSi10Mg Parts with an Oscillating Laser Beam. In Machining, Joining and Modifications of Advanced Materials; Öchsner, A., Altenbach, H., Eds.; Springer: Singapore, 2016; pp. 159–169. ISBN 978-981-10-1081-1. [Google Scholar]
  25. Hofele, M.; Schanz, J.; Roth, A.; Harrison, D.K.; de Silva, A.; Riegel, H. Process parameter dependencies of continuous and pulsed laser modes on surface polishing of additive manufactured aluminium AlSi10Mg parts. Mater. Sci. Eng. Technol. 2021, 52, 409–432. [Google Scholar] [CrossRef]
  26. El Hassanin, A.; Obeidi, M.A.; Scherillo, F.; Brabazon, D. CO2 laser polishing of laser-powder bed fusion produced AlSi10Mg parts. Surf. Coat. Technol. 2021, 419, 127291. [Google Scholar] [CrossRef]
  27. Bhaduri, D.; Ghara, T.; Penchev, P.; Paul, S.; Pruncu, C.I.; Dimov, S.; Morgan, D. Pulsed laser polishing of selective laser melted aluminium alloy parts. Appl. Surf. Sci. 2021, 558, 149887. [Google Scholar] [CrossRef]
  28. Schanz, J.; Hofele, M.; Ruck, S.; Schubert, T.; Hitzler, L.; Schneider, G.; Merkel, M.; Riegel, H. Metallurgical investigations of laser remelted additively manufactured AlSi10Mg parts. Mater. Sci. Eng. Technol. 2017, 48, 463–476. [Google Scholar] [CrossRef]
  29. Hofele, M.; Roth, A.; Schanz, J.; Neuer, J.; Harrison, D.K.; de Silva, A.K.M.; Riegel, H. Laser Polishing of Additive Manufactured Aluminium Parts by Modulated Laser Power. Micromachines 2021, 12, 1332. [Google Scholar] [CrossRef] [PubMed]
  30. DIN EN 1706:2021-10; Aluminium and Aluminium Alloys—Castings—Chemical Composition and Mechanical Properties. Beuth Verlag GmbH: Berlin, Germany, 2021.
  31. Kruth, J.-P.; Deckers, J.; Yasa, E.; Wauthlé, R. Assessing and comparing influencing factors of residual stresses in selective laser melting using a novel analysis method. Proc. Inst. Mech. Eng. Part B J. Eng. Manuf. 2012, 226, 980–991. [Google Scholar] [CrossRef]
  32. Uzan, N.E.; Shneck, R.; Yeheskel, O.; Frage, N. Fatigue of AlSi10Mg specimens fabricated by additive manufacturing selective laser melting (AM-SLM). Mater. Sci. Eng. A 2017, 704, 229–237. [Google Scholar] [CrossRef]
  33. Dai, D.; Gu, D.; Zhang, H.; Zhang, J.; Du, Y.; Zhao, T.; Hong, C.; Gasser, A.; Poprawe, R. Heat-induced molten pool boundary softening behavior and its effect on tensile properties of laser additive manufactured aluminum alloy. Vacuum 2018, 154, 341–350. [Google Scholar] [CrossRef]
  34. Zhang, C.; Zhu, H.; Liao, H.; Cheng, Y.; Hu, Z.; Zeng, X. Effect of heat treatments on fatigue property of selective laser melting AlSi10Mg. Int. J. Fatigue 2018, 116, 513–522. [Google Scholar] [CrossRef]
  35. Hofele, M.; Neuer, J.; Lindenberger-Ullrich, M.; Schanz, J.; Harrison, D.K.; De Silva Anjali, K.M.; Riegel, H. Laser cleaning as a productive surface post-treatment method for L-PBF parts. In Proceedings of the Lasers in Manufacturing Conference 2021, Virtual, 21–24 June 2021. [Google Scholar]
  36. DIN EN ISO 4288:1997-04; Geometrische Produktspezifikationen (GPS) Oberflächenbeschaffenheit: Tastschnittverfahren Regeln und Verfahren für die Beurteilung der Oberflächenbeschaffenheit. Beuth Verlag GmbH: Berlin, Germany, 1997.
  37. ISO 6507-1:2018; Metallische Werkstoffe—Härteprüfung nach Vickers–Teil 1: Prüfverfahren. Deutsches Institut für Normung: Berlin, Germany, 2018.
  38. ISO 6892-1:2016; Metallische Werkstoffe—Zugversuch: Teil 1: Prüfverfahren bei Raumtemperatur. Deutsches Institut für Normung: Berlin, Germany; Beuth Verlag GmbH: Berlin, Germany, 2016.
  39. Hitzler, L.; Hafenstein, S.; Mendez Martin, F.; Clemens, H.; Sert, E.; Öchsner, A.; Merkel, M.; Werner, E. Heat Treatments and Critical Quenching Rates in Additively Manufactured Al-Si-Mg Alloys. Materials 2020, 13, 720. [Google Scholar] [CrossRef] [Green Version]
  40. Ketzer-Raichle, G.; Schubert, T.; Bernthaler, T.; Schneider, G. Characteristics of Microstructural Formations Occurring in Additively Manufactured Materials. Pract. Metallogr. 2019, 56, 230–245. [Google Scholar] [CrossRef]
  41. SLM Solutions Group AG. Material Data Sheet Al-Alloy AISi10Mg/EN AC-43000/EN AC-AISi10Mg; SLM Solutions Group AG: Lübeck, Germany, 2019; Available online: https://www.slm-solutions.com/fileadmin/Content/Powder/MDS/MDS_Al-Alloy_AlSi10Mg_0520_EN.pdf (accessed on 12 June 2019).
Figure 1. (a) Geometry of the cantilever specimens, (b) Positioning of the specimens on the built plate during L-PBF in the TruPrint 1000, (c) Dimension of laser polishing area and position of the taken cross sections.
Metals 12 00750 g001
Figure 2. Geometry of the flat tensile specimens and definition of the polishing area with two sections and a field overlap of 1 mm.
Metals 12 00750 g002
Figure 3. Positioning and orientation of the tensile specimens on the built plate, Sample allocation to different post-processing states. (a) Sample allocation. (b) Position on the built plate.
Metals 12 00750 g003
Figure 4. Experimental setup of the laser polishing in a TRUMPF Laser Cell TLC 40 with a SAO 1.06/1D scanner optics, process chamber and oxygen measurement device ORBITALSERVICE PRO2 plus.
Metals 12 00750 g004
Figure 5. Schematic illustration of the orientation of the tensile specimens and used clamping device. Laser beam guidance by scanner one dimensional pendulum beam deflection and superimposed axis movement.
Metals 12 00750 g005
Figure 6. Used laser power curves over the pendulum movement, depending on the laser operation mode and specimen geometry.
Metals 12 00750 g006
Figure 7. Schematic illustration of the measuring strategy of the surface profile height and the measuring position and orientation of the internal stress by X-ray diffraction on the used cantilever geometry.
Metals 12 00750 g007
Figure 8. Built platform in the initial state (IS) and polished cantilevers with pulsed laser radiation (PW) and continuous laser radiation (CW).
Metals 12 00750 g008
Figure 9. Etched cross sections of the cantilevers in y-direction.
Metals 12 00750 g009
Figure 10. Remelting depth, measured at the cross section at the centre of the cantilever.
Metals 12 00750 g010
Figure 11. Microstructure at the cross section in y-direction, etched with Murakami, (a) initial state, (b) initial state, heat treated, (c) polished with pulsed laser radiation, (d) heat treated and polished with pulsed laser radiation, (e) polished with continuous laser radiation, (f) heat treated and polished with continuous laser radiation.
Metals 12 00750 g011
Figure 12. SE-SEM images at 2500-fold magnification of the surface near top area and border of the remelting zone polished with pulsed laser radiation (PW) (a,b) and continuous laser radiation (CW) (c,d).
Metals 12 00750 g012
Figure 13. EBSD inverse pole figure map of the remelting zone after laser polishing without heat treatment: (a) CW-polished; (b) PW polished.
Metals 12 00750 g013
Figure 14. Micro hardness according to Vickers HV 0.1 over the material thickness after laser polishing, measured at the cross section at half of the polishing length.
Metals 12 00750 g014
Figure 15. Chemical composition in vertical direction from the surface through the remelting zone (RZ) and L-PBF initial state. (a) PW, (b) CW.
Metals 12 00750 g015
Figure 16. Residual tensile stress depending on the orientation φ, and principal stresses at the initial L-PBF state and heat-treated state, measured by XRD.
Metals 12 00750 g016
Figure 17. Distortion of the cantilevers depending on the laser polishing process, (a) without prior heat treatment, (b) with prior heat treatment.
Metals 12 00750 g017
Figure 18. Measured average distortion of four samples, depending on the type of post treatment.
Metals 12 00750 g018
Figure 19. Initial and achieved surface roughness Ra by laser polishing of the tensile specimens, measured in fabrication direction.
Metals 12 00750 g019
Figure 20. Etched cross section parallel to the y-z-plane of the polished tensile specimens at the centre of the tensile specimens near to the starting position of laser polishing.
Metals 12 00750 g020
Figure 21. Resulting remelting depth s on the tensile specimens depending on the laser operation mode, (a) remelting depth in polishing direction, (b) remelting depth over polishing width at the starting position.
Metals 12 00750 g021
Figure 22. Longitudinal cutting of the remelting zone at position with the highest remelting depth, (a) CW-polishing at l = 15–16 mm, (b) PW-polishing at l = 12 mm.
Metals 12 00750 g022
Figure 23. (a) Hardness distribution over the thickness of the tensile specimens at the L-PBF state, heat treated state and laser polishing depending at starting position and position with the highest remelting depth smax, (b) schematic description of the measuring strategy.
Metals 12 00750 g023
Figure 24. Stress elongation curves depending on the post-treatment of the tensile specimens.
Metals 12 00750 g024
Figure 25. Tensile specimens after tensile test.
Metals 12 00750 g025
Figure 26. Fracture plain of the tensile specimens at the L-PBF state (a), with heat treatment (b) laser polished (c,d) and polished after heat treatment (e,f).
Metals 12 00750 g026
Figure 27. Mechanical properties of L-PBF AlSi10Mg between the L-PBF state (IS, as built), after heat treatment of 300 °C, 2 h (IS, heat treated) and after laser polishing the surface with continuous and pulsed laser radiation on the initial state (CW, PW) and after previous heat treatment (HT, CW; HT, PW) in comparison to Zhang [34], Uzan [32] and Dai [33].
Metals 12 00750 g027
Table 1. Chemical composition of the used powder according to the powder batch test report and the part after 3D printing by L-PBF, measured by emission spectroscopy of type BRUKER Q4 Tasman, in comparison to DIN ISO 1706:2020 [30].
StateChemical Composition of AlSi10Mg (%)
AlSiMgFeMnCuOthers
DIN ISO 1706Residual9.0–11.00.20–0.45<0.550.45<0.05<0.55
Powder89.529.900.370.10<0.01<0.01<0.12
Printed part88.7310.770.290.12<0.010.050.04
Table 2. Cantilever sample allocation, labelling and usage for the material investigations.
Built JobHeat TreatmentSample No.Laser TreatmentLabelInvestigations
1No1.1; 1.4noISSurface roughness, Distortion
1.2; 1.5pw-polishedCW
1.3; 1.6cw-polishedPW
2No2.1; 2.4cw-polishedCW
2.2; 2.5pw-polishedPW
2.3; 2.6noIS
3Yes3.1; 3.4noIS, heat treated
3.2; 3.5pw-polishedCW, heat treated
3.3; 3.6cw-polishedPW, heat treated
4Yes4.1; 4.4noIS, heat treated
4.2; 4.5pw-polishedCW, heat treated
4.3; 4.6cw-polishedPW, heat treated
5Yes5.1; 5.4noIS, heat treatedRemelting depth, Micro structure, Hardness, Chemical composition, Residual stress (XRD)
5.2; 5.5pw-polishedCW, heat treated
5.3; 5.6cw-polishedPW, heat treated
6No6.1; 6.4noIS
6.2; 6.5pw-polishedCW
6.3; 6.6cw-polishedPW
Table 3. Used process parameters at laser polishing.
Process ParameterCantilever TestsTensile Tests
Pulsed Mode (PW)Continuous Mode (CW)Pulsed Mode (PW)Continuous Mode (CW)
Laser power Pl (W)1700-1700
Average laser power Plavg (W)51010005101200
Pulse duration tp (ms)0.3-0.3-
Pulse frequency f (Hz)1000-1000-
Focal position z (mm)12
Laser beam diameter dl (µm)1298
Laser beam intensity Iavg (W/mm2)12857561285907
Pendulum frequency fscan (Hz)10501050
Average pulse overlap POavg (%)84.6-84.6-
Axis velocity vf (mm/min)4020040200
Track overlap TO (%)94.993.794.993.7
Energy density ED (J/mm2)76.53076.536
Process gasArgon
Oxygen content (ppm)50
Table 4. Roughness improvement by laser polishing with continuous (CW) and pulsed laser radiation (PW).
RoughnessInitial L-PBF StateCW PolishedPW Polished
RaRaPercental ReductionRaPercental Reduction
Average8.68 µm2.56 µm70.5%0.87 µm90.0%
Min6.58 µm1.28 µm 0.60 µm
Max14.23 µm4.74 µm 1.13 µm
Table 5. Material hardness according to Vickers HV 0.1, measured 0.1 mm below the surface at the initial state and heat-treated state, respectively, at the centre of the polishing zone.
StateAverageMinMax
Initial L-PBF state (as built)145.8142.0150.0
IS, heat treated96.494.399.4
CW polished102.095.9108.0
CW polished, heat treated116.0109.0124.0
PW-polished103.897.8115.0
PW polished, heat treated114.9111.0118.0
Table 6. Chemical composition of the remelting zone in comparison to the LPBF-initial state, measured by EDX.
Average Weight %LPBF Initial StateRemelting Zone CW PolishedRemelting Zone PW Polished
Al88.2–88.687.888.9
Si10.0–10.110.39.9
Mg1.41.41.3
Others0.0–0.30.60.0
Table 7. Porosity at starting position within the remelting zone of the laser polished tensile specimens.
Laser Operation ModeRelative Porosity (%)Equivalent Pore Circle Diameter (µm)
AverageMinMax
CW2.773.90.619.9
PW2.024.10.630.3
Table 8. Cross sectional area, relative porosity and relative reduction of the nominal cross section area depending on the sample state: L-PBF initial state (IS), heat treated HT, CW polished (CW), heat treated and CW polished (HT, CW), PW polished and heat treated and PW polished (HT, PW).
Sample CategorySample No.Cross Sectional Break Area (mm2)Relative
Porosity (%)
Area of Fracture Plane (mm2)Relative Reduction of
Nominal Cross Section Area (%)
IS321.0800.2121.03512.35%
IS, HT618.2730.4518.19124.20%
CW119.9591.6719.62618.23%
HT, CW419.5991.7119.26419.73%
PW219.4320.8119.27519.69%
HT, PW519.0210.7918.87121.37%
Publisher’s Note: MDPI stays neutral with regard to jurisdictional claims in published maps and institutional affiliations.

