Article

Microstructure Study on Large-Sized Ti–6Al–4V Bar Three-High Skew Rolling Based on Cellular Automaton Model

1
College of Material Science and Engineering, Taiyuan University of Science and Technology, Taiyuan 030024, China
2
TZ Technology Center, Taiyuan Heavy Industry Co., Ltd., Taiyuan 030024, China
*
Author to whom correspondence should be addressed.
Metals 2022, 12(5), 773; https://doi.org/10.3390/met12050773
Submission received: 3 April 2022 / Revised: 27 April 2022 / Accepted: 27 April 2022 / Published: 29 April 2022

Abstract

:
The large diameter titanium alloy bars are usually manufactured by forging, which leads to large metal loss, high cost, low efficiency and limited product specifications. This paper adopted three-high skew rolling technology to roll Ti–6Al–4V bar with the diameter of 300 mm. With the reduction of 50 mm, the three-roll skew rolling model was developed by DEFORM-3D finite element software. A cellular automatic model (CA model) of large-sized titanium alloy bar cross-rolled was established, considering the effects of dislocation, recovery and nucleation on dynamic recrystallization. The microstructure evolution process is effectively simulated. During the process of rolling, dynamic recrystallization occurs in the outer layer of the rolled piece at first. The new nucleations form at the grain boundary, then grow into their secondary phase. With the rolling proceeding, the dynamic recrystallization gradually extends to the core of bar. The microstructure of the rolled bar is uniform and the grain size is refined with the average grain size of approximately 10 μm. The simulation results are compared with the experimental results, the actual grain size is a little coarser than that obtained by the CA model. Some reasons are given to reasonably explain the phenomenon.

1. Introduction

Ti–6Al–4V is an aviation material with excellent comprehensive properties such as low density, high specific strength, corrosion resistance and high temperature tolerance. Most bars with the diameter of above 100 mm are manufactured by forging, extrusion and drawing. However, the forging is prone to much metal loss, high cost, low efficiency and limited product specifications [1]. The products produced by extrusion and drawing have obvious inhomogeneity in microstructure, which cannot meet the mechanical properties. Therefore, seeking a novel and efficient manufacturing method is urgent to breakthrough the current technical bottleneck. Due to the development of rolling technology, rolling has brought obvious economic benefits, and gradually becomes a significant processing technology of producing large shaft parts.
Chen Liquan et al. [2] simulated texture formation on hot forged TC18 titanium bars. Zhang Can et al. [3] investigated the continuous rolling process of H13 bars. Wang Pan Pan et al. [4] performed large-sized bearing steel bar rolling process optimization. Shuai Meirong et al. [5] rolled TC4 titanium alloy bars of Ø25 mm into bars with the diamter of Ø17 mm in a four-stand Y-type continuous rolling mill; Pan Lu et al. [6] designed and optimized the pass according to the characteristics of bar produced by a three-high Y-type continuous rolling mill; based on the imported continuous rolling production line, Min Xinhua et al. [7] developed a new hot continuous rolling method for the TA15 small size bar; Zhang Xinwang et al. [8] simulated the process of three-high spiral rolling titanium alloy bar by DEFORM-3D software, and analyzed the stress–strain of the bar and the rolling force, verifying the feasibility of the rolling process. R. Lapovok et al. and Andrzej Stefanik et al. [9,10] proposed rolling an A1050 aluminum round bar 20 mm in diameter by modern three-high skew rolling. On the basis of theoretical research, the stress, strain and temperature distribution were analyzed with the software. Wang Lu et al. [11] simulated the skew rolling process of a titanium alloy bar with a small diameter, and analyzed the related parameters during stable rolling. The conclusion is of great significance to the study of bar defects.
The excellent mechanical properties of Ti–6Al–4V depend on the micro-structure during thermoforming. Skew rolling is an effective technology to reduce and eliminate casting defects and optimize the micro-structure of materials. The reasonable micro-structure of the material can be obtained by controlling the rolling process and dynamic recrystallization during hot deformation. Many experts and scholars employed the CA model to study the evolution of micro-structure in the process of plastic deformation. Jianwei Xu et al. [12] analyzed the deformation behavior and micro-structure of a near alpha titanium alloy in a single-phase region. Zhu et al. [13] studied the micro-structure evolution during dynamic recrystallization with a cellular automaton method. Chu et al. [14] developed the microstructure model of AZ31 magnesium alloy based on cellular automation. Li et al. [15] gave a growth kinetics model of three-dimensional grains based on cellular automation. Han et al. [16] studied a cellular automation model based on micro-structure prediction in the cumulative roll-bonding of TA15 sheets.
In this paper, the high temperature constitutive model and recrystallization model of the Ti–6Al–4V bar were developed on the basis of hot compression experiment data and the CA model was then established pn skew rolling. The microstructure evolution and dynamic recrystallization process of the rolled bar were obtained by finite element software DEFORM-3D. The microstructure evolution process of a large-diameter Ti–6Al–4V bar during skew rolling was studied.

2. Finite Element Model of Three-High Skew Rolling Titanium Alloy Bar Model

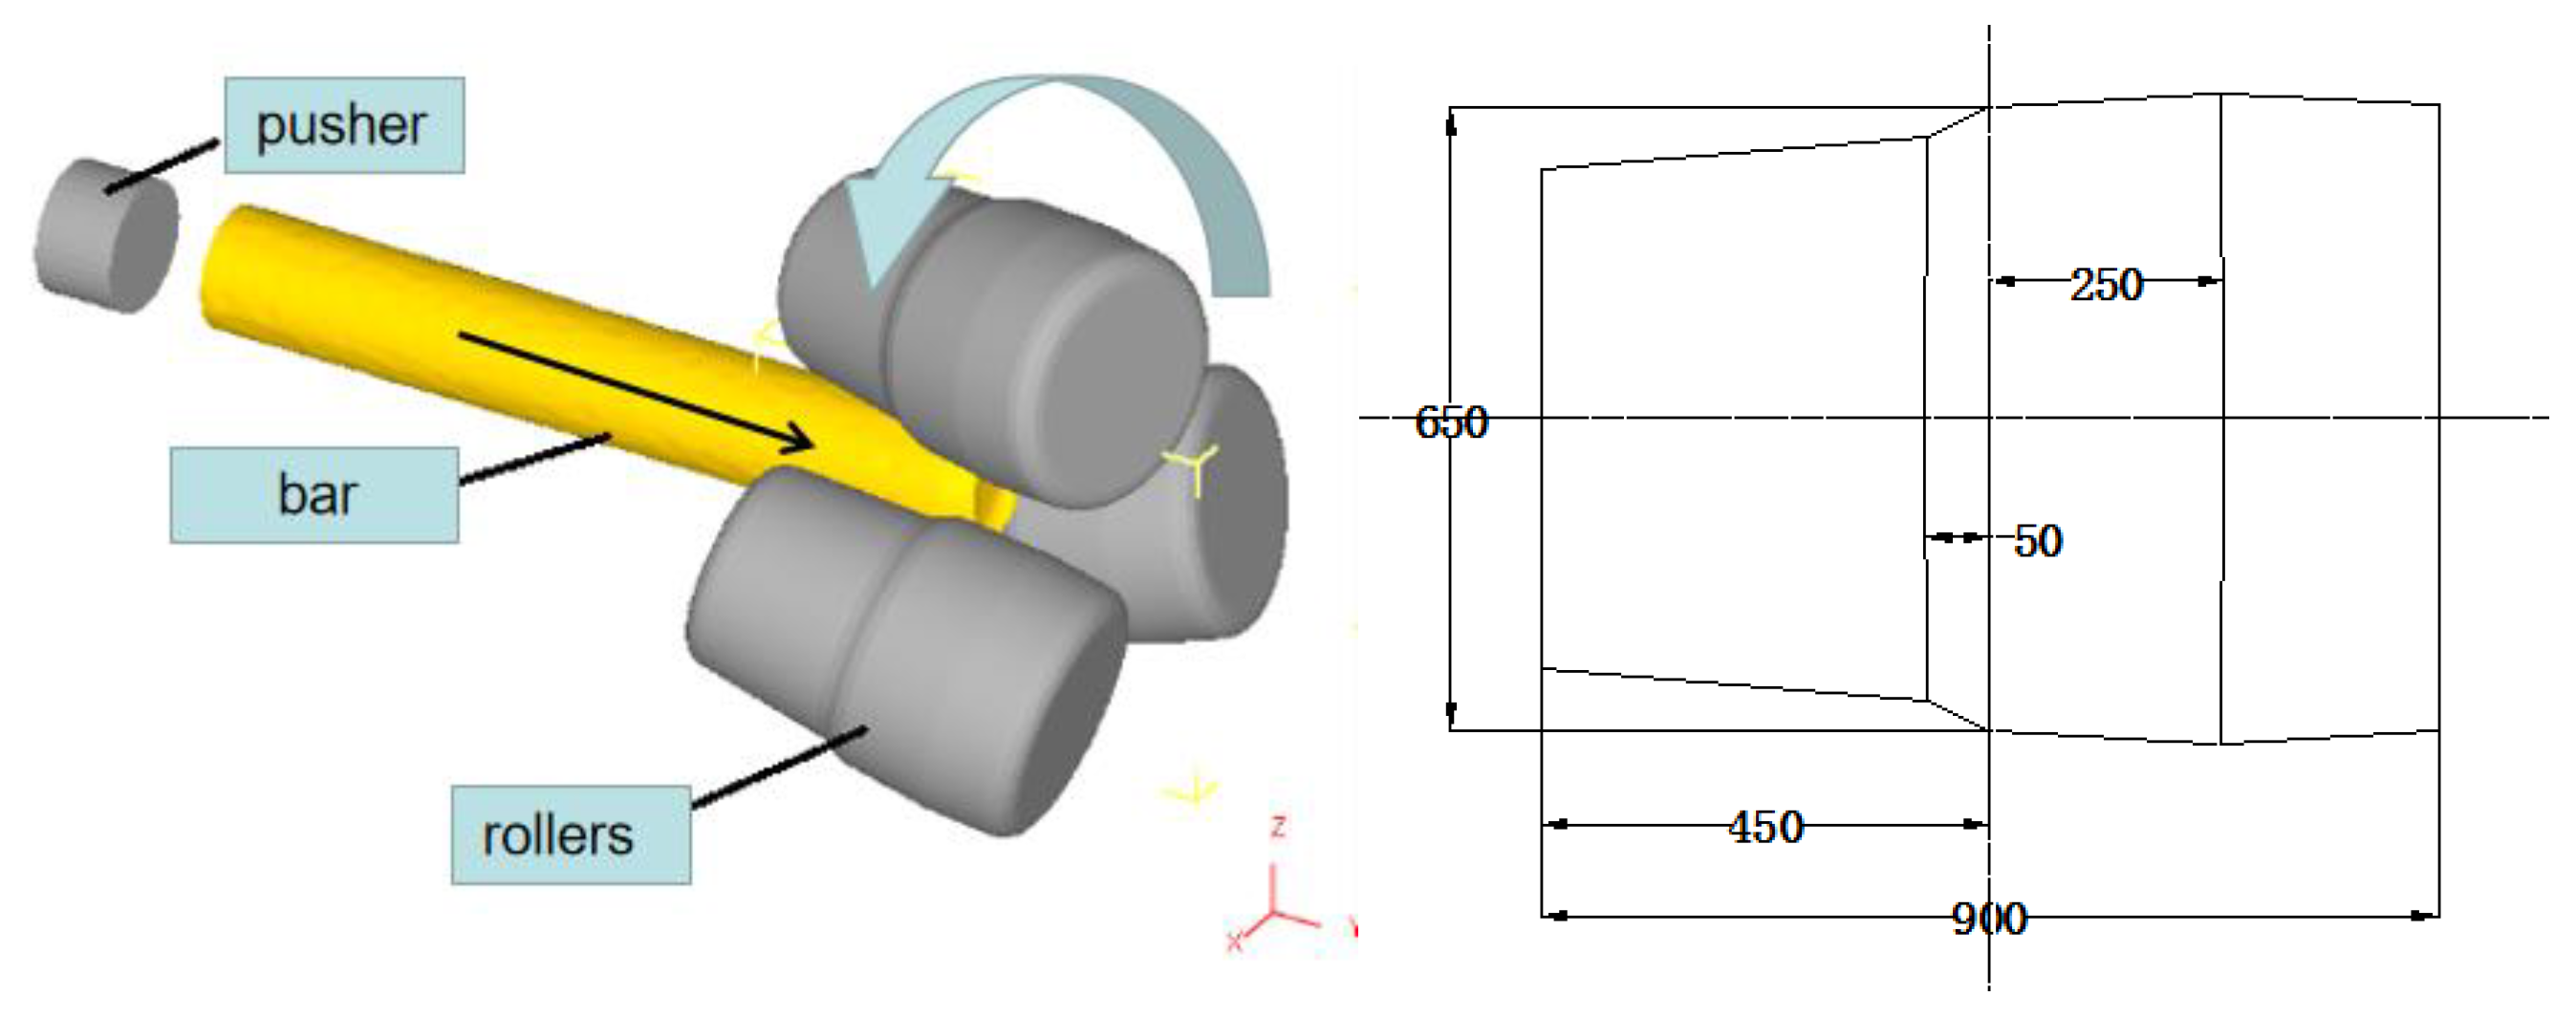
2.1. Spatial Configuration and Principle of Skew Rolling

The three-high skew rolling means that three rolls are arranged at 120 cross degrees in the cross-section perpendicular to the rolling line and rotate in the same direction. As shown in Figure 1, the spatial arrangement of the three-high skew rolling deformation zone is clear, and the specific size of the roll is given as well (unit: mm). The billet spirally rotates forward with the tangential force and axial force, whereby three work rolls are produced by rotating in the same direction. The pusher with the original speed helps the biting rolled bar at the beginning of the rolling process. Once the biting was achieved, the pusher would no longer work. The three effective deformations, each of which were perpendicular, were produced in the pass by the three work rolls: longitudinal deformation; tangential deformation; and radial deformation, and finally, the billet was rolled into the workpiece with the required size. The rolled bar undergoes four deformation stages: bite–reducing–leveling–exit. In the first stage, a larger opening space between three rolls made it easy for the rolled piece to bite. The second section is called the rolling stage, which reduces the diameter of the bar. The third one is the integration section, which aims to homogenize the surface size of the bar. In the fourth, the ends of the three rolls look like a bell mouth, so that the bar can be smoothly rolled out of the deformation area.

2.2. Process Parameters

The mathematical expression of the deformation resistance of Ti–6Al–4V is below [17]:
σ ¯ = σ ¯ ( ε , ε ˙ , t )
The deformation resistance model during thermal deformation is as follows:
σ ¯ = A ε a ε ˙ b e c t
where A, a, b, c—constants depending on material and deformation conditions; t—deformation temperature (°C); ε —strain; and ε ˙ —strain rate.
Usually, the model and specific parameters are obtained by the statistical linear regression of experimental data. This method is widely utilized for establishing the constitutive model of materials. The hot compression experimental data and fitting curves in [5] were used in this model. The deformation temperature was 950–1100 °C, the strain varied in the range of 0–0.92, and the strain rate was approximately between 10 and 0.01 s−1.
The process parameters in the rolling process are shown in Table 1.
The large-sized bar was rolled with a diameter of Ø300 mm at a temperature of 950 °C. The diameter of the rolls was Ø650 mm, and the rolls had an angular velocity of 10 rad s−1. The feeding angle is usually adopted in the range of 8–15°, while the rolling angle is generally taken as 0–15° according to the shape of the rolls.

2.3. Finite Element Model

The rolled piece was automatically divided into 97,952 four-node tetrahedron elements with 22,099 nodes in total. Constant temperature rolling was adopted, the temperature of the rolled piece was 950 °C, and the ambient temperature and temperature of the roll and push block are 20 °C. The shear friction model was used between the rolled piece and the roll with the friction coefficient of 0.7.
The total calculating time of the finite element model was 8 s. Aiming to describe the effective strain at the reduction of 50 mm, 6 points at the cross-section of 700 mm away from the head of the rolled bar were analyzed, which are marked in Figure 2. The effective strain of the six points is clearly demonstrated in the figure as well as during the entire rolling process. The maximum equivalent strain is up to 19 or so.

3. Establishment of Cellular Automaton Model

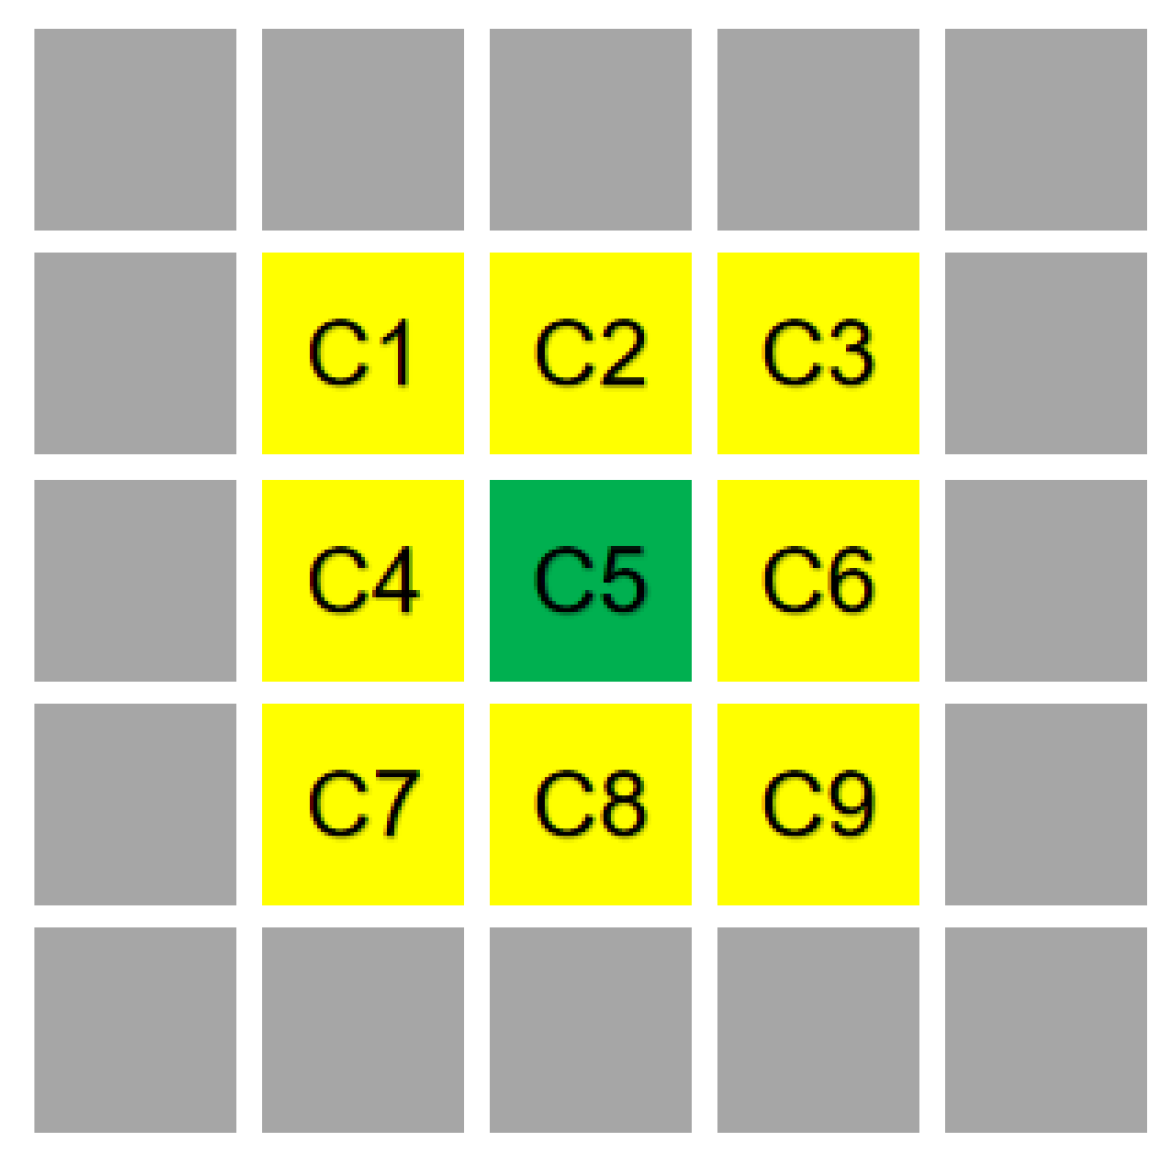
3.1. Basic Theory of CA

CA is an algorithm used to analyze the evolution law of complex systems based on discrete temporal and spatial degrees of freedom. The model simulates the dynamic recrystallization process concerning dislocation, recovery, nucleation and other factors. As a grid dynamic model with discrete time, space and state, it consists of four basic components: cell space, neighbor type, boundary condition, and cell state.
It is divided by a 400 × 400 grid, which represents the actual area of 1 × 1 m. The neighbor type adopts the Moore neighbor, as shown in Figure 3. C5 represents the central cell and the surrounding yellow area represents the neighbor cells. The boundary condition is set to be periodic to simulate the infinite region, and the state of the cell at each moment is determined by the state of the neighbor cell according to the transformation rule. The cells are uniformly arranged, their states are randomly evolved locally with time, and each cell is only related to the surrounding cells [18].
The thermal deformation of the metal is influenced by a work hardening and softening mechanism (dynamic recovery and dynamic recrystallization), which together affect the evolution of dislocation density in the matrix.

3.2. Dislocation Model

The dislocation density and the strain in this model can be expressed as:
d ρ d ε = h r ρ
where:
ρ —dislocation density;
ε—strain;
h—work hardening parameters;
r—dynamic recovery coefficient.
In the dislocation model, the work hardening parameter h and the dynamic recovery coefficient r can be expressed as:
h = h 0 ε ˙ ε ˙ 0 m exp m Q R T
r = r 0 ε ˙ ε ˙ 0 m exp m Q R T
where:
m—strain rate sensitivity index, and m = 0.2 for high temperature deformation;
h0—strain hardening constant, here h0 = 0.398;
r0—recovery constant, r0 = 28,837;
ε—strain;
ε ˙ —strain rate;
ε ˙ 0 —strain rate calibration constant, ε ˙ 0 = 1;
Activation energy, Q = 266,000 J/(k mol);
The gas constant, R = 8.13 J/(k mol);
T—the deformation temperature (K).

3.3. Dynamic Recovery Model

Dynamic recovery is a kind of material softening mechanism, and the dislocation density decreases with the dynamic recovery. Goetz’s [18] model is adopted here:
ρ i , j t = ρ i , j t 1 2
In the simulation process, the dislocation density is reduced by half in each time step. The cells are randomly selected as calculating objects, and the number of cells N is determined by the following formula:
N = R × C × 2 K 2 h d ε ( 1 2 m )
where R represents the number of rows in the two-dimensional cellular space; C denotes the number of columns; R × C is the total number of cells in the cell space, and 100 is adopted here; K is a constant, and the value is 6030; is the increment of strain.

3.4. Dynamic Recrystallization Model

The Avrami dynamic recrystallization model is employed here. When the strain reaches or exceeds a certain critical value, dynamic recrystallization of the material will occur. Generally speaking, the critical strain value of the material εc is lower than the peak strain of the material εp (the strain at the point of the peak stress in the stress–strain curve).
The relationship between the critical strain and peak strain can be expressed as:
ε c = a 0 ε p
where the value a0 ranges approximately in between 0.67 and 0.86, with a value of 0.8 in the model.
Relationship between peak strain and deformation parameters:
ε p = a 1 d 0 n 1 ε ˙ m 1 exp Q 1 R T
among which εp represents the peak strain; d0 is the initial grain size (µm); ε ˙ denotes the strain rate; a1, n1 and m1 are constants, respectively; R is the gas constant (J/mol K); T is the absolute temperature (K); Q1 thermal activation energy (kJ/mol).
When the deformation exceeds the critical strain, dynamic recrystallization will occur. The recrystallization volume percentage equation is as follows [19]:
x d r e x = 1 exp β d ε a 2 ε p ε 0.5 k d
where xdrex is the volume fraction of dynamic recrystallization; βd is a material constant; and kd is the Avarami index.
As the volume fraction of dynamic recrystallization is 50%, the relationship between the strain of recrystallization and the deformation parameters is below:
ε 0.5 = a 3 d 0 h 3 ε ˙ m 3 exp Q 3 R T
where ε 0.5 is the corresponding strain when the volume fraction of dynamic recrystallization is 50%:
R—the gas constant (J/mol K);
T—the absolute temperature (K);
Q3—the recrystallization activation energy (kJ/mol);
d0—the initial grain size (µm).
The dynamic recrystallization grain size model can be described by the following formula:
d d r e x = a 4 d 0 h 4 ε n 4 ε ˙ m 4 exp Q 4 R T + c 4
where, a4, h4, n4, m4, c4 are constants; ddrex is referred to as dynamic recrystallization grain size; and Q4 is dynamic recrystallization activation energy.
In order to obtain the parameters of each equation in the model, the logarithm of the above equation is transformed as the linear relationship, and the coefficients in the equation are obtained by linear regression according to the thermodynamic simulation test data. The final results are as follows:
ε c = 0.8 ε p
ε p = 1.2 × 10 6 d 0 ε ˙ 0.035 exp 110000 R T
x d r e x = 1 exp 0.892 ε 0.8 ε p ε 0.5 1.1935
ε 0.5 = 5.4 × 10 6 d 0 ε ˙ 0.024 exp 100000 R T
d d r e x = 896.53 ε 0.5857 ε ˙ 0.2485 exp 40025.9 R T

4. CA Simulation Results and Analysis of Titanium Bar Skew Rolling

The basic principle of the Avrami model is that when the strain of the material reaches or exceeds a certain critical strain value, the material will undergo dynamic recrystallization.
The boundary condition is that the grain boundary changes with the flow stress of the material, and the Moore-type neighbor relation with a radius of 1 mm [19] is selected. The other parameters are shown in the second part of this paper (cellular automaton model).
Combining a dynamic recrystallization model with the CA model, the microstructure of the Ti–6Al–4V bar during rolling was simulated by DEFORM-3D software.

4.1. Recrystallization Volume Percentage Distribution

The total time for calculating is 8 s, which covers 80 steps. Figure 4 shows the distribution of the recrystallization volume percentage as the Ti–6Al–4V bar is rolled at the different stages, namely the initial biting stage (a); having been bitten stage (b); and the stable rolling stage (c). It can be seen from the different deformation stages of rolling that at the biting stage, the metal at the outermost layer deformed first, and the recrystallization volume percentage is the highest as well. The recrystallization percentage decreases along the radius direction to the inside, and there is no dynamic recrystallization phenomenon at the center of the bar. With the rolling process proceeding, the deformation degree gradually increases, and the recrystallization extends to the inside. It is obvious that the recrystallization percentage was up to 100% at the center of the rolled piece.

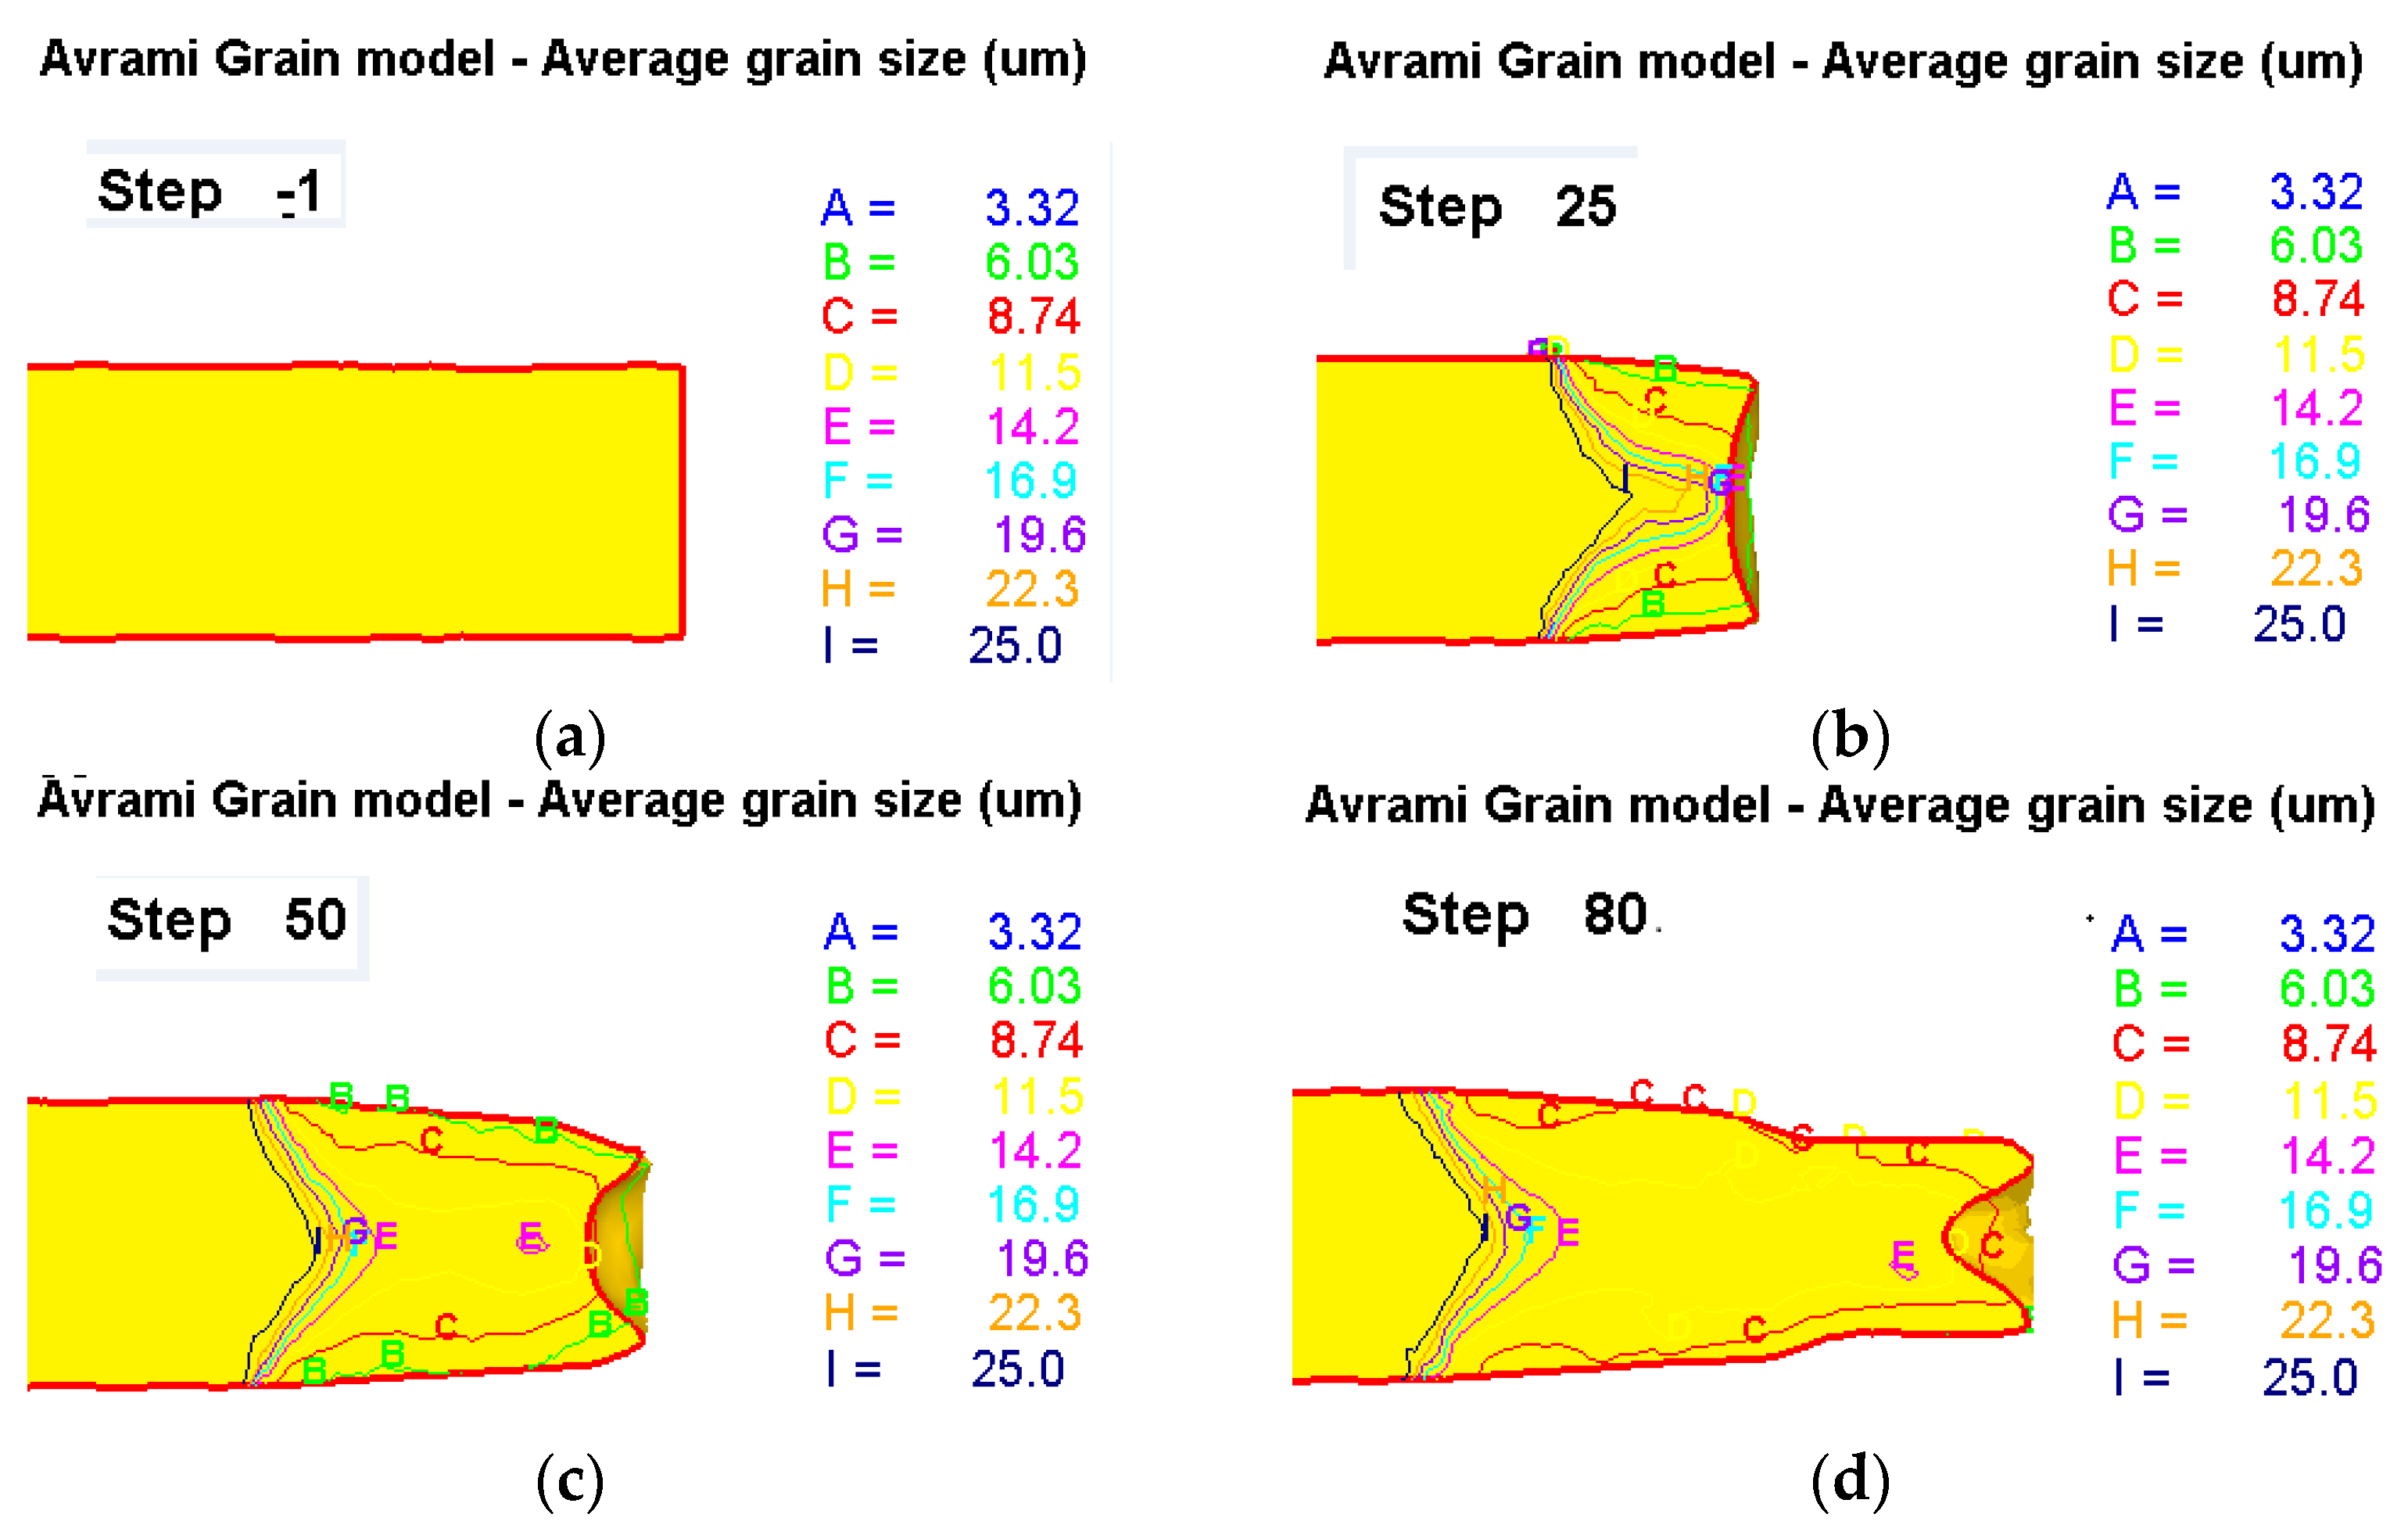
4.2. Average Grain Size Distribution

As can be seen from Figure 5, the average grain size is gradually changing with the deformation of different rolling stages. Before rolling (a), there is no any change in grain size, and the original state is retained. At the initial biting stage (b), the grain size gradually increases with the radial direction towards the core of the Ti–6Al–4V bar. The size of outer layer grain is 6.03 μm, and the core grain size is 22.3 μm; during biting (c), the grain size inside the rolled piece is further reduced, whilst the grain size inside the rolled piece is reduced to 14.2 μm while the size of the outer layer grain reaches 6.03 μm. After the rolling becomes stable (d), a homogenization phenomenon occurs, that is to say, the grain size distribution in the rolled piece is uniform, and the grain size is basically 8.74 μm. It can be asserted from the change of grain size that dynamic recrystallization occurred inside the rolled material during rolling. Dynamic recrystallization firstly starts at the outer part of the bar, extending into the center with the increase in reduction. After rolling, the new grains and original grains reach equilibrium, and the grain size of the whole interface becomes fine and uniform [20].

4.3. Microstructure Appearance Analysis

The internal point of the bar was selected as the research object, the microstructure simulation process of which was observed, as shown in Figure 6. It is clear that, before the bar is bitten, it mainly presents relatively coarse grain, as shown in Figure 6a. With the rolling proceeding, it seems that the original grains grow to some degree. When the degree of reduction increases, the metal flow intensifies, and its dislocation density reached up to the critical dislocation density. The recrystallization nucleation and secondary phase generated at the boundary of the original grain, as shown in Figure 6b. At this time, it can be called the recrystallization nucleation stage. The boundary of the original grains is entirely covered by nucleation points which emerge in chains, indicating that dynamic recrystallization behavior began at this moment. During the stable rolling stage, the recrystallized grains obtain enough dislocation energy and distortion energy to promote their growth, and gradually extends to the original grains, which means that the volume percentage of recrystallized grains increases, as shown in Figure 6c. It is obvious in Figure 6d that, after rolling, the grains are refined and uniformed. The microstructure evolution during the rolling process vividly reflects the appearance and grain size change law of the dynamic recrystallization phenomenon.

4.4. Comparison between Test Results and Prediction Results

Once the simulation is complete, P1 and P2 are selected as tracking points for the post-processing microstructure analysis. P1 and P2 are two points on the same cross-section which are 700 mm away from the head of the bar along the direction of the length and located, respectively, in R/2 and the core of the cross-section. Their positions are indicated in Figure 7. The samples for experiments, 5 mm × 5 mm × 10 mm, are made along the longitudinal direction of the rolled piece.
Corrosive agent is prepared with self-made Kroll reagent according to volume ratio. The proportion of corrosive agent (calculated in volume ml) used in this experiment is: HF (40% industrial purity): HNO3 (60% industrial purity of nitric acid): and H2O (water) = 1:3:7 [21]. The sample was corroded at approximately 5–10 s. The microstructure appearance of the sample is displayed in Figure 8.
The simulation results and the experimental results after rolling are given in Figure 8a,b at R/2 of the cross-section. It can be seen that both the simulation results and the experimental microstructure appearance are commonly characterized by the equiaxed structure, coarse flaky primary α phase, equiaxed new phase formation at boundaries of grains, and the clear rolling direction. The results show that when the reduction is 50 mm, the dislocation density in the metal increases with the increase in the deformation degree during rolling. When it reaches a critical value of dynamic recrystallization of Ti–6Al–4V, dynamic recrystallization would occur to form a new microstructure phase. Because of incomplete recrystallization, two phases coexist, but the grains are greatly refined. The original mean grain size of the Ti–6Al–4V bar before being rolled is approximately 25 μm, and at the end of rolling, the average grain size reaches approximately 10 μm in Figure 8a. However, the average grain size of the metallographic structure of the metal obtained by the rolling experiment is approximately 14.2 μm and looks longer than that of the simulation, perhaps because the longitudinal structure of the grains is elongated along the rolling direction.
In Figure 8c,d, the simulated microstructure of CA and the actual microstructure at the center of the bar are given. It can be seen that, in the center area of the rolled piece, the average grain size of Ti–6Al–4V bar varies from 25 μm at the beginning to approximately 11.9 μm after rolling. Compared to this, the average grain size of the metallographic structure of the actual rolled piece is approximately 16 μm, close to those of CA simulation, but there is a little error between them. The reason is largely that the complete recrystallization is not sufficient in actual rolling due to the uniformity of the temperature distribution, rolling mill bounce and other factors. The bounce of the rolling mill can lead to the deformation degree of rolled bar decreasing, and the size of the grain increases with the decreasing strain. In addition, another reason is that the sampling method differed between the experiment and the simulation. CA just took the point as the researching object, but the experiment selected a piece of metal with a size of 5 mm × 5 mm × 10 mm, which had a more obvious plastic forming mark.
As shown in Figure 9, the metallographic structure of the core is further analyzed, and it is obvious that the microstructure after rolling is equiaxed, and the microstructure is clearly elongated in the rolling direction. In the figure, large pieces of bright flake parts are the primary α phase, and small dark pieces are the β phase in the middle of the bright flake. With the increase in rolling degree, the second phase, namely the secondary α phase formed at the grain boundary resembles bright small patches.

5. Conclusions

(1)
The CA model was established for the three-roll skew rolling process of a large-size Ti–6Al–4V bar. The changes in the recrystallization volume percentage, grain size and microstructure appearance during the rolling process were obtained. The results show that dynamic recrystallization occurs at the contact of the outer layer and the roll, before gradually extending to the core.
(2)
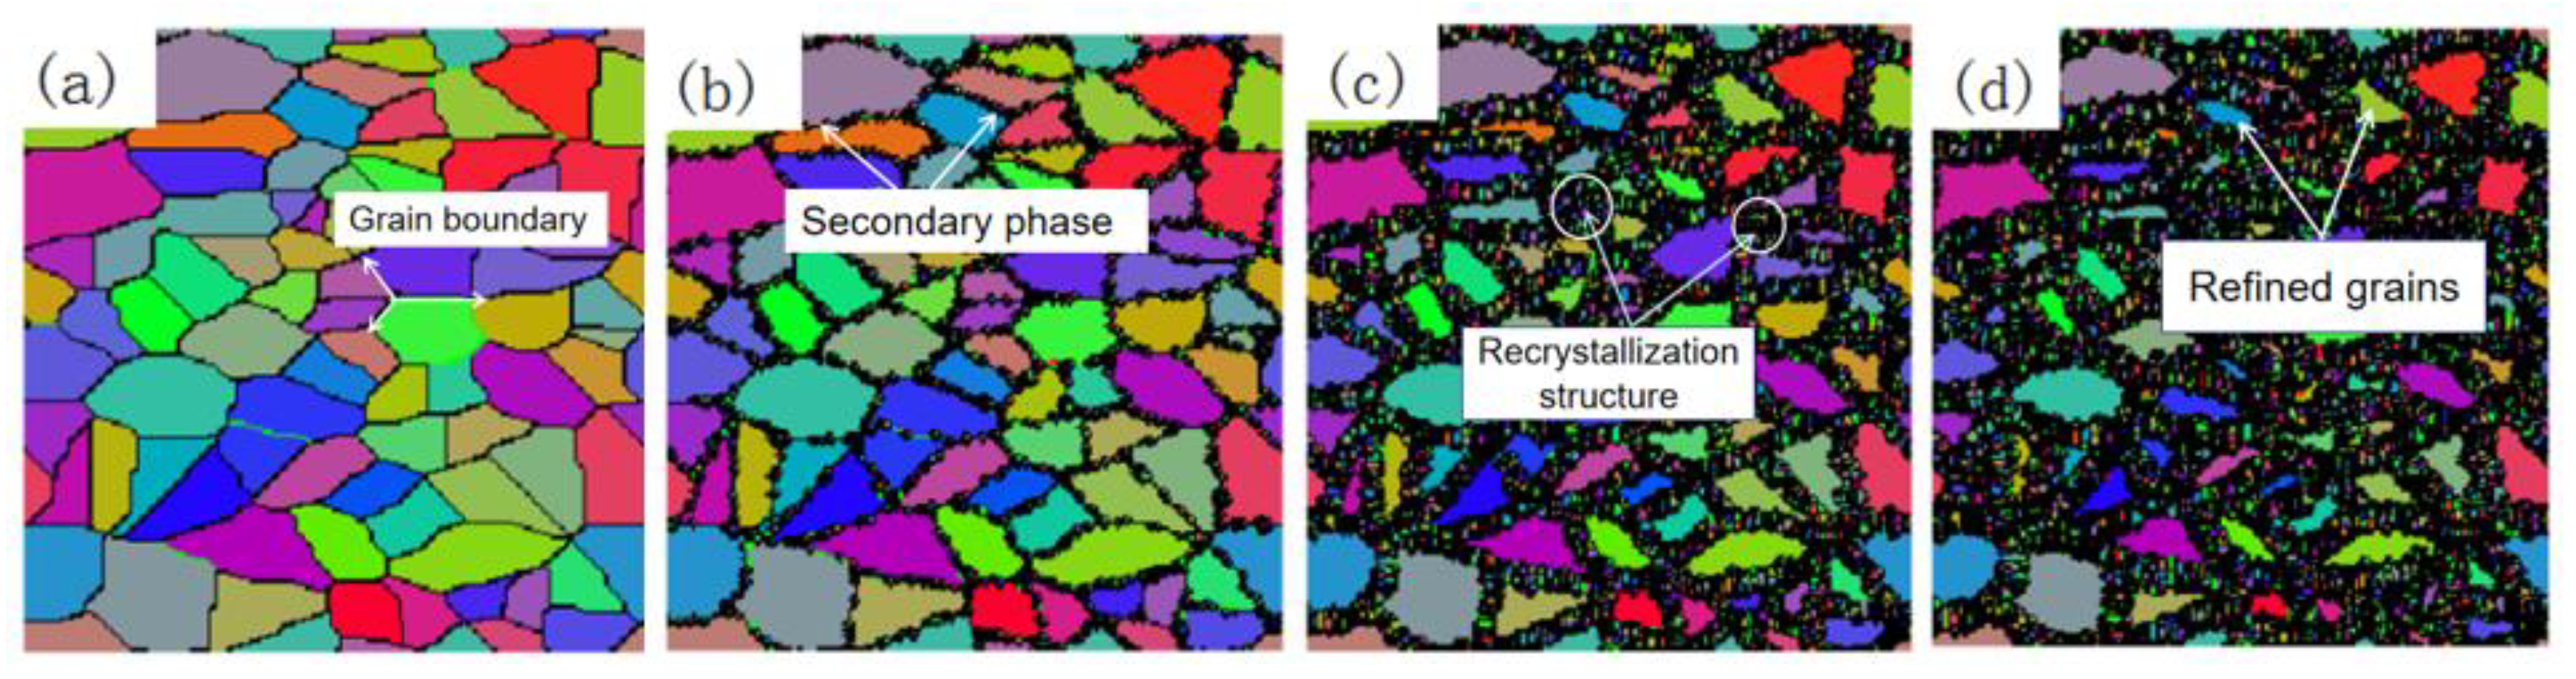
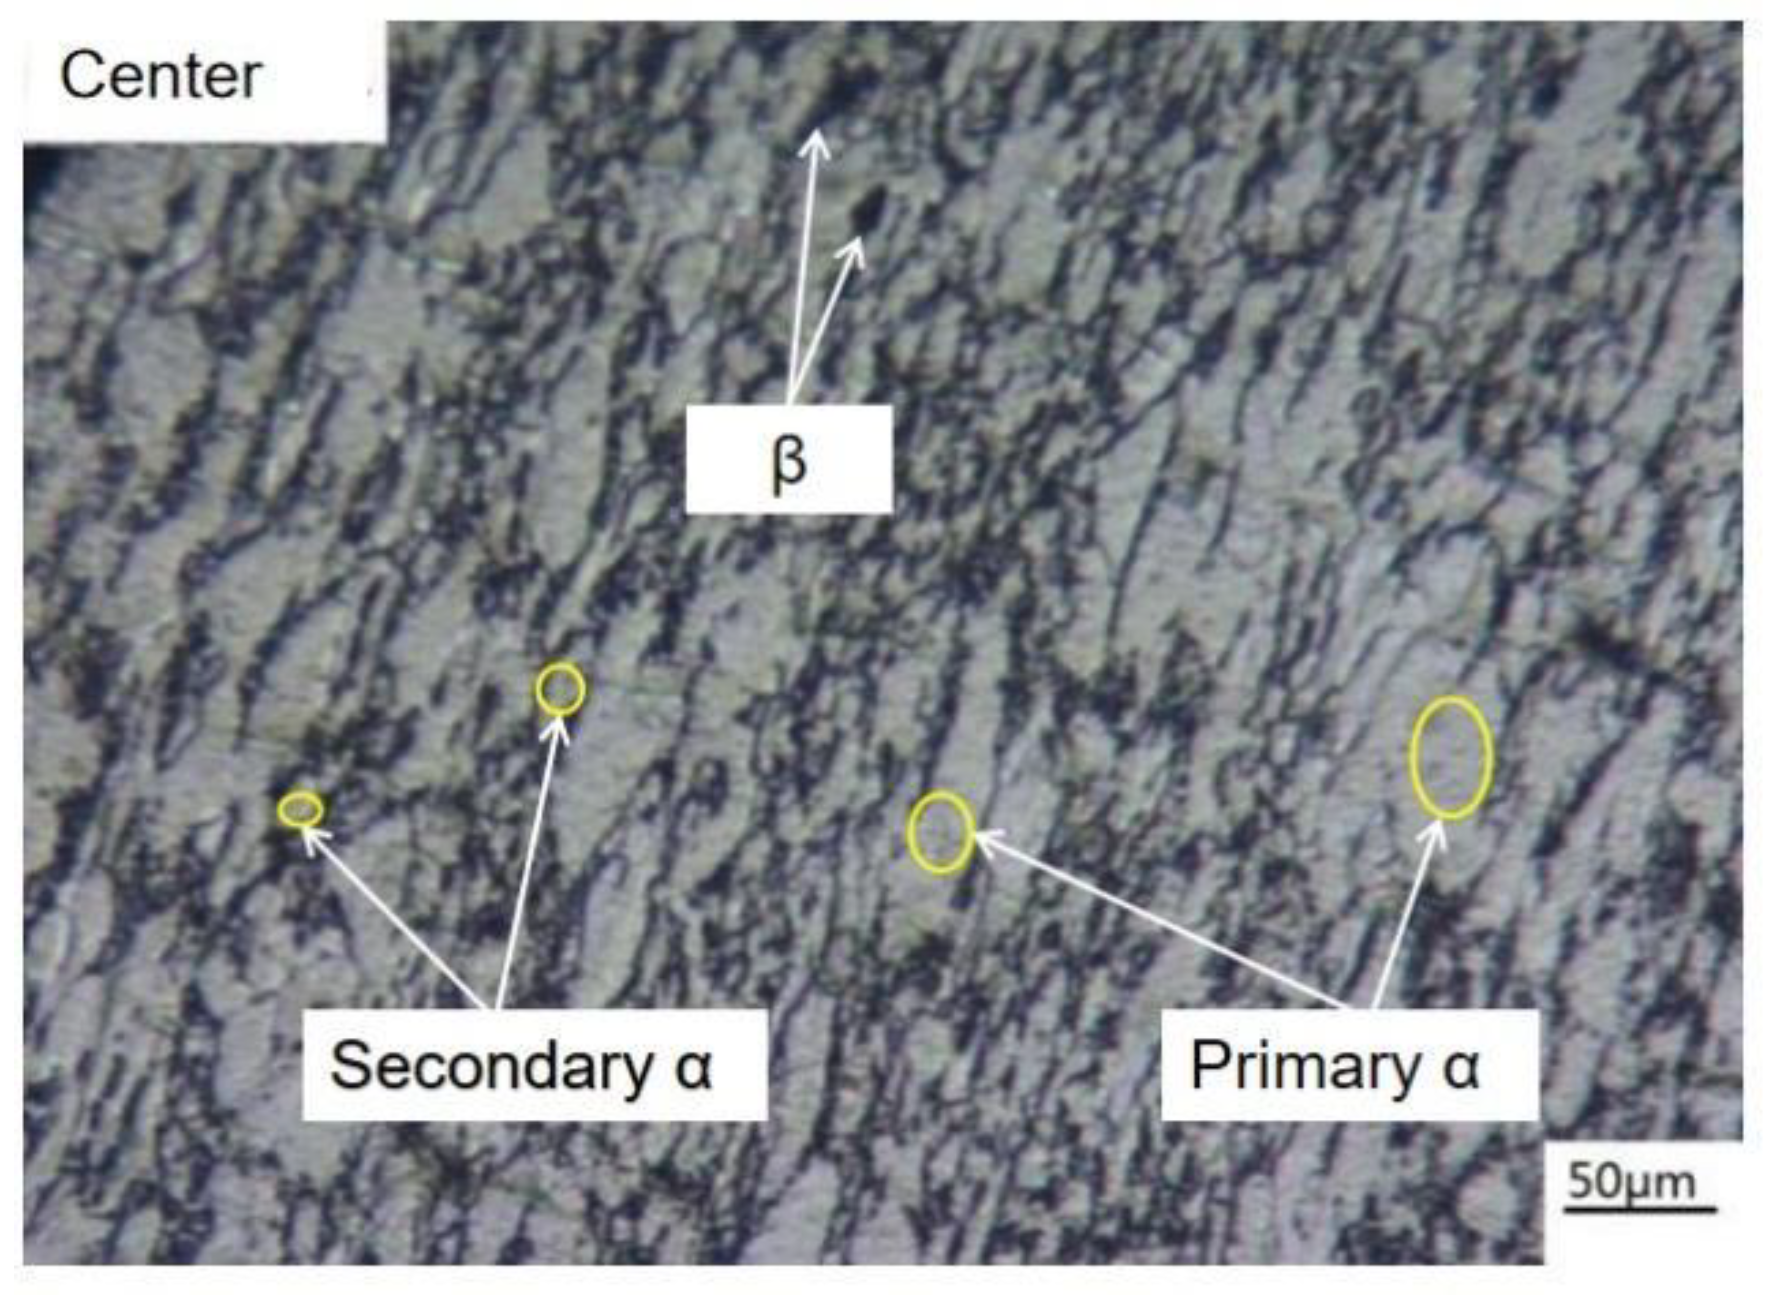
During microstructure evolution, dynamic recrystallization occurred and formed nucleation at the grain boundary of the α phase. With the intensification of deformation, the recrystallized grains grew and extended to the original grains. The regenerated grains reached balance with the original grains, and the grains were refined with the minimum grains at approximately 6 μm.
(3)
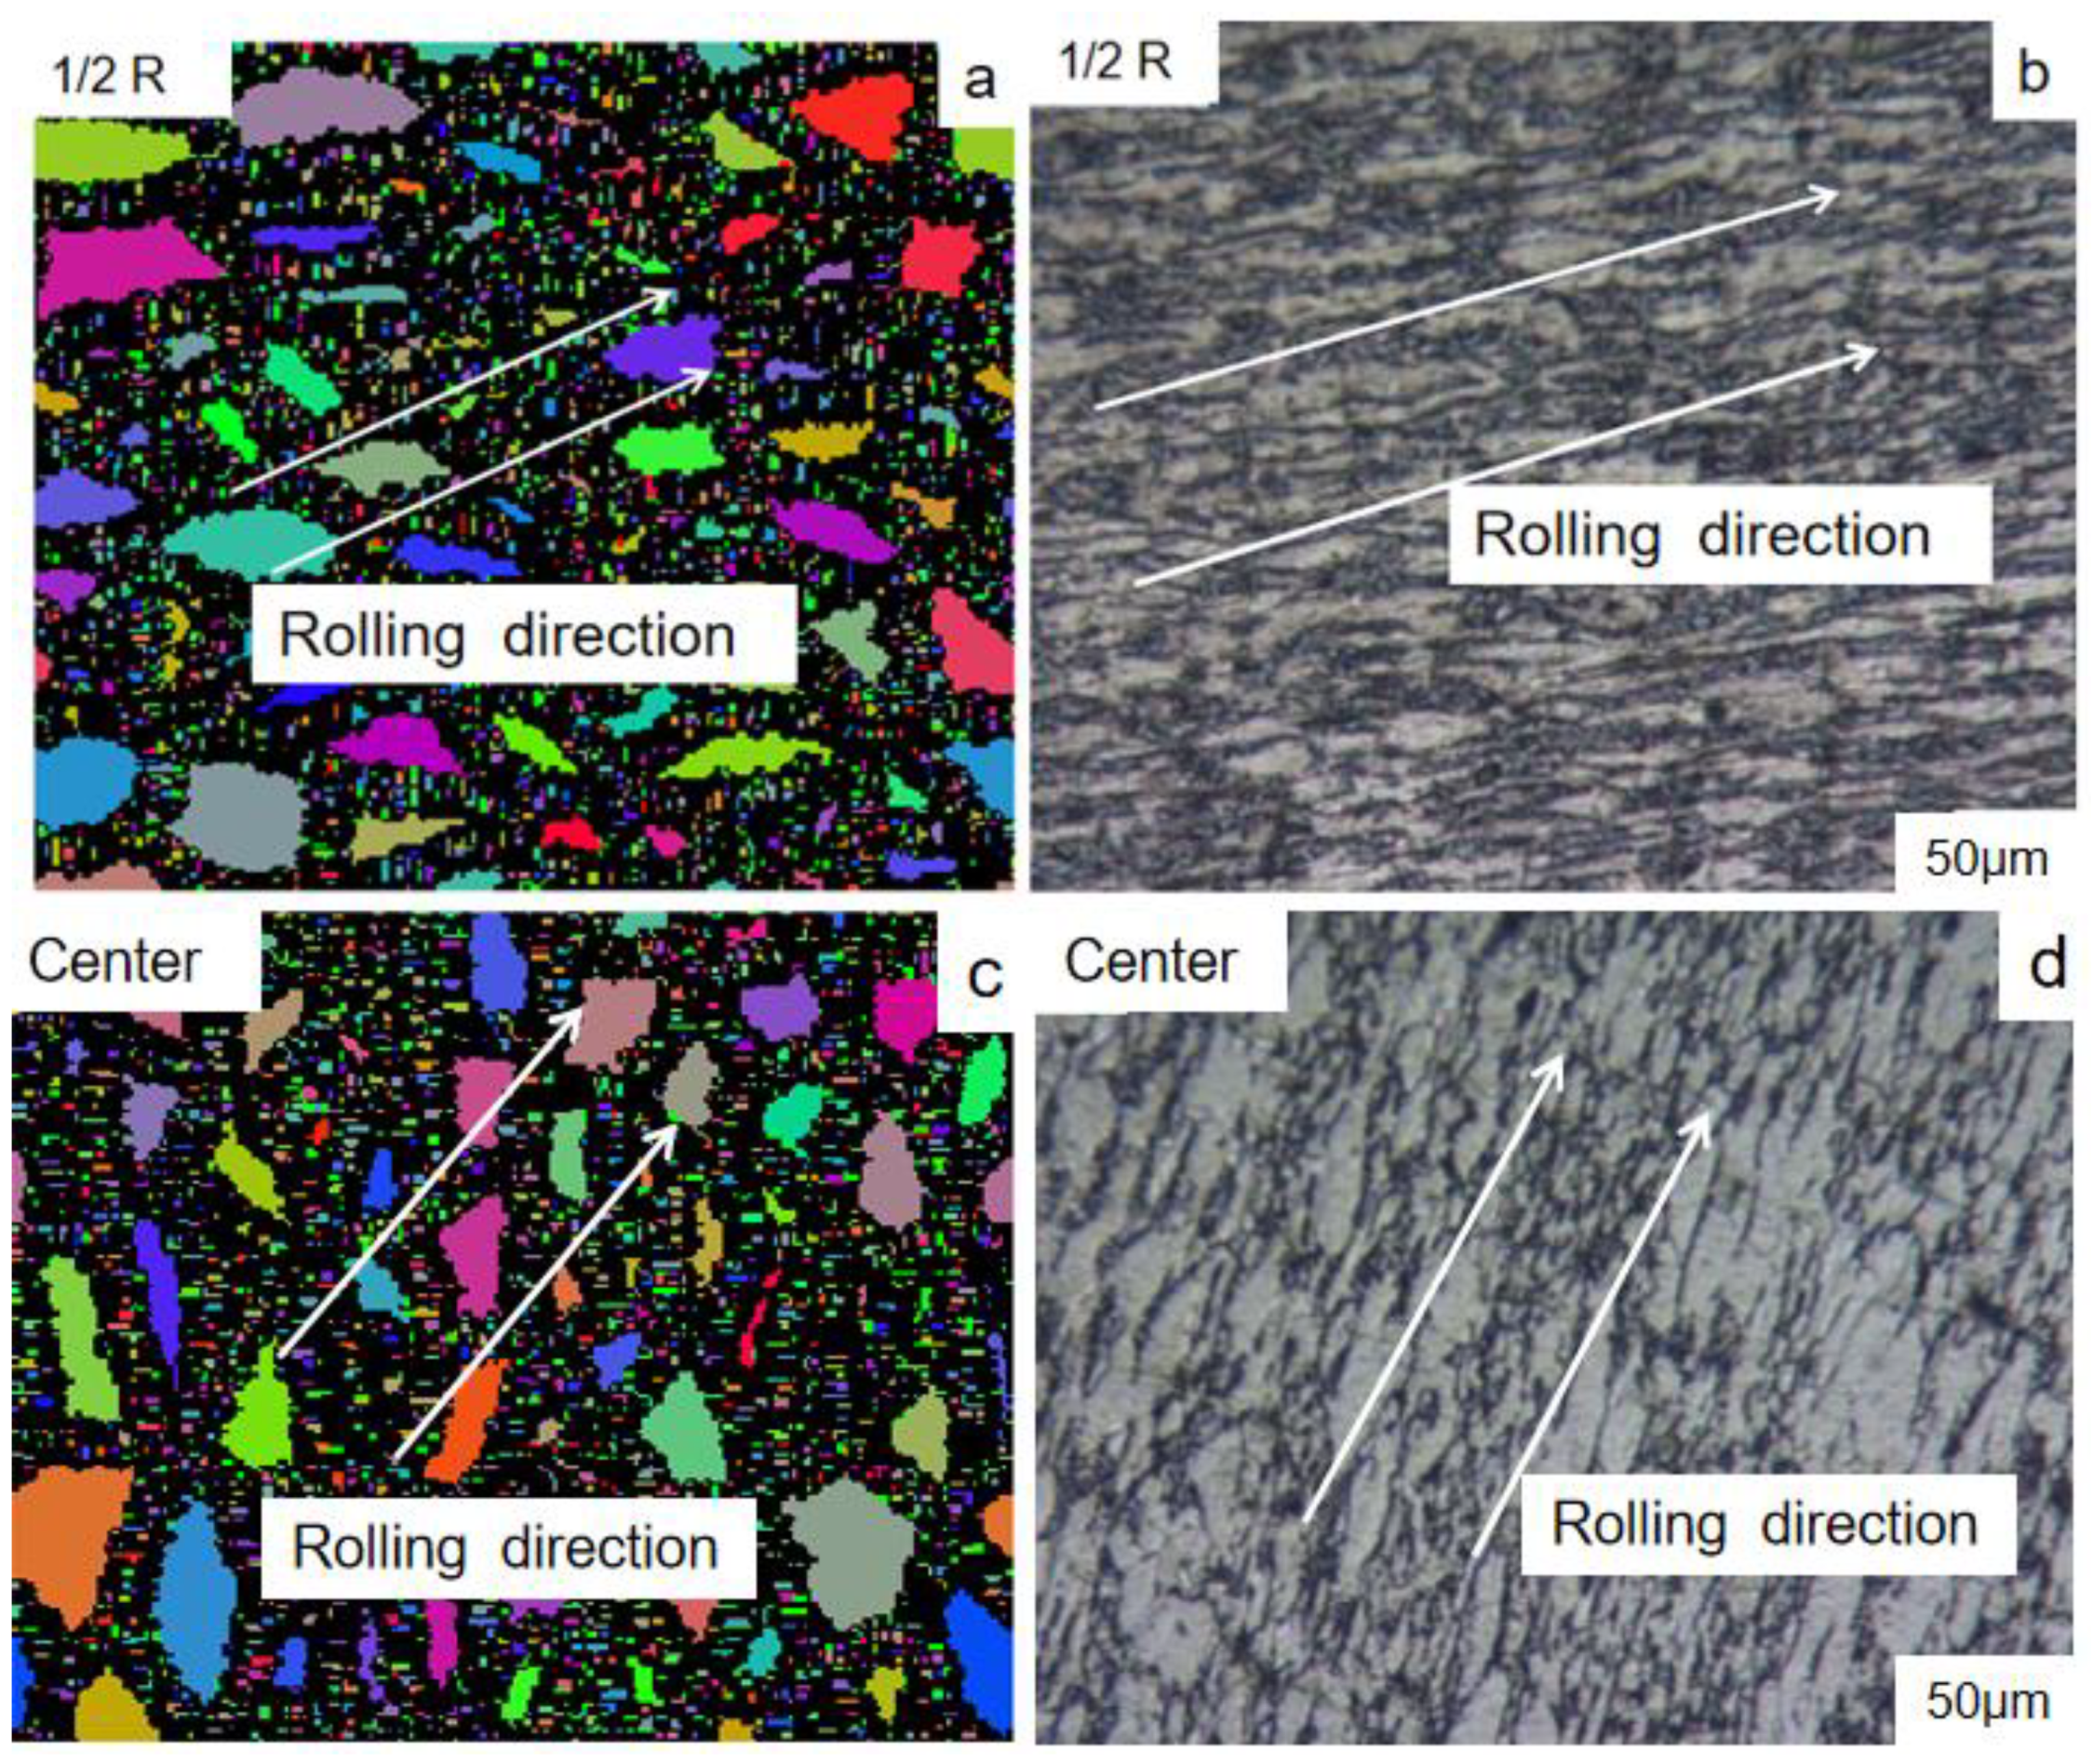
The microstructure appearances obtained by the experiment and CA simulation were compared, both of which belong to the equiaxed structure. The average grain size was between 10 and 16 μm. The grain size of the actual metallographic structure was slightly larger than that obtained by the CA model simulation. The main reasons may be the fact that the rolling mill bounce decreases the deformation degree and the uniformity of the temperature distribution, leading to insufficient recrystallization in actual rolling.

Author Contributions

All authors contributed to the study conception. The research was conceived and simulated by J.H., S.Y. and Z.S.; X.W. performed the experiment; H.X. revised the manuscript. All authors have read and agreed to the published version of the manuscript.

Funding

The authors acknowledge the Funds for the Major Project of Ministry of Science and Technology of Shanxi Province, China (No. 20191102009), and the Science and Technology Key Development Project of Shanxi Province, China (201903D121049).

Institutional Review Board Statement

Not applicable.

Informed Consent Statement

Not applicable.

Data Availability Statement

Not applicable.

Conflicts of Interest

The authors declare that there is no relevant conflict of interest.

References

  1. Wei, K. Production process of complex brass large size rod. China Nonferr. Met. 2012, 22, 64–65. [Google Scholar]
  2. Chen, L.; Yang, P.; Li, Z. Simulation of Texture Formation in Hot Forged TC18 Titanium Bars. Rare Met. Mater. Eng. 2021, 50, 3600–3608. [Google Scholar]
  3. Can, Z. Investigations on the Continuous Rolling Process of H13 Bars. Spec. Steel Technol. 2020, 26, 34–35. [Google Scholar]
  4. Wang, P.; Tang, L.; Sui, F. Large-size Bearing Steel Bar Rolling Process Optimization. Met. Mater. Metall. Eng. 2021, 39–44. [Google Scholar]
  5. Meirong, S. Study on Deformation Mechanism and Technology of Titanium Alloy Rod during Three-Roll Hot Continuous Rolling Process. Ph.D. Thesis, National Taiwan University of Science and Technology, Taipei, Taiwan, 2012. [Google Scholar]
  6. Lu, P. Design and Optimization of Titanium Alloy Rod Hole. Ph.D. Thesis, National Taiwan University of Science and Technology, Taipei, Taiwan, 2012. [Google Scholar]
  7. Min, X.; Ji, R.; Zhang, H.; Ma, W.; Lu, H. Hot continuous rolling process of TA15 titanium alloy rod. Chin. J. Nonferr. Met. 2010, 20, s148–s151. [Google Scholar]
  8. Xinwang, Z.; Yong, W.; Xiaowei, W. Numeral simulation of three-roll screenl rolling process for titanium alloy bar. Forg. Stamp. Technol. 2011, 36, 61–64. [Google Scholar]
  9. Lapovok, R.; Smirnov, S.; Solomein, V. Modeling the logical rolling of rods in a three-high mill. J. Mater. Process. Technol. 1998, 80–81, 365–369. [Google Scholar] [CrossRef]
  10. Stefanik, A.; Szota, P.; Mróz, S.; Dyja, H. Analysis of the Aluminum Bars in Three-High Skew Rolling Mill Rolling Process. Solid State Phenom. 2015, 220–221, 892–897. [Google Scholar] [CrossRef]
  11. Lu, W.; Baoshou, S.; Wenfei, P. Research on Numerical Simulation of Three-roll Screw Rolling Process for Titanium Alloy Bars. Hot Work. Technol. 2015, 44, 116–119. [Google Scholar]
  12. Xu, J.; Zeng, W.; Zhao, Q.; Zhou, D.; He, S.; Jia, R.; Zhou, X. Analysis of deformation behavior and microstructure of a near-alpha titanium alloy in single phase region. Mater. Sci. Eng. A 2020, 803, 140723. [Google Scholar] [CrossRef]
  13. Zhu, H.; Chen, F.; Zhang, H.; Cui, Z. Review on modeling and simulation of microstructure evolution during dynamic recystallization using cellular automaton method. Sci. China Technol. Sci. 2020, 63, 357–396. [Google Scholar] [CrossRef]
  14. Chu, Z.; Zhang, D.; Jiang, L. Microstructure Model of AZ31 Magnesium Alloy Based on Cellular Automaton. Rare Met. Mater. Eng. 2018, 47, 884–894. [Google Scholar]
  15. Li, W.; Chu, Z.; Wang, H. Growth Kinetics of Three-Dimensional Grains Based on Cellular Automata. Rare Metal. Mater. Eng. 2020, 49, 4088–4096. [Google Scholar]
  16. Han, D.; Zhao, Y.; Zeng, W. Cellular Automata Based Microstructure Prediction in Accumulative Roll-Bonding of TA15 Sheets. Rare Metal. Mater. Eng. 2021, 50, 3437–3445. [Google Scholar]
  17. Yumeng, L.; Jinxu, L.; Shukui, L.; Mu, L.; Lingli, G. Anisotropy of Mechanical Properties and Influencing Factors of Hot Rolling TC4 Titanium Alloy. Rare Metal. Mater. Eng. 2014, 43, 2692–2696. [Google Scholar]
  18. Cheng, L.; Hongbo, D. Cellular Automaton Simulation of Dynamic Recrystallization for TC4-DT Titanium Alloy in β Hot Process. J. Aeronaut. Mater. 2015, 35, 21–27. [Google Scholar]
  19. Song, X. Simulation of Microstructure Evolution of Ti40 Alloy During Hot Forming Process. Ph.D. Thesis, Nanchang Aeronautical University, Nanchang, China, 2013. [Google Scholar]
  20. Yi, Y.; Liu, C.; Huang, S. Simulation of dynamic recystallization for 7050 aluminum alloy on platform of DEFORM-3D using cellular automaton. J. Cent. South. Univ. (Sci. Technol.) 2010, 41, 1814–1820. [Google Scholar]
  21. Shuai, M.-R.; Li, H.-B.; Li, H.-Y. Analysis of microstructure evolution of TC4 rod during hot continuous rolling process. Trans. Mater. Heat Treat. 2017, 38, 41–47. [Google Scholar]
Figure 1. Spatial position relationship of the three-high skew rolling the bar.
Metals 12 00773 g001
Figure 2. The effective strain of the points at different positions.
Metals 12 00773 g002
Figure 3. Moore neighborhood.
Metals 12 00773 g003
Figure 4. Recrystallization volume percentage distribution of rolling the bar. (a) Initial biting stage; (b) Having been bitten stage; (c) Stable rolling stage.
Metals 12 00773 g004
Figure 5. Average grain size at the different stages of rolling the bar. (a) Before Rolling Bite; (b) Initial Biting stage; (c) Having been bitten stage; (d) Stable rolling stage.
Metals 12 00773 g005
Figure 6. Analysis of the microstructure evolution process of rolling the bar: (a) the original structure; (b) the biting stage; (c) during stable rolling; and (d) after rolling.
Metals 12 00773 g006
Figure 7. Tracking points’ position.
Metals 12 00773 g007
Figure 8. Comparison of the microstructure between the CA simulation and the experimental results. (a) Microstructure appearance at the 1/2 R from CA; (b) Microstructure appearance at the 1/2 R from experiment; (c) Microstructure appearance at the center from CA; (d) Microstructure appearance at the center from experiment.
Metals 12 00773 g008
Figure 9. Microstructure appearance analysis at point 2 in Figure 7.
Metals 12 00773 g009
Table 1. Rolling process parameters.
Diameter of Rolled Piece (mm)Rolling Temperature (°C)Roll Angular Velocity (rad s−1)Rolling Angle (°)Feeding Angle (°)Reduction (mm)
φ 3009501031550
Publisher’s Note: MDPI stays neutral with regard to jurisdictional claims in published maps and institutional affiliations.

