Article

The Laser Deposited Nickel-Aluminum Bronze Coatings on SUS630 Stainless Steel and Its Corrosion Resistance in 3.5 wt.% NaCl Solution

1
Institute of Engineering Thermophysics, Chinese Academy of Sciences, Beijing 100190, China
2
University of Chinese Academy of Sciences, Beijing 100049, China
*
Author to whom correspondence should be addressed.
Metals 2022, 12(5), 781; https://doi.org/10.3390/met12050781
Submission received: 16 March 2022 / Revised: 27 April 2022 / Accepted: 27 April 2022 / Published: 30 April 2022

Abstract

:
In this work, three composite structures of nickel-aluminum bronze (NAB) bonded with SUS630 stainless steel with different intermediate layers were fabricated by laser deposition. The microstructure and corrosion behavior of NAB in 3.5 wt.% NaCl solution were studied. The NAB coating directly deposited on steel substrate contains a large number of Fe-rich dendrites due to the dilution by laser energy and the Cu-Fe liquid phase separation characteristics. The microstructures of NAB were independent and isolated well from the steel substrate when the nickel intermediate layer was applied. Immersion corrosion and electrochemical tests indicated that the composite structure with the nickel intermediate layer presented better corrosion resistance than direct deposited the NAB coating, especially with the NiCr alloy intermediate layer, which led to a shallower corrosion depth and formed a denser layer of protective corrosion products.

1. Introduction

Nickel-aluminum bronze (NAB) is a class of alloy with high fatigue strength and seawater corrosion resistance, good casting performance, and availability to be machined and repaired by welding, that has become the preferred material for various types of propellers [1,2,3]. This material is formed by adding a small amount of Ni, Fe and other alloying elements into a Cu-Al matrix. Due to its low tensile strength (about 600 MPa), in order to bear the huge load, the NAB propeller has to be designed very large in size. The traditional manufacturing method for the NAB propeller is integral casting, but the casting process of large parts is prone to defect generation such as shrinkage porosity, shrinkage cavity and cold insulation [4]. Compared to casting NAB, stainless steel has better tensile properties, which can be used for weight reduction of the original parts design to achieve the same specific strength. Combining the advantages of both steel and bronze, a composite structure can be constructed using the steel as the substrate and bronze as the coating, which can achieve high strength, corrosion resistance and cost reduction at the same time. However, such composite structure arises a crucial problem of metallurgical bonding between the coating and the substrate.
Various methods were taken to obtain a steel-copper bimetallic alloy, such as friction welding for copper and low-carbon steel with the maximum shear strength more than 200 MPa, electrodeposition-diffusion method for carbon steel and gradient copper layers and laser welding for brass and 304 stainless steel with the largest joint force of 89 N. These methods cannot be applied for the high-strength anticorrosive structures due to the strict joint shape requirements or insufficient bonding strength. Furthermore, modern coating techniques are considered to obtain NAB coatings. Barik et al. [5] fabricated NAB coating by thermal spraying and studied its erosion–corrosion performance. However, the porosity of the coating was about 1%, which is detrimental to the anti-corrosion performance of the coating, because the electrolyte could penetrate the coating, reducing the life of not only the coating itself but also the substrate. Hyatt et al. [6] fabricated NAB alloy by laser cladding and a dense NAB layer with little defects was successfully fabricated. Therefore, it is feasible to deposit NAB coating using metallurgical methods.
The corrosion resistance can be further improved by changing the composition of the protecting layer. Qin et al. [7] modified the surface microstructure by chromium ion implantation, the intrinsic selective phase corrosion of as-cast NAB was effectively inhibited when the implantation rate was 5 × 10¹⁷ ions/cm2. They suggested that the improved corrosion resistance after ion implantation was due to the rapid formation of protective films containing chromium oxide and hydroxide. Luo et al. [8] used a thermal diffusion method to modify the surface of the NAB alloy, using the intrinsic characteristics of Cu, Ni and Al and their diffusion systems to form a gradient structure. The results showed that the corrosion of the outer layer of the Ni-Cu solid solution was not severe and the corrosion was uniform, indicating that the thermal diffusion modification coating could effectively improve the selective phase corrosion of the NAB alloy. It provides an inspiration that the diffusion of nickel in copper alloy can be achieved from a partially diluted nickel substrate in the laser processing; therefore, nickel alloy is considered as the intermediate layer between the steel substrate and NAB coating. In order to retain the type of elements in the NAB coating, the composite structure scheme with a NiAl intermediate layer is proposed. Moreover, considering the excellent corrosion resistance of chromium element, NiCr alloy can be selected as the intermediate layer.
The aim of this research is devoted to achieving a multi-metallic structure of deposited NAB alloys reinforced by SUS630 stainless steel with different intermediate layers to maintain the corrosion resistance of NAB. The microstructures and electrochemical measurements of NAB alloys were determined. In particular, the contribution of a Ni-based intermediate layer for the improvement of corrosion resistance is investigated.

2. Materials and Methods

2.1. Materials

SUS630 stainless steel was selected as the substrate material with a dimension of 100.00 (±0.02) mm × 100.00 (±0.02) mm × 20.00 (±0.02) mm in this experiment. The surface was cleaned with acetone and ethanol. NAB, KF-6 and KF-306 powders were selected as coating materials with the particle size of 53 μm~120 μm and dried at 120 (±5) °C for 3 h. Table 1 shows the chemical composition of the powders.

2.2. Forming Composite Structures

Three composite structures were fabricated using a TruDiode 3006 fiber laser device from TRUMPF: one is NAB coating deposited on steel directly, and the other two are composite structures with different nickel-based intermediate layers in between steel and NAB coating. The material and dosage schemes are listed in Table 2. For the convenience of the following analysis, the three groups of specimens are named as N-1, N-2 and N-3, respectively. A same set of processing parameters was applied: spot diameter of 3.2 (±0.01) mm, multi-channel overlap ratio of 50 (±1)%, scan speed of 1000 (±5) mm/min, laser power of 2400 (±5) W for NAB and 1500 (±5) W for nickel based alloys, respectively.

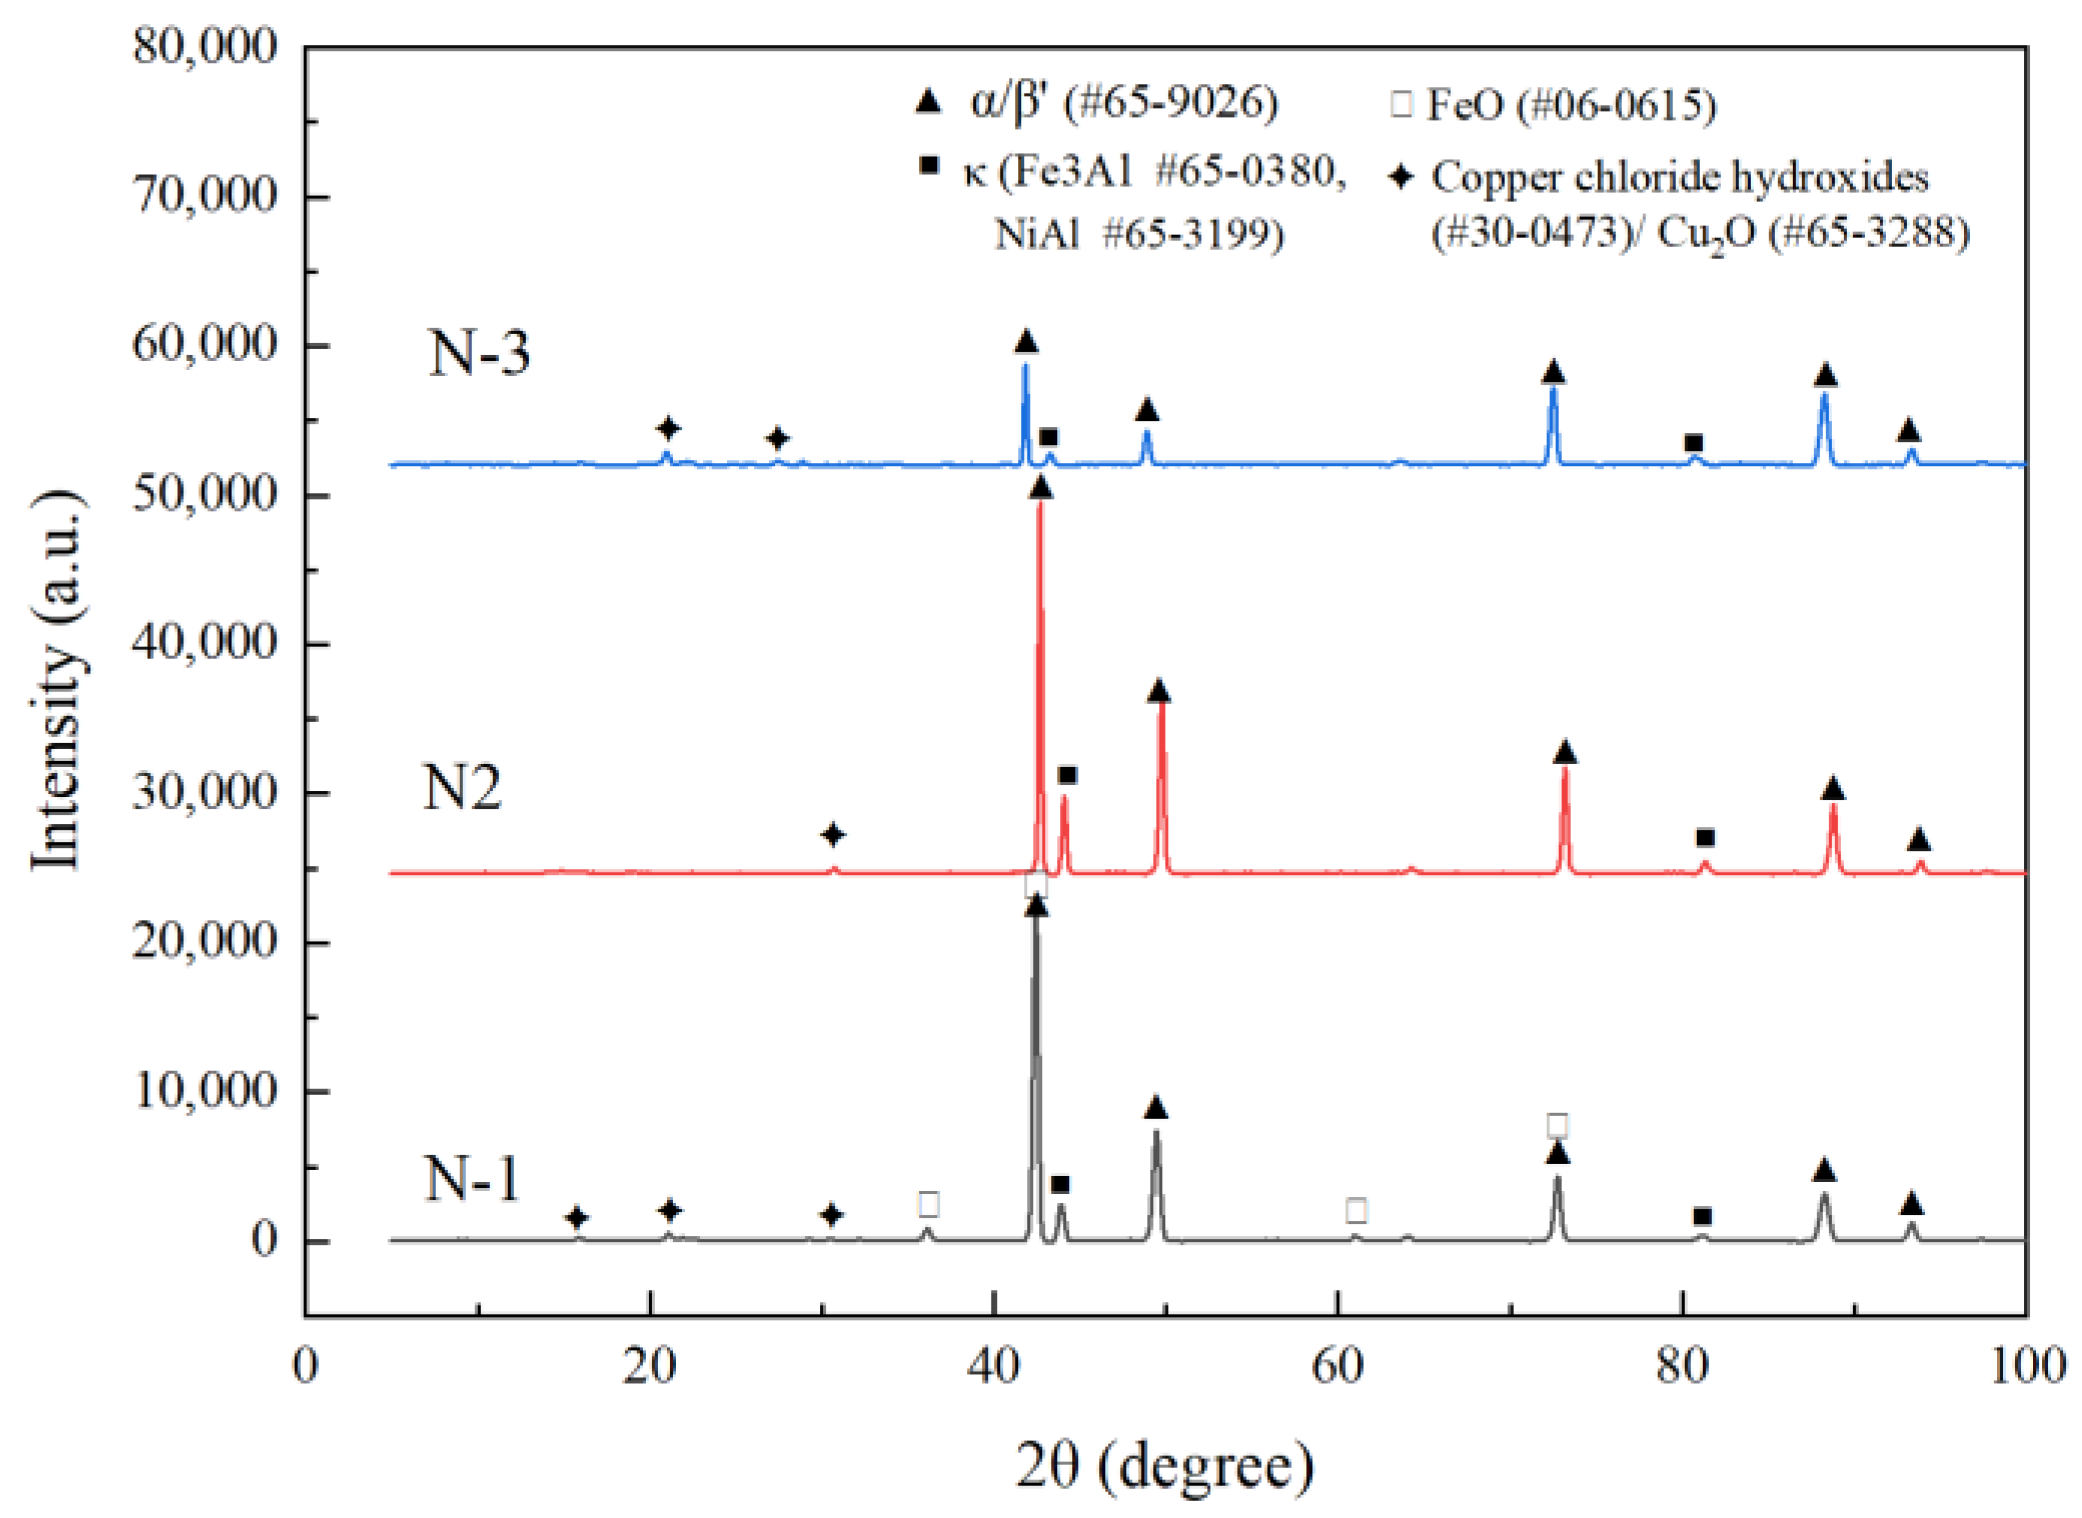
2.3. X-ray Diffraction

The phases of the coatings were analyzed by X-ray diffractometer (XRD, D8ADVANCE, BRUKER, Cu Kα radiation source, voltage: 40 kV, current: 40 mA) at a continuous scanning speed of 2°/min.

2.4. Scanning Electron Microscopy (SEM)

The samples were mechanically ground until 2000# sandpaper, and polished with 3 μm and 1 μm diamond polishing agents. The polished surfaces were etched with a solution of 5 g FeCl3 + 25 mL HCl + 100 mL H2O. The thickness of NAB coatings as well as the intermediate layer were measured by an optical microscope (Olympus GX51, Olympus Corp., Tokyo, Japan). A scanning electron microscope (SEM, Zeiss Supra 55, Zeiss Corp., Jena, Germany) equipped with energy dispersive spectroscopy (EDS) was used for microstructure characterization. Backscattered electron imaging (BSE) was carried out to distinguish the surface topography and surface chemistry.

2.5. Tensile Property

On the basic NAB layer, five more layers were deposited for a bonding strength test. The tensile samples were built along the steel–bronze longitudinal direction with the interface(s) located in the center. The gauge distance and thickness were 10 mm and 1.4 mm, respectively. The test was performed with a CMT 5305GL machine at room temperature with a load speed of 0.1 mm/min.

2.6. Corrosion Resistance Tests

2.6.1. Electrochemical Measurements

The samples were cut into 10.00 (±0.02) mm × 10.00 (±0.02) mm × 8.00 (±0.02) mm, backed with copper wires, and embedded in epoxy resin ensuring an exposed area of 1.00 (±0.01) cm2 for electrochemical test. All samples were ground and polished. They were washed with distilled water, dried in cold air, and quickly transferred into 3.5 wt.% NaCl solution. Electrochemical measurements were tested at 25 (±5) °C.
Experiments were conducted using a Gamry Reference 600 potentiostat (Gamry Instruments Inc., Philadelphia, PA, USA). A three-electrode single-compartment glass cell was used. The deposited alloy was used as the working electrode, a large platinum foil with dimensions of 2.0 cm × 2.0 cm was used as the counter electrode and an Ag/AgCl electrode (saturated KCl electrode, electrode potential 0.1981 V vs. standard hydrogen electrode) was selected as the reference electrode.
In order to be steady-state, all samples were immersed in a corrosive medium for 20 min, and triplicate experimentation was used. The potentiodynamic polarization was carried out at the potential from −300 mV to 300 mV relative to open circuit potential (OCP) with a scan potential step of 0.5 mV. Although a 0.5 mV/s was adopted in this stage of the experimentation, it was remarked that this selection was based on the fact that no substantial distortions were provided in the polarization curves obtained. In this sense, it was worth noting that the potential scan rate had an important role in order to minimize the effects of distortion in Tafel slopes and corrosion current density analyses, as previously reported [9,10,11,12].

2.6.2. Electrochemical Impedance Spectroscopy

The EIS measurement on electrochemical samples was performed at OCP frequency ranging from 105 Hz~10−2 Hz with the AC signal of 5 mV. The EIS data were fitted and analyzed using the Zsimpwin 3.10 software package.

2.6.3. Corrosion Behavior

Immersion corrosion tests, following the ASTM G31-72 standard, were carried out to evaluate the formation of corrosion products. Gravimetric measurement was done to assess for corrosion. Samples were weighed before and after immersion using a Mettler Toledo ME104 analytical balance with an accuracy of 0.1 mg. Images of the samples were taken after this process using a Canon EOS 70D digital camera. The corroded samples were embedded with epoxy resin, sawed after solidification and ground until 2000# sandpaper and polished until 1 μm. Then, the corrosion depth was observed by using a secondary electron probe of an electron microscope.

3. Results and Discussion

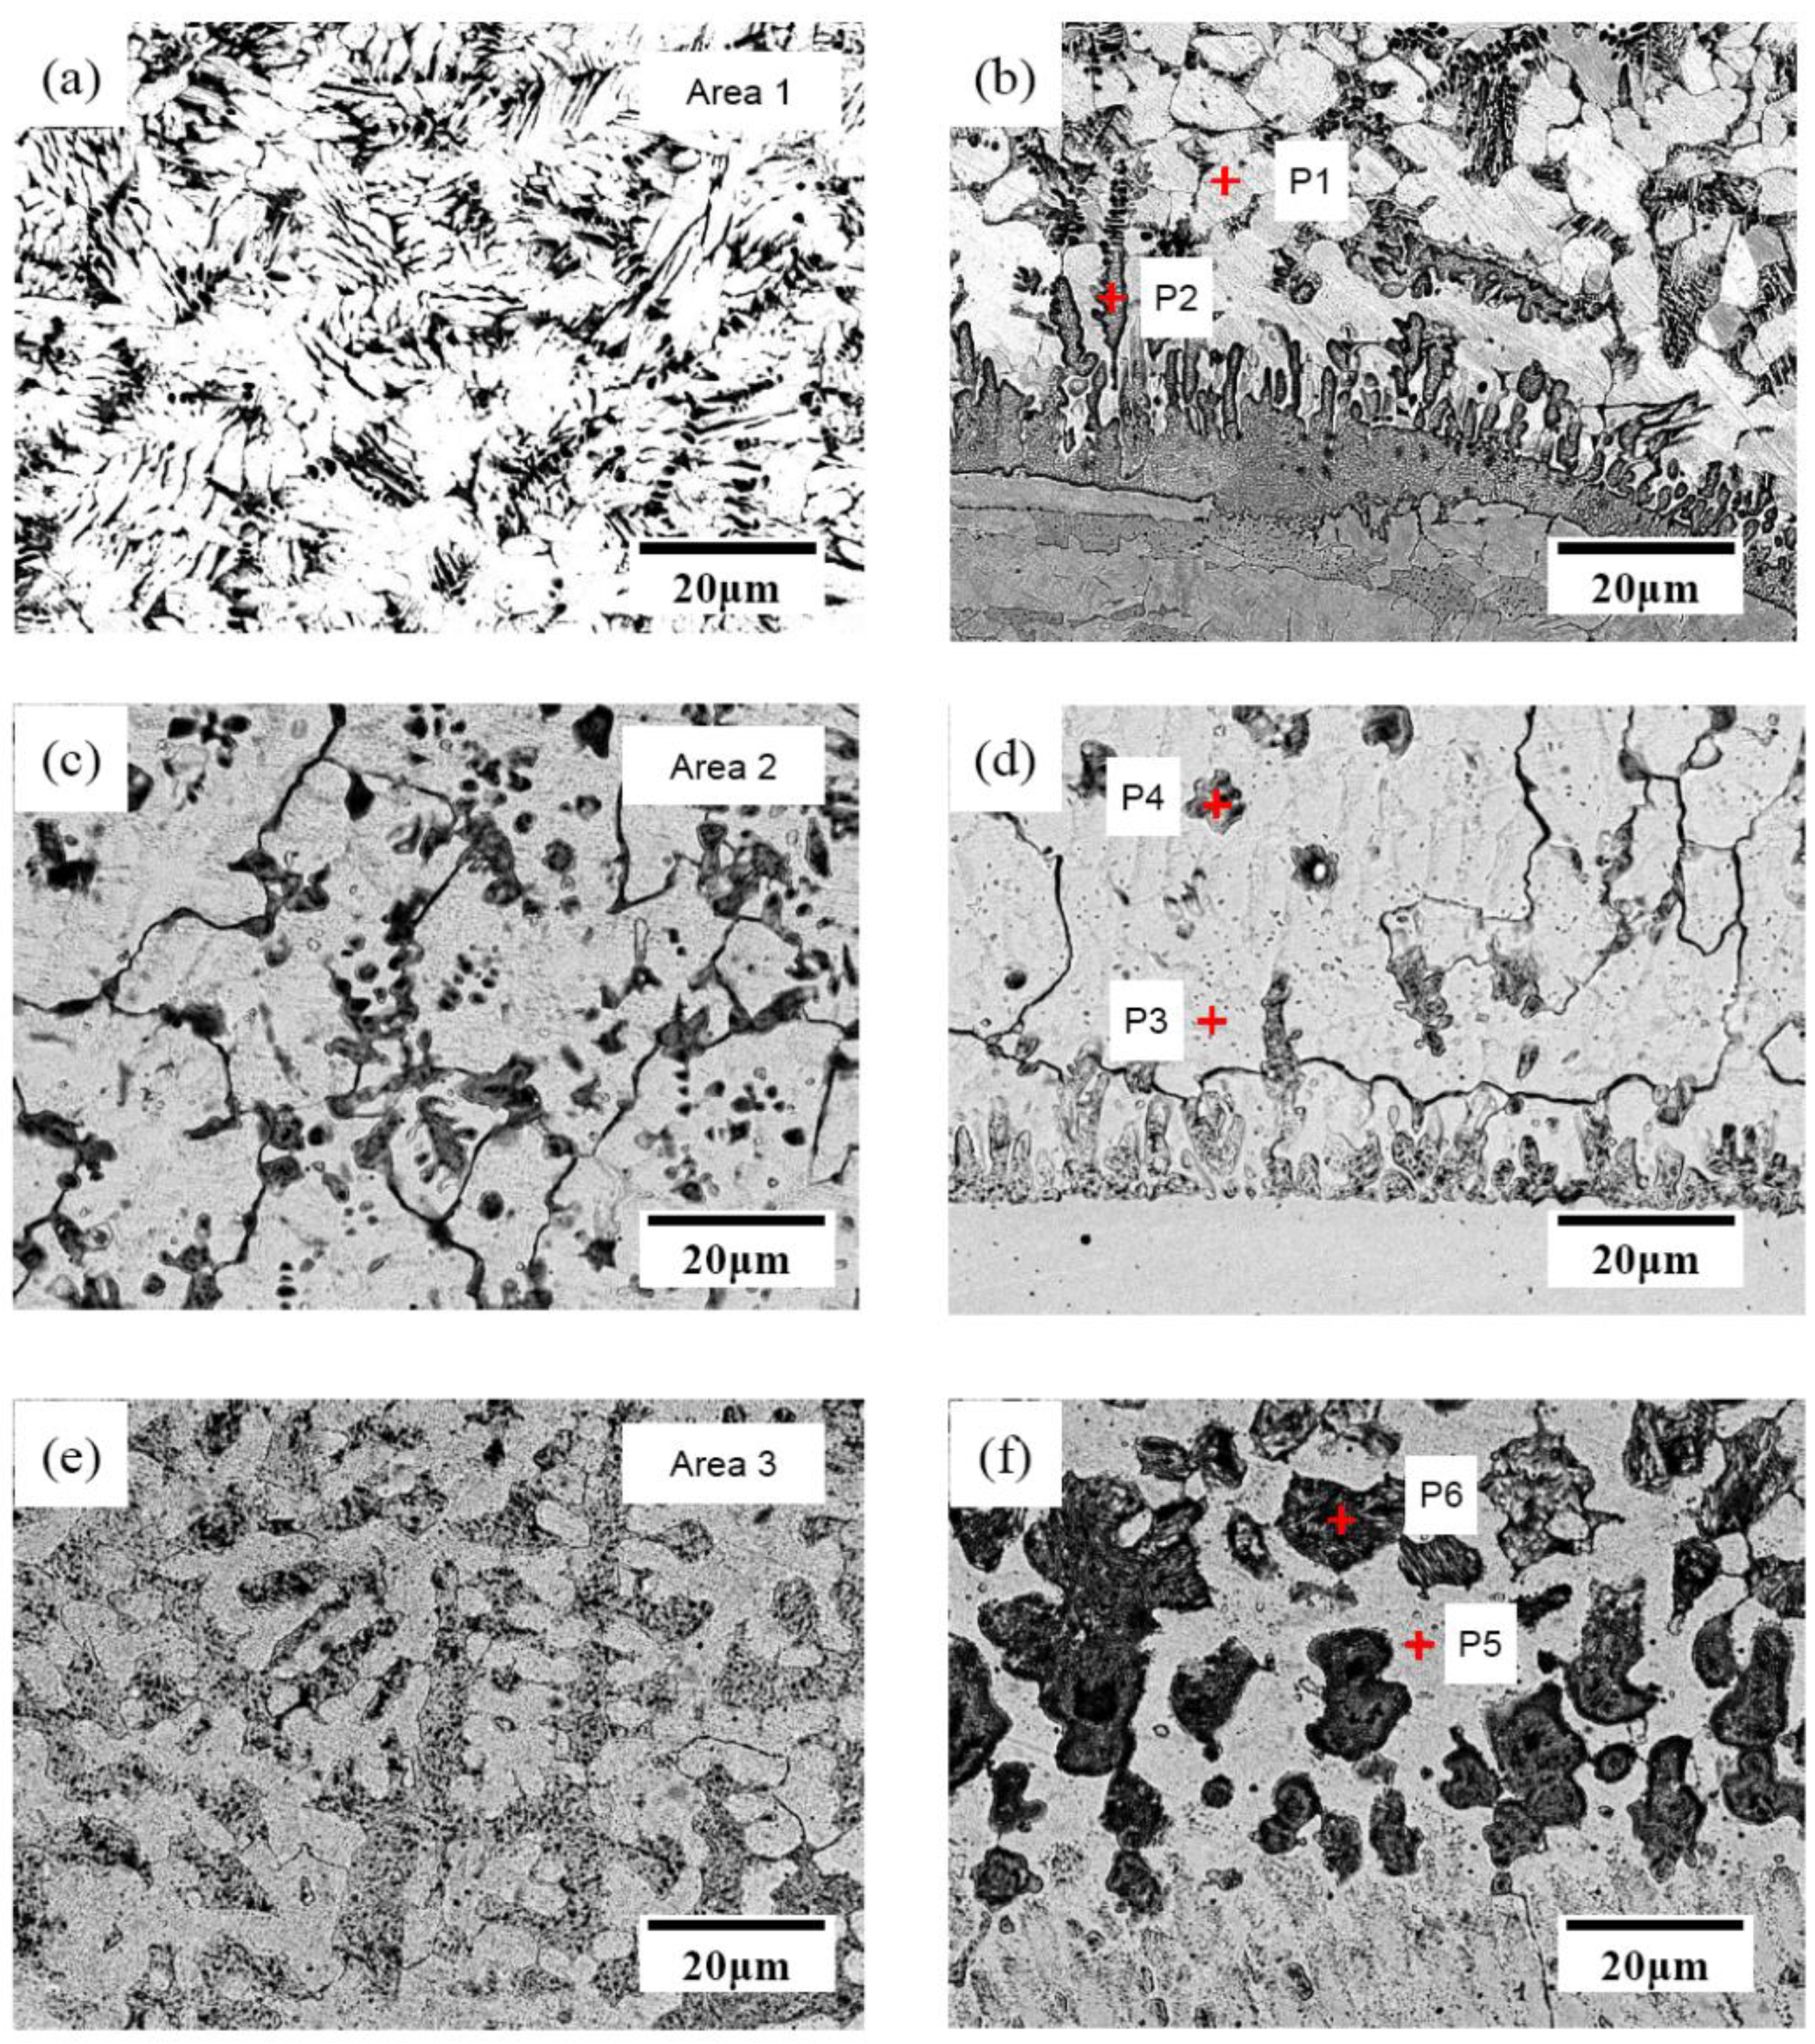
3.1. Depositing Microstructure and Composition

The composite structure consisted of a Ni-based intermediate layer and a NAB coating, with the thickness of 0.6–0.8 mm and 1.6–1.8 mm, respectively. The microstructures of the cross-section of the composite structures are shown in Figure 1. It can be observed that the microstructures of the composites are very different with and without an intermediate layer. The chemical compositions of the points are marked by the red cross and the upper zone of the NAB layer in Figure 1 is listed in Table 3. As seen in Figure 1a,b, the columnar and dendritic grains can be observed above the interface. The grains near the top surface are finer than that of near the interface. The grain type and size are determined by the ratio of solidification rate (R) and the temperature gradient (G). In the region near the fusion line, the temperature gradient G is largest here, and the solidification rate R is almost zero. Due to the constitutional supercooling condition, the solid–liquid interface grows in planar manner with slow speed from the interface towards the liquid phase. Any small bulges on the solid–liquid interface will be melted by the superheated area of the liquid; thus, solid liquid interface moved forward with a planar interface. As away from the fusion line, G decreases and so does the ratio of G/R, so that the planar interface becomes unstable and the grains grow in a cellular manner and eventually grow into cellular and columnar dendrites. The thermal process during the laser depositing enhanced the element dilution at the interface so that extra steel melt mixed into the molten pool by the Marangoni force and subsequently solidified in the NAB layer. According to the Cu-Fe phase diagram [13], Fe has limited solubility in Cu, so that Fe-rich dendrites were observed in the NAB layer. Different from N-1, coarser α-Cu and fewer κ phases formed in the NAB coatings of N-2, which grew on the NiAl alloy intermediate layer, as seen in Figure 1c,d. The dark lines at the grain boundaries could be NiAl precipitates [14]. No Cr content was detected in Area 2, which indicates that the NAB was isolated well from steel by the intermediate layer. Figure 1e,f shows the different features from N-2. Few dark lines along boundaries could be seen, and grey columnar and dark cellular dendrites formed among the α-Cu. The raw material KF-306 contains 20 wt.% Cr, and the content of Cr in Aera 3 was measured as 1.9 wt.%. According to the Cu-Cr phase diagram [15], eutectic reaction occurs at 1076 °C when Cr content is 1.27 wt.%. Therefore, it is presumed that the dark regions in the NAB layer were Cr solid solution and Cu-Cr eutectic.
The XRD analysis was carried out to further determine the presence of the phases in the deposited layer (Figure 2). Similar diffraction peaks in patterns can be observed for the three samples. Due to the similarity in composition and crystal structure, the diffraction peaks of α-Cu and β’ phases overlapped [16], and so did α-Cu and Fe. It is observable that the microstructure of the deposited layer mainly consists of the α-Cu phase, some portion of retained β (β′) and series of intermetallic κ precipitates. Especially, the surfaces tested by XRD include both the deposited coating, so that nickel phases existed in N-2 and N-3.

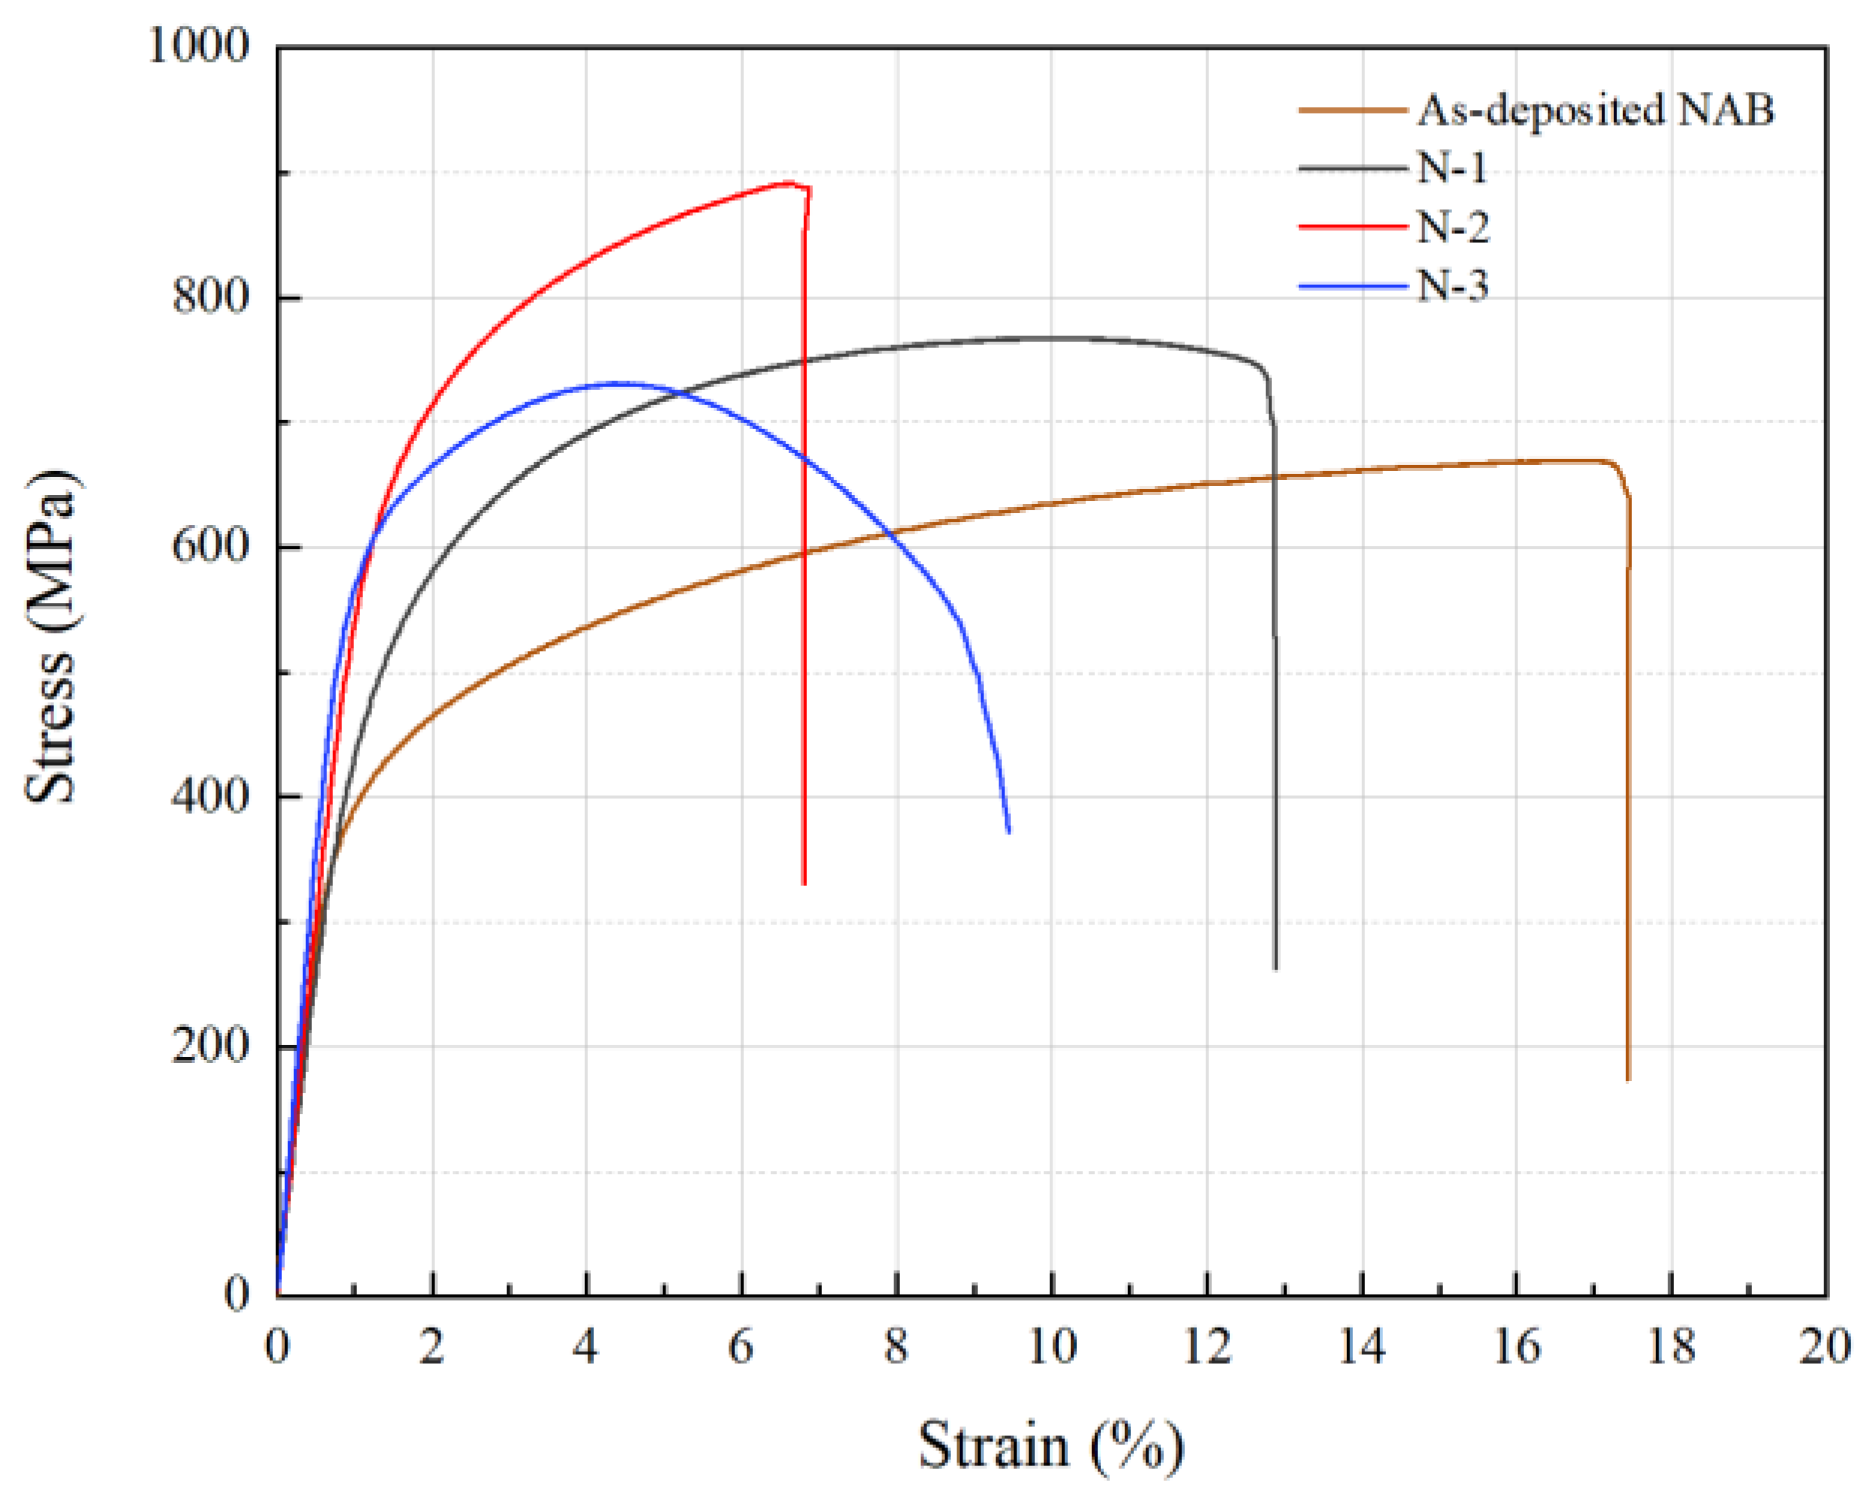
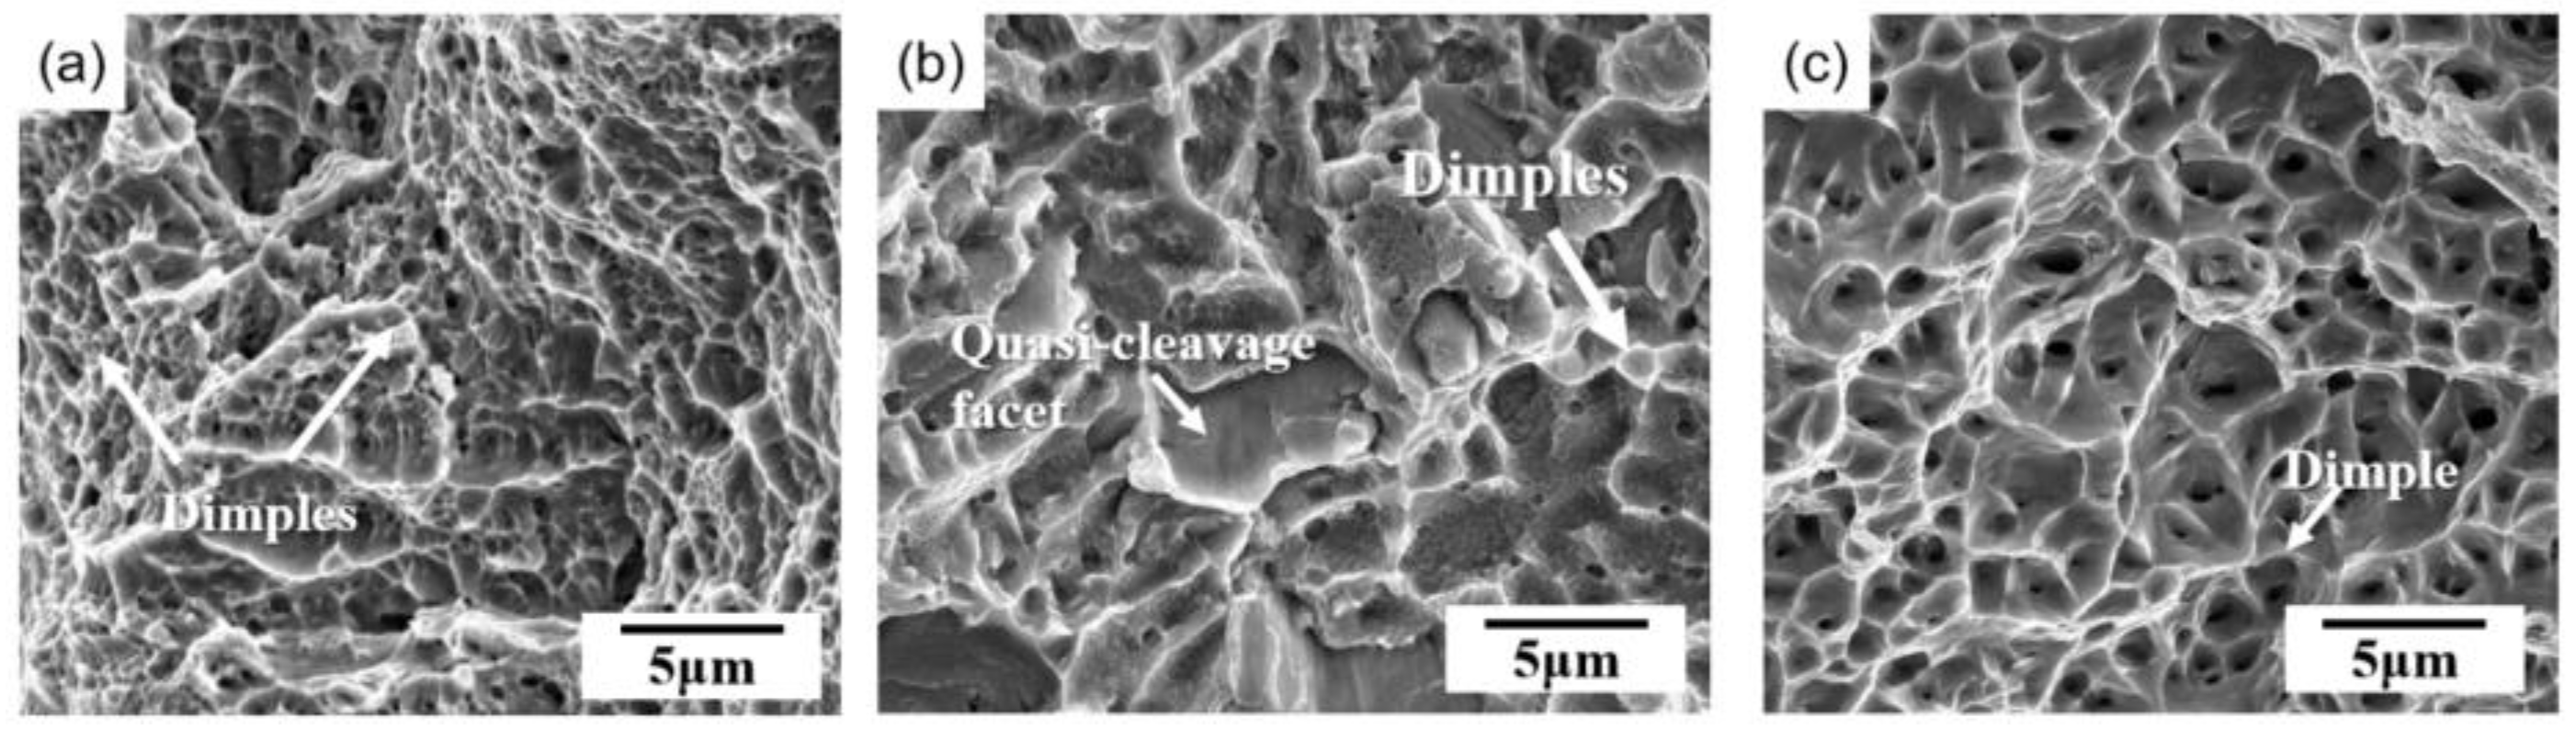
3.2. Physical-Mechanical Property

Figure 3 shows the tensile stress–strain curves of as-deposited NAB alloy and three composite structures. Table 4 lists the room temperature tensile results of the samples. The tensile strength of the three specimens exceeds the strength of as-deposited NAB. Figure 4 shows the tensile fractographs. The fracture occurred on one side of the NAB, and there were many dimples on the fracture surface, indicating that N-1 is a ductile fracture. Both N-2 and N-3 fractured near the intermediate layer. N-2 has the lowest elongation among all samples, few dimples and cleavage planes can be found in its fracture surface. The liquation crack of intermetallic compounds caused by the high Al content of the NAB near the interface was probably the main reason for the fracture.

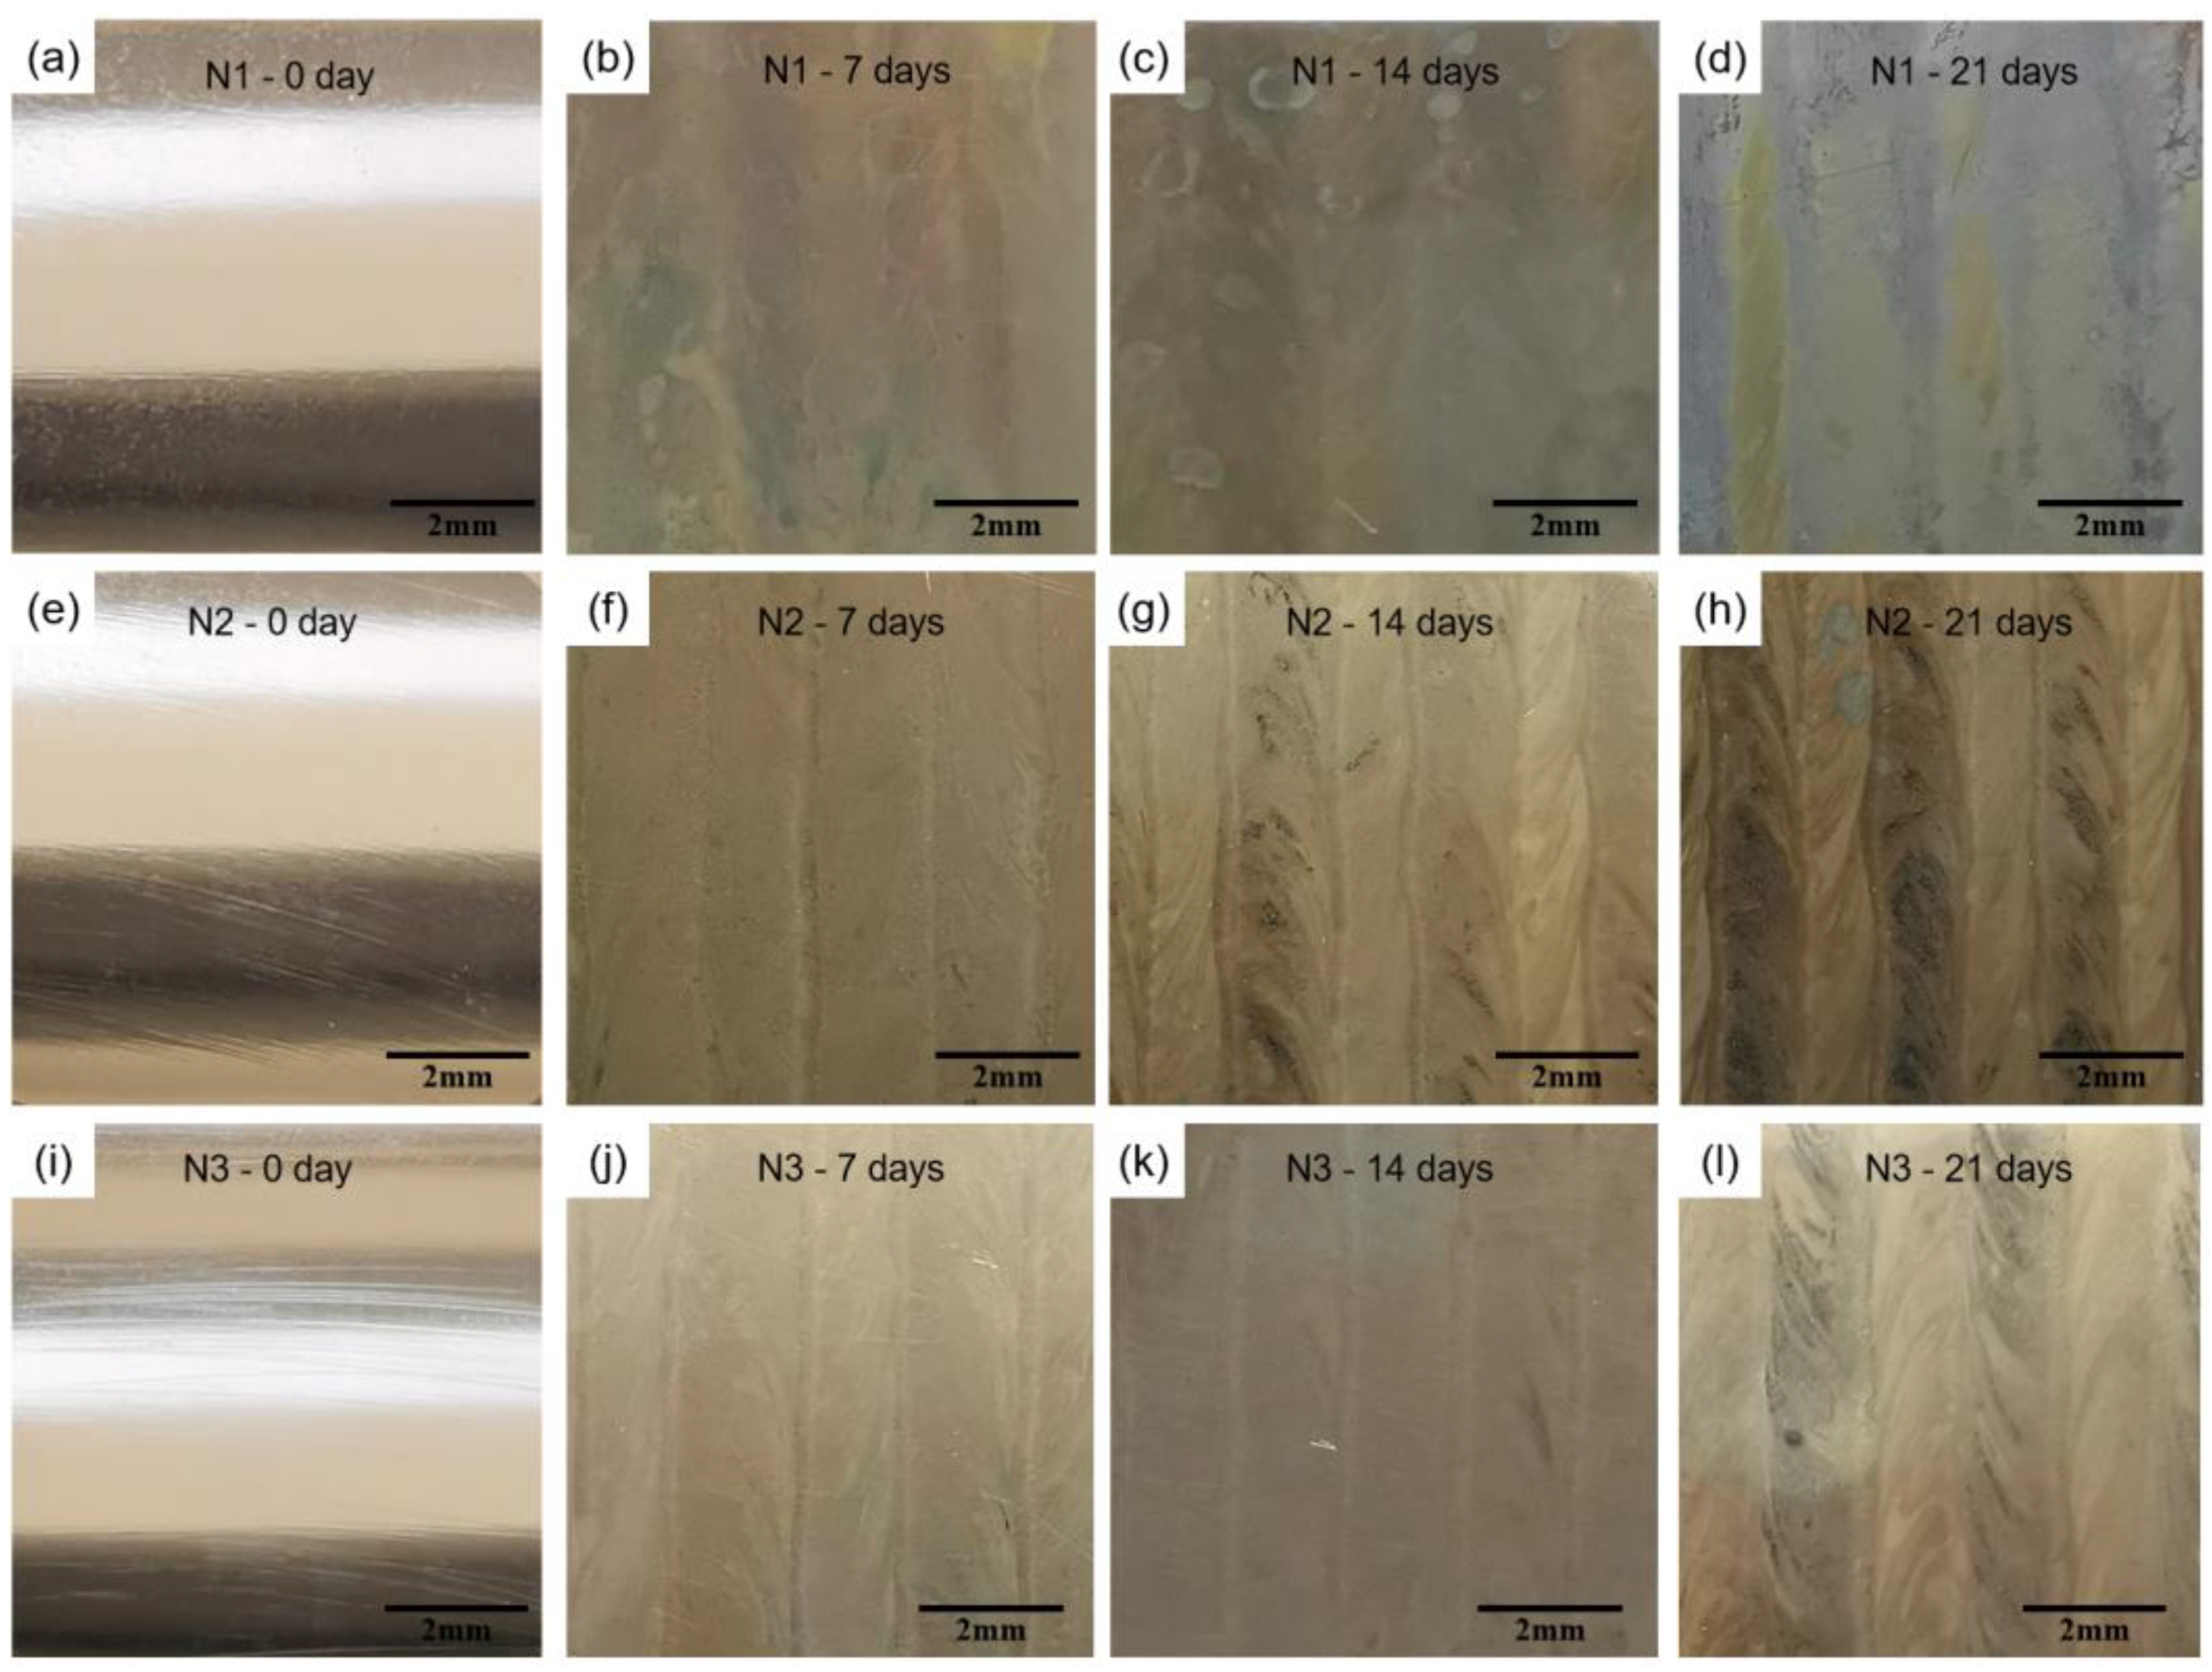
3.3. Corrosion Behavior in 3.5 wt.% NaCl Solution

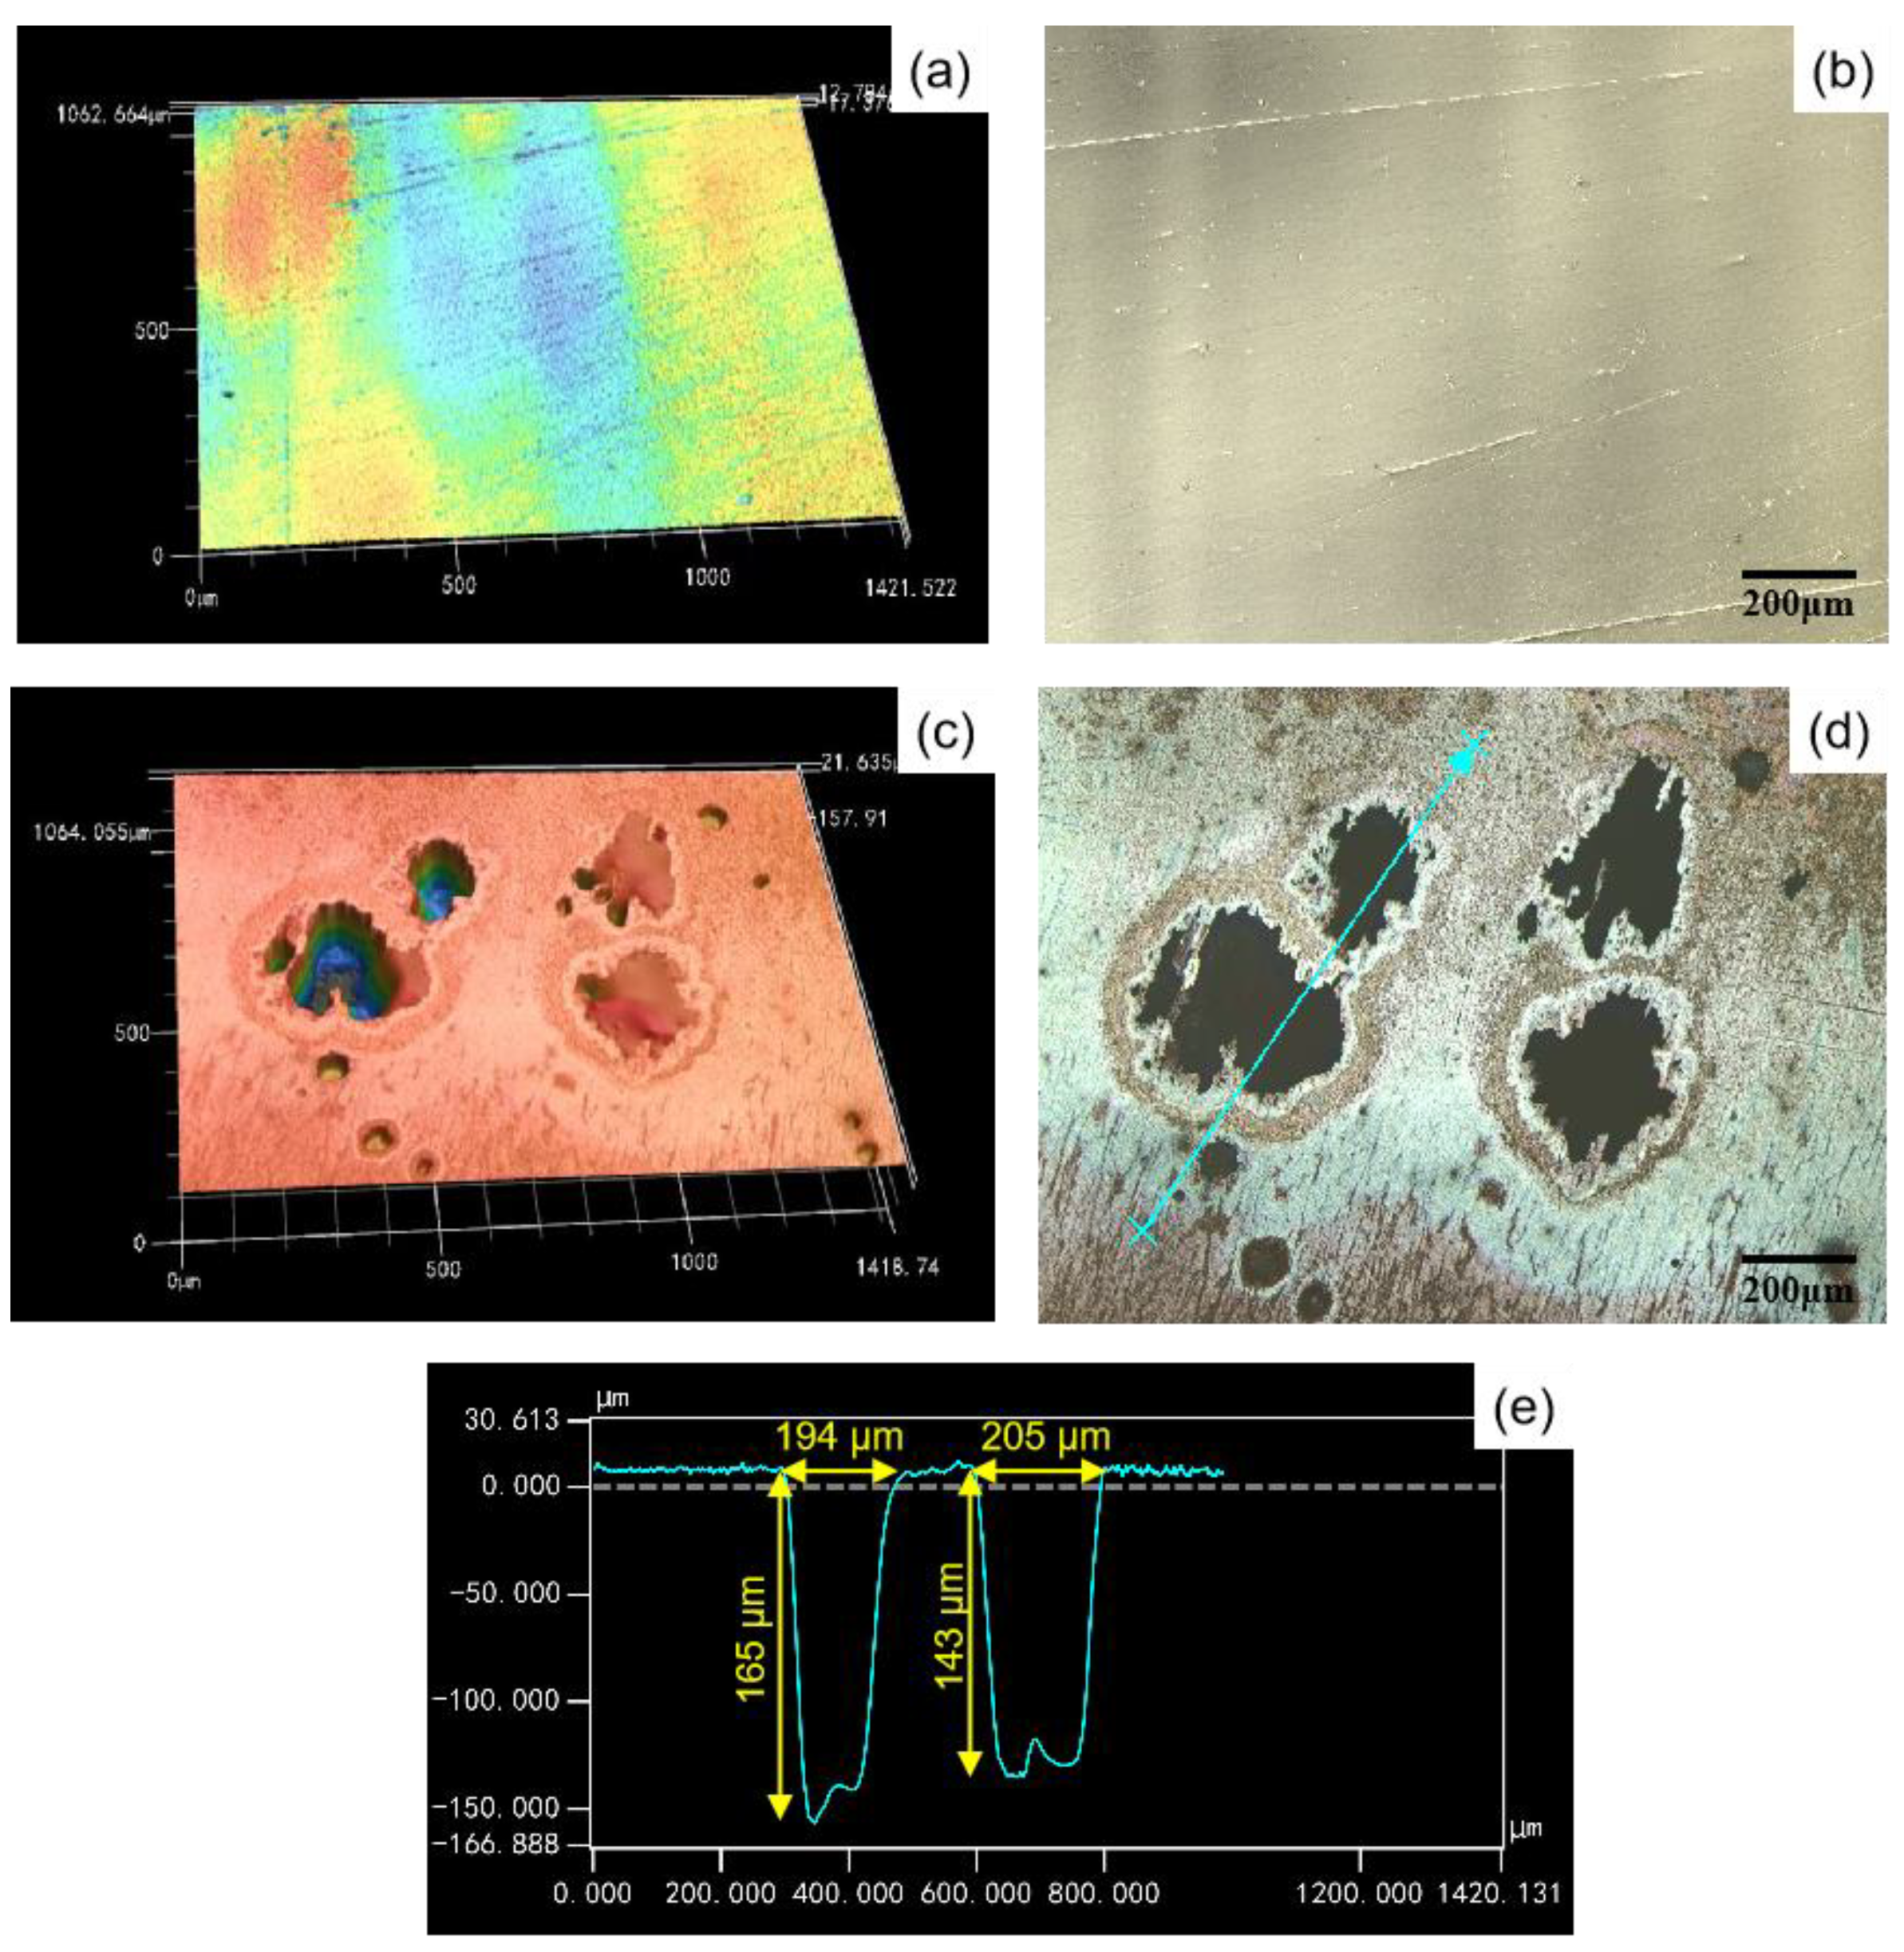
3.3.1. Morphology and Composition

Figure 5 shows the surface morphologies of the samples after immersing in 3.5 wt.% NaCl solution for different periods. N-1 samples exhibited the most severely corroded appearance. Red rust and green corrosion products were formed on the surface after 7 days, and much more after 21 days. Obvious green corrosion products appeared on N-2 after 14 days, and green corrosion products could not be clearly observed in N-3 until 21 days of immersion.
Figure 6 shows the weight changes of samples after different immersed time compared to their own original weight value before immersion. N-1 lost the most weight after immersed for 7 days, and the weight loss was lower after 14 days than that of 7 days. The weight change turned to an increase after immersed for 21 days. N-2 lost weight after immersed for 7 days and then the weight changes displayed an increase as the immersed time got longer. The weight of N-3 increased higher and higher from 7 days. Mass changes did not show a stable trend. The reasons for weight change most likely related to the formation of corrosion product film, film dissolution, cation dissolution of matrix and other factors.
In order to determine the corrosion products of the NAB layer, XRD tests were carried out on the alloy surfaces that immersed for 21 days, and the results are shown in Figure 7. The phases on the surfaces are mainly α/β’, κ, and copper chloride hydroxides (Cu2(OH)3Cl), as well as FeO particularly in N-1. The corrosion products of Al, Ni and Cu (intermediate product—Cu2O) was not found by XRD, which may be caused by the resolution of the XRD. The specimens were re-inlaid and prepared for observation of the corrosion product layer. Figure 8 shows the cross-sections of three groups immersed in 3.5 wt.% NaCl solution for different periods. The corrosion depth increased with the increase of immersion time, and the maximum corrosion depth was 3.4 (±0.1) μm, 2.0 (±0.1) μm and 1.8 (±0.1) μm, respectively. The most obvious corrosion occurred on the Fe-rich dendrites of N-1 that was without an intermediate layer (Figure 8a–d). According to the EDS result of point 2 shown in Table 3, the iron content was measured to be 56.1 wt.%. Compared with other phases, the Fe-rich dendrites with lower potential were preferentially corroded as the anode consecutively. The obvious corrosion of N-2 also occurred on the dark phase, but with a shallower depth (Figure 8e–h). With the nickel content of the NAB layer high up to 12.4% (Aera 2 in Figure 1), the corrosion product film gets denser with the increase content of nickel in the NAB alloy [17], and the local corrosion of the NAB can be significantly alleviated to better protect the matrix from further damage of corrosive medium. As seen from Figure 8i–l, the upper zone of the NAB layer with chromium content of 1.9% showed uniform corrosion, and the corrosion depth was very shallow. The addition of chromium contributes to the formation of corrosion product films with stronger protection and densification, preventing the dissolution of metal ions [7].

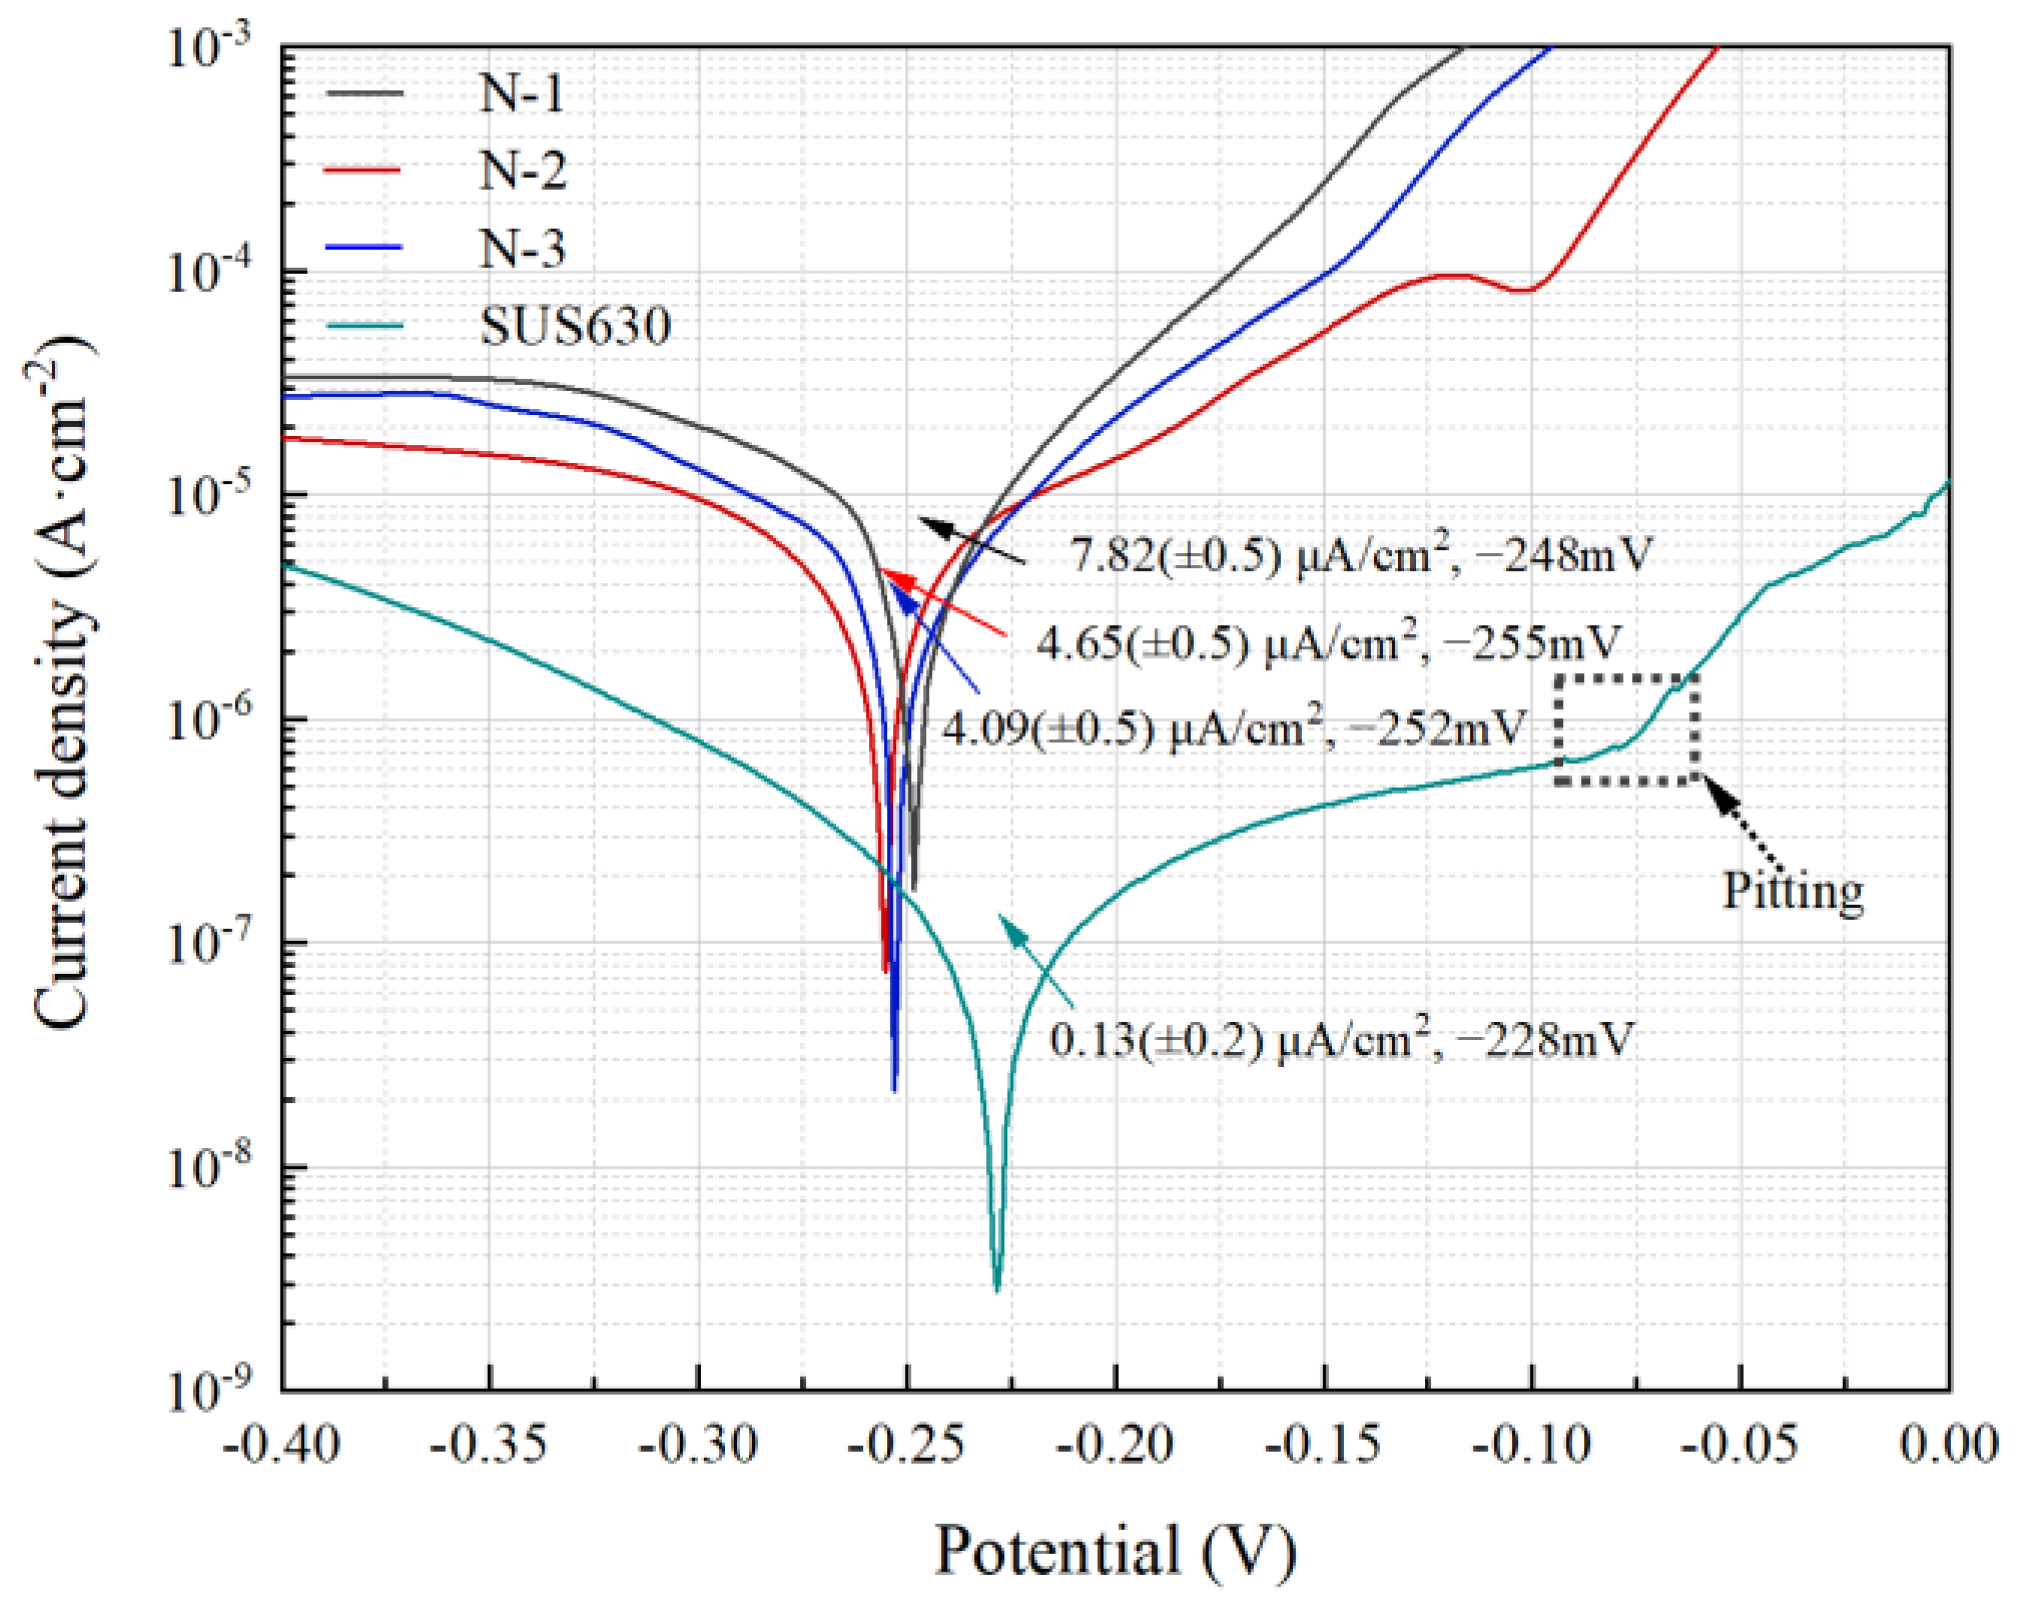
3.3.2. Polarization Measurements

Figure 9 shows the potentiodynamic polarization curves of NAB coatings with different intermediate layers as well as the steel substrate in 3.5 wt.% NaCl solution. The corresponding corrosion current density (icorr) was determined by the Tafel extrapolation method. The icorr of N-1, N-2 and N-3 were 7.82 (±0.5), 4.65 (±0.5) and 4.09 (±0.4) μA cm−2, respectively. The corresponding corrosion potential (Ecorr), Tafel slopes (ba, bc) and the polarization resistance (Rp) calculated by the Stern–Geary relation [18] are listed in Table 5. This indicates that the NAB coating with the Ni-based intermediate layer exhibited a lower corrosion rate, and N-3 possessed a better corrosion resistance among all samples. The higher the Rp values of N-2 and N-3, the higher the resistance to corrosion [19]. The corrosion current density of SUS630 stainless steel was measured as 0.13 (±0.2) μA·cm−2, which was lower than that of the deposited NAB alloy, but the steel was rarely considered as propeller or other load bearing components to directly cope with seawater corrosion because of its high pitting propensity in the media containing chloride ions [20,21]. Figure 10 shows the surface morphologies of N-3 and SUS630 steel examined by confocal laser scanning microscopy after polarization. The pitting corrosion could be clearly seen on the surface of the steel samples, which was consistent with the polarization result shown in Figure 9 as the pitting potential presented in the curve. On the contrast, no obvious pit was found on the surface of the polarized N-3.
The Fe-rich dendrite formed by liquid phase separation has a lower potential compared to α-Cu, so N-1 alloy presented a higher current with potential difference. For N-2 and N-3, the nickel-based intermediate layer prevented excessive iron from the substrate mixing into the NAB layer. Additionally, with the increases of nickel content in the NAB, the content of nickel in the α phase also increased. As nickel is the element with the highest potential in the NAB alloy, the increase of nickel content in the α phase increased the surface potential of the α phase and reduced the potential difference between the α and κ phases, which reduced the driving force of selective phase corrosion and alleviated selective phase corrosion [17]. Compared with the icorr of 3 μA cm−2 [22] and 20 (±1) μA cm−2 [23] of as-casted NAB alloys, the icorr of the deposited NAB from the composite structure are comparable.

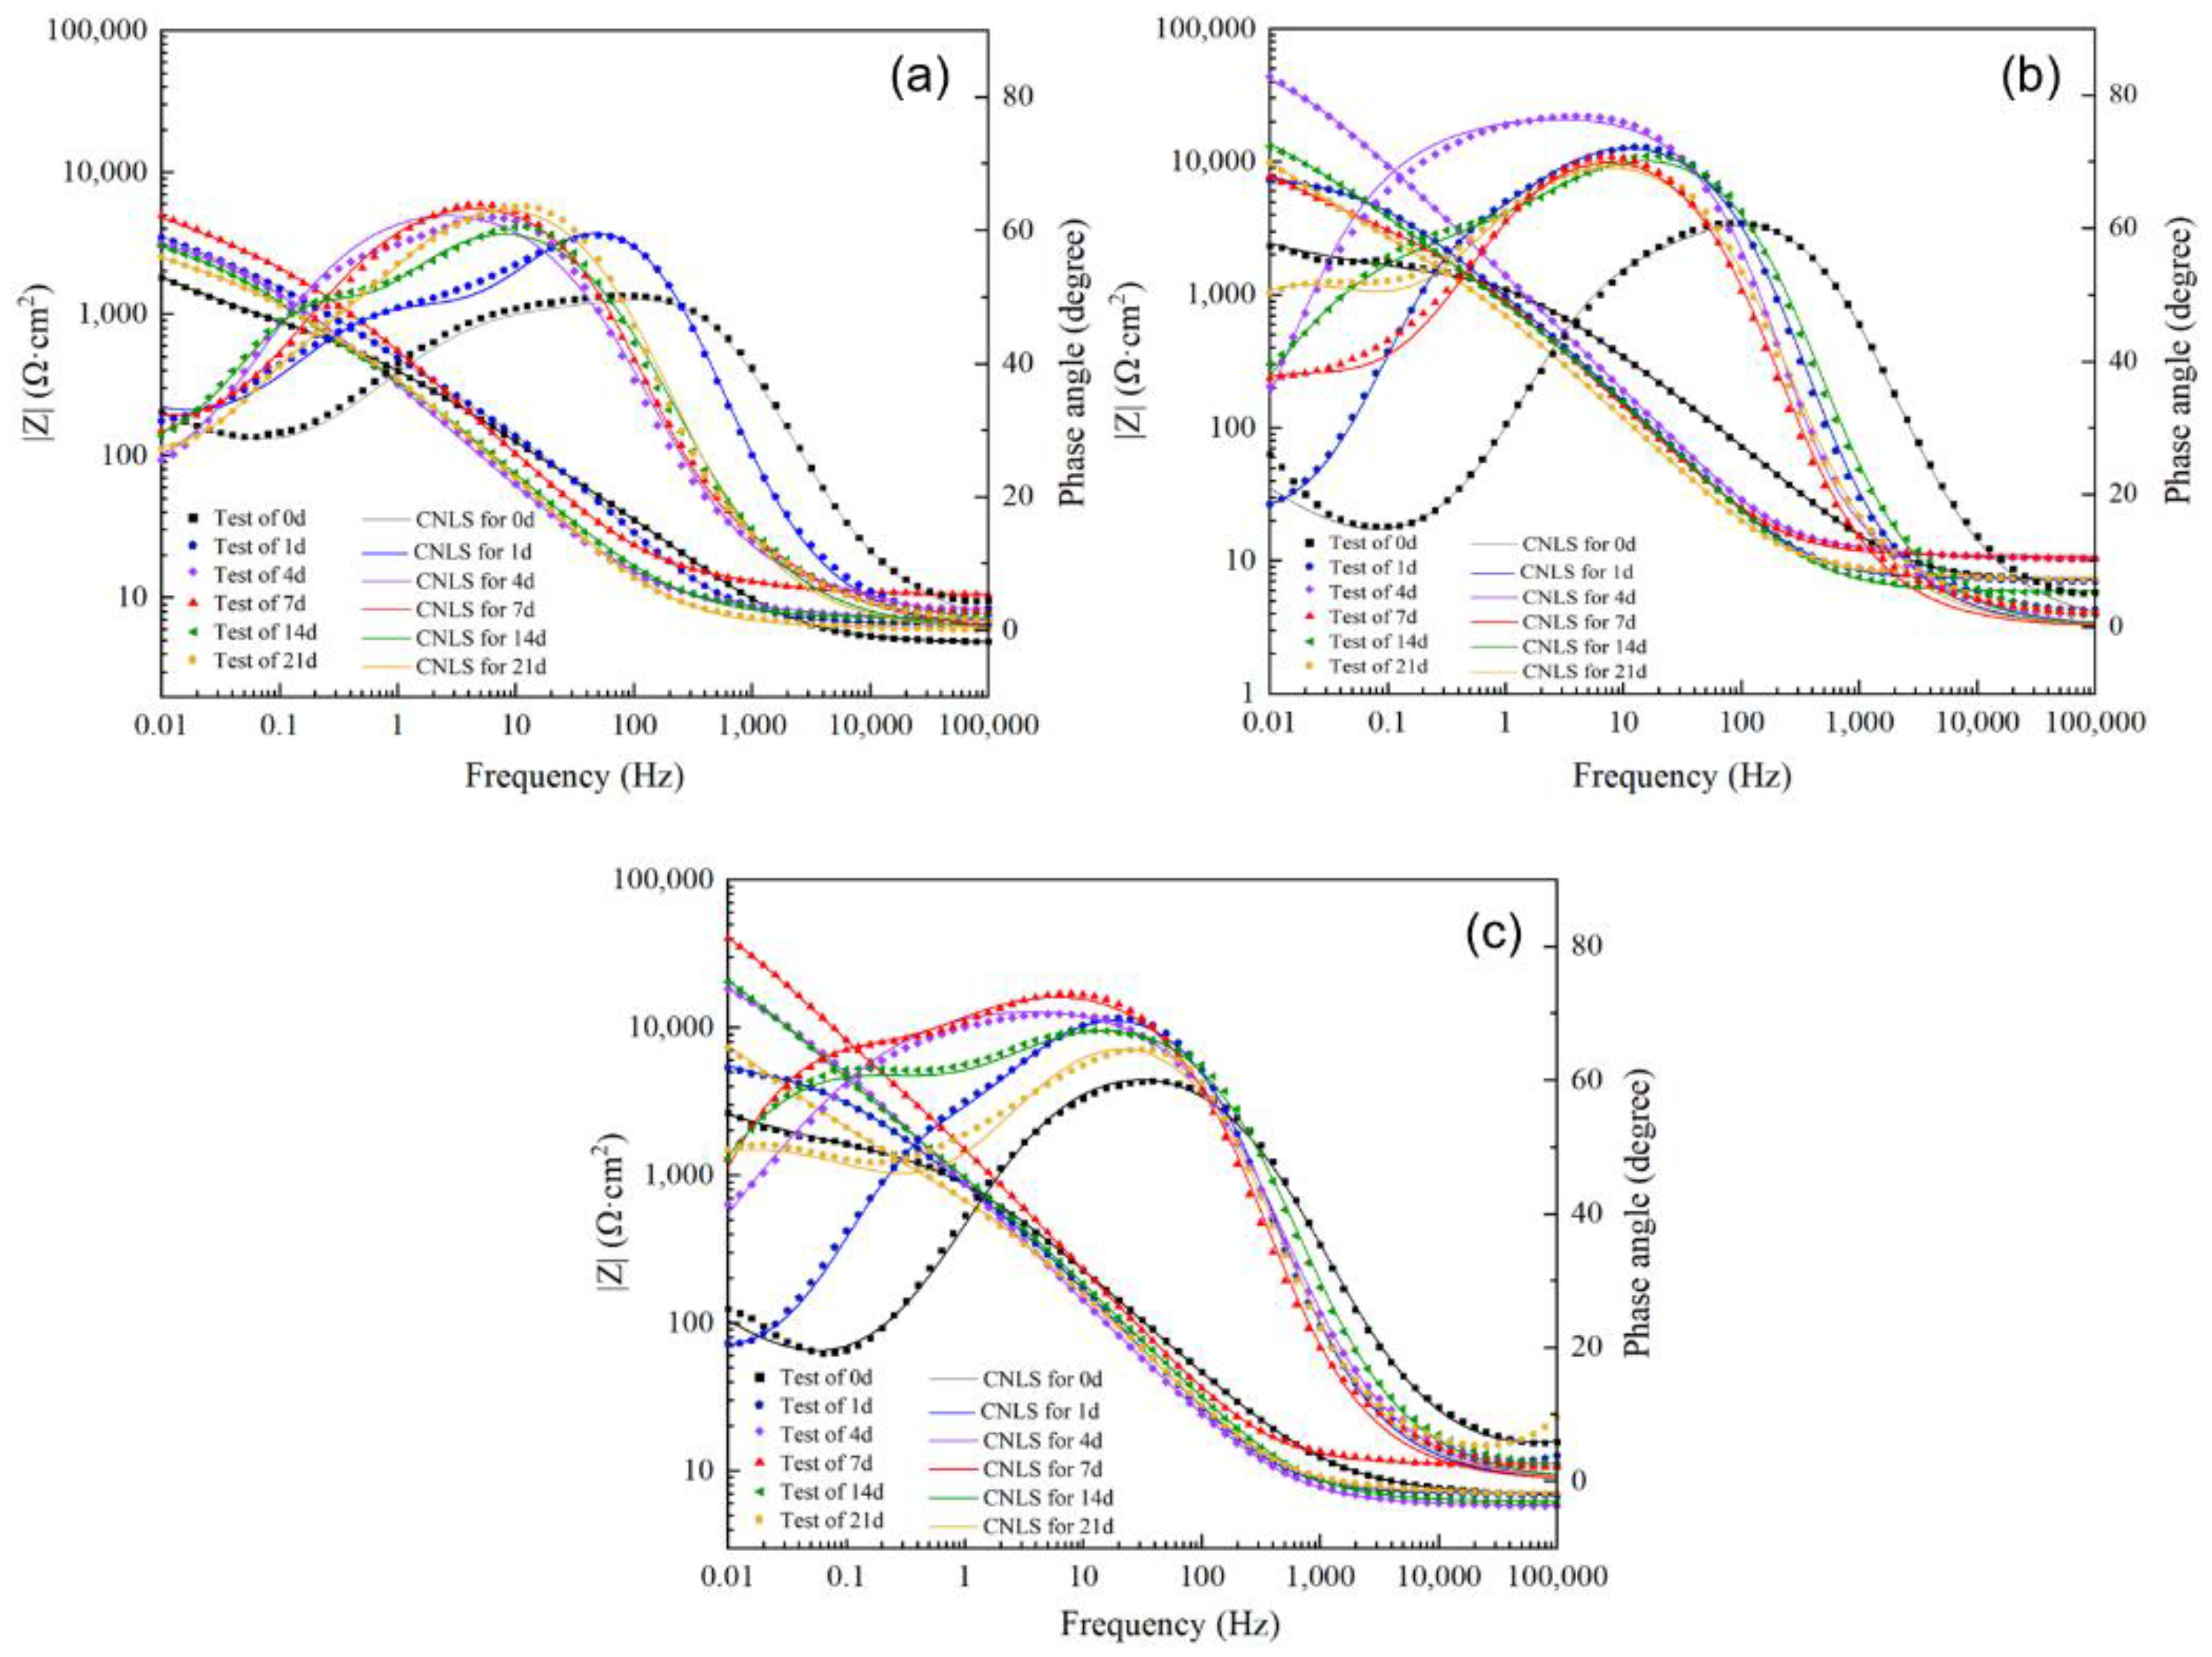
3.3.3. Electrochemical Impedance Measurements

Figure 11 shows the Nyquist plots of the filmed as-deposited NAB layer after different immersed periods in 3.5 wt.% NaCl solution. It can be seen that the trend of the Nyquist plots of the three NAB alloys were significantly different. At the initial stage of immersion, the impedance modulus of NAB alloys with different components were similar in the low-frequency region. As the immersed time increased, the difference of impedance modulus at the low-frequency region increased gradually. For the single NAB layer (Figure 11a), it exhibited similar impedance characteristics, consisting of a capacitive loop in the high-frequency region and a straight line in low-frequency region. Warburg impedance in the low-frequency region indicated that the reaction rate of the electrode reaction process was controlled by the diffusion step, which might be related to the diffusion process of dissolved oxygen from the solution to the electrode surface or the diffusion process of Fe dissolved products from the electrode surface [24,25]. After a several days, Nyquist curves of N-2 and N-3 showed a downward flattened capacitive semicircle at the high-frequency region, and a straight line at the low-frequency region (Figure 11b,c). The radius of capacitive plots at high frequency reached their own peak value after 4 immersion days of N-2 and 7 days of N-3, respectively. With the increase of immersion time, the low-frequency straight lines (Warburg impedance) of N-2 and N-3 gradually disappeared, and the radius decreased.
In general, the semicircle at the high-frequency region is related to the charge transfer resistance (Rct) on the exposed electrode surface and the film resistance (Rf) on the electrode surface, while the straight line in the low-frequency region corresponds to the Warburg impedance, which is closely related to the diffusion process. At the initial immersion stage, the charge transfer resistance was small, and the reaction rate of electrochemical step was much faster than the diffusion rate of the reactants, which appeared on the Nyquist plots as the presence of clear Warburg resistance in the low-frequency region. With the increasing immersed time, the interfacial reaction resistance of the corrosion film formed on the electrode surface increased significantly and became the main factor limiting the corrosion process. The reaction rate of the electrochemical step was far less than the diffusion rate of the reactants. The electrode process was mainly controlled by the electrochemical step, which was shown in the Nyquist plots as the disappearance of the Warburg impedance in the low-frequency region. The Nyquist plots of deposited NAB from the composite structure exhibited a similar shape with only one semicircle to that of as-cast NAB alloy at longer immersion times [23]. The diameters of their semicircles were comparable due to their protective product film.
Figure 12 shows the Bode plots of three deposited NAB layers. The impedance modular |Z|0.1Hz of N-1 was in the range of 2527 and 4948 Ω cm2, and that of N-2 and N-3 were about one order of magnitude higher than N-1 after more than 4 days′ immersion. The |Z| vs. frequency plots presented a very large linear characteristics, especially in the immersion time longer than 4 days, which corresponded to the vanishing Warburg line. The phase angle vs. frequency Bode plots shows a higher peak after more than 4 days of immersion, with the maximum phase angle approaching 67°. Compared with N-1, the maximum phase angle of N-2 and N-3 becomes wider and moves to the direction of lower frequency. It is inferred from these characteristics of Bode plots and XRD results that corrosion products gradually generated and formed a dense layer of corrosion products to play a protective role [26]. The addition of the intermediate layer significantly increased the protective properties of the deposited coating. The addition of nickel alloy promoted the formation of Cu2O film very quickly, and surface coverage of the film was larger [27,28]. A longer immersion period and an increased content of nickel contributed to the formation of a better protective surface film on the NAB alloy [29].
In order to analyze the corrosion behavior of the alloy quantitatively in the corrosion process, several equivalent circuit models were used to fit the EIS curves [8,22,30,31,32]. The EIS curves of N-1 were fitted with the equivalent circuit model in Figure 13a, which was also used for 0 day and 1 day of both N-2 and N-3. The curves of N-2 and N-3 at 4–21 days were fitted with the model in Figure 13b. The equivalent circuit models consisted of solution resistance Rs, a pair of Qf and corrosion product film resistance Rf and a pair of Qdl and charge transfer resistance Rct and Warburg element W were selected to fit EIS plots. Constant phase element CPE representing double-layer capacitance and Warburg element W were selected to fit EIS plots. CPE was related to the heterogeneity of the electrode surface and the roughness or porosity of the surface [26]. In order to analyze the equivalent circuit and simulate the experimental data, a CNLS (complex non-linear least squares) simulation was adopted in Figure 11 and Figure 12 [33,34]. The effective capacitance [35,36] associated with the CPE can be expressed as:
Ceff = Qx1/nx Rx(1−nx)/nx,
where Qx and nx were the fitting values of the CPE, Rx was the corresponding resistance in the parallel circuit. The fitting quality between experimental and simulated data was determined when chi-square (χ2) values were analyzed [34]. The fitting parameters are listed in Table 6 and the χ2 values are all below 103, indicating a good fit with the measured data.
In the whole cycle, Rf and Rct of the three schemes gradually increased at the beginning, then decreased after several days, and increased again afterwards, indicating that the gradual formation of corrosion product film hindered the charge transfer, and the dissolution of corrosion product film co-existed with the formation process. There are two possible reasons for the decrease in impedance. The further formation of basic copper chloride through coordination reaction is relatively loose and easy to absorb water, which has a destructive effect on the protective film. Due to the higher anodic potential, the corrosion product film dissolves with the increase of immersion time. Therefore, icorr is observed to increase slightly with the increase of immersion time. Local impact corrosion of chloride ions leads to the loss of dissolution of Cu2O film [37]. After the protective film is destroyed, exposed NAB continues to play a protective role through the formation of corrosion products.

4. Conclusions

In this work, dense multi-metallic structures were fabricated by laser deposition. The formation of microstructure and corrosion behavior of NAB coatings with different intermediate layers were studied. The key conclusions are as follows:
(1) Dense NAB coatings could be produced by laser deposition and the microstructure was determined by the composition of the diluted substrate. The coating was mainly composed of α-Cu, Fe-rich dendrites and κ phases when NAB was deposited on the foundation of stainless steel where a large amount of melted iron elements flew along the molten pool. With the nickel intermediate layer, fewer iron dendrites were independent in the NAB coating and the coating was isolated well from the steel substrate. The NAB coating on KF-6 alloy formed a lot of NiAl intermetallic compounds, whereas the NAB coating on KF-306 alloy formed Cr solid solution and Cu-Cr eutectic.
(2) Two electrochemical results showed that the corrosion resistance of NAB coating could be improved by depositing a nickel intermediate layer. Due to the presence of excessive iron with low self-corrosion potential, the corrosion performance of NAB coating deposited directly on steel substrate was the worst. Both the NAB layers on KF-6 and KF-306 presented good corrosion resistance due to the prevention from ions and the introduction of nickel that increased the potential of the phase, thus reduced the driving force of the microgalvanic corrosion of the NAB alloy. Furthermore, the NAB coating on KF-306 exhibited better due to chromium that contributed to the formation of corrosion product films with stronger protection and densification.

Author Contributions

Conceptualization, L.Z. and B.D.; methodology, L.Z.; formal analysis, L.Z. and J.Y.; investigation, J.Y.; data curation, Y.Y.; writing—original draft preparation, L.Z.; writing—review and editing, K.L.; project administration, B.D.; funding acquisition, K.L. All authors have read and agreed to the published version of the manuscript.

Funding

This research was funded by Institutional innovation Leading Programme of Institute of Engineering Thermophysics, Chinese Academy of Sciences, grant number E1290B04.

Institutional Review Board Statement

Not applicable.

Informed Consent Statement

Not applicable.

Data Availability Statement

Not applicable.

Conflicts of Interest

The authors declare no conflict of interest.

References

  1. Al-Hashem, A.; Riad, W. The role of microstructure of nickel–aluminium–bronze alloy on its cavitation corrosion behavior in natural seawater. Mater. Charact. 2002, 48, 37–41. [Google Scholar] [CrossRef]
  2. Anantapong, J.; Uthaisangsuk, V.; Suranuntchai, S.; Manonukul, A. Effect of hot working on microstructure evolution of as-cast Nickel Aluminum Bronze alloy. Mater. Des. 2014, 60, 233–243. [Google Scholar] [CrossRef]
  3. Öztürk, S.; Sünbül, S.E.; Metoğlu, A.; Kürşat, İ.Ç. Improvement of microstructure, tribology and corrosion characteristics of nickel-aluminum bronze by P/M method. Tribol. Int. 2020, 151, 106519. [Google Scholar] [CrossRef]
  4. Sarkar, A.; Chakrabarti, A.; Nagesha, A.; Saravanan, T.; Arunmuthu, K.; Sandhya, R.; Philip, J.; Mathew, M.D.; Jayakumar, T. Influence of Casting defects on S–N fatigue behavior of Ni-Al bronze. Metall. Mater. Trans. A 2015, 46, 708–725. [Google Scholar] [CrossRef]
  5. Barik, R.C.; Wharton, J.A.; Wood, R.J.K.; Tan, K.S.; Stokes, K.R. Erosion and erosion–corrosion performance of cast and thermally sprayed nickel–aluminum bronze. Wear 2005, 259, 230–242. [Google Scholar] [CrossRef]
  6. Hyatt, C.V.; Magee, K.H.; Betancourt, T. The effect of heat input on the microstructure and properties of nickel aluminum bronze laser clad with a consumable of composition Cu-9.0Al-4.6Ni-3.9Fe-1.2Mn. Metall. Mater. Trans. A 1998, 29, 1677–1690. [Google Scholar] [CrossRef]
  7. Qin, Z.; Luo, Q.; Zhang, Q.; Wu, Z.; Liu, L.; Shen, B.; Hu, W. Improving corrosion resistance of nickel-aluminum bronzes by surface modification with chromium ion implantation. Surf. Coat. Technol. 2018, 334, 402–409. [Google Scholar] [CrossRef]
  8. Luo, Q.; Wu, Z.; Qin, Z.; Liu, L.; Hu, W. Surface modification of nickel-aluminum bronze alloy with gradient Ni-Cu solid solution coating via thermal diffusion. Surf. Coat. Technol. 2017, 309, 106–113. [Google Scholar] [CrossRef]
  9. Osório, W.R.; Peixoto, L.C.; Moutinho, D.J.; Gomes, L.G.; Ferreira, I.L.; Garcia, A. Corrosion resistance of directionally solidified Al–6Cu–1Si and Al–8Cu–3Si alloys castings. Mater. Des. 2011, 32, 3832–3837. [Google Scholar] [CrossRef]
  10. Osório, W.R.; Freitas, E.S.; Garcia, A. EIS and potentiodynamic polarization studies on immiscible monotectic Al–In alloys. Electrochim. Acta 2013, 102, 436–445. [Google Scholar] [CrossRef]
  11. Zhang, X.L.; Jiang, Z.H.; Yao, Z.P.; Song, Y.; Wu, Z. Effects of scan rate on the potentiodynamic polarization curve obtained to determine the Tafel slopes and corrosion current density. Corros. Sci. 2009, 51, 581–587. [Google Scholar] [CrossRef]
  12. McCafferty, E. Validation of corrosion rates measured by the Tafel extrapolation method. Corros. Sci. 2005, 47, 3202–3215. [Google Scholar] [CrossRef]
  13. Niu, Y.; Gesmundo, F.; Fu, G.Y.; Douglass, D.L. Sulfidation of three two-phase Cu-Cr alloys in H2-H2S mixtures at 400–600 °C. Oxid. Met. 1998, 50, 327–354. [Google Scholar] [CrossRef]
  14. Fonlupt, S.; Bayle, B.; Delafosse, D.; Heuze, J.L. Role of second phases in the stress corrosion cracking of a nickel–aluminum bronze in saline water. Corros. Sci. 2005, 47, 2792–2806. [Google Scholar] [CrossRef]
  15. Tian, R.Z.; Wang, Z.T. Handbook of Copper Alloy and Its Processing, 2nd ed.; Central South University Press: Changsha, China, 2007; p. 11. [Google Scholar]
  16. Lee, M.K.; Hong, S.M.; Kim, G.H.; Kim, K.H.; Kim, W.W. Structural properties in flame quenched Cu9Al4.5Ni4.5Fe alloy. Met. Mater. Int. 2004, 10, 313–319. [Google Scholar] [CrossRef]
  17. Yang, F.; Kang, H.; Guo, E.; Li, R.; Chen, Z.; Zeng, Y.; Wang, T. The role of nickel in mechanical performance and corrosion behaviour of nickel-aluminum bronze in 3.5 wt.% NaCl solution. Corros. Sci. 2018, 139, 333–345. [Google Scholar] [CrossRef]
  18. Stern, M.; Geary, A.L. Electrochemical Polarization: I. A Theoretical Analysis of the Shape of Polarization Curves. J. Electrochem. Soc. 1957, 104, 56–63. [Google Scholar] [CrossRef]
  19. Mishra, R.; Balasubramaniam, R. Effect of nanocrystalline grain size on the electrochemical and corrosion behavior of nickel. Corros. Sci. 2004, 46, 3019–3029. [Google Scholar] [CrossRef]
  20. López, F.H.E.; Tiburcio, C.G.; Zambrano-Robledo, P.; Cabral, J.A.; Calderon, F.A. Electrochemical study of 17-4 and 17-7 PH stainless steels used in the aeronautical industry. In Proceedings of the Symposium of Aeronautical and Aerospace Processes, Materials and Industrial Applications, Cancún, Mexico, 14–19 August 2016; Springer International Publishing: Cham, Switzerland, 2018. [Google Scholar]
  21. Raja, K.S.; Rao, K.P. Pitting behavior of type 17-4 PH stainless steel weldments. Corrosion 1995, 51, 586–592. [Google Scholar] [CrossRef]
  22. Ni, D.R.; Xiao, B.L.; Ma, Z.Y.; Qiao, Y.; Zheng, Y. Corrosion properties of friction–stir processed cast NiAl bronze. Corros. Sci. 2010, 52, 1610–1617. [Google Scholar] [CrossRef]
  23. Sabbaghzadeh, B.; Parvizi, R.; Davoodi, A.; Moayed, M.H. Corrosion evaluation of multi-pass welded nickel–aluminum bronze alloy in 3.5% sodium chloride solution: A restorative application of gas tungsten arc welding process. Mater. Des. 2014, 58, 346–356. [Google Scholar] [CrossRef]
  24. Amegroud, H.; Guenbour, A.; Bellaouchou, A.; El Aoufir, Y.; Lgaz, H.; Chung, I.-M.; Alrashdi, A.A. A comprehensive investigation of the electrochemical behavior of nickel-aluminum bronze alloy in alkaline solution: The effect of film formation potential. Colloids Surf. A 2021, 614, 126126. [Google Scholar] [CrossRef]
  25. Luo, Q.; Qin, Z.; Wu, Z.; Shen, B.; Liu, L.; Hu, W. The corrosion behavior of Ni-Cu gradient layer on the nickel aluminum-bronze (NAB) alloy. Corros. Sci. 2018, 138, 8–19. [Google Scholar] [CrossRef]
  26. Yuan, S.J.; Pehkonen, S.O. Surface characterization and corrosion behavior of 70/30 Cu–Ni alloy in pristine and sulfide-containing simulated seawater. Corros. Sci. 2007, 49, 1276–1304. [Google Scholar] [CrossRef]
  27. Rao, B.V.A.; Kumar, K.C. Effect of hydrodynamic conditions on corrosion inhibition of Cu-Ni (90/10) alloy in seawater and sulphide containing seawater using 1,2,3-benzotriazole. J. Mater. Sci. Technol. 2014, 30, 65–76. [Google Scholar]
  28. Kear, G.; Barker, B.D.; Stokes, K.R.; Walsh, F.C. Anodic characteristics of copper, wrought CuNi10, and CuAl10Ni5Fe4 in seawater: Part 2—Polarizations below 500 mV at rotating disc electrodes. Corrosion 2009, 65, 95–104. [Google Scholar] [CrossRef]
  29. Badawy, W.A.; Ismail, K.M.; Fathi, A.M. Effect of Ni content on the corrosion behavior of Cu–Ni alloys in neutral chloride solutions. Electrochim. Acta 2005, 50, 3603–3608. [Google Scholar] [CrossRef]
  30. Ding, Y.; Zhao, R.; Qin, Z.; Wu, Z.; Wang, L.; Liu, L.; Lu, W. Evolution of the corrosion product film on nickel-aluminum bronze and its corrosion behavior in 3.5 wt % NaCl solution. Materials 2019, 12, 209. [Google Scholar] [CrossRef] [Green Version]
  31. Meyer, Y.A.; Menezes, I.; Bonatti, R.S.; Bortolozo, A.D.; Osório, W.R. EIS investigation of the corrosion behavior of steel bars embedded into modified concretes with eggshell contents. Metals 2022, 12, 417. [Google Scholar] [CrossRef]
  32. Proença, C.S.; Serrano, B.; Correia, J.; Araújo, M.E.M. Evaluation of tannins as potential green corrosion inhibitors of aluminium alloy used in aeronautical industry. Metals 2022, 12, 508. [Google Scholar] [CrossRef]
  33. Vida, T.A.; Freitas, E.S.; Cheung, N.; Garcia, A.; Osório, W.R. Electrochemical Corrosion Behavior of as-cast Zn-rich Zn-Mg Alloys in a 0.06M NaCl Solution. Int. J. Electrochem. Sci. 2017, 12, 5264–5283. [Google Scholar] [CrossRef]
  34. Meyer, Y.A.; Bonatti, R.S.; Bortolozo, A.D.; Osório, W.R. Electrochemical behavior and compressive strength of Al-Cu/xCu composites in NaCl solution. J. Solid State Electrochem. 2021, 25, 2455. [Google Scholar] [CrossRef]
  35. Hirschorn, B.; Orazem, M.E.; Tribollet, B.; Vivier, V.; Frateur, I.; Musiani, M. Determination of effective capacitance and film thickness from constant-phase-element parameters. Electrochim. Acta 2010, 55, 6218–6227. [Google Scholar] [CrossRef]
  36. Liu, R.; Cui, Y.; Liu, L.; Wang, F. Study on the mechanism of hydrostatic pressure promoting electrochemical corrosion of pure iron in 3.5% NaCl solution. Acta Mater. 2021, 203, 116467. [Google Scholar] [CrossRef]
  37. Hurtado, M.R.F.; Sumodjo, P.T.A.; Benedetti, A.V. Electrochemical studies with a Cu–5wt.%Ni alloy in 0.5 M H2SO4. Electrochim. Acta 2003, 48, 2791–2798. [Google Scholar] [CrossRef]
Figure 1. SEM micrographs of the top region and interface region of cross-section: (a,b) N-1, (c,d) N-2 and (e,f) N-3.
Metals 12 00781 g001
Figure 2. X-ray diffraction patterns of the cladding cross-sections.
Metals 12 00781 g002
Figure 3. Tensile stress–strain curves.
Metals 12 00781 g003
Figure 4. The fractographs of (a) N-1, (b) N-2 and (c) N-3.
Metals 12 00781 g004
Figure 5. Photos of surfaces immersed in NaCl solution after 0, 7, 14 and 21 days of (ad) N-1; (eh) N-2; (il) N-3.
Metals 12 00781 g005
Figure 6. Curves of mass changes after different immersed periods.
Metals 12 00781 g006
Figure 7. X-ray diffraction patterns of the surfaces immersed for 21 days.
Metals 12 00781 g007
Figure 8. The cross-sectional morphologies of three groups after immersed in 3.5 wt.% NaCl solution for different periods: (ad) N-1; (eh) N-2; (il) N-3.
Metals 12 00781 g008
Figure 9. Potentiodynamic polarization curves measured in 3.5 wt.% NaCl solution.
Metals 12 00781 g009
Figure 10. Surface morphologies after polarization: (a,b) NAB depositing and (ce) SUS630 steel.
Metals 12 00781 g010
Figure 11. Nyquist plots of NAB alloys after different immersion periods in 3.5 wt.% NaCl solution: (a) N-1; (b) N-2; (c) N-3.
Metals 12 00781 g011
Figure 12. Bode plots of NAB alloys after different immersion periods in 3.5 wt.% NaCl solution: (a) N-1; (b) N-2; (c) N-3.
Metals 12 00781 g012
Figure 13. The equivalent circuits used in fitting of the impedance data: (a) with Warburg; (b) without Warburg.
Metals 12 00781 g013
Table 1. The chemical composition of powders in this study.
Material NameElement (wt.%)
CuAlNiFeCr
NAB81.110.84.14.0-
KF-6-5.095.0--
KF-306--80.0-20.0
Table 2. The material and dosage schemes used.
Specimen GroupSubstrateIntermediate LayerOuter LayerDosage of Layer 1 (Intermediate Powder) (g/cm2)Dosage of Layer 2 (Outer Powder) (g/cm2)
N-1SUS630-NAB-2.9
N-2SUS630KF-6NAB1.72.9
N-3SUS630KF-306NAB1.72.9
Table 3. The chemical composition of NAB alloys.
PositionChemical Composition (in wt.%)
CuAlNiFeCr
P184.67.14.93.4-
P221.95.65.556.110.9
P379.78.78.63-
P452.911.325.810.0-
P577.29.58.83.31.2
P658.614.717.65.93.2
Area175.29.83.811.20
Area273.210.412.440
Area372.310.910.84.11.9
Table 4. Mechanical properties of the different composite structures.
Sampleσb (MPa)Elongation (%)
As-deposited NAB669 ± 10.417.46 ± 1.2
N-1767.80 ± 7.312.89 ± 1.0
N-2891.54 ± 8.56.87 ± 0.5
N-3731.05 ± 6.79.44 ± 0.6
Table 5. Potentiodynamic polarization parameters of NAB coatings on different intermediate layers in 3.5 wt.% NaCl solution.
Sampleicorr (A/cm2)Ecorr (mV)ba (mV dec−1)bc (mV dec−1)Rp (Ω cm2)
N-17.82 × 10⁻⁶−24861.02−223.102810
N-24.65 × 10⁻⁶−25582.23−296.035275
N-34.09 × 10⁻⁶−25279.60−216.984865
Table 6. Impedance parameters of NAB coating electrode in 3.5 wt.% NaCl solution at different immersion periods.
SamplesImmersion Period
(Day)
Rs
(Ω cm2)
Ceff-film
(F·cm−2)
n1Rfilm
(Ω cm2)
Ceff-ct
(F·cm−2)
n2Rct
(Ω cm2)
Wχ2
N-104.801.71 × 10−40.7775.264.87 × 10−40.588700.002722.87 × 10−4
16.511.82 × 10−40.832914.61 × 10−40.7020350.001544.94 × 10−4
46.812.16 × 10−40.7525.51 × 10−40.7530490.003461.09 × 10−3
710.513.65 × 10−40.73166.20 × 10−50.9033320.001273.80 × 10−4
147.145.89 × 10−40.769517.05 × 10−40.9118050.002847.91 × 10−4
216.195.31 × 10−40.808438.58 × 10−40.7314440.003349.99 × 10−4
N-207.057.74 × 10−50.805086.97 × 10−50.779950.00341.23 × 10−3
17.271.77 × 10−40.8627661.41 × 10−40.8739060.001997.43 × 10−4
410.361.26 × 10−40.8282.41 × 10−50.8760,650-5.22 × 10⁻⁴
710.882.06 × 10−40.8527666.23 × 10−40.5739,570-1.17 × 10⁻³
145.901.88 × 10−40.8513802.08 × 10−40.6030,420-7.56 × 10⁻⁴
216.233.35 × 10−40.8321965.89 × 10−40.6851,470-1.07 × 10⁻³
N-305.474.15 × 10−60.8321.87 × 10−40.7515220.002834.60 × 10−4
16.961.72 × 10−40.8514602.21 × 10−40.8131460.002174.26 × 10−4
45.862.57 × 10−40.8015,7302.18 × 10−40.5632,130-3.70 × 10⁻⁴
711.091.33 × 10−40.8498126.53 × 10−50.7680,120-8.12 × 10⁻⁴
146.171.89 × 10−40.8123441.45 × 10−40.6959,770-3.48 × 10⁻⁴
217.132.06 × 10−40.82938.36.05 × 10−40.6085,100-2.27 × 10⁻³
Publisher’s Note: MDPI stays neutral with regard to jurisdictional claims in published maps and institutional affiliations.

