Article

Investigation of a Macromolecular Additive on the Decrease of the Aluminum Horizontal Etching Rate in the Wet Etching Process

1
School of Microelectronics, Fudan University, Shanghai 200433, China
2
Ningbo Semiconductor International Corporation, Ningbo 315803, China
*
Author to whom correspondence should be addressed.
Metals 2022, 12(5), 813; https://doi.org/10.3390/met12050813
Submission received: 10 April 2022 / Revised: 3 May 2022 / Accepted: 6 May 2022 / Published: 8 May 2022

Abstract

:
The effect of a macromolecular additive on the etching rate of aluminum (Al) horizontal etching in the wet process was investigated in this work. The horizontal etching in the Al wet etching process became more evident as the film Al becomes thicker. The proposed macromolecule additive, including polyethylene-polypropylene glycol, was added into the Al etchant solution to reduce the Al horizontal etching rate (ER). The undercut problem during metal patterning can then be improved. By using this method, the Al horizontal ER was reduced from 2.0 to 0.9 μm per minute and the selection ratio between the horizontal and vertical ER was effectively improved from 3 to 1.3 times. As well, a hypothesis of physical mechanism for the improvement was proposed. The dispersed particles from the additive emulsion inhibited the transport and exchange of liquid in a horizontal direction. This work provides an alternative reference to improve the selection ratio performance in the metal wet etching process compared with that when using traditional method.

1. Introduction

With the rapid development of a three-dimensional integrated circuit and advanced wafer level package technology in the recent decade, the aluminum (Al) wet etching process has attracted tremendous attention. It has the advantages of low cost, high selectivity, process compatibility, free from plasma damage, high reliability, and low leakage [1,2,3,4,5,6,7,8,9,10,11,12]. However, it has been increasingly necessary to seek an effective strategy to suppress the horizontal etching in the Al wet process with the scaling of devices. In the meantime, the etch bias and uniformity of Al pattern’s critical dimension (CD) are expected to be as small as possible. The etch bias is defined locally as the distance between the lithography and the etch contours of a given structure. However, it is not easy to reduce the horizontal etching rate (ER) of Al wet etching [13,14,15,16] due to the difficulty of controlling the transport and exchange of the etchant on a micro-scale. Usually, the ratio between the horizontal etching rate and vertical etching rate (RHV) is around 3 to 5 [16]. It is well known that the main factors to affect the Al horizontal etching include growth conditions, surface hydrophobicity of materials, mask materials with higher adhesion [2], and micro-transport and exchange of liquid [1,14,15,16,17,18]. Scotti et al. [14] proposed the use of hexamethyldisilazane for better adhesion of the photoresist. They found that the delamination of the photoresist was a big problem when the Al etching time is longer than 20 min. As well, the photoresist adhesion on a rough etched surface of Al was better than on a polished one [14]. Moreover, Jiang et al. [19] proposed a method for Al wet etching combining dry etching to solve the problem of the undercut. The undercut of an Al layer with a 4 μm thickness can be reduced to less than 2 μm. Brask et al. [20,21,22,23] suggested a method to etch metal layers on high-k layers with thicknesses from 2.5 to 5.0 μm by wet etching. The wet etch chemistry contained an active ingredient with a diameter that exceeded the thickness of the metal layer [20,21,22,23].
In this work, we put forward a more feasible method to restrain the Al undercut, which is to add a macromolecule additive into the etchants to reduce the horizontal ER of the Al wet etching. To prove the effectiveness and consistency of this method, the distributions of the additive dispersed particles were measured with three stirring conditions and three mixing concentrations. Then, the effect of the distributions of the additive dispersed particles on the horizontal ER of the Al films with different thicknesses were investigated. A hypothesis was also proposed that the dispersed particles of the additive emulsion inhibit the transportation and exchange of the liquid in the horizontal direction. The results provide a meaningful reference for the development of the Al wet etching technique.

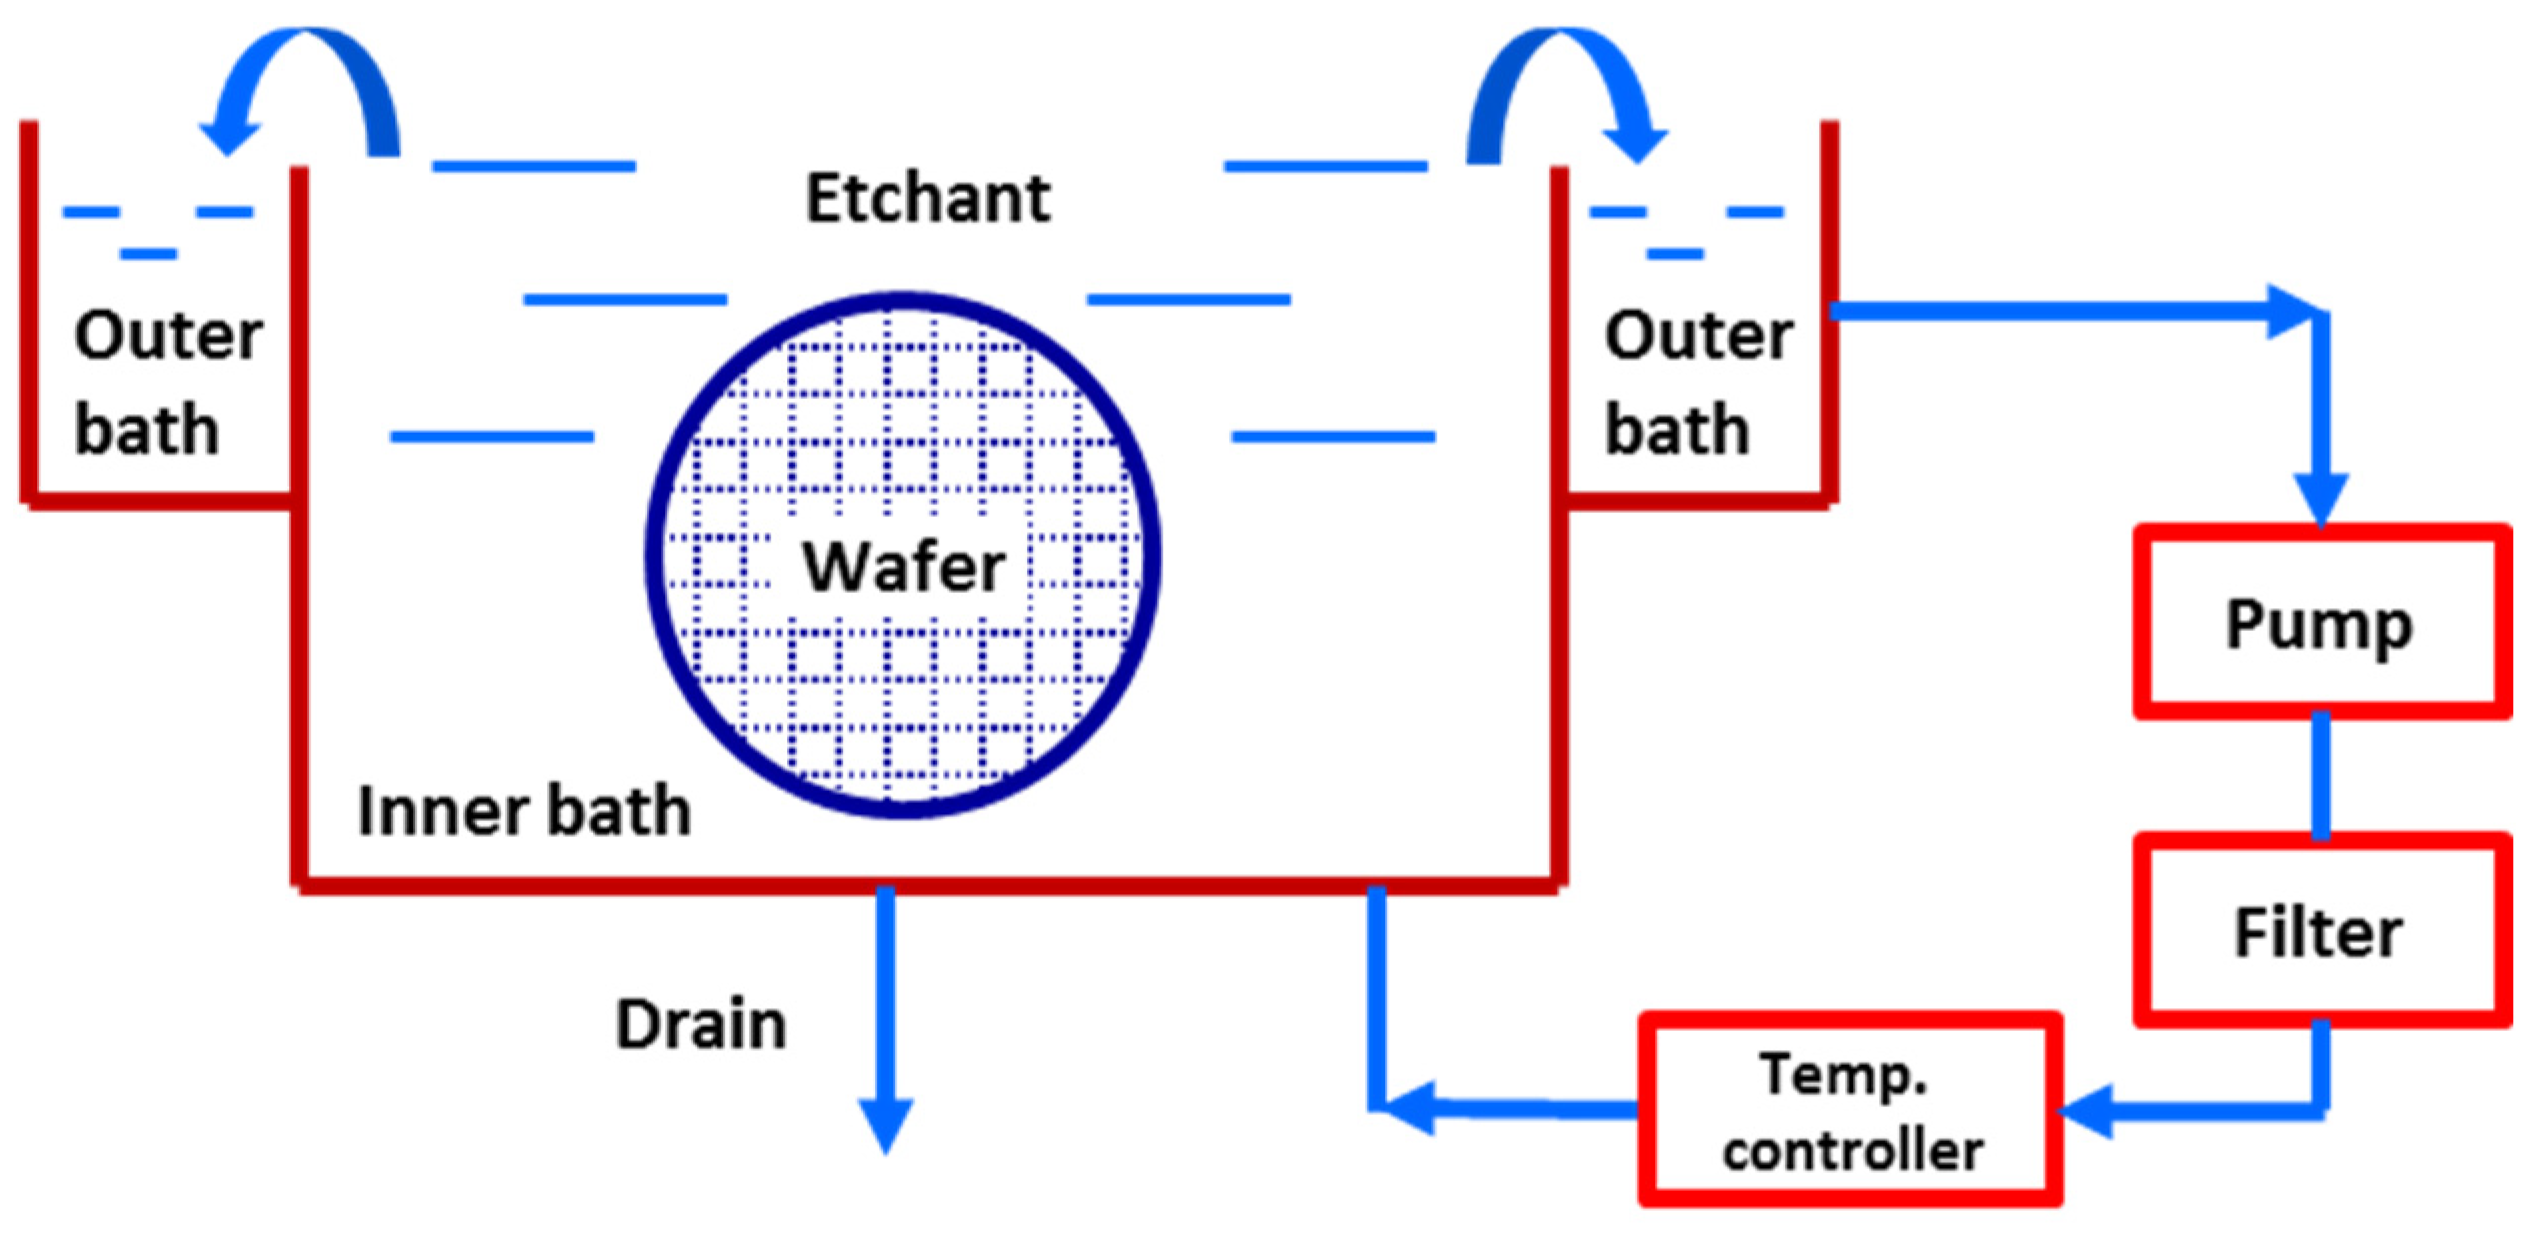
2. Experimental Section

As shown in Figure 1, the wet etching bath consists of an inner bath, an outer bath, and circulating pipelines. The inner bath is filled with chemicals that overflow to the outer bath due to the fact that the liquid level in the outer bath is lower than that in the inner bath. Then, the pump drives the chemicals from the outer bath to the inner one via circulating pipelines. The liquid flow rate of the pump can be adjusted from 0 to 20 L per minute (L/min).
A kind of Al etchant (BASF, Taipei, China) consisting of 80% phosphoric acid, 10% nitric acid, and 10% acetic acid was used in the experiments. According to the manufacturer, the ER of the etchant for Al was 0.7 μm per minute (μm/min) at 55 °C. There is no need to add additional components to remove the native alumina oxide that is attributed to the phosphoric acid in the etchant. [17,18]. Then, a kind of macromolecule additive (BASF, Taipei, China) consisting of 75% Polyethylene-polypropylene glycol (CAS No. 9003-11-6) and 25% water was added to the Al etchants. The Polyethylene-polypropylene glycol is minimally soluble in water and enters an emulsifying state after being fully stirred.
In the work, three mixing additive concentrations of 0.2, 1, and 5% were adopted. Among them, additive concentrations of 1% are recommended by the supplier. The additive was also added in the etchant under three stirring conditions with a flow rate of 3, 7, and 15 L/min, respectively. The distributions of the additive dispersed particles were characterized by a laser particle size analyzer (Mastersizer 3000, Malvern, UK). Then, the impact of the three concentrations (0.2, 1, and 5%) and the distributions of the additive dispersed particles on the aluminum dissolution was studied.
Firstly, the thermal oxide film with a thickness of 2 μm was prepared on p-type (100) silicon substrates. Then, the Al films with a thickness of 0.2, 0.5, and 2.0 μm were deposited on the thermal oxide films. The Al preparation was conducted in a sputter physical vapor deposition (PVD) chamber (AMAT Endura 5500, California, CA, USA) at a power of 3000 W, a bias power of 700 W, and an Argon gas flow rate of 30 sccm. Secondly, the photoresist patterns with a CD of 45 μm were developed on the Al film. Then, the samples were immersed into the etchants at 23 °C for 0.5~4 min at different additive concentrations of 0 (no additive), 0.2, and 1% and stirring condition of 15 L/min. The main reactions of the wet etching aluminum are the following [16]:
Al → Al3+ + 3e aluminum oxidation reaction
Al3+ + PO43− → AlPO4 generate soluble product
2H+ + 2e → H2 generate hydrogen
An optical microscope (OM) (Nikon Eclipse L300N, Tokyo, Japan) was used to gauge the CD and undercut of the Al patterns. The thickness of the Al films was measured by a four-point resistance probe (KLA-Tencor RS55, California, CA, USA). First, the probe measured the square resistance of the Al films. Then, the thickness of the Al films was calculated automatically according to the sheet resistance of the Al films (from the KLA-Tencor RS55 database) because the sheet resistance is inversely proportional to the thickness. The microstructure and morphology of the Al films were characterized by a scanning electron microscope (SEM) (Hitachi S-4800, Tokyo, Japan).

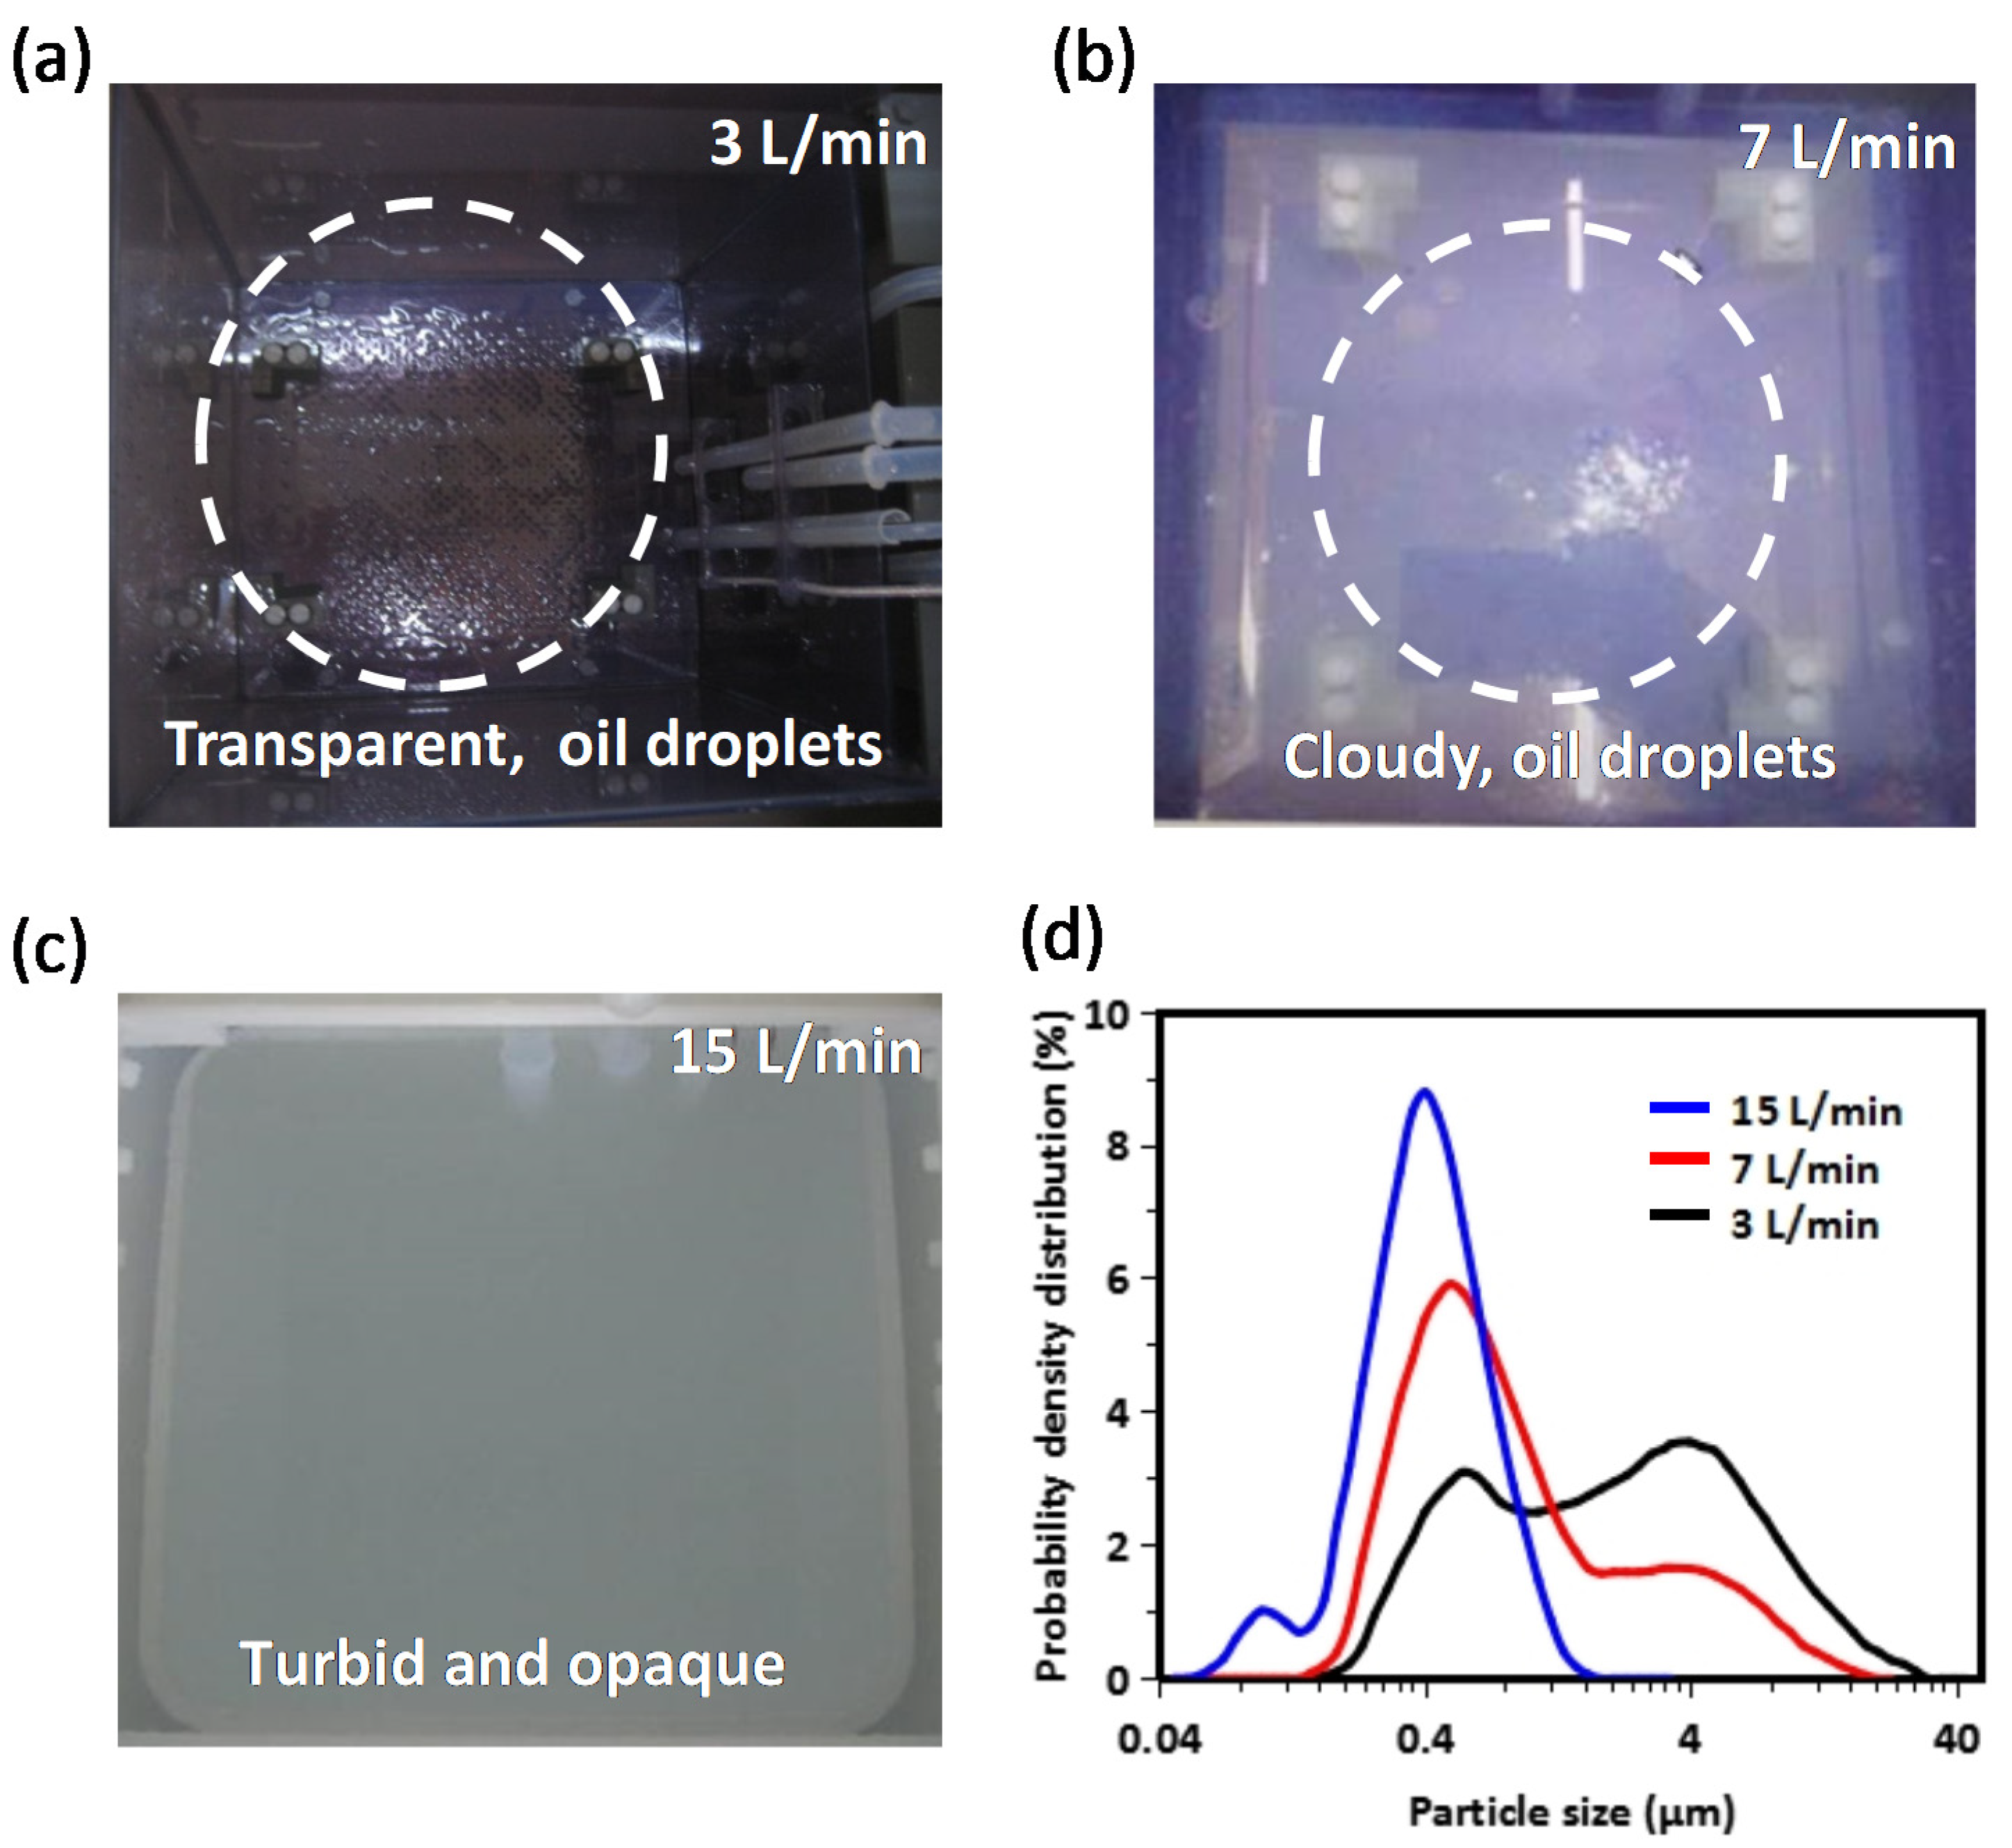
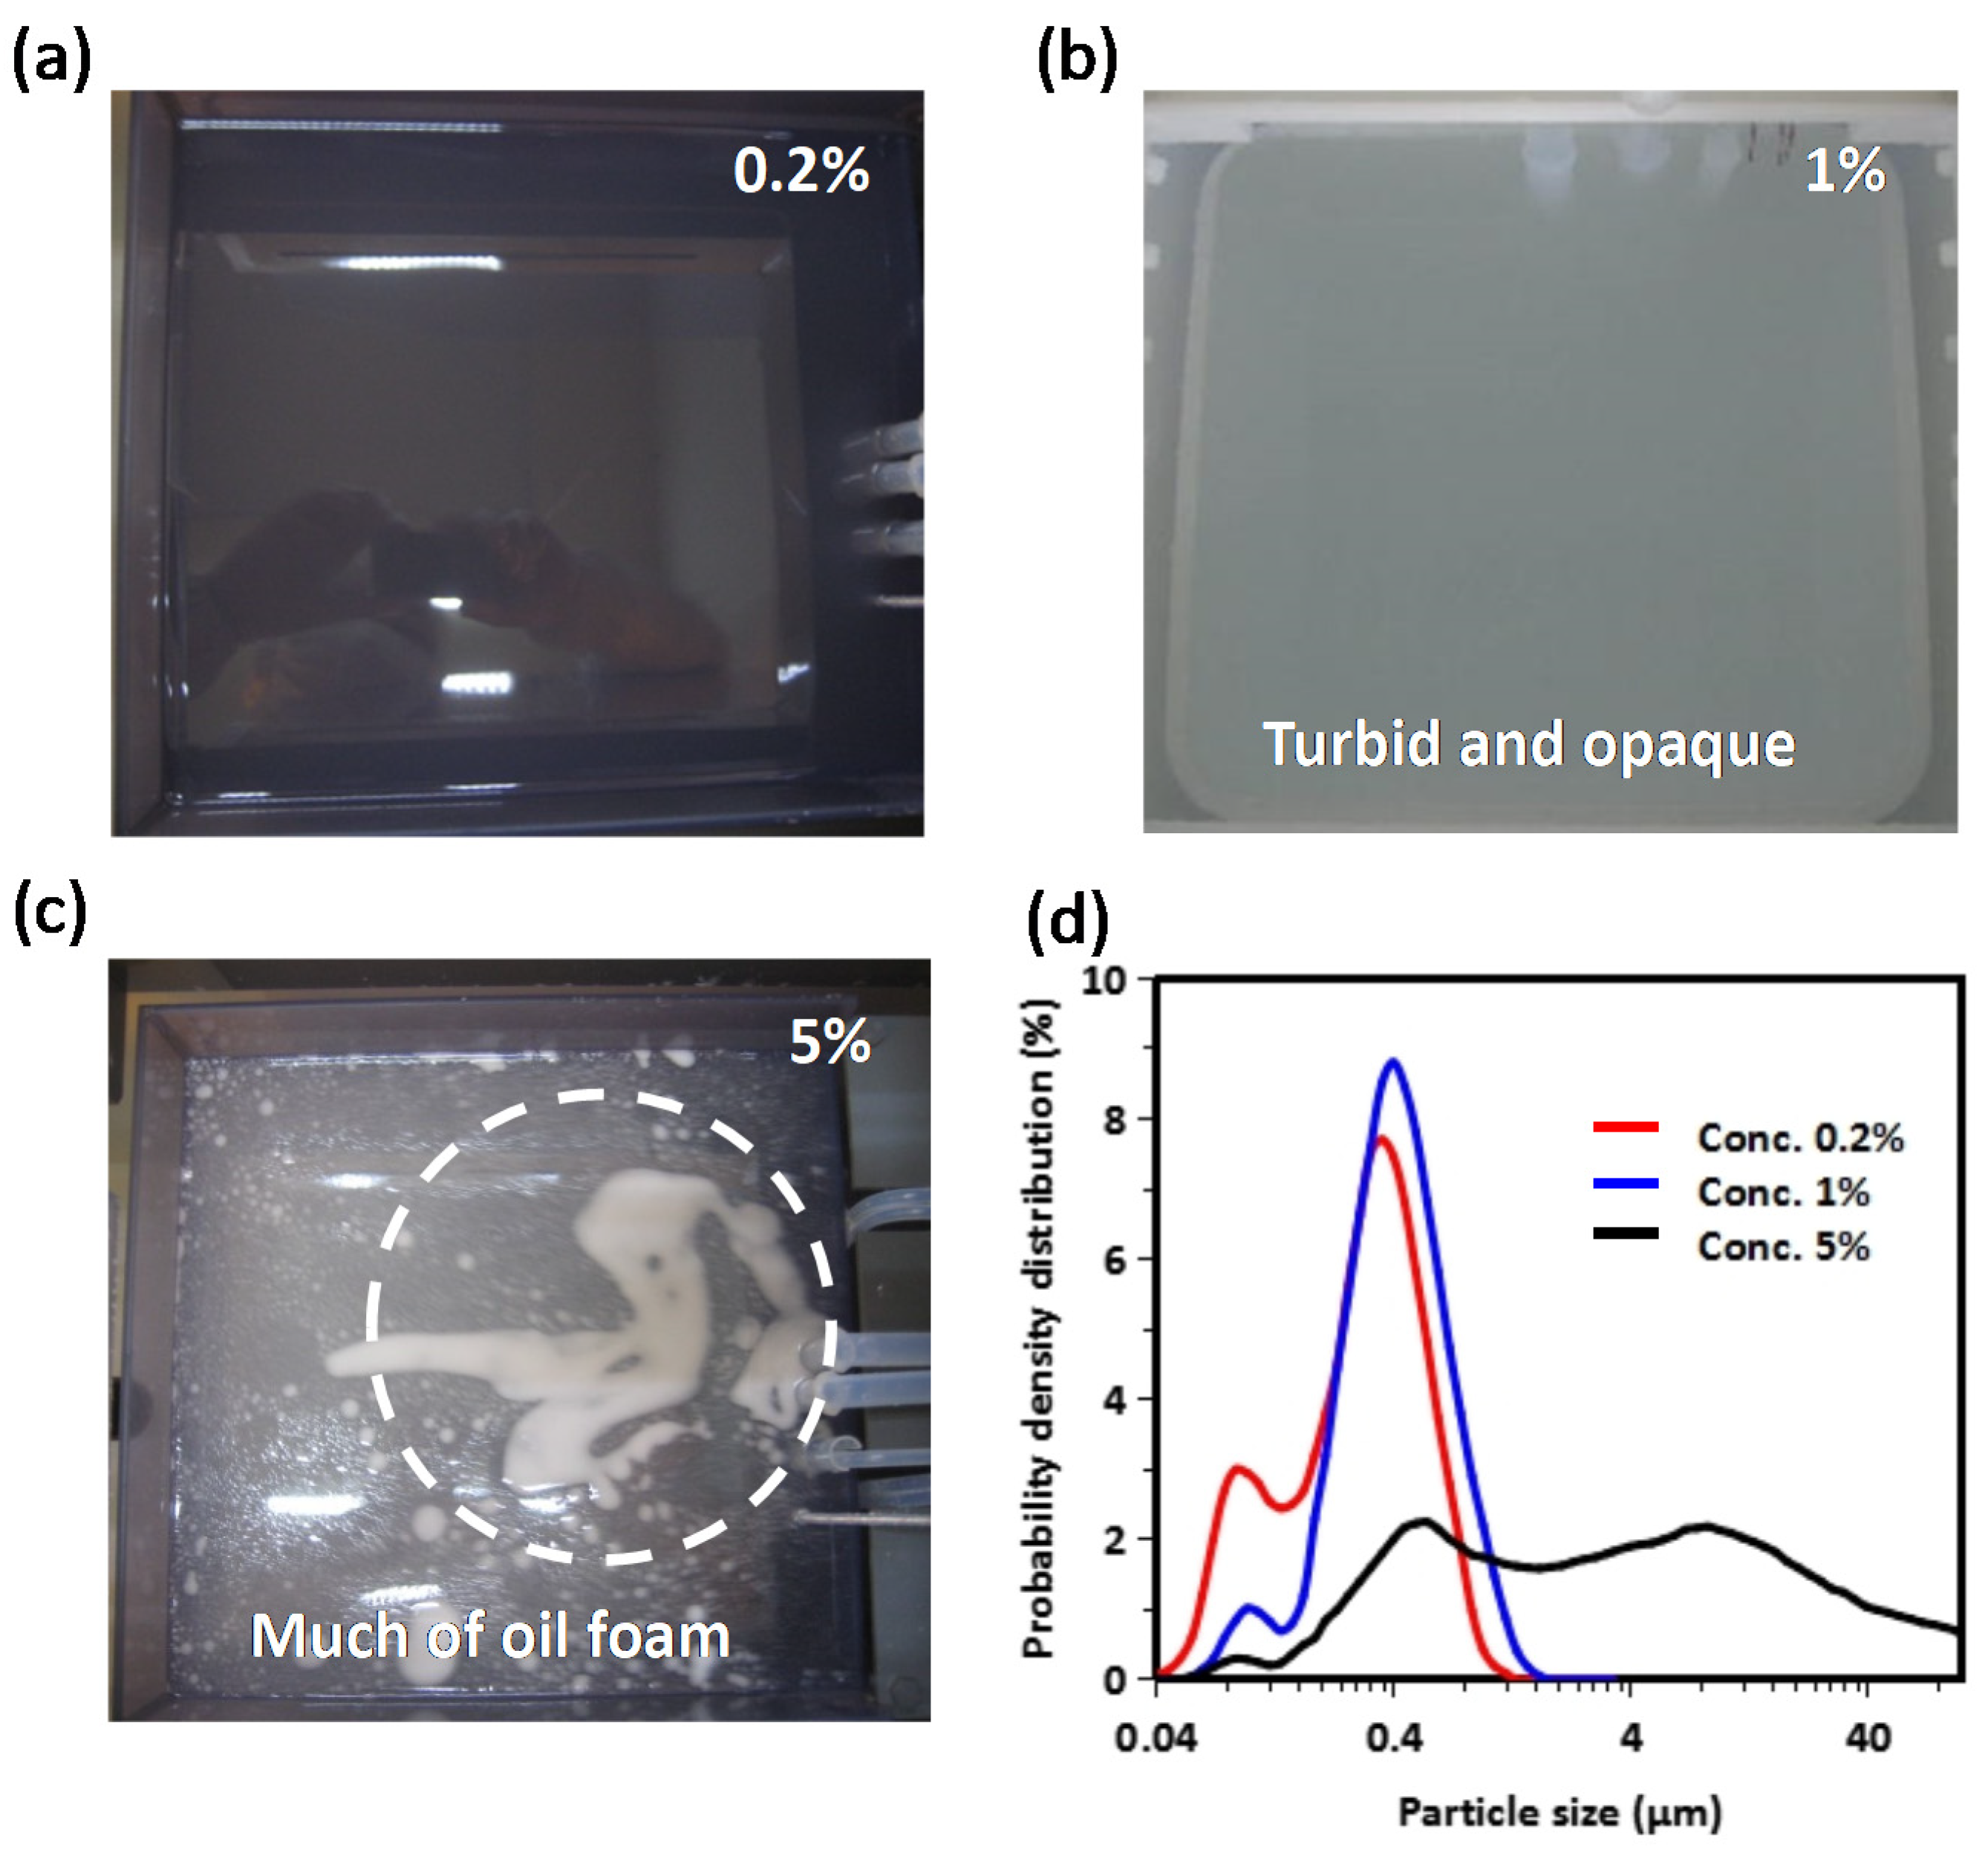
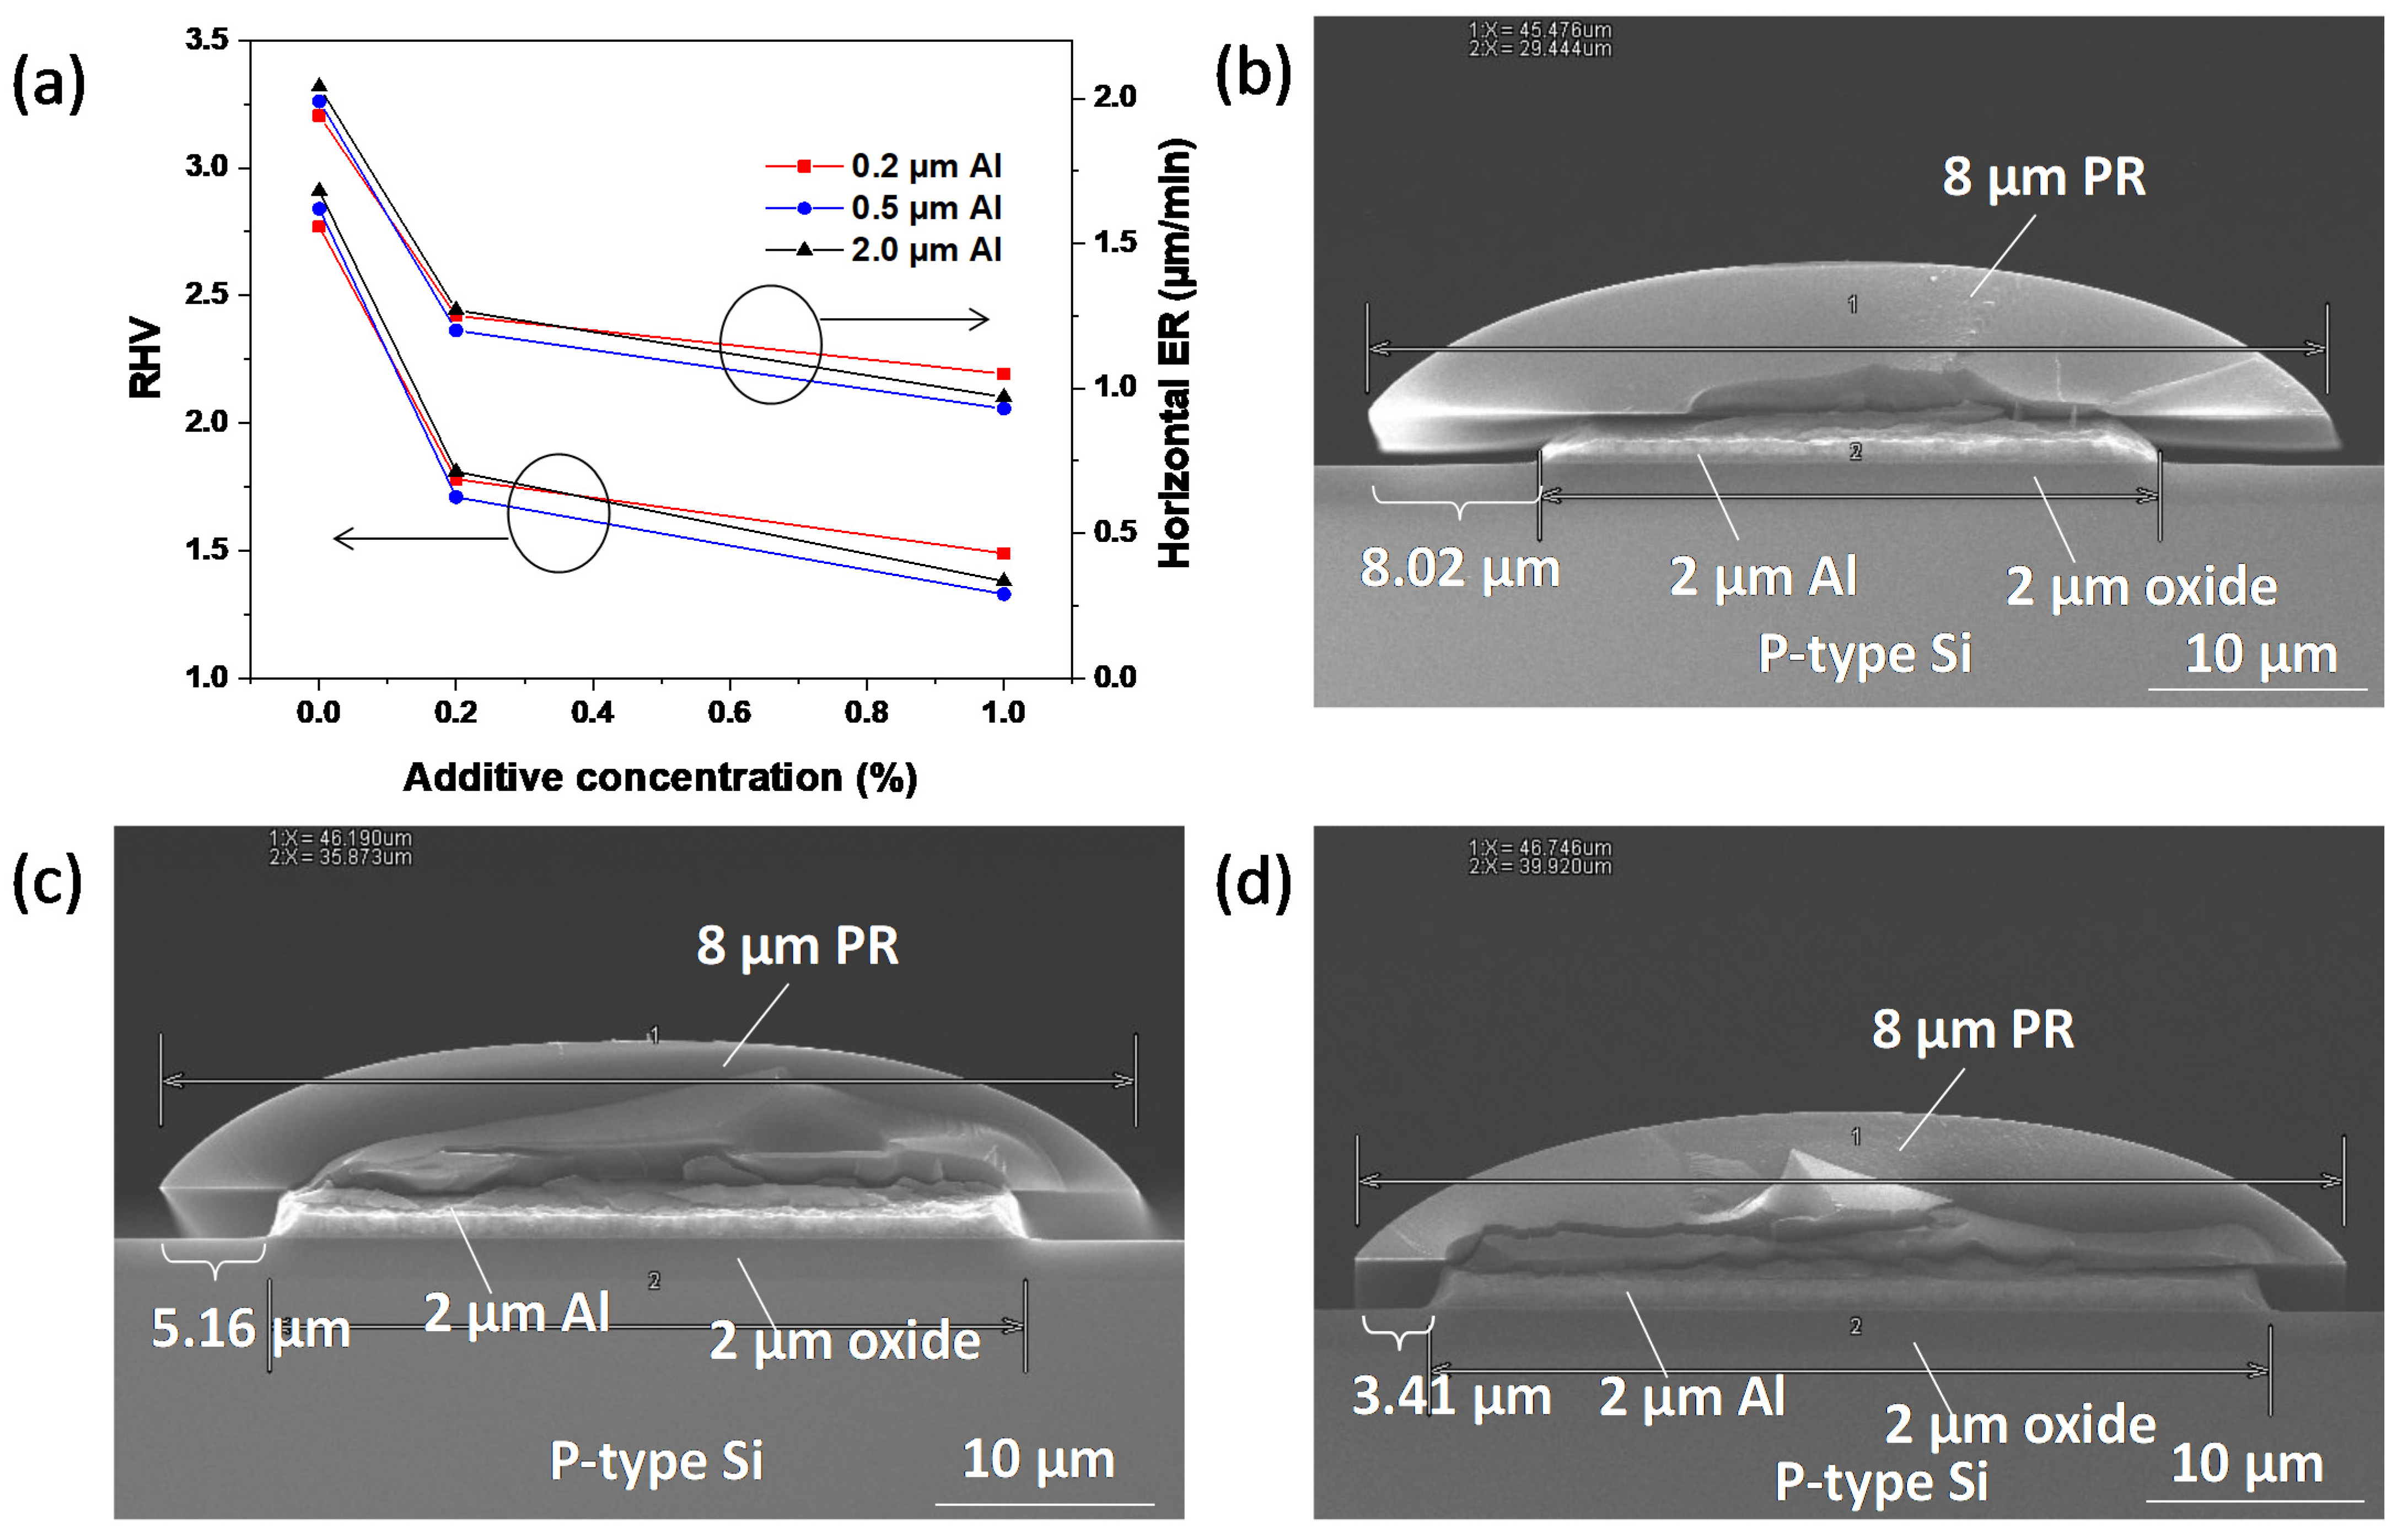
3. Results and Discussion

To observe the dissolution of the additive under different stirred conditions, three stirring conditions with flow rates of 3, 7, and 15 L/min were tested. The optical photographs of the mixed solutions for the additive with a concentration of 1% were shown in Figure 2. Figure 2a shows that the mixture presented as almost transparent and had huge oil droplets appear on the liquid surface with a flow rate of 3 L/min. As shown in Figure 2b, the mixture became cloudy and milky white. It had many tiny oil droplets on the liquid surface with a flow rate of 7 L/min. Figure 2c displays that the mixture has been turbid and completely opaque with a flow rate of 15 L/min.
The distribution of the additive dispersed particles with a concentration of 1% was obtained by using a laser particle size analyzer with a 15 mL mixture sample and is shown in Figure 2d. It is important to measure the particle size distribution immediately after taking a sample. The particle size was acquired no longer than 5 min after taking a sample from the bath. As can be seen at a flow rate of 3 L/min, the curve had two peaks located on particle sizes of 0.6 and 4.0 μm, respectively. As well, the corresponding sizes ranged from 0.1 to 40.0 μm. By increasing the flow rate to 7 L/min, the distribution curve became concentrated and had one spike located on a particle size of 0.50 μm. Under the stirring conditions for a flow rate of 15 L/min, the curve presented a high and narrow peak located at 0.37 μm. The distribution of the particle sizes ranged from 0.05 to 1.60 μm.
Therefore, different stirring strengths obviously affected the uniformity of the mixture. As the stirring rate increased, the distribution in the solution tended to be uniform. Moreover, it was observed that the solution was not fully mixed at flow rates of 3 and 7 L/min to maintain a completely and stably emulsified state. Then, the additives were precipitated out and separated into layers, which might result in poor uniformity and worse repeatability of Al ER. By increasing the flow rate to 15 L/min, an ideal dispersed phase distribution and a narrow peak were obtained. In addition, it is found at a peak located at the beginning of the curve of 15 L/min, which shows that small particles began to appear under stronger stirring conditions (>15 L/min). Based on this finding, we adopted a stirring condition of 15 L/min in the subsequent experiments.
At a fixed stirring rate, different mixing concentrations affecting the Al ER were studied. Figure 3 shows the solution of different mixing concentrations. With the concentration of 0.2%, the solution appeared almost transparent as shown in Figure 3a. When the concentration was increased to 1%, the mixture was turbid and completely opaque (Figure 3b). In Figure 3c, the substantial precipitated additive—oil foam—was observed on the liquid surface of the additive with the concentration of 5%.
Figure 3d shows the distribution curves of the dispersed particles for the three mixing concentration additives with a stirring rate of 15 L/min. For the concentration of 0.2%, two peaks were observed that were located at the sizes of 0.09 and 0.36 μm. For the concentration of 1%, the curve presents a high and narrow peak located at the particle size of 0.40 μm. While the concentration increased to 5%, two peaks were found located at the particle sizes of 0.55 and 8 μm. The distribution of the particle size ranged quite widely from 0.10 μm to several hundred micrometers. These findings indicated that the mixing concentration for the specification of solubility may lead to a precipitation phenomenon. In Figure 3c, lots of additives, like oil foams on the liquid surface, could remain on the surface of Al films, which could result in a poor average and uniformity of Al ER. The distribution of both 0.2% and 1% concentrations displayed an ideal state of emulsion with small sizes and narrow and uniform distributions. The main particle size with a 1% concentration was slightly larger than the size with a 0.2% concentration, while the amount of particle in a 1% concentration additive was several times that of the 0.2% concentration additive. Therefore, the mixing concentrations of 0.2% and 1% were adopted to investigate their effect on the Al ER, respectively. At the same time, we set up an etching solution without adding macromolecular additives as a control sample.
At the three concentrations of 0, 0.2, and 1%, the etching rates in the vertical direction were 701 ± 5, 728 ± 3, and 686 ± 2 nm/min, respectively, by measuring the remaining thickness on the bare Al wafers. The measurement was tested 10 times for each additive concentration. It showed that the etching solution with different concentration additives had a negligible effect on the Al vertical etching. The horizontal etch rate, RHV, and uniformity with different mixing concentrations were listed in Table 1. For three kinds of Al films with thicknesses of 0.2, 0.5, and 2.0 μm, the horizontal ER in the etchants with a 0% concentration were 1.94, 1.99, and 2.04 μm/min, respectively. Correspondingly, the RHV values were 2.77, 2.84, and 2.91. Under the 0% concentration, the horizontal etching rate was approximately three times that of the vertical etching rate. Under the condition of mixing a 0.2% concentration, the horizontal etch rates were 1.25, 1.20, and 1.27 μm/min, and the RHV values were 1.78, 1.71, and 1.81. Obviously, the horizontal etching rate had been steeply decreased. For the concentration of 1%, the horizontal etch rates were 1.05, 0.93, and 0.97 μm/min, while the RHV values were 1.49, 1.33, and 1.38. Furthermore, for the three Al thicknesses of 0.2, 0.5, and 2.0 μm, the uniformity defined as the ratio of the fluctuation range of the Al pattern CD to the average value decreased from 37.33% to 17.68%, 22.16% to 16.38%, and 21.51% to 14.56%, which correspond to the 0, 0.2, and 1% concentrations, respectively. This result demonstrated that the introduction of macromolecular additives can also optimize the interface characteristics of wet etching. To better analyze the trend in the influence of thickness and concentration parameters on the etching effect, we extracted the data in Table 1 and plotted them in Figure 4a. The results indicated that the ER and RHV of Al with a thickness of 0.5 μm were smaller than the counterparts with thicknesses of 0.2 and 2.0 μm. As the additive mixing concentrations increased, the Al horizontal ER reduced from ~2.0 to ~0.9 μm per minute and the RHV was effectively improved from ~3 to ~1.3 times. As a result, the undercut problem was efficiently alleviated. It means that the method had advantages over the common Al wet etching process including its low cost, high selectivity, small CD, good accuracy, etc.
Figure 4b,d demonstrated the microstructure and morphology of 2.0 μm thick Al film. It is apparent that the horizontal etching was greatly restrained in additive-mixed etchant. Specifically, the etching undercuts of three concentrations of 0, 0.2, and 1% were 8.02, 5.16, and 3.41 μm, respectively. The corresponding Al CD of the three concentrations were 28.96, 34.68, and 38.18 μm.
To better apply this method to solve the undercut problem of Al etching, a possible mechanism for the suppression of horizontal ER was proposed. The effect of the addition of macromolecular additives on horizontal etching can be explained by the interference on the horizontal transport of the etching solution during the etching process [24,25]. Specifically, the dispersed macromolecular particles of additives with a diameter near the thickness of the metal layer blocked the etching channel and inhibited the transport and exchange of liquid. With the additive concentration increasing from 0 to 1%, the main particle size of the additive with a 1% concentration was closer to the thickness of the 0.5 μm Al film. The number of particles for the sample with a 1% concentration was several times that with 0.2%. Thus, the RHV value seemed to be improved with an increasing additive concentration. The ER and RHV for the Al layer with a thickness of 0.5 μm were smaller than the counterparts for the Al layers with thicknesses of 0.2 and 2.0 μm. Figure 5 was a schematic diagram illustrating the process of wet etching and the physical mechanism. In Figure 5a, the etchant mixed with the additives reached the Al surface without PR covering and a chemical reaction occurred. Then, the undercut appeared under the photoresist due to the isotropic property of the wet etching process, as shown in Figure 5b. Some additive particles were blocked in the narrow channel of the undercut as the liquid flow was transported. With the chemical reaction going on, the Al film was etched gradually and the channel became longer, while more particles were blocked in the undercut—as shown in Figure 5c. The presence of additive particles in the channel of the undercut effectively limited the liquid transport and exchange, and thereby reduced the ER in the horizontal direction—as shown in Figure 5d. Vertical etching occurred in the area without PR coverage, forming no channels and no blocking effect, so the additives had no effect on the vertical etching rate. Even without additives, the horizontal etching rates were not same with the different thicknesses of Al, which can also be attributed to the blocking effect. Specifically, the size of the channel formed by Al with different thicknesses was not the same. The channel formed by shrinking a thin Al film would inhibit the exchange rate of the etching solution, while the width of the channel formed by the thick Al film was less impacted.

4. Conclusions

In this work, the Al horizontal ER was successfully reduced in the wet etching process by adding a kind of macromolecule additive into the Al etchant. The effect of the additive concentration and stirring strength on the dispersed distribution of the additive, as well as the Al horizontal ER and RHV, were studied. The dispersed phase of the additive, the CD, thickness, and microstructure of Al were systematically investigated by a laser particle size analyzer, OM, four-point probes, and SEM measurements. The dispersed distribution of the 1% concentration was recorded with an ideal state of emulsion under the mixing condition of 15 L/min. The ER and RHV for 0.5 μm Al were the smallest compared with that for 0.2 and 2 μm Al. The Al horizontal ER was reduced from 2.0 to 0.9 μm/min and RHV was effectively improved from 3 to 1.3 times. The Al CD was increased from 28.96 to 38.18 μm. The mechanism of the macromolecular additive on the decreasing Al horizontal ER effect in the wet etching process was that the dispersed particles of the additive blocked the etching channel and inhibited the transport and exchange of liquid. The closer the additive size was to the Al thickness, the more significant it enhanced this effect. In a word, this work adopted a method to reduce the horizontal etching rate of the Al wet etching process. The obtained findings provide manufacturers with reference knowledge of the metal patterning by wet etching. More valuable research results will be obtained if further process parameters and experimental samples can be done. The corresponding studies will be carried out in our future work.

Author Contributions

Conceptualization, J.D., D.W.Z. and H.L.; Writing—original draft, J.D. and R.Z.; Writing—review & editing, J.D., Y.L. and H.L. All authors have read and agreed to the published version of the manuscript.

Funding

This research was funded by the National Key R&D Program of China (No. 2020YFB2008604) and the National Natural Science Foundation of China (No. 51861135105).

Institutional Review Board Statement

Not applicable.

Informed Consent Statement

Not applicable.

Data Availability Statement

Not applicable.

Acknowledgments

The writers of this paper would like to appreciate the efforts of technology development team from Ningbo Semiconductor International Corporation (NSI) which had furnished the writers with many enlightening ideas. The authors will also thank the helps from Kaiyue Zhu from Xi’an Jiaotong-liverpool University.

Conflicts of Interest

The authors declare no conflict of interest.

References

  1. Bhagwat, V.; Langer, J.P. A comparison of dry plasma and wet chemical etching of GaSb photodiodes. J. Electrochem. Soc. 2003, 5, 151. [Google Scholar] [CrossRef]
  2. Chatterjee, S.; Ujihara, M.; Lee, D.G.; Chen, J.; Lei, S.; Carman, G.P. Spray etching 2 μm features in 304 stainless steel. J. Micromech. Microeng. 2006, 16, 2585–2592. [Google Scholar] [CrossRef]
  3. Ren, P. The investigation to improve photo resistor adhesion on the metal aluminum surface. Appl. IC 2018, 35, 33–36. [Google Scholar]
  4. Majumdar, S.; Majumder, S.; Kakati, A. Effect of aluminum wet etching on GaAs and poly-dimethylsiloxane substrate: Surface morphology and topography analysis. Mater. Focus 2018, 7, 45–49. [Google Scholar] [CrossRef]
  5. Piragash, K.; Venkatesh, A.; Moorthy, V. Wet-chemical etching: A novel nanofabrication route to prepare broadband random plasmonic metasurfaces. Plasmonics 2019, 14, 365–374. [Google Scholar]
  6. Sharma, V.P.; Singh, S.J.; Shukla, R. Study of metal assisted chemical etching as an alternative to dry etching for the development of MEMS. In Proceedings of the International Conference on Precision, Meso, Micro and Nano Engineering, Indore, India, 12–14 December 2019; Volume 12, pp. 12–14. [Google Scholar]
  7. Hsu, C.E.; Li, W.C. Mitigating the insufficient etching selectivity in the wet release process of CMOS-MEMS metal resonators via diffusion control. J. Microelectromech. Syst. 2020, 29, 1415–1417. [Google Scholar] [CrossRef]
  8. GadelRab, S.M.; Miri, M.A.; Chamberlain, G.S. A comparison of the performance and reliability of wet-etched and dry-etched α-Si:H TFTs. IEEE Trans. Electron Devices 1998, 45, 560–563. [Google Scholar] [CrossRef]
  9. Karzhavin, Y.; Wu, W. Plasma induced charging and physical damage after dry etch processing. In Proceedings of the 3rd International Symposium on Plasma Process-Induced Damage, Honolulu, HI, USA, 4–5 June 1998; pp. 80–83. [Google Scholar]
  10. Han, Z. Power Semiconductor Device Based; Electronic Industry Press: Beijing, China, 2013. [Google Scholar]
  11. Seidel, H. The mechanism of an-isotropic, electrochemical silicon etching in alkaline solutions. In Proceedings of the IEEE 4th Technical Digest on Solid-State Sensor and Actuator Workshop, Head Island, SC, USA, 4–7 June 1990; pp. 80–92. [Google Scholar]
  12. Frank, W.E. Approaches for patterning of aluminum. Microelectron. Eng. 1997, 33, 85–100. [Google Scholar] [CrossRef]
  13. Lin, S.W.; Guo, L.H. Influence of metal layer thickness of spiral inductors on the quality factory by simulation. In Proceedings of the 5th International Conference on ASIC, Beijing, China, 21–24 October 2003; pp. 1115–1119. [Google Scholar]
  14. Scotti, G.; Kanninen, P.; Kallio, T.; Franssila, S. Bulk-aluminum microfabrication for micro fuel cells. J. Microelectromech. Syst. 2014, 23, 372–379. [Google Scholar] [CrossRef]
  15. Love, J.C.; Paul, K.E.; Whitesides, G.M. Fabrication of nanometer-scale features by controlled isotropic wet chemical etching. Adv. Mater. 2001, 13, 604–607. [Google Scholar] [CrossRef]
  16. Du, J.Q.; Liu, H.; Liu, W.G. Wet etching of aluminum periodic patterns in micrometer-scale. Adv. Mater. Res. 2013, 662, 117–121. [Google Scholar] [CrossRef]
  17. Jee, S.E.; Lee, P.S.; Yoon, B.J.; Jeong, S.H.; Lee, K.H. Fabrication of microstructures by wet etching of anodic aluminum oxide substrates. Chem. Mater. 2005, 17, 4049–4052. [Google Scholar] [CrossRef]
  18. Fricke, S.; Friedberger, A.; Schmid, U. The influence of plasma power on the temperature-dependent conductivity and on the wet chemical etch rate of sputter-deposited alumina thin films. Surf. Coat. Technol. 2009, 203, 2830–2834. [Google Scholar] [CrossRef]
  19. Jiang, Y.H. Chip manufacture thick aluminum etching process. Microprocessors 2016, 3, 23–24. [Google Scholar]
  20. Brask, J.K. Method for Etching a Thin Metal Layer. U.S. Patent 7129182 B2, 2006. [Google Scholar]
  21. Metz, M.V.; Datta, S.; Doczy, M.L.; Kavalieros, J.; Brask, J.K.; Chau, R.S. A Method of Making Semiconductor Device Having a High-k Gate Dielectric. U.S. Patent 7317231 B2, 8 January 2008. [Google Scholar]
  22. Brask, J.K.; Shah, U.; Doczy, M.L.; Kavalieros, J.; Chau, R.S.; Turkot, R.B. Selective Etch Process for Making a Semiconductor Device Having a High-k Gate Dielectric. U.S. Patent 7037845 B2, 2 May 2006. [Google Scholar]
  23. Brask, J.K. Methods and Compositions for Selectively Etching Metal Films and Structures. U.S. Patent 20060037943 A1, 23 February 2006. [Google Scholar]
  24. Williams, K.R.; Muller, R.S. Etch rates for micromachining processing. J. Microelectromech. Syst. 1996, 5, 256–269. [Google Scholar] [CrossRef]
  25. Williams, K.R.; Gupta, K.; Wasilik, M. Etch rates for micromachining processing-part II. J. Microelectromech. Syst. 2003, 12, 761–778. [Google Scholar] [CrossRef] [Green Version]
Figure 1. The schematic diagram of the wet etching bath.
Metals 12 00813 g001
Figure 2. Optical photographs from the top of the solution of the additive under stirring conditions of (a) 3 L/min, (b) 7 L/min, (c) 15 L/min, and (d) the distribution of additive dispersed particles with the concentration of 1%.
Metals 12 00813 g002
Figure 3. Photos from the top of the solution of the additive at concentrations (a) 0.2%, (b) 1%, (c) 5%, and (d) the distribution of the additive dispersed particles with the stirred rate of 15 L/min.
Metals 12 00813 g003
Figure 4. (a) Extracted values of RHV and horizontal ER as a function of additive mixing concentration and SEM images of 2 μm Al in etchants of concentration (b) No additive, (c) 0.2%, (d) 1%, for 4 min.
Metals 12 00813 g004
Figure 5. Schematic diagram illustrating the mechanism of macromolecular additives: (a) chemical reaction begins on Al surface without PR covering, (b) undercut appears under the photoresist, (c) additive particles are blocked in the narrow channel, and (d) additive particles in the channel limit the liquid transport and exchange.
Metals 12 00813 g005
Table 1. Etching experiment results for horizontal etch rate (unit: μm/min), RHV and uniformity.
Additive Mixing ConcentrationAl 0.2 μm (Etching Time 0.5 min)Al 0.5 μm (Etching Time 1 min)Al 2.0 μm (Etching Time 4 min)
Horizontal ERRHVUniformityHorizontal ERRHVUniformityHorizontal ERRHVUniformity
0%1.94 ± 0.32.7737.33%1.992.8422.16%2.042.9121.51%
0.2%1.25 ± 0.31.7827.66%1.201.7124.67%1.271.8117.57%
1%1.05 ± 0.31.4917.68%0.931.3316.38%0.971.3814.56%
Publisher’s Note: MDPI stays neutral with regard to jurisdictional claims in published maps and institutional affiliations.

