Article

Study of Heat Source Model and Residual Stress Caused by Welding in GMAW of Al Alloy

1
Department of Naval Architecture and Ocean Engineering, Chosun University, Gwangju 61452, Korea
2
Ship & Offshore Research Institute, Samsung Heavy Industries Co., Ltd., Geoje 53261, Korea
*
Author to whom correspondence should be addressed.
Metals 2022, 12(6), 891; https://doi.org/10.3390/met12060891
Submission received: 19 April 2022 / Revised: 16 May 2022 / Accepted: 20 May 2022 / Published: 24 May 2022
(This article belongs to the Special Issue Residual Stress Analysis of Welded Structure)

Abstract

:
An important trend in recent ships and offshore structures is that they require high strength as well as light weight. Due to this trend, various materials are being used to replace existing carbon steel, with aluminum alloys being used frequently. In particular, this trend is conspicuous in outfitting rather than in traditional structural strength members. As a typical example, the use of aluminum alloys is increasing in helideck structures and handrails, which are tertiary components. In order to make the example structures above, welding is absolutely necessary. There are various welding methods used for aluminum alloy, with gas metal arc welding (GMAW) the most widely used. It is very important to be able to simulate welding and to predict various physical quantities of this welding technique in the production of aluminum alloy structures. In particular, welding-induced residual stresses are always generated in a structure that has been welded, and can greatly influence structural stability. Therefore, this paper proposes a method to simulate the welding phenomenon using a precise welding heat source for various aluminum alloys. Additionally, the validity of the proposed finite element (FE) analysis method is verified by measuring the residual stress of the representative aluminum alloy.

1. Introduction

Recently, many studies have been conducted on various issues in the field of structural strength, and one of the representative topics is the problem of reducing the weight of structures. Structures made of heavy materials consume a lot of energy when moving, which reduces fuel efficiency. For this reason, high-strength and lightweight materials are in the spotlight, and in particular, aluminum alloys could be seen as a representative material that meets this principle.
Particularly in the shipbuilding and offshore industries, weight reduction is directly related to the environmental problem because materials using aluminum alloys can contribute to reducing the carbon emission by reducing the overall structural weight and increasing fuel efficiency. As a typical example, the use of aluminum alloy is increasing in helideck structures and handrails, which are tertiary components. In order to make such structures using an aluminum alloy, welding (generally gas metal arc welding (GMAW), see Figure 1) is absolutely necessary. However, as is widely known, when welding is performed to fabricate a structure there is local expansion and shrinkage of the structure due to the welding heat source, resulting in various deformations and residual stresses due to this local contraction/expansion and the constraint of the structure itself. [1] In relation to this issue, it is widely known to use direct experiments or numerical analysis using the finite element method (FEM).
Many previous studies have already been conducted on this topic. A number of related studies are available in the literature in association with the direct measurement of welding-induced initial imperfections in steel- or aluminum-stiffened plate structures. For example, Masubuchi [1], Smith et al. [2], Ueda [3], Paik et al. [4], Paik [5,6], Paik et al. [7,8], Vhanmane et al. [9], Luís et al. [10], Bruno et al. [11], Khedmati et al. [12] and Teresa et al. [13] obtained measurement databases of initial distortions on aluminum-plated structures; Cheng et al. [14], Kenno et al. [15,16] and Yi et al. [17,18,19] obtained measurement databases of residual stress on steel-plated structures; and Paik et al. [4], Paik [6] and Paik et al. [7,8] obtained measurement databases of residual stresses and softening on aluminum-plated structures. Further, many previous studies (Rosenthal [20], Pavelic et al. [21], Eager et al. [22], Wahab et al. [23], Marugan et al. [24], Choo et al. [25], Nguyen et al. [26], Fan et al. [27] and Sharma et al. [28]) have determined heat transfer by heat source modeling.
Recently [29], many papers related to the thermal cycle of welding dissimilar aluminum materials have been published; however, the study of heat source models for various structural aluminum alloys does not seem to have received much attention. In addition, it seems that there are not many experiments on the characteristics of temperature-gradient distribution around the heat source for verification of the heat source model. This basic research should be applied via a simple experiment using a unit specimen, but we found this was lacking in existing studies. Lastly, in relation to the verification of the precision heat source model of gas metal arc welding (GMAW) used for aluminum alloy welding, the comparative study between the numerical analysis results and the residual stress measurement experiment was also relatively insufficient.
In this study, welding experiments were conducted with basic unit specimens for three types of alloys (Al 5083, Al 6061 and Al 6082) that are currently used as structural aluminum alloys. Then, a tensile test was performed to check the mechanical properties by extracting the base material and welding part of the aluminum alloy from this specimen. Further, thermocouples were installed near the welding part during the welding experiment to extract the thermal history. This result was comparatively verified through precise FE thermal analysis and used to propose a heat source model suitable for GMAW. Finally, after welding, the welding-induced residual stresses were measured through the hole drilling technique in a specific specimen. The purpose of this is to propose the most-suitable heat source model for GMAW of aluminum alloys by comparing and verifying FE analysis results of a precision heat source model. The results suggest it is reasonable to use the heat source model proposed in this study for GMAW simulation of aluminum alloys.

2. Materials and Experiments

2.1. Characteristics of Each Type of Aluminum Alloy

Aluminum alloys are generally divided into heat-treatable and non-heat-treatable alloys (Table 1).
Among the Al alloys introduced in Table 1, there are three types used in this study: Al 5083 H321, Al 6061 T6 and Al 6082 T6. The general characteristics of each of these alloys are summarized as follows.
In 5000-based Al alloys (Al-Mg series alloys), tensile strength and strength against deformation are increased with the addition of Mg, which makes machining difficult. They are mainly used for structural equipment such as buildings, vehicles, ships and bridges. Al 5083 (containing 4.5% Mg) has a tensile strength of 200–300 MPa and is widely used for welded structures. This Al alloy is mainly used in the form of a plate, created by rolling process. As a non-heat-treated alloy, it has the best strength and good weldability, corrosion resistance and workability. In alloy naming, the last letter ‘H’ means work-hardened, with H3 indicating an alloy that has been work-hardened and then stabilized.
The 6000-based Al alloys (Al-Mg-Si series alloys) are heat-treated and have decent weldability due to their excellent formability, strength and corrosion resistance. However, there is a disadvantage in that the weld is softened by the heat of welding. Therefore, Al 6061 and 6082 alloys are used to make section steels through extrusion. The alloy treatment symbol ‘T’ indicates heat treatment, with T6 corresponding to artificial aging after solid solution treatment.

2.2. Specimen Testing Using GMAW

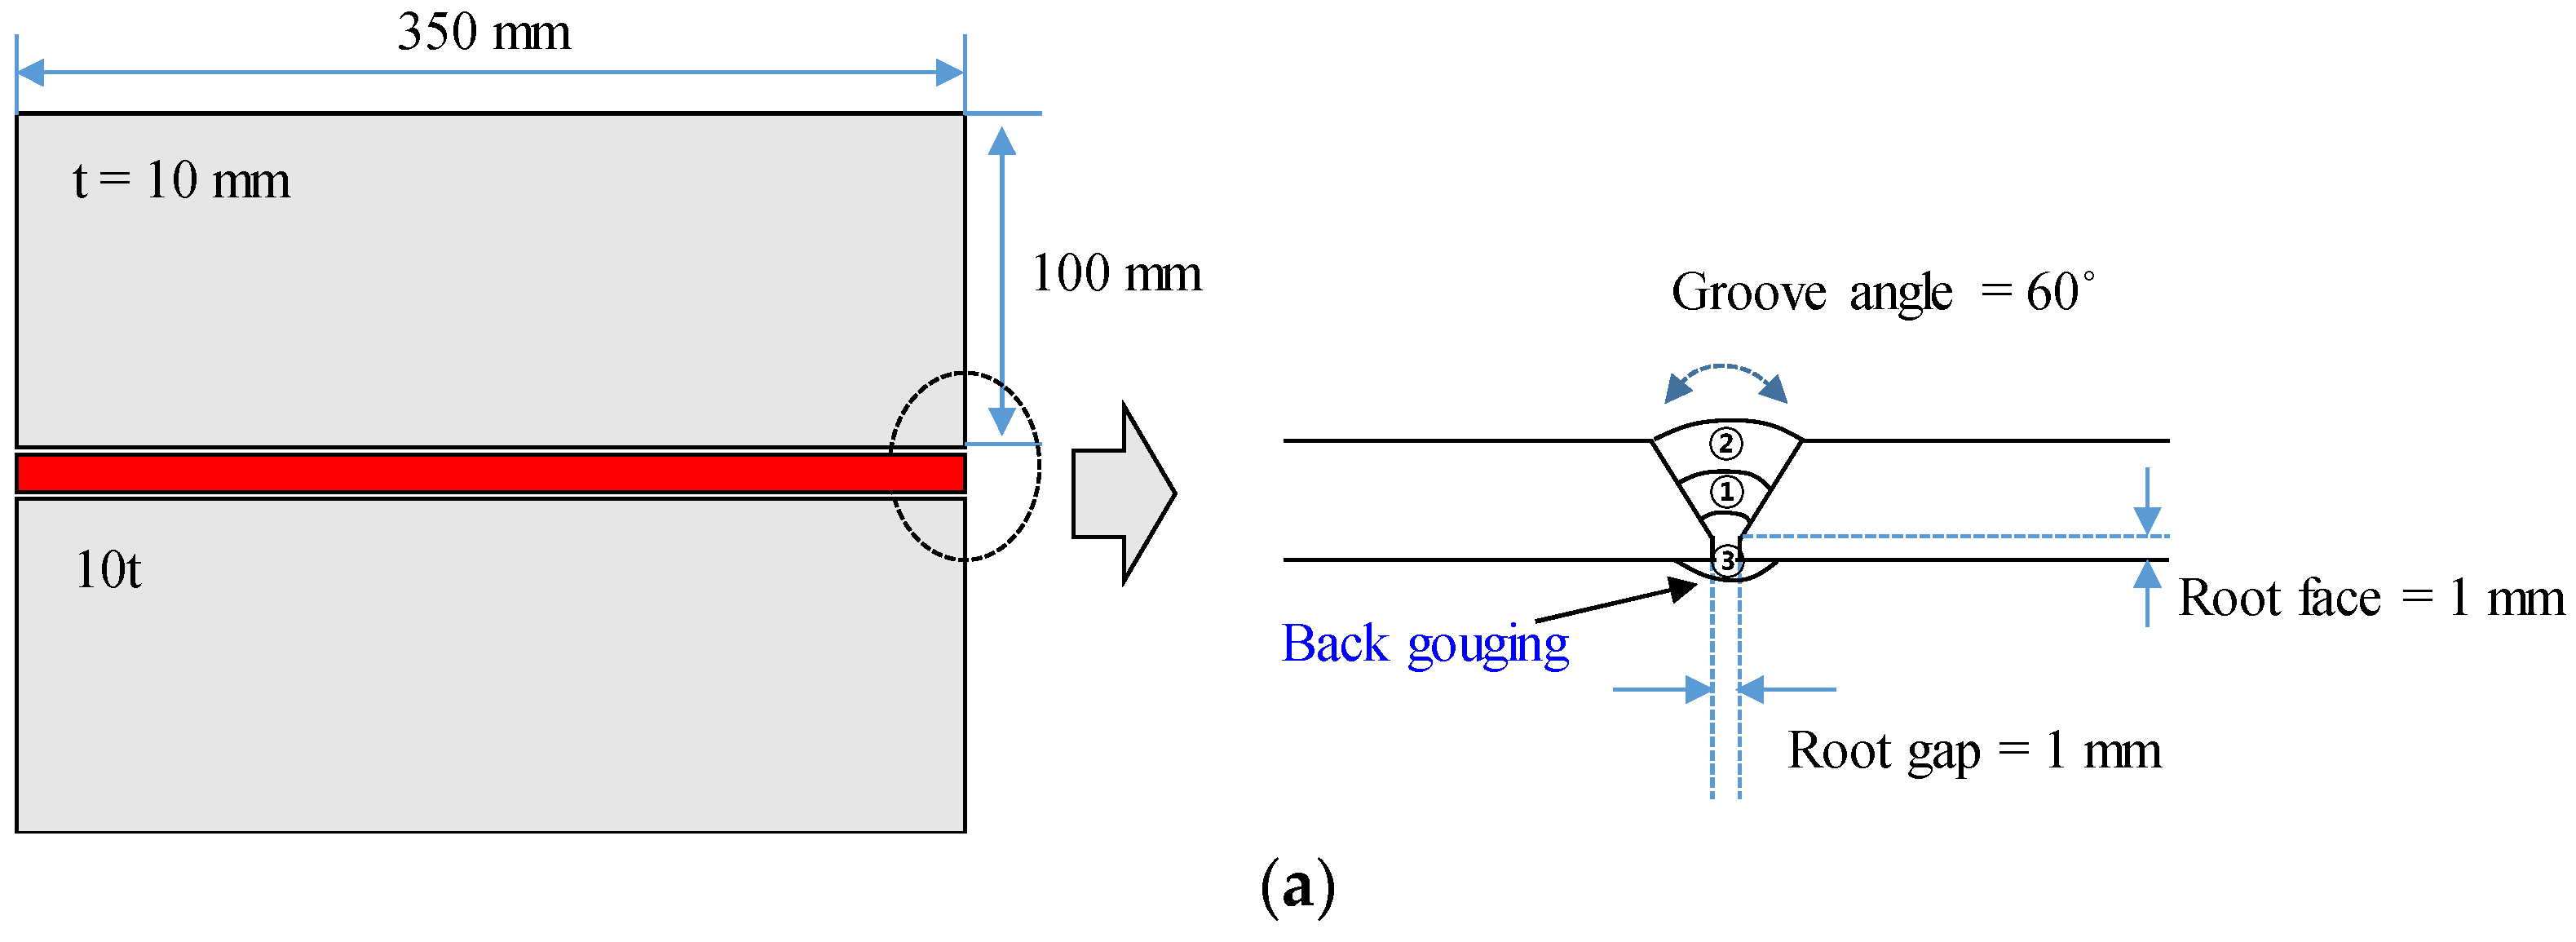
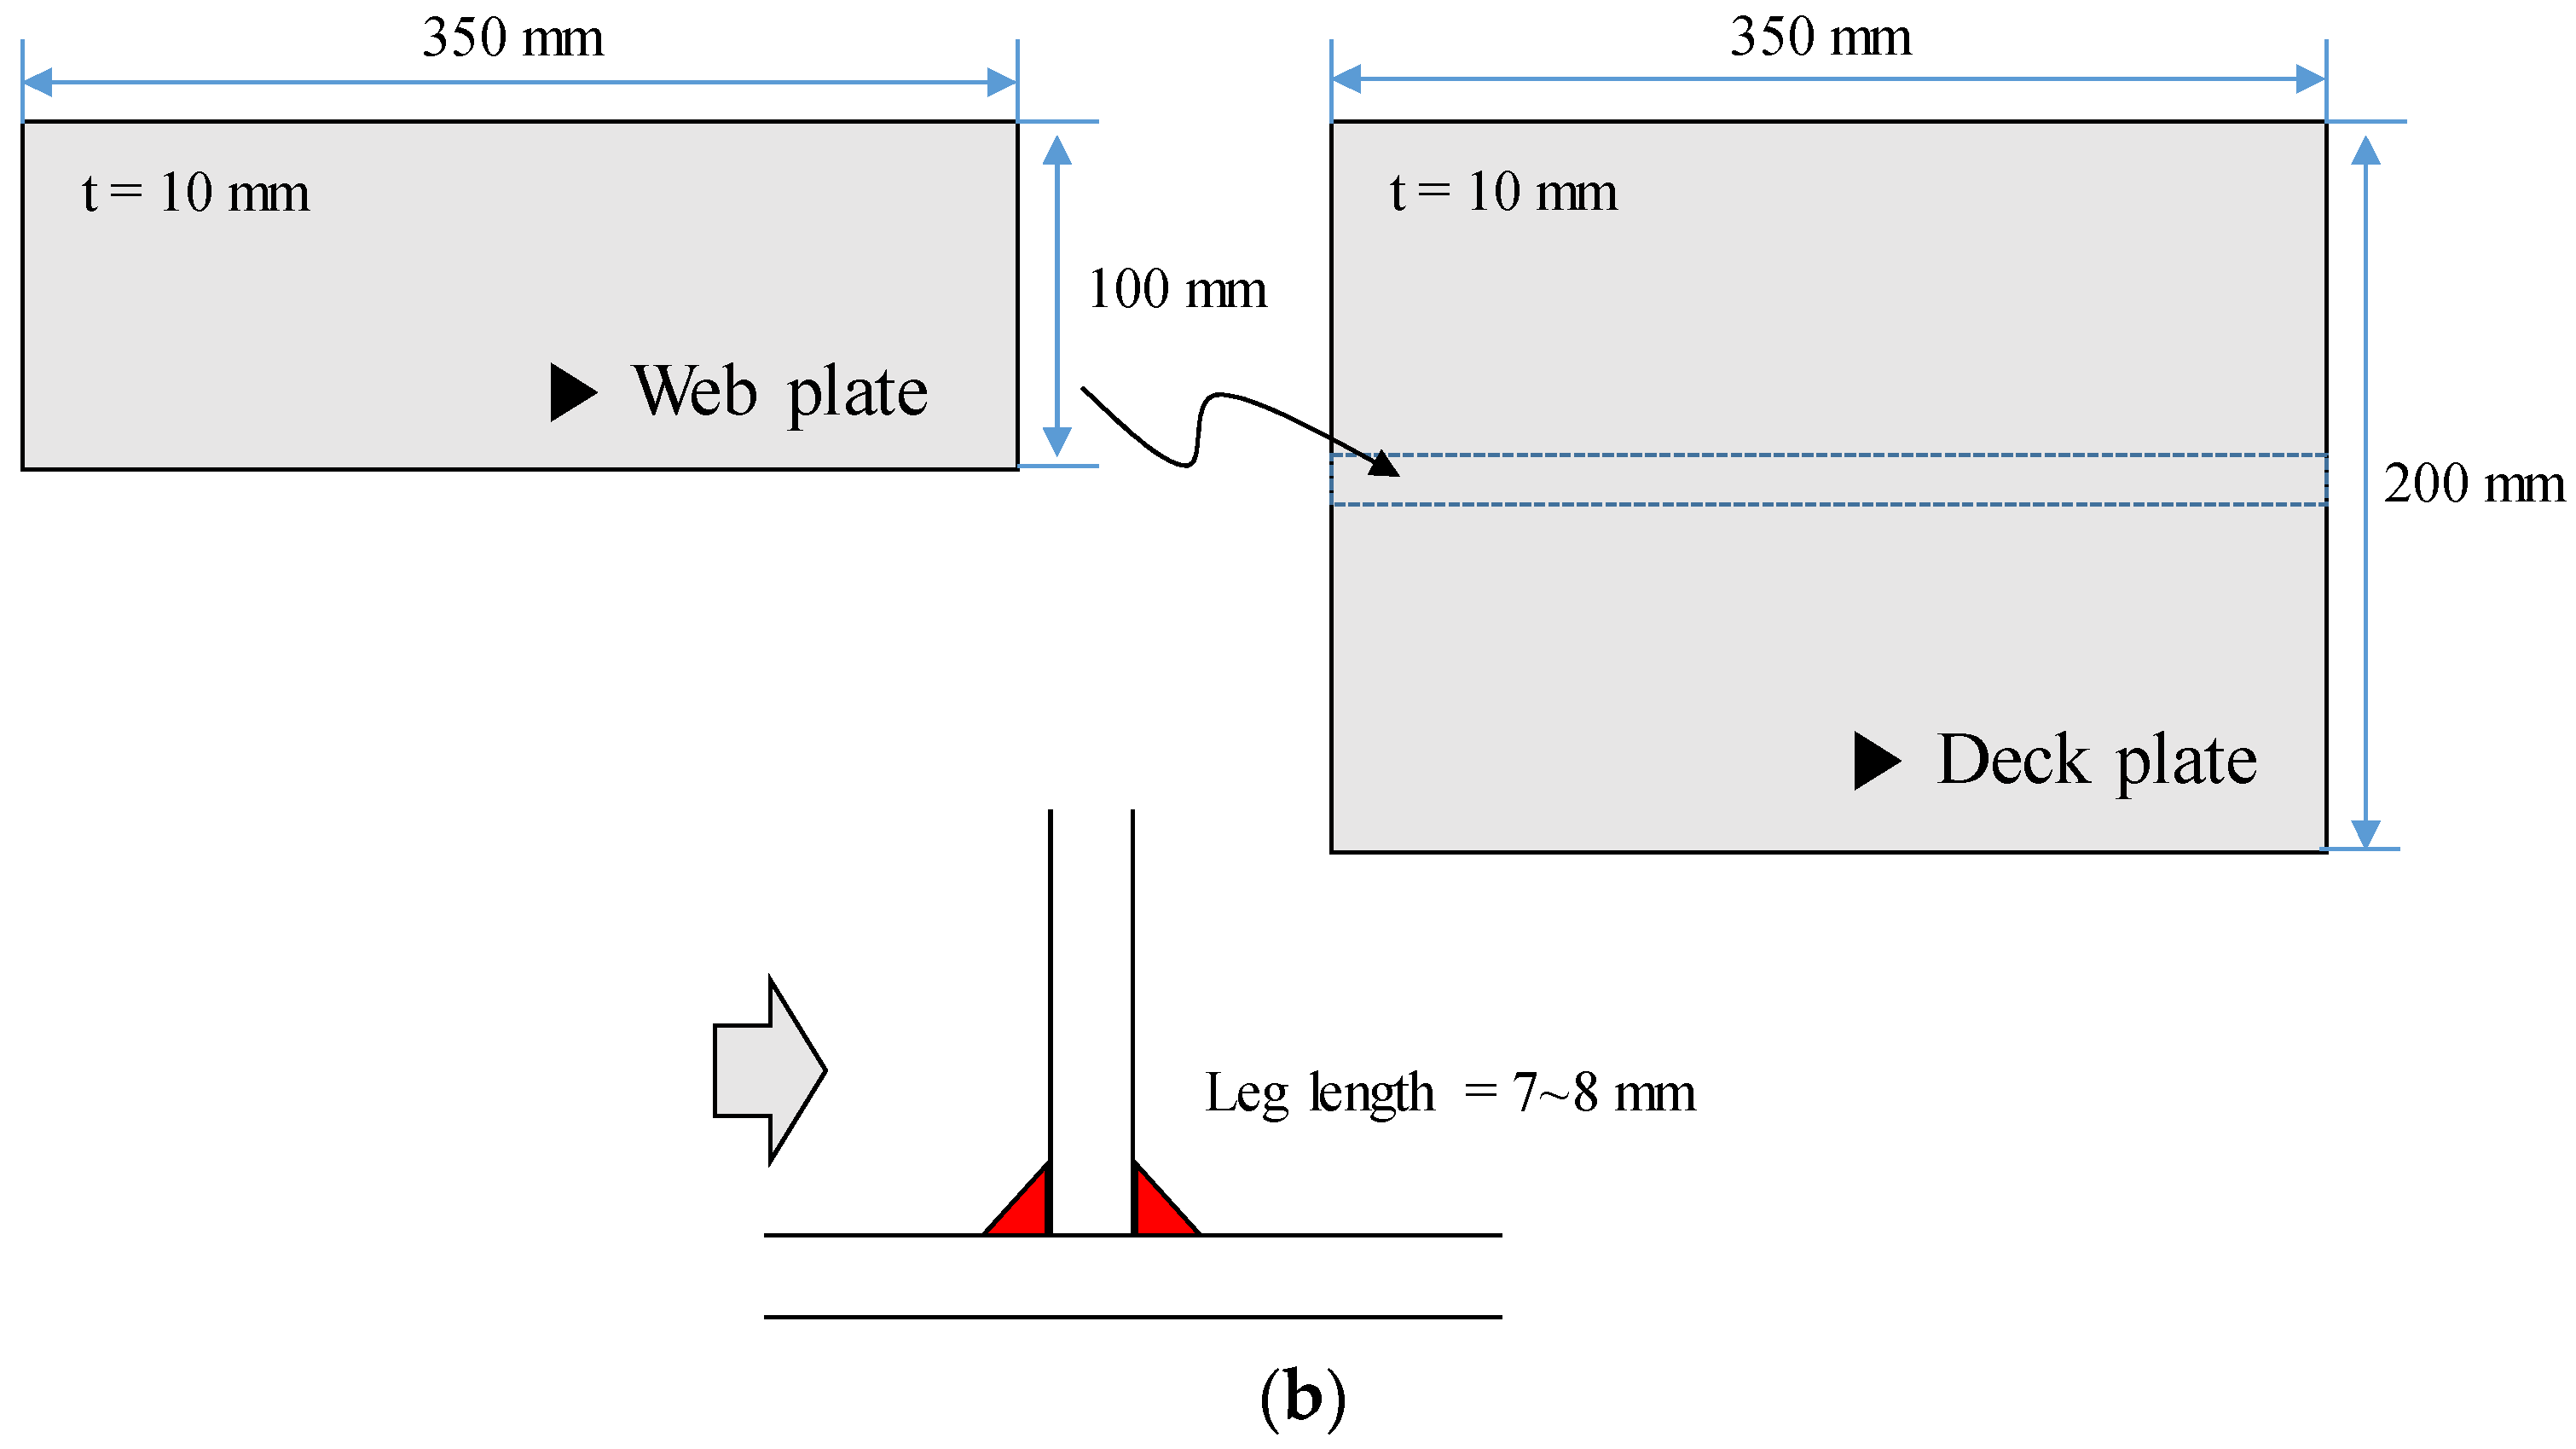
Specimen tests were performed exponentially to verify the simulation for precision GMAW and the developed heat source model. Specimen testing (Samsung Heavy Industries Co., Ltd., Geoje 53261, Korea) was conducted in fillet and butt welding of three Al alloys (Al 5083 H321, Al 6061 T6, Al 6082 T6). The detailed size of the specimen is shown in Figure 2, and the number of each specimen according to Al alloy and welding types is shown in Table 2.
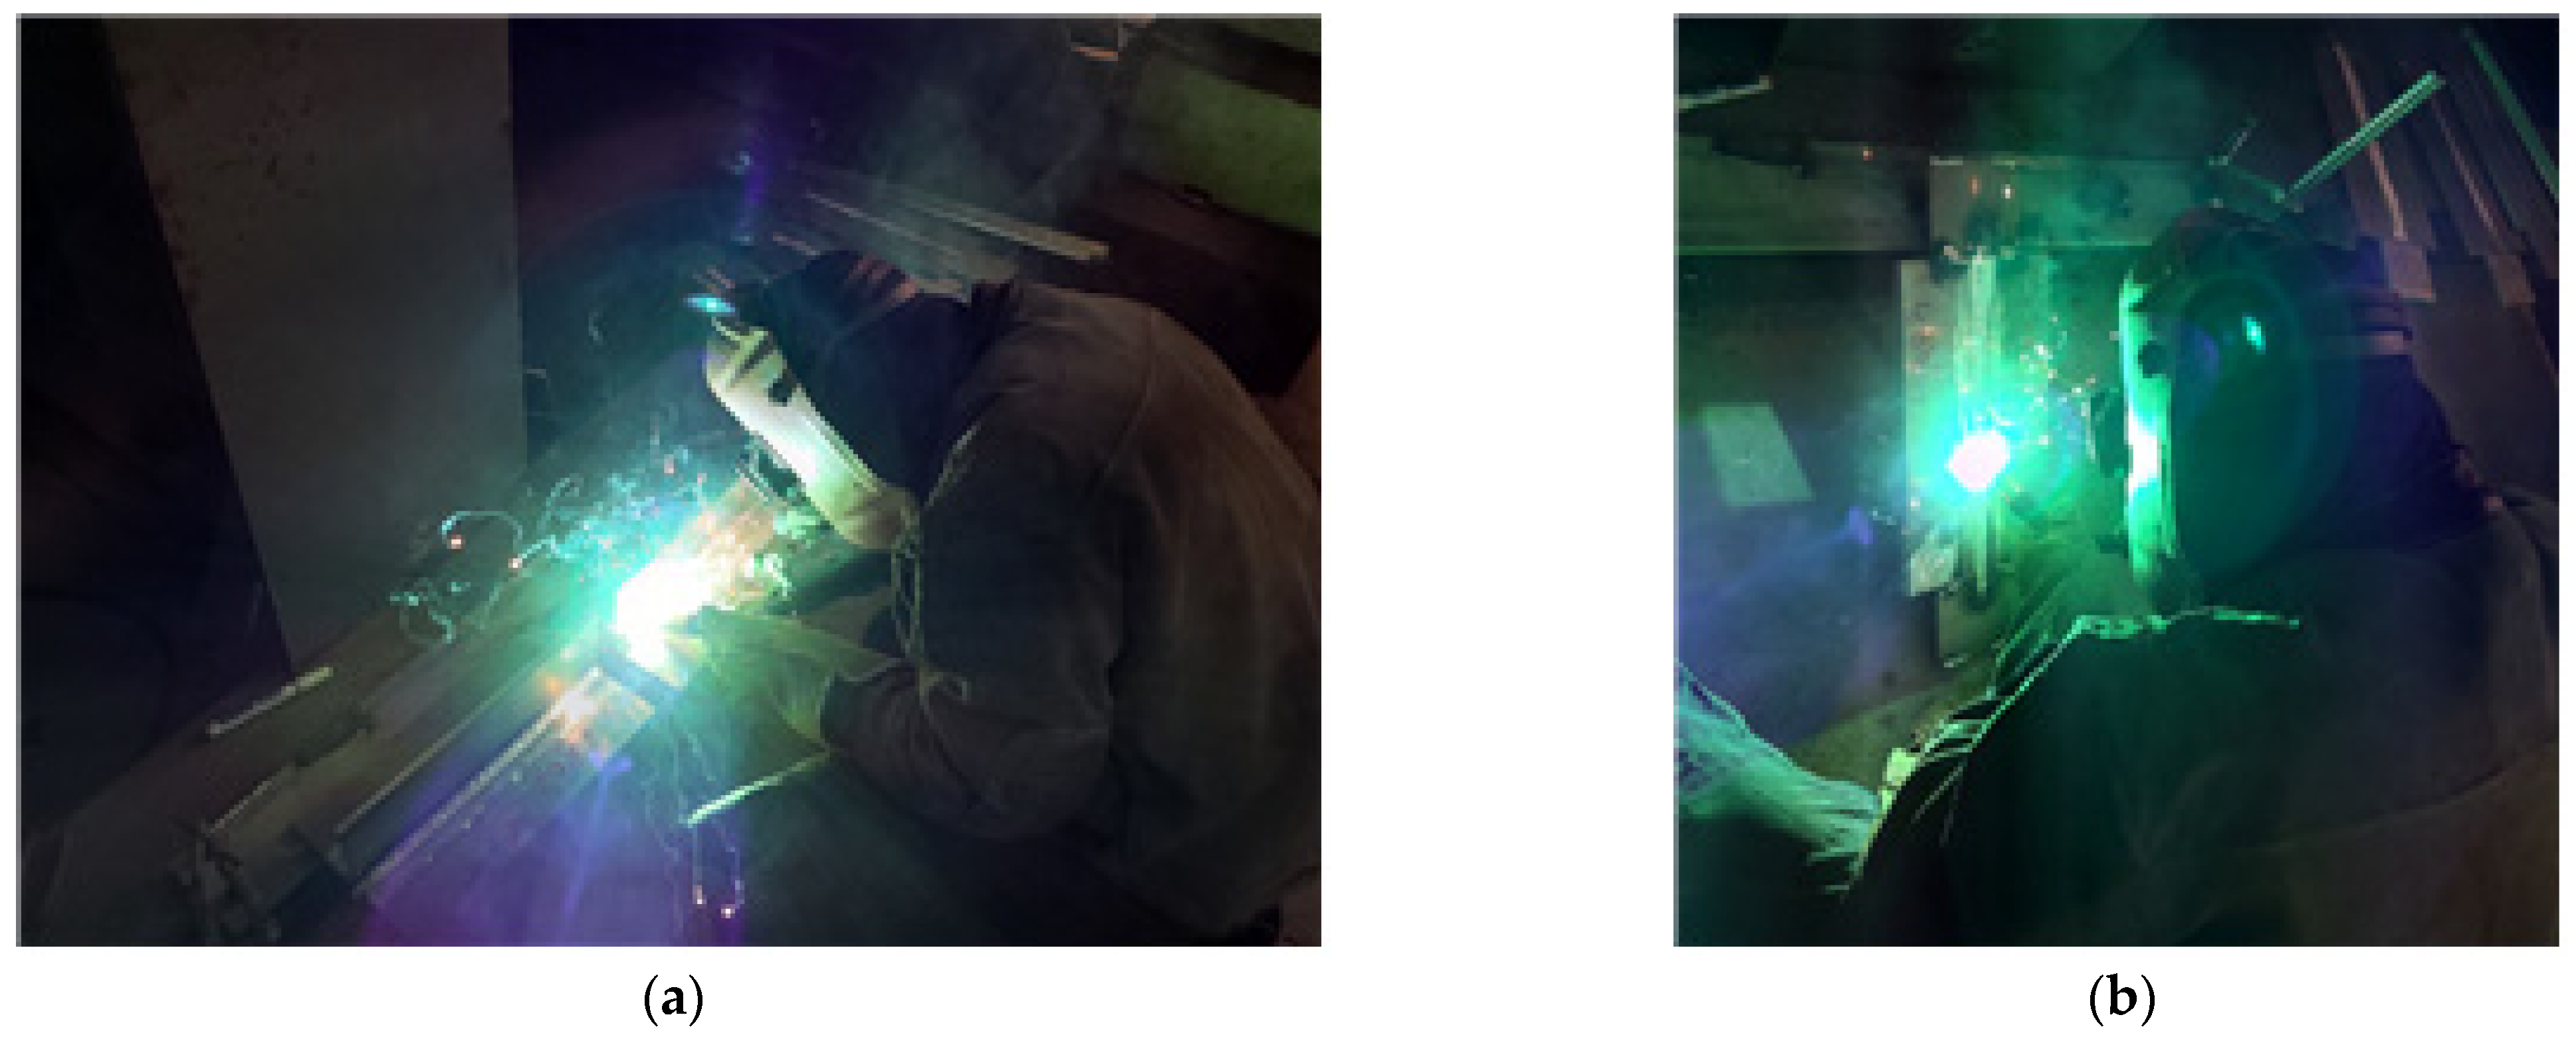
As shown in Figure 3, the work was carried out based on the actual welding procedure specification (WPS). Table 3 and Table 4 shows the welding heat input based on WPS.
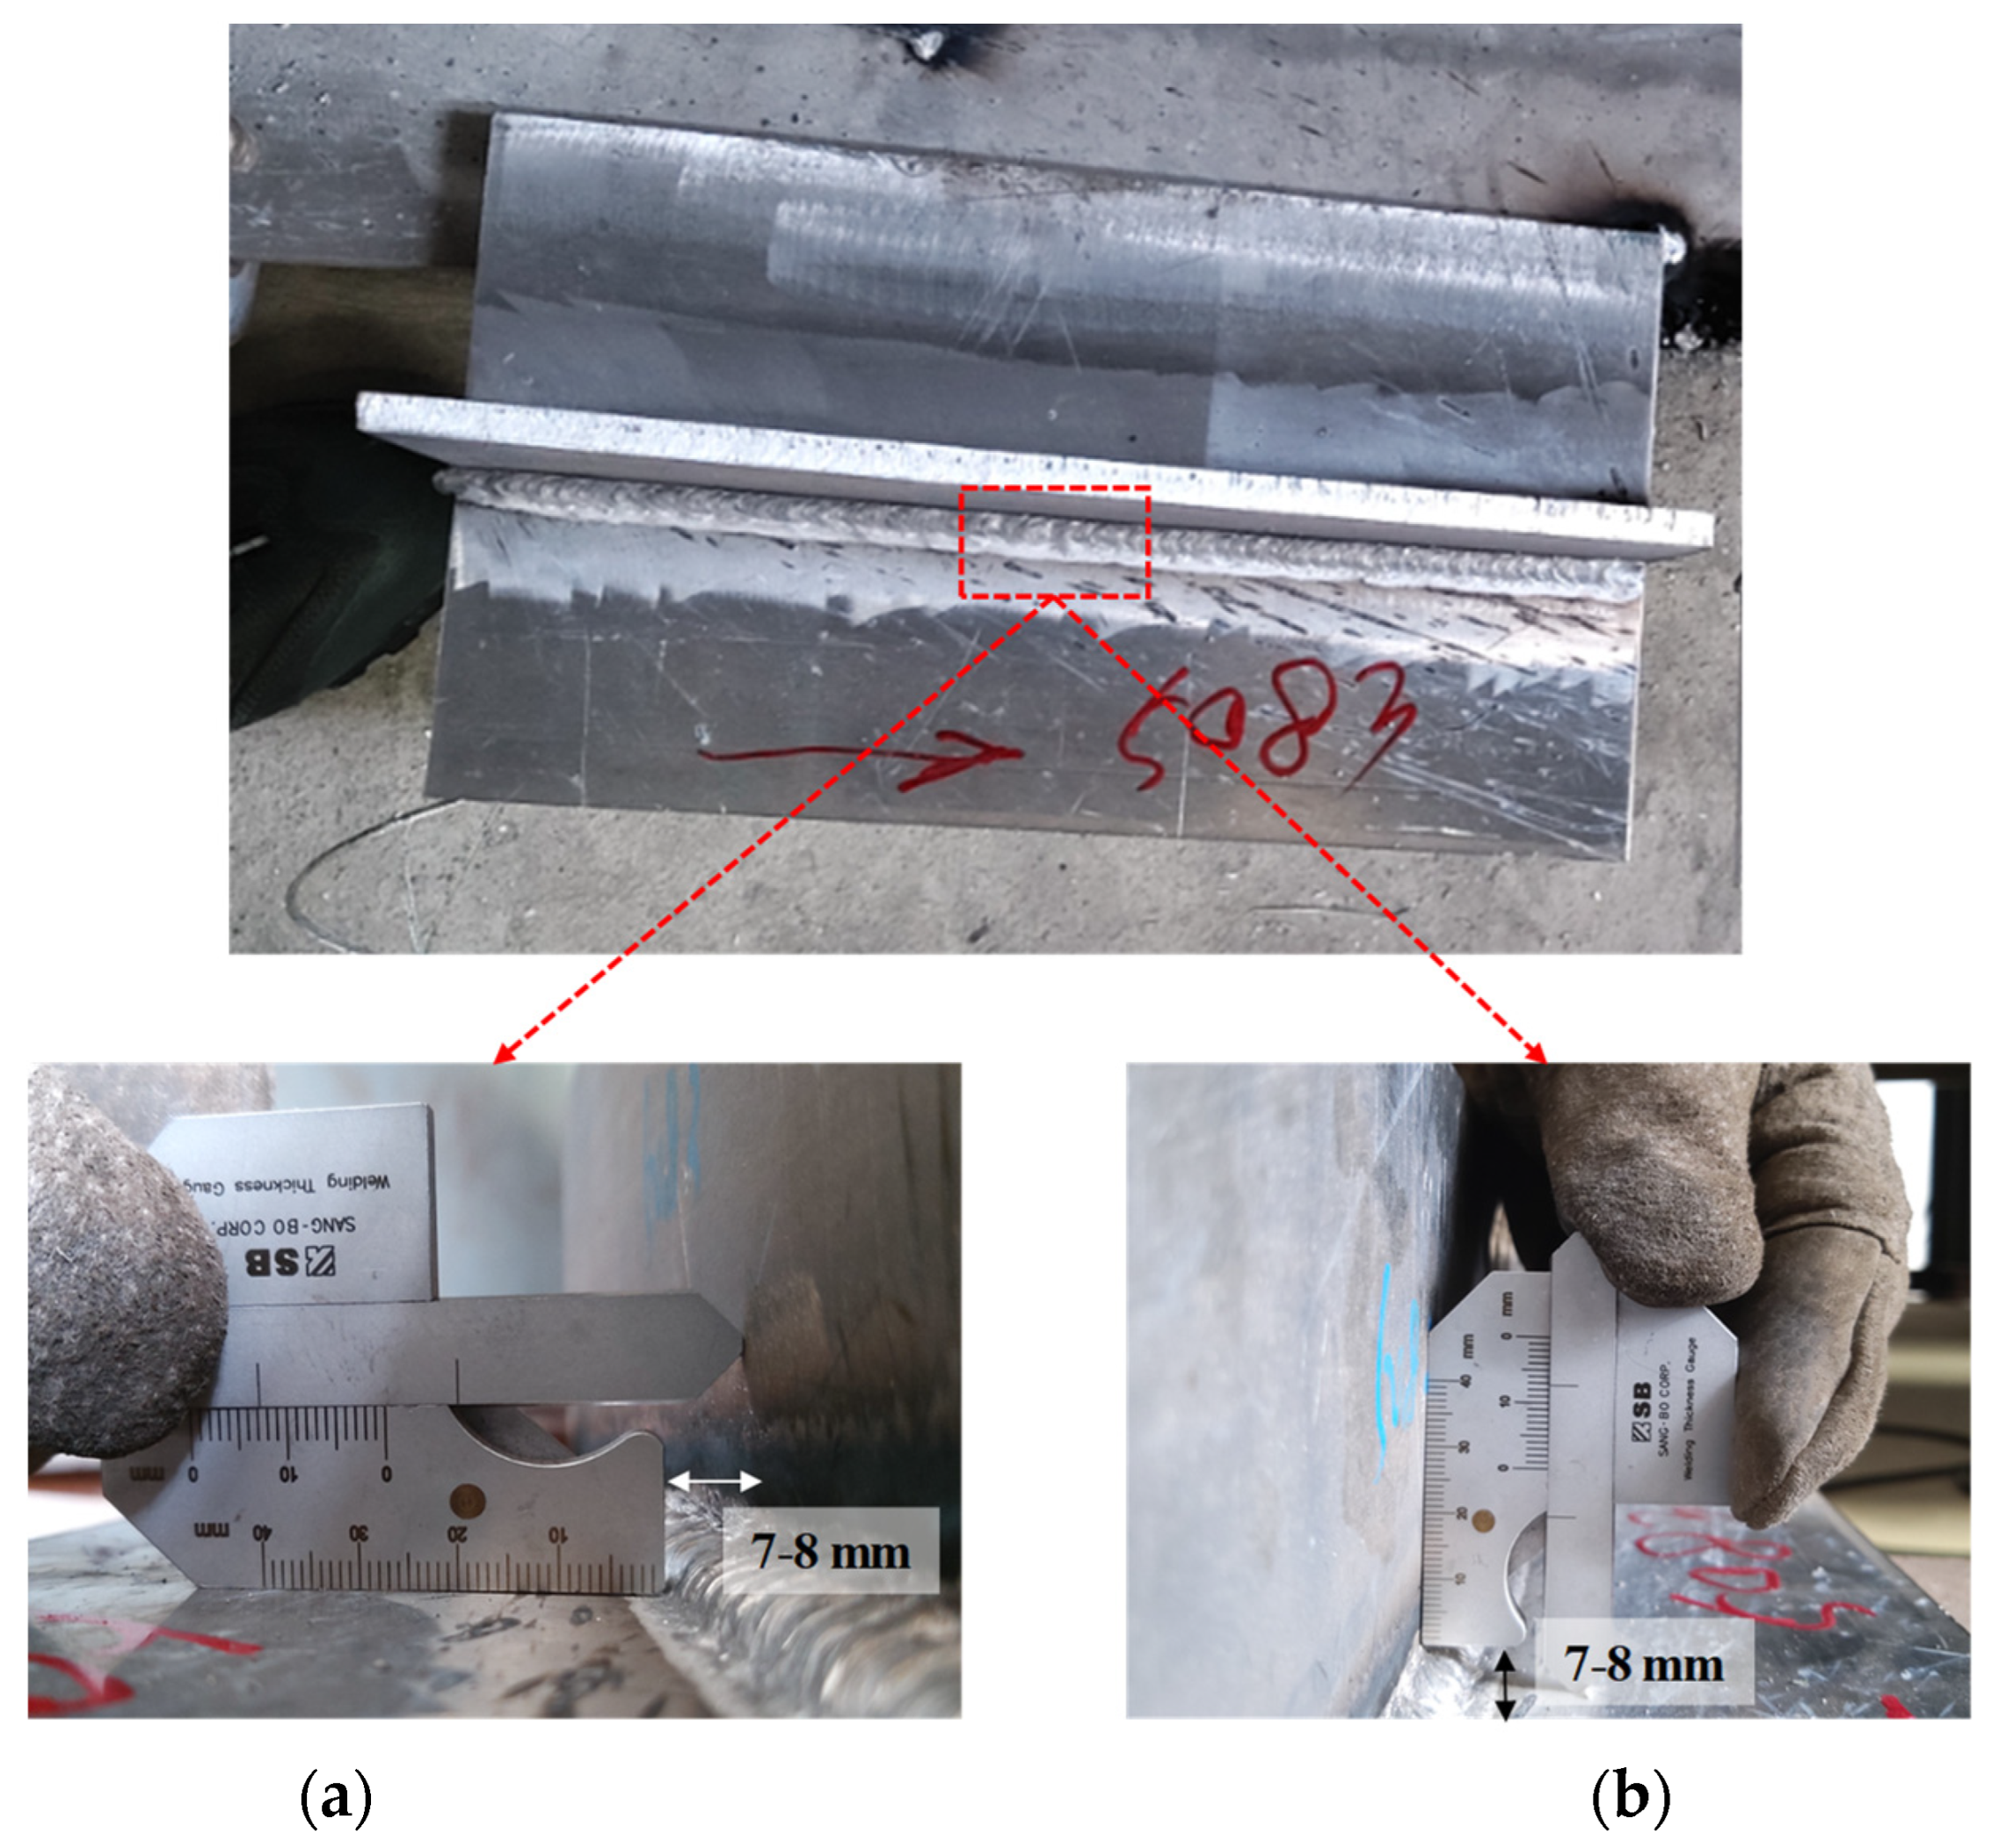
As shown in Figure 4, fillet welding was performed at about 7–8 mm for both the upper and bottom leg lengths. In the case of butt welding, after welding on the front side, gouging was performed on the backside to remove the welding defects of the first layer. After gouging, the last welding of the backside was performed.

2.3. Mechanical Property Testing for Al Alloys

First, Table 5, Table 6 and Table 7 provides information on the chemical composition of each alloy as provided by the steel mill of manufacture.
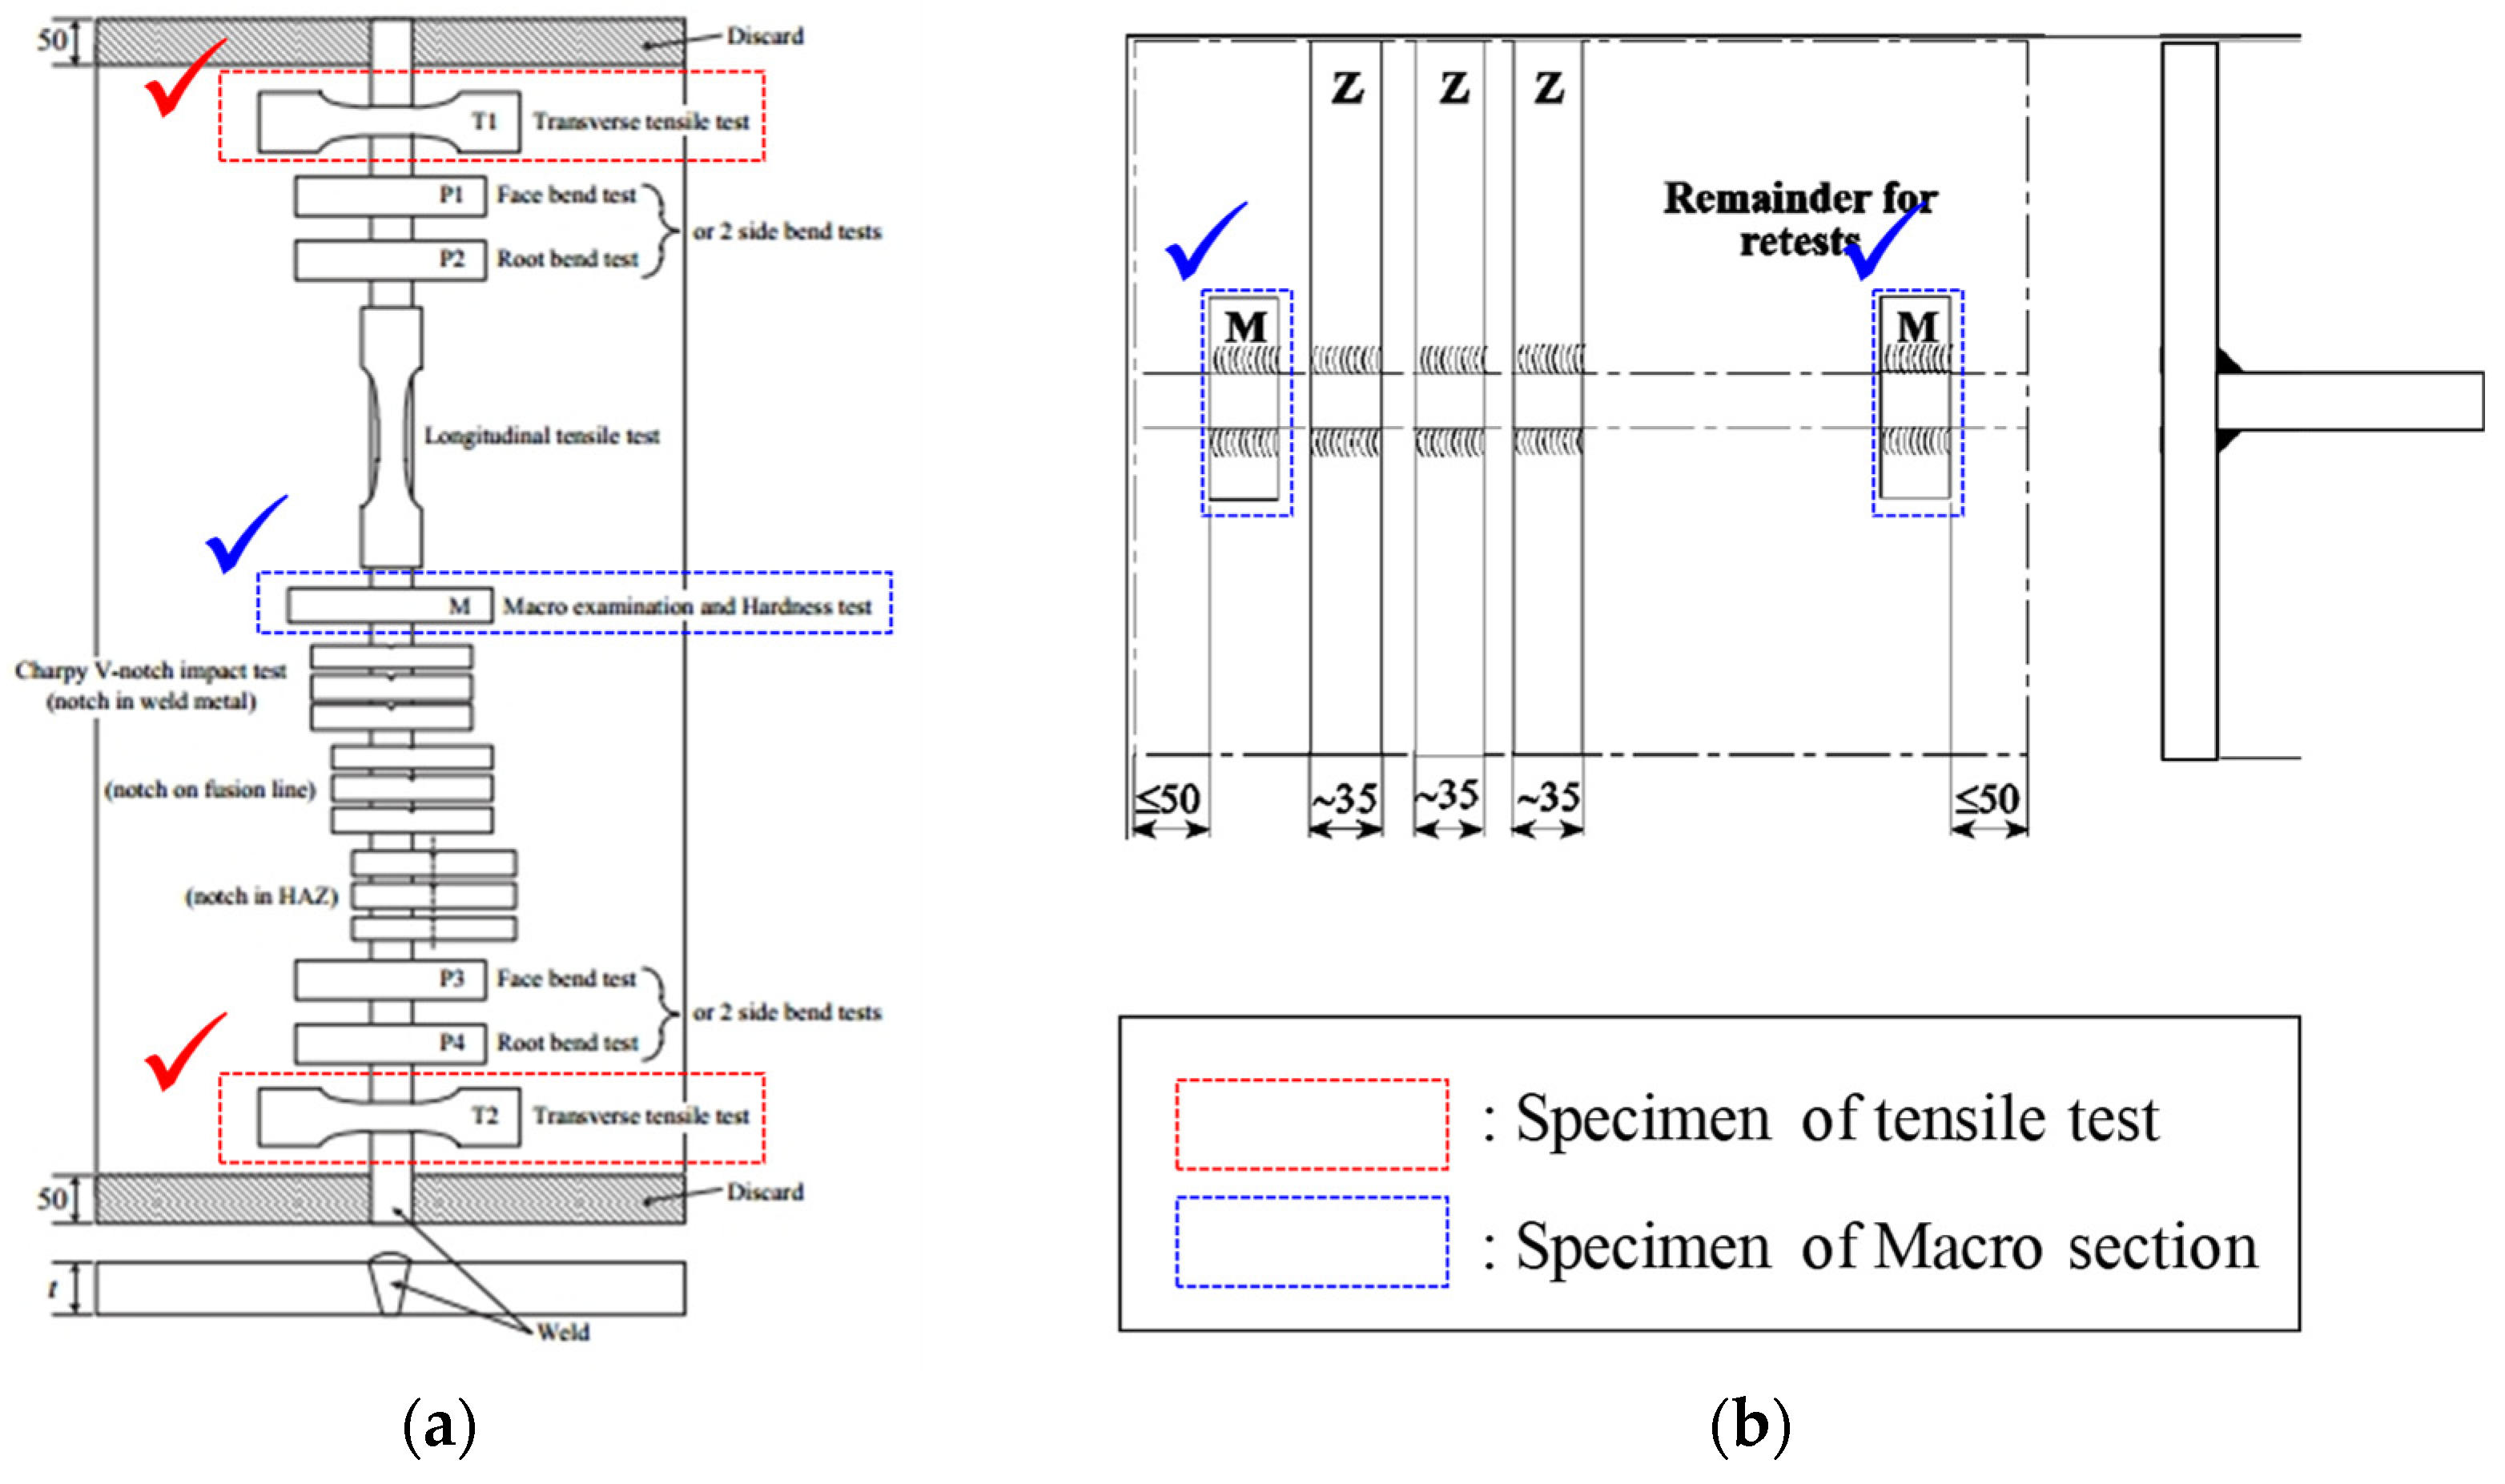
Further, in order to perform precise numerical analysis of Al GMAW, it is necessary to obtain accurate mechanical property information. Therefore, tensile tests (Samsung Heavy Industries Co., Ltd., Geoje 53261, Korea) were performed on the base and welded parts of the three Al alloys used in this study. These experiments were performed in accordance with ASTM E8/E8M-16a, and two repetitions were performed for the base material and welded part. In addition, in order to accurately check the bead and heat affect zone (HAZ) shape, macro sections were extracted for butt and fillet welds. The extraction location for each test is shown in Figure 5.
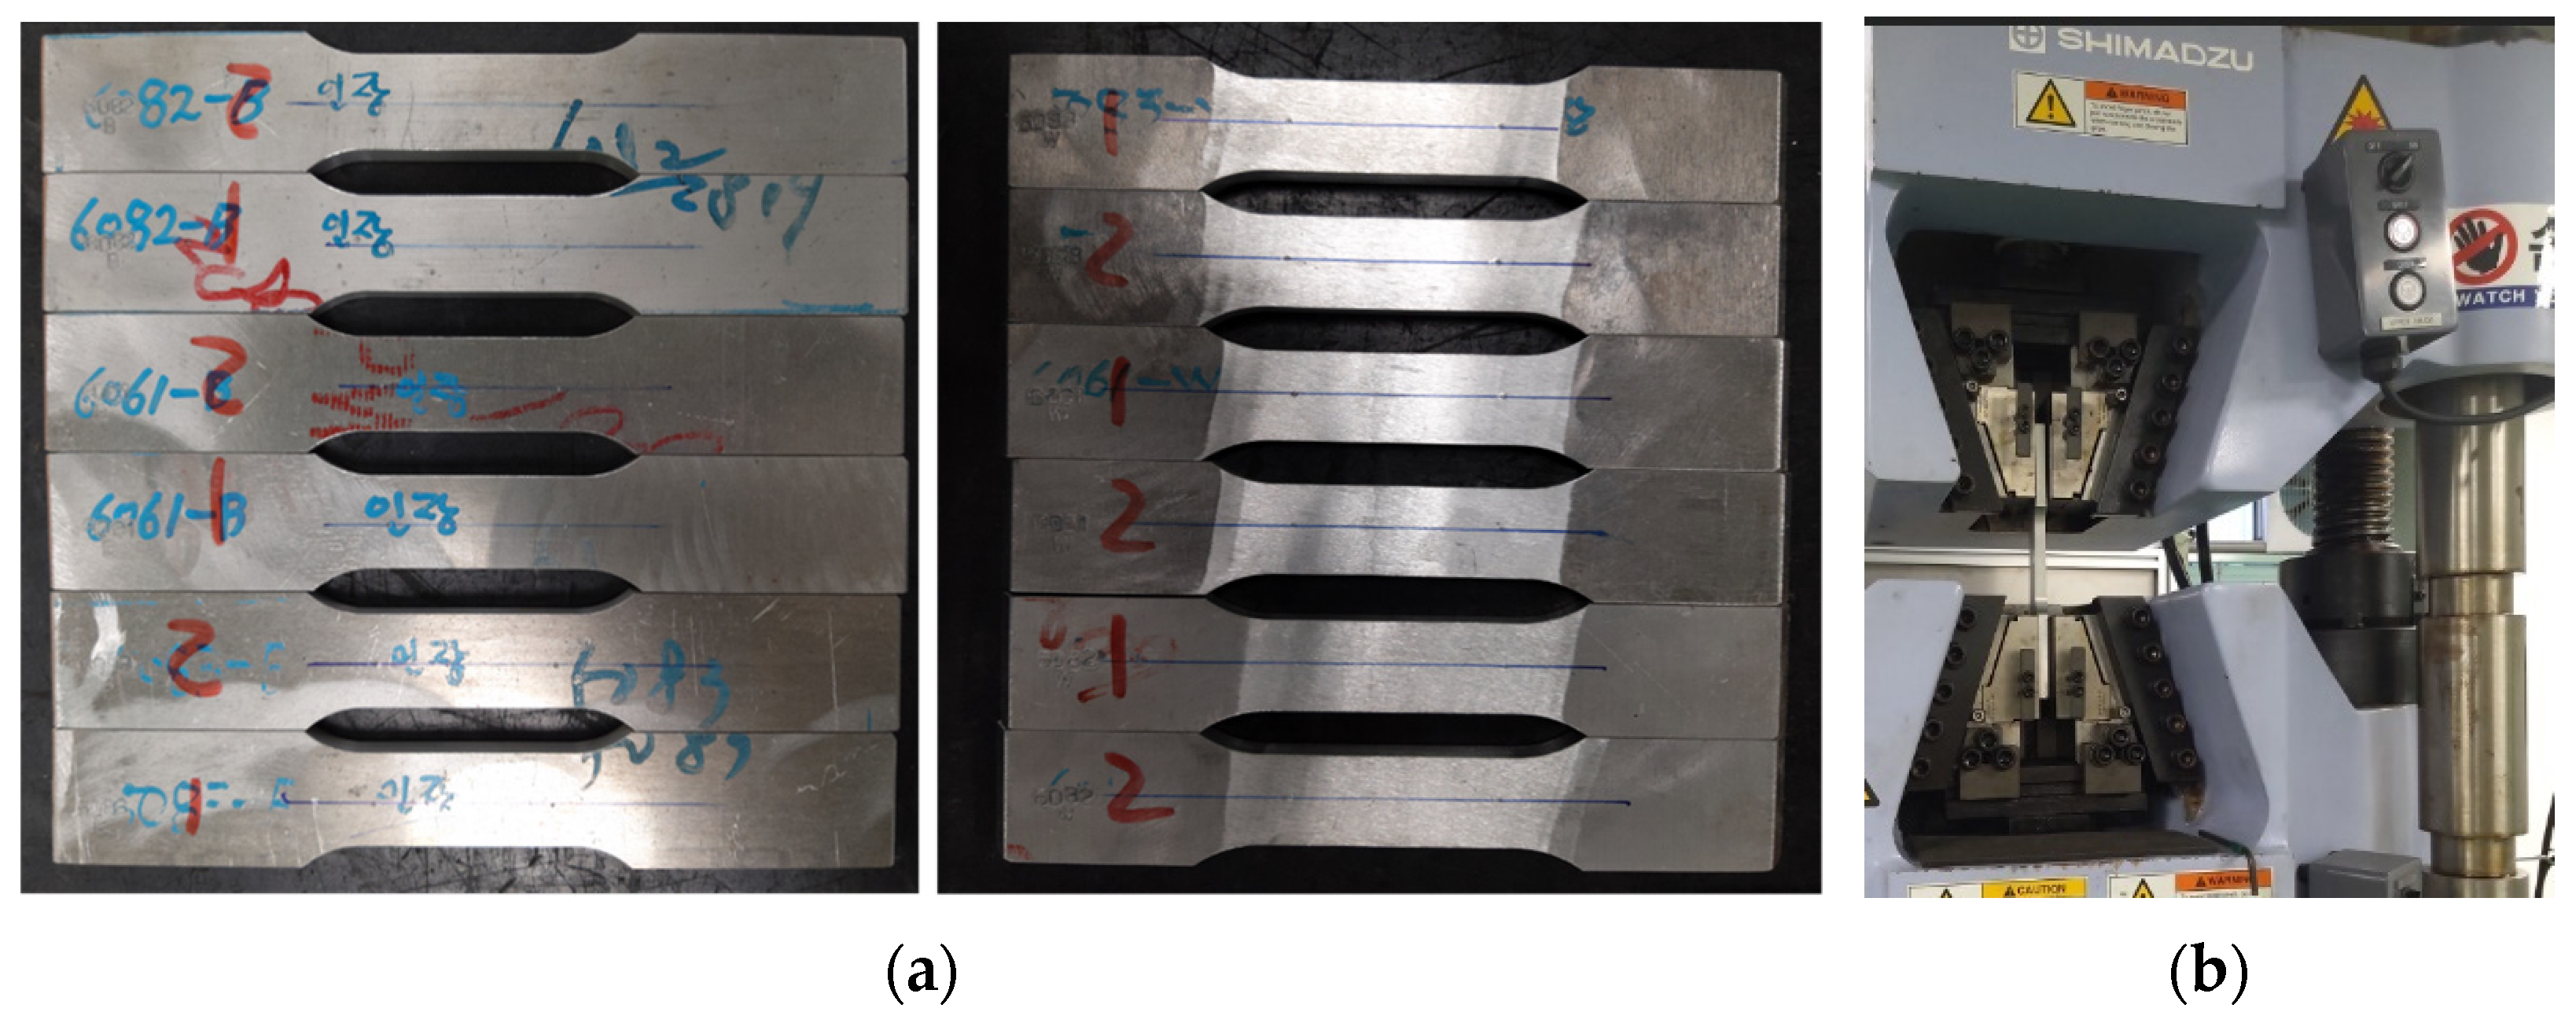
A tensile test was conducted using the tensile test specimen extracted in this way (Figure 6), with 50 mm gauge length and 25 mm width in accordance with ASTM code.
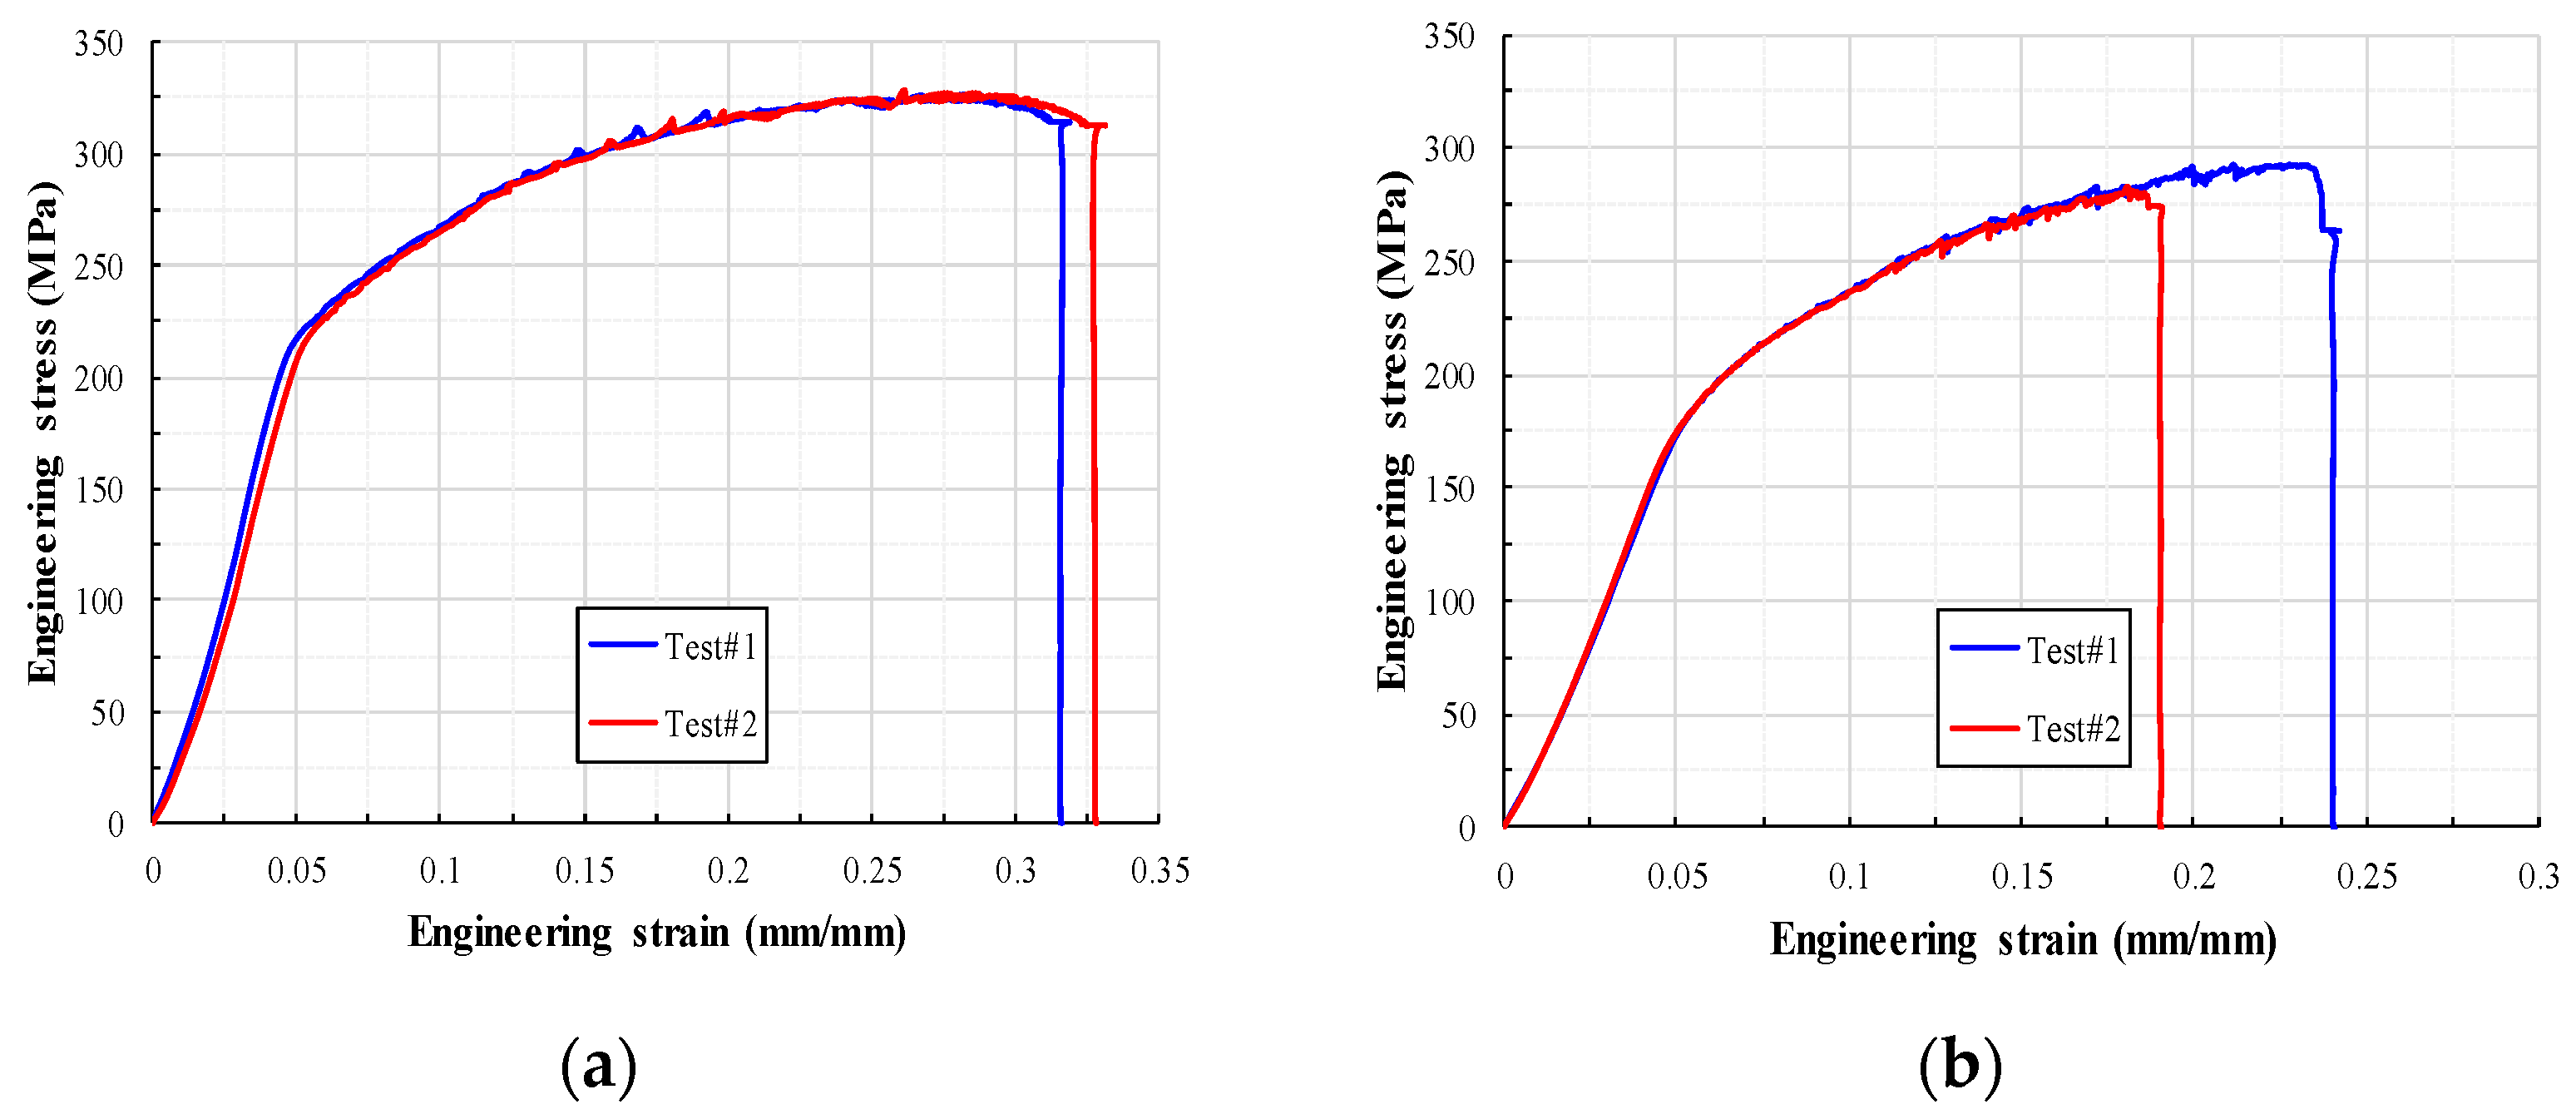
The final fractured specimens after tensile testing are shown in Figure 7. Figure 8 shows the tensile test results for each Al alloy. This is the result of each tensile test on the base metal and the welded part as described above. What is conspicuously confirmed is that the strength of the weld is lower than that of the base material, particularly for the 6000 series, because the weld is softened by the heat of the weld.
Table 8 shows the tensile test results, summarizing yield strength, tensile strength and strain at break.
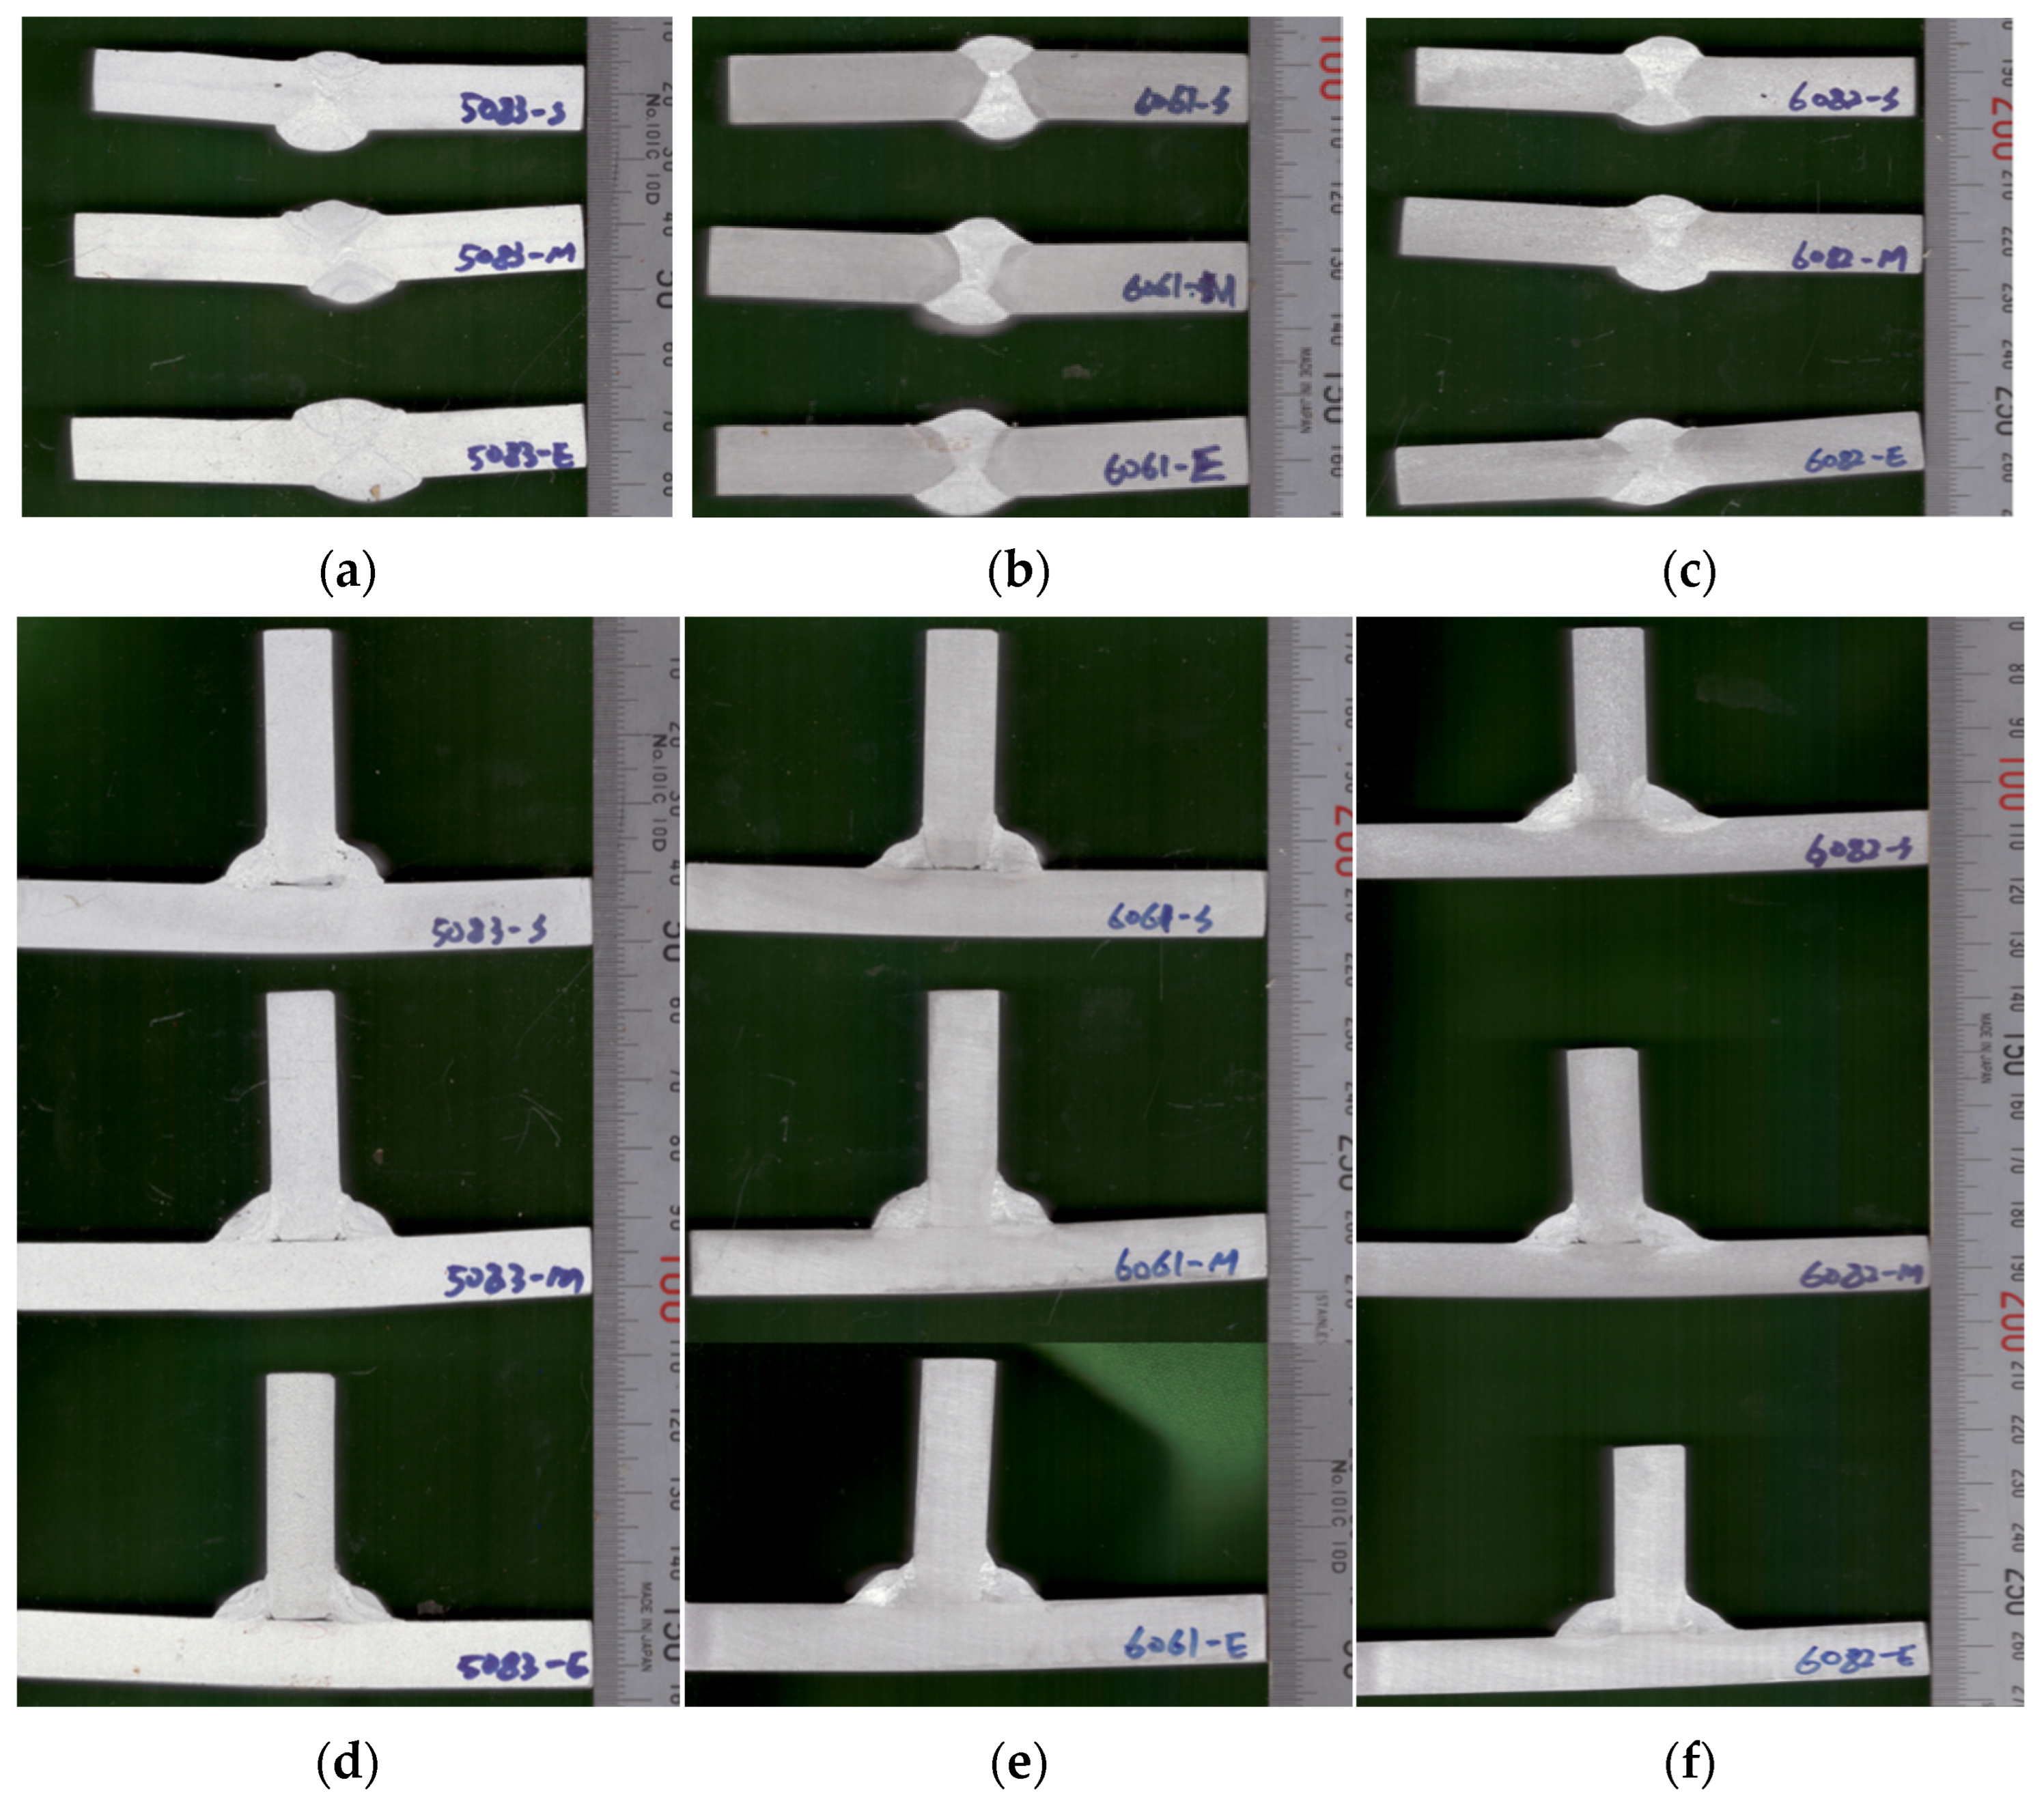
The macro section of the butt and fillet welds is shown in Figure 9. In both butt and fillet welds on the test specimens, no penetration defects or cracks were found, and uniform weld quality was observed.

3. FE Analysis and Verification of Weld-Induced Residual Stresses

3.1. Definition of GMAW Heat Source Model of Al Alloy

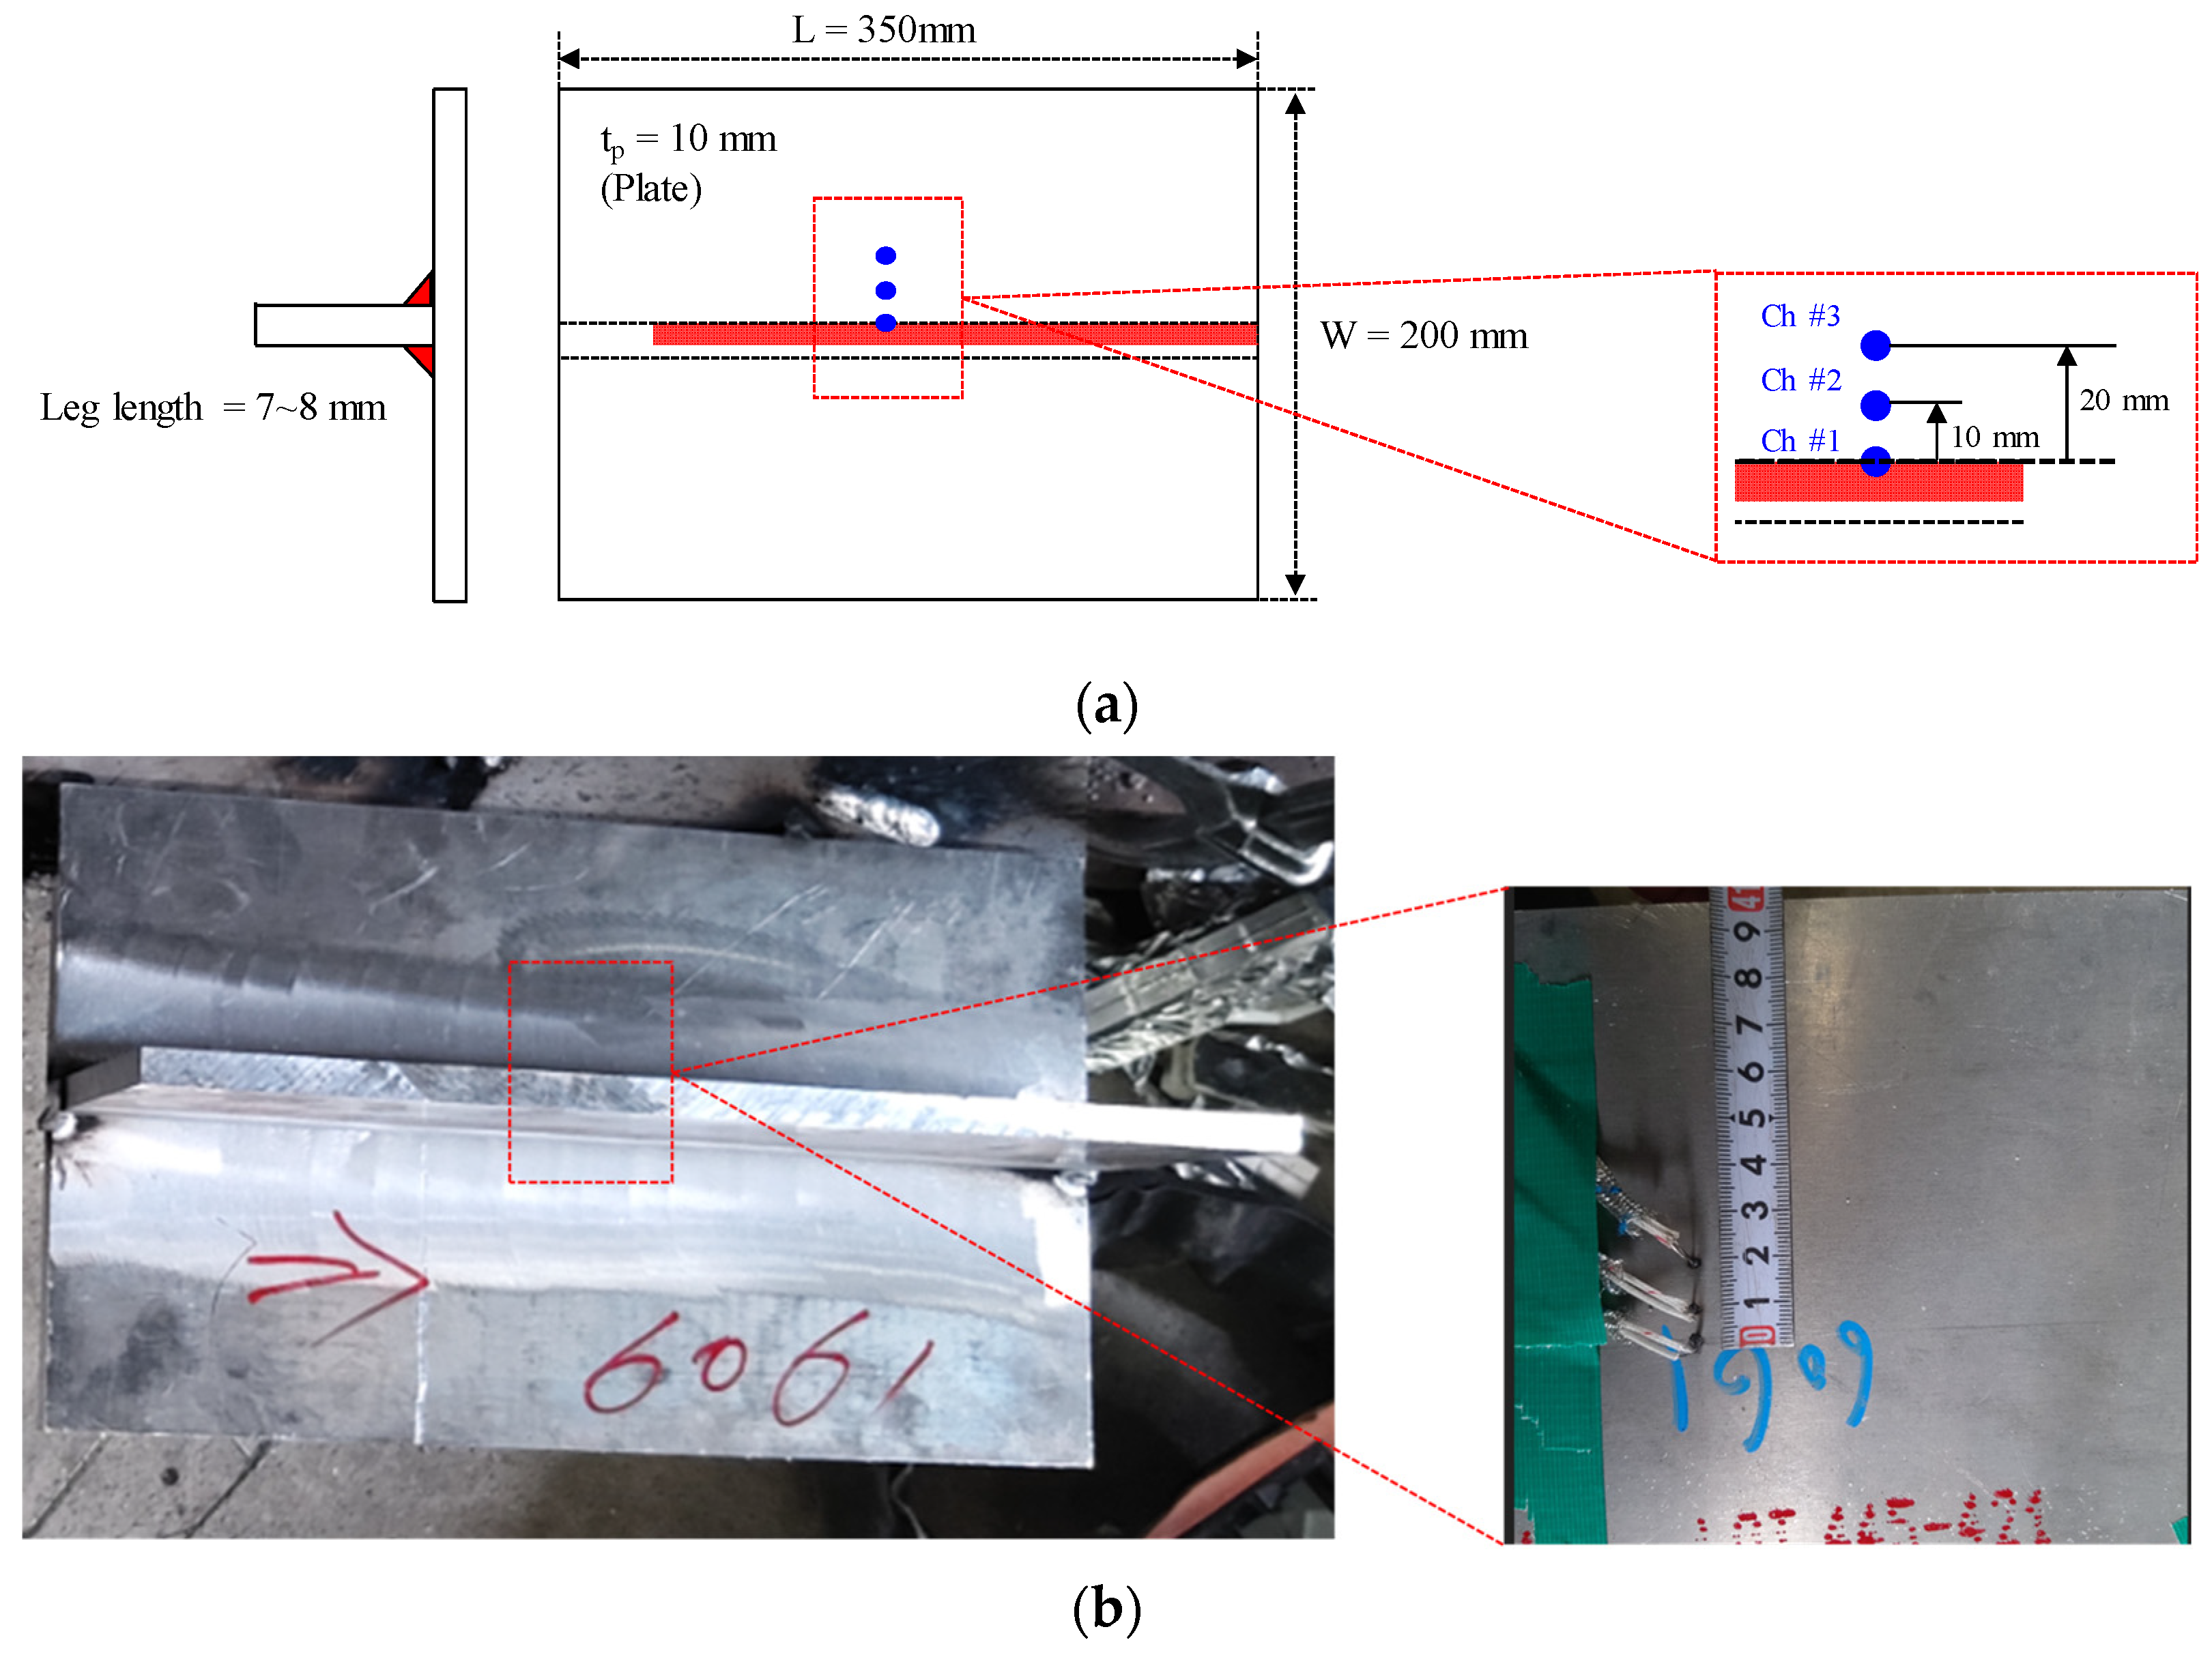
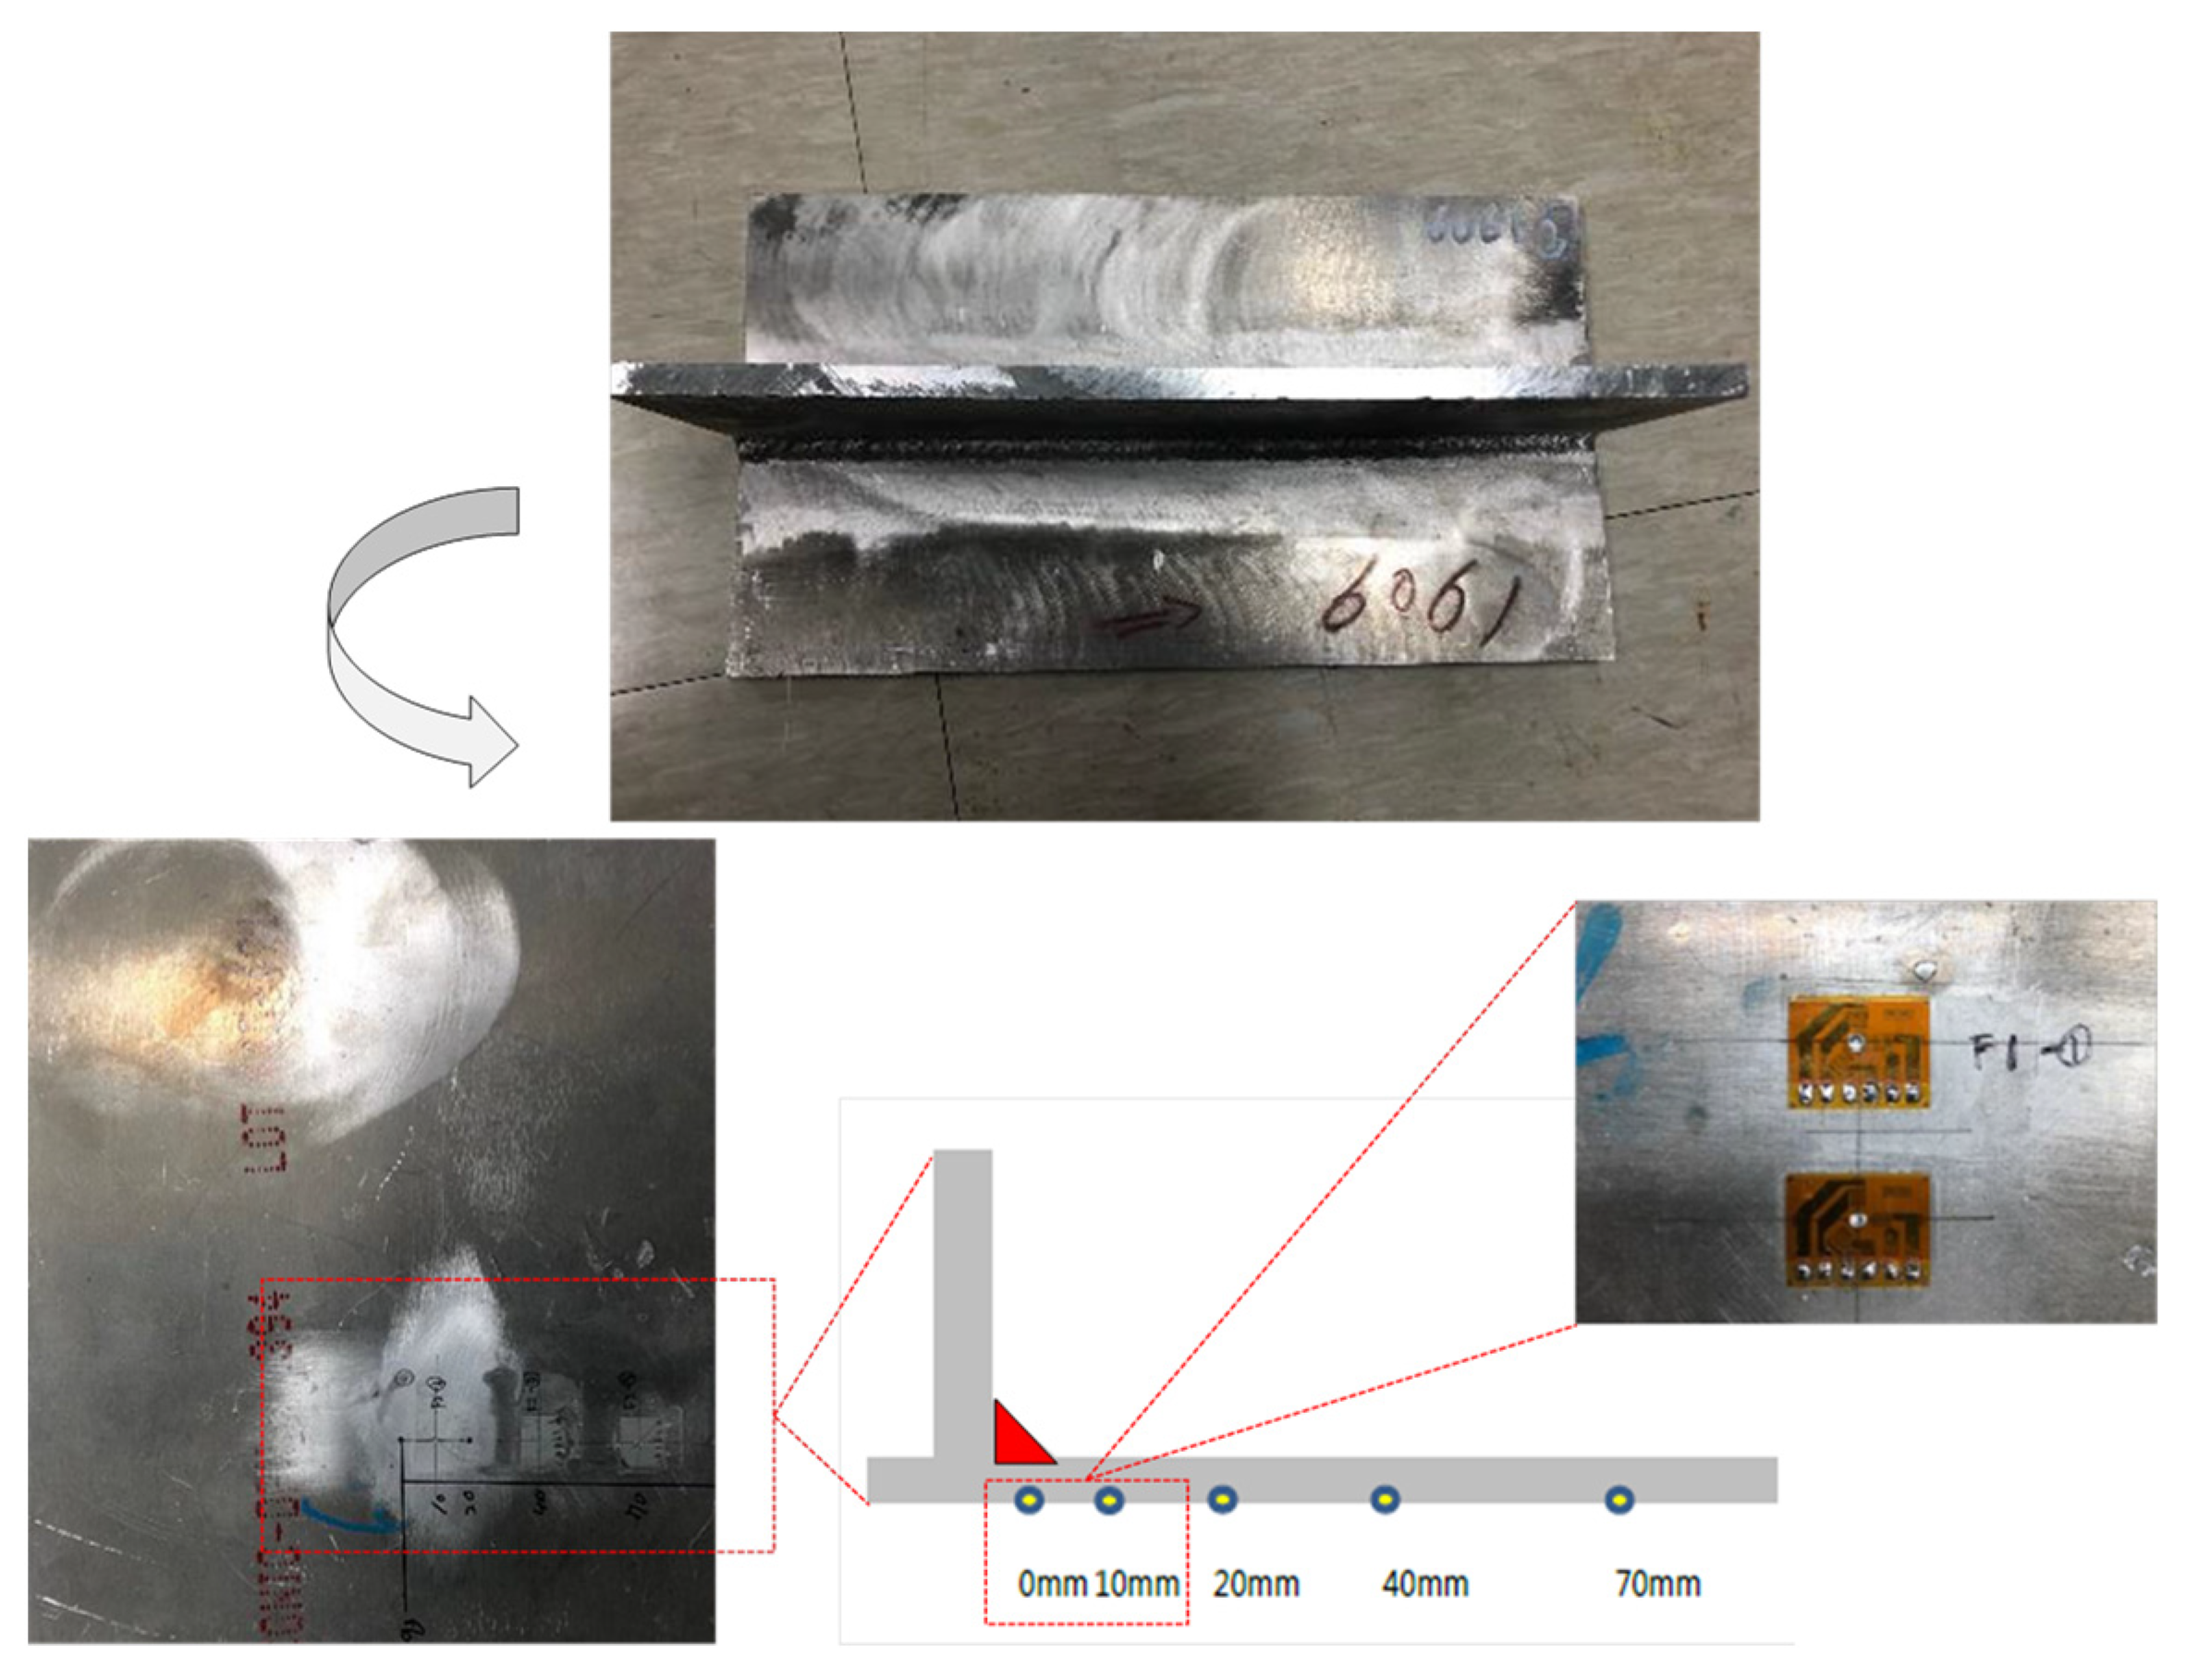
A precise heat source model must be defined to accurately predict the temperature distribution, HAZ and residual stress distribution occurring during welding of Al alloys. In this study, Goldak’s double ellipsoidal heat source model, which is a typical arc welding heat source model, was applied. In order to confirm the accuracy and precision of the finite element (FE) analysis applied in this study, a thermocouple (K-type for high temperature) was attached around the welding part during specimen testing and compared and verified with FE analysis. In addition, in order to determine the accuracy of the applied heat source distribution, the HAZ area through the macro section was compared and verified with FE analysis. Figure 10 shows the schematic diagram for attaching the thermocouple and the actual attachment.
FE analysis was used to predict the temperature distribution and residual stress of the specimen by welding. The FE analysis method used in this study is a 3-dimensional thermo–elastic–plastic mechanical analysis. The method was used to verify the temperature distribution, and in particular, to confirm whether the proposed heat source model was valid through the thermal history at the location of the thermocouple.
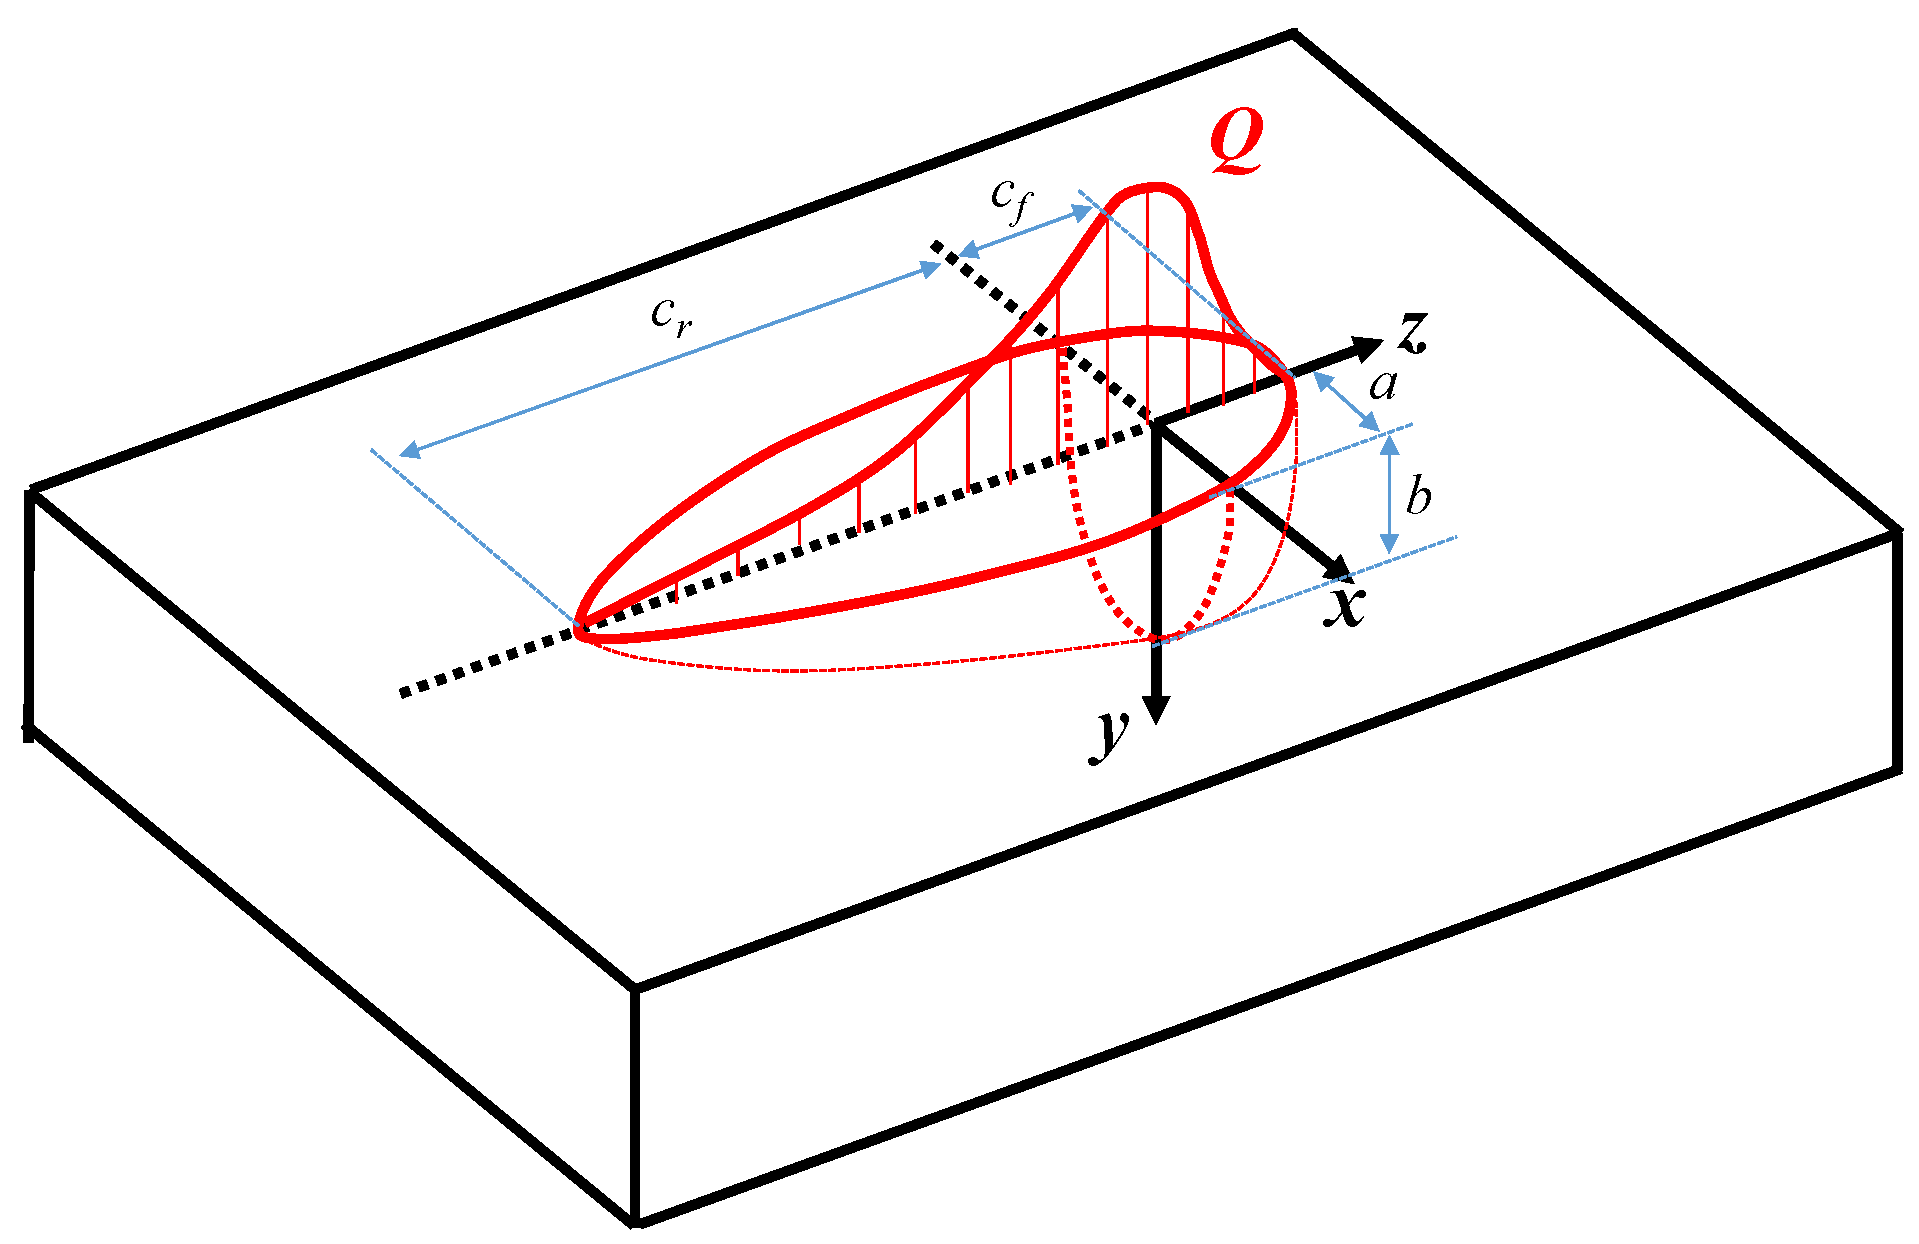
Since mathematical modeling of the welding heat input parameters is a key factor in defining the heat source model, the setting of these parameters is an important factor influencing FE analysis accuracy. As mentioned above, the heat source model used in this study is Goldak’s double ellipsoidal model, which has been widely verified. Figure 11 below is an overall view of the heat source model used.
Figure 11 presents the configuration of the heat source distribution with a double ellipsoidal shape. The heat flux for the first half-ellipsoidal internal area located at the front of the welding arc can then be defined as follows:
q f ( x , y , z ) = 6 3 f f Q a b c f π π exp ( 3 x 2 a 2 ) exp ( 3 y 2 b 2 ) exp ( 3 z 2 c f 2 ) at   z 0
where
q f ( x , y , z ) : the heat flux for the first half-ellipsoidal internal area located at the front of the welding arc
f f : the heat input proportion in the front part
Q : the heat flux of the arc, which is taken as Q = η I U , a ,   b and c f are geometric parameters, η is the arc efficiency, I is the current and U is the voltage. x ,   y and z are the coordinate where the origin is located on the weld surface below the heat source, as shown in Figure 11.
The heat flux at any point ( x , y , z ) in the second semi-ellipsoid covering the rear part of the arc can be defined as follows:
q r ( x , y , z ) = 6 3 f r Q a b c r π π exp ( 3 x 2 a 2 ) exp ( 3 y 2 b 2 ) exp ( 3 z 2 c r 2 ) at   z < 0
where
q r ( x , y , z ) : the heat flux at any point ( x , y , z ) in the second semi-ellipsoid covering the rear part of the arc
c r : the geometric parameter
f r : the heat input proportion in the rear part
It is realized that f f + f r = 2 can be approximated as long as the following conditions are satisfied:
f f = 2 ( 1 + c r / c f ) , f r = 2 ( 1 + c f / c r )
In this study, the main parameters of Goldak’s double ellipsoidal model, a welding heat input model, were performed using the values in Table 9. Here, the important parameters of the welding heat source model were determined by the results of previous papers [30] and empirical methods (comparison between welding backside temperature history and HAZ shape, detailed description is explained in the next paragraph).
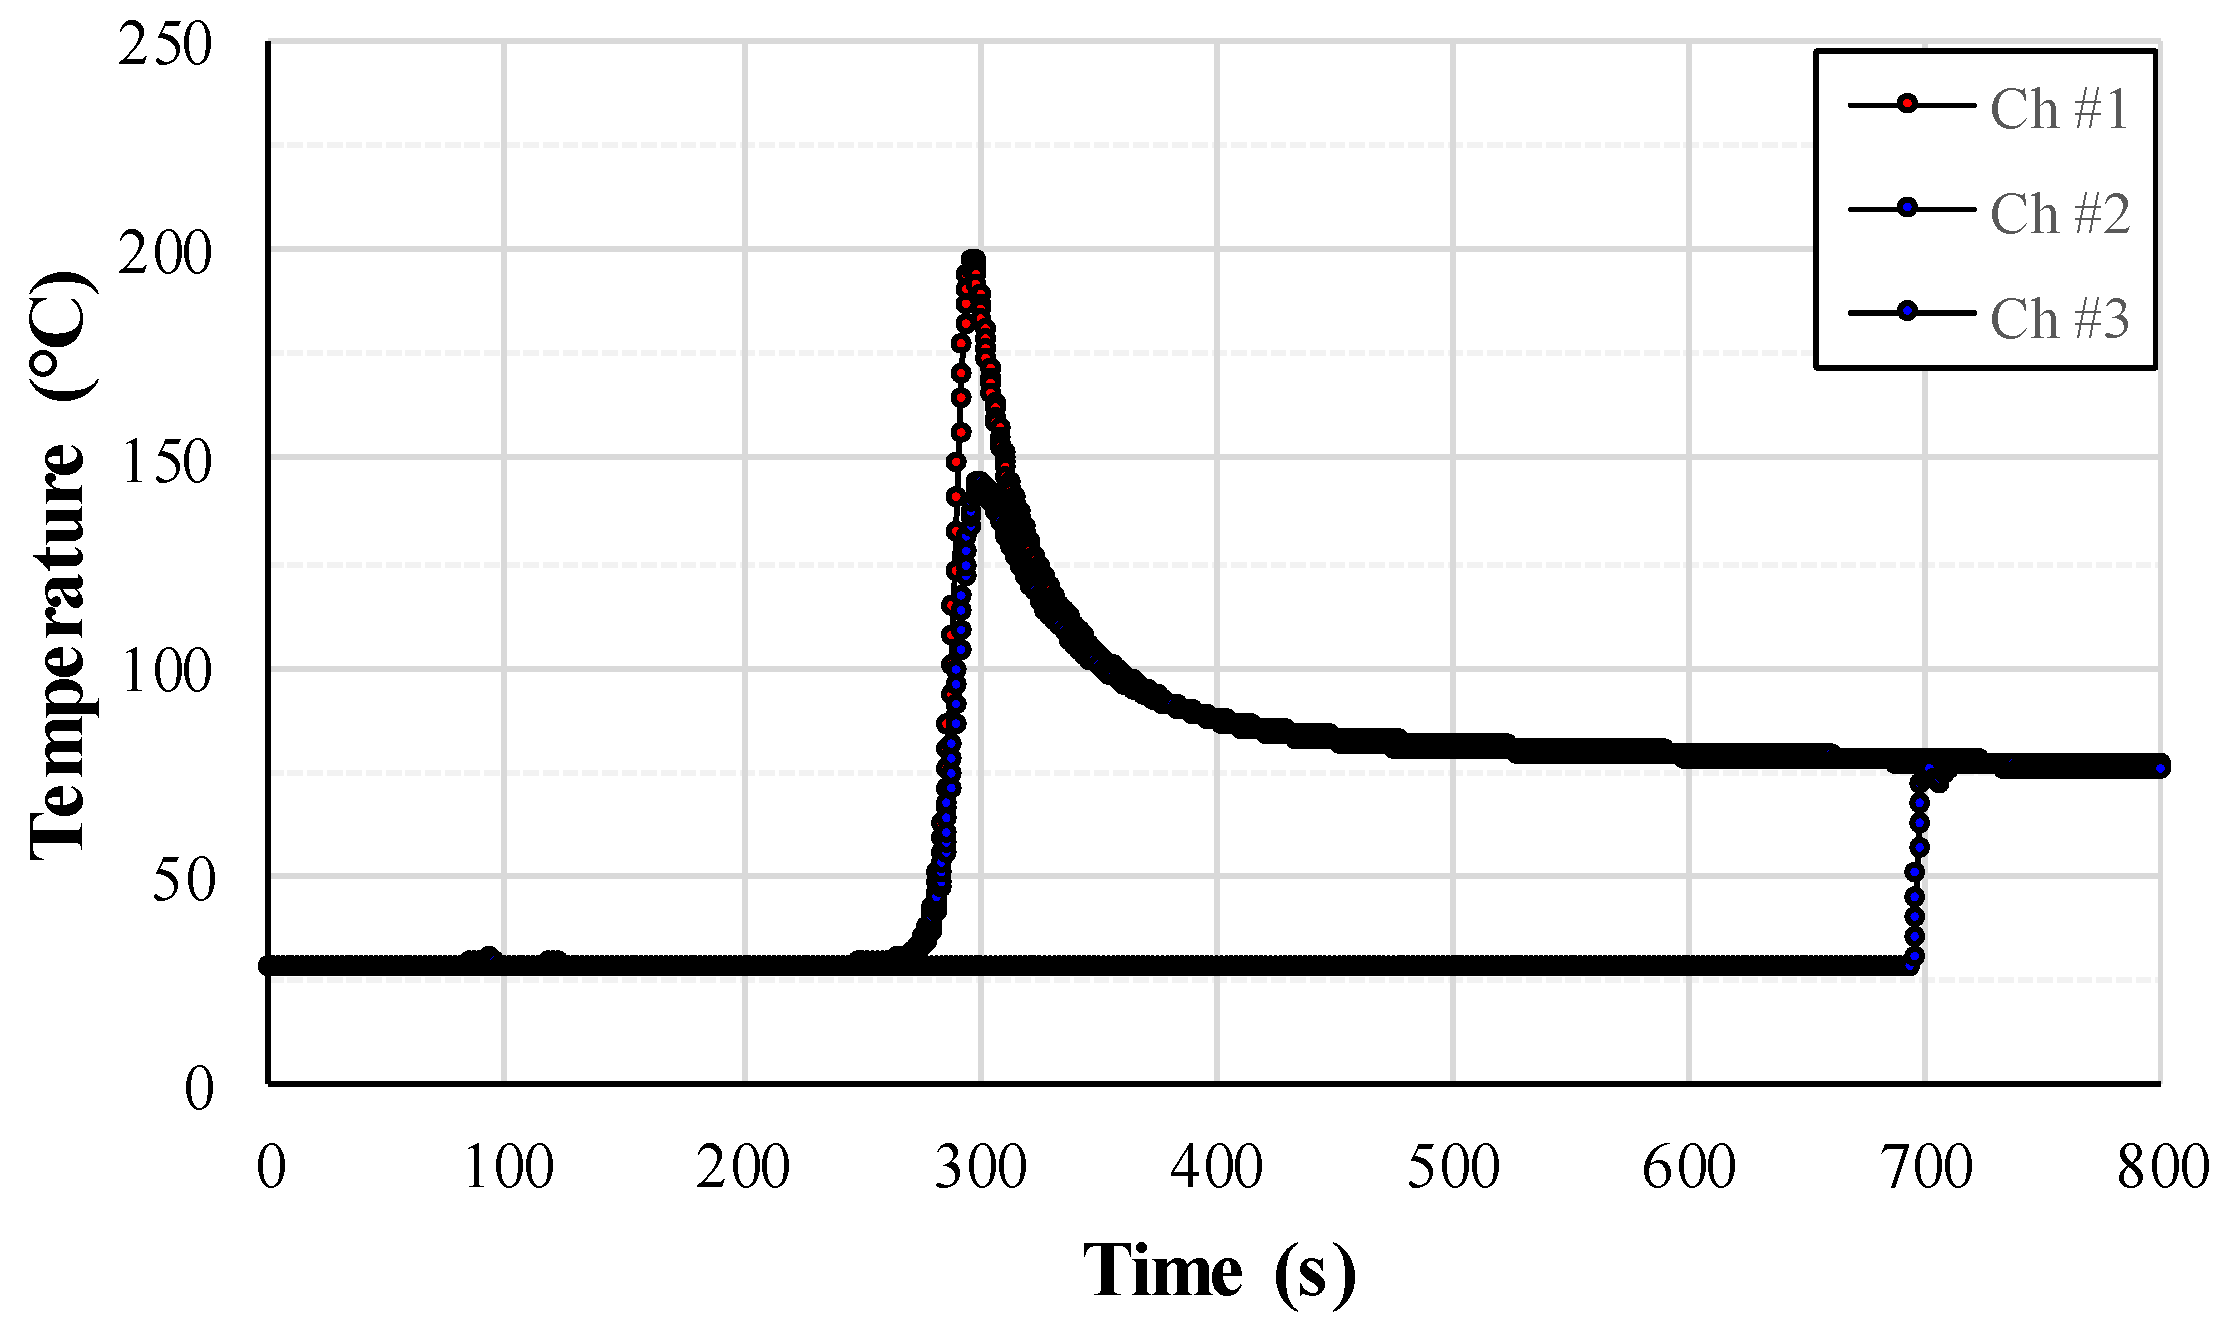
Figure 12 shows the temperature history during welding of the representative Al 6061 T6 fillet. It shows the actual experimental result shown in Figure 10, and the short circuit of the third thermocouple can be conspicuously identified (this is a state in which normal data cannot be obtained because the thermocouple is short-circuited due to high heat during welding, and it is a common experimental error). The experimental result guarantees the accuracy, as the temperature history deviation according to the welding distance is clearly found.
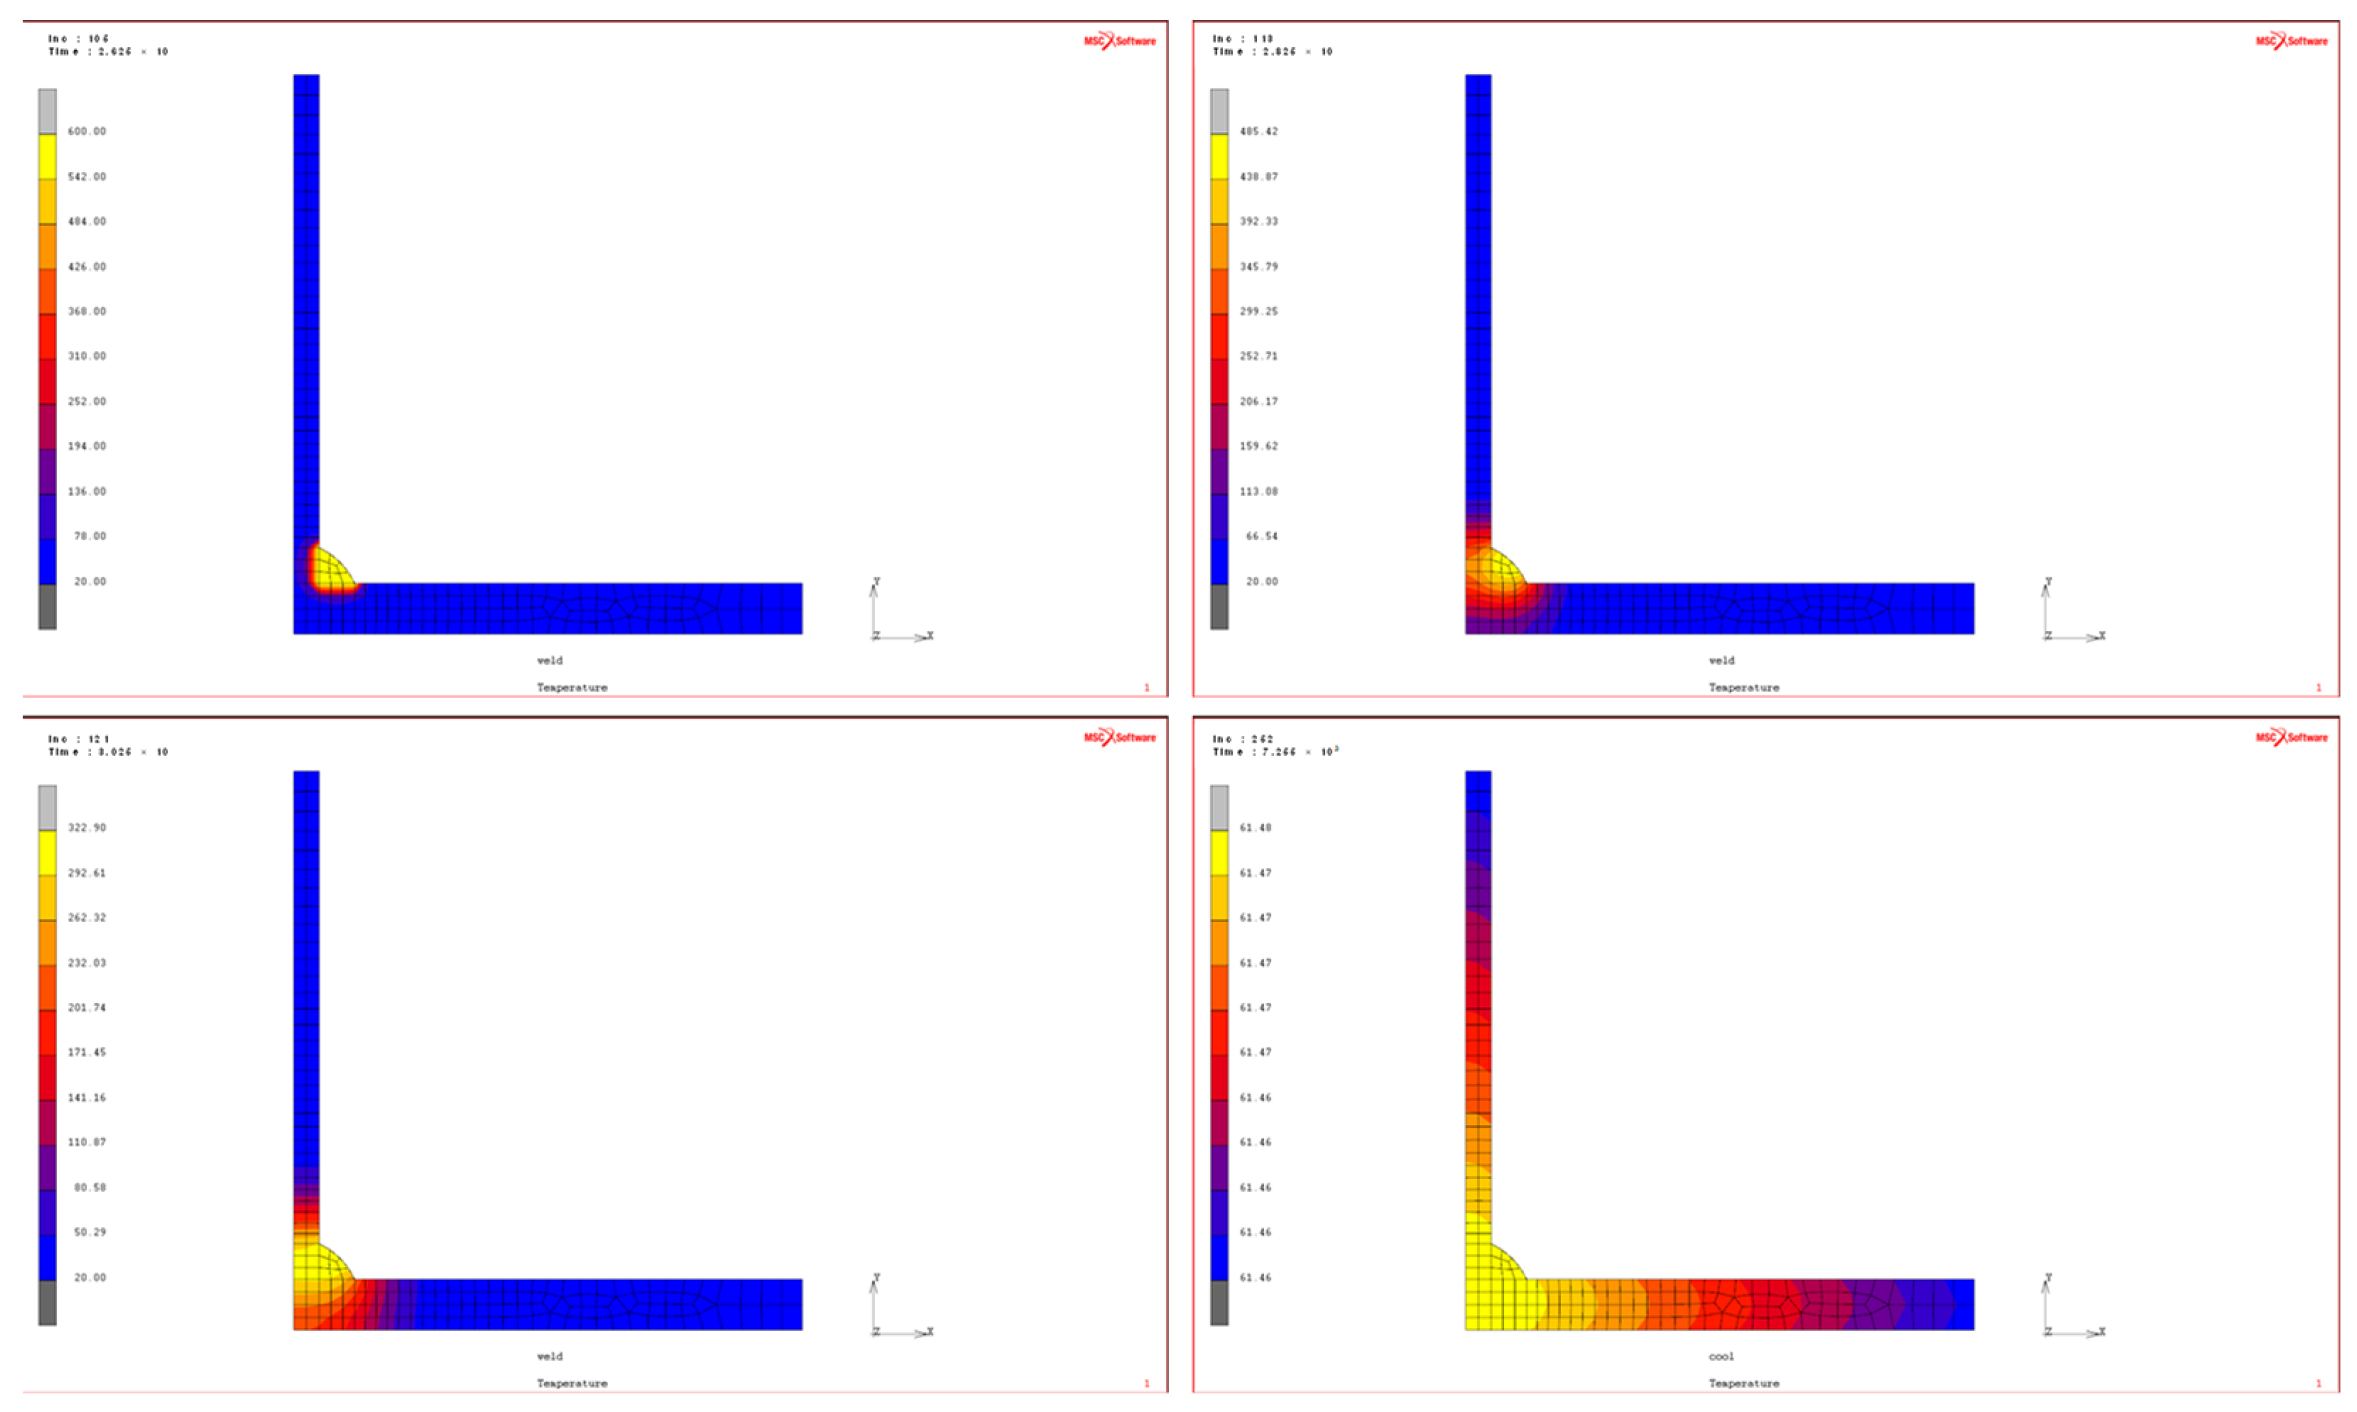
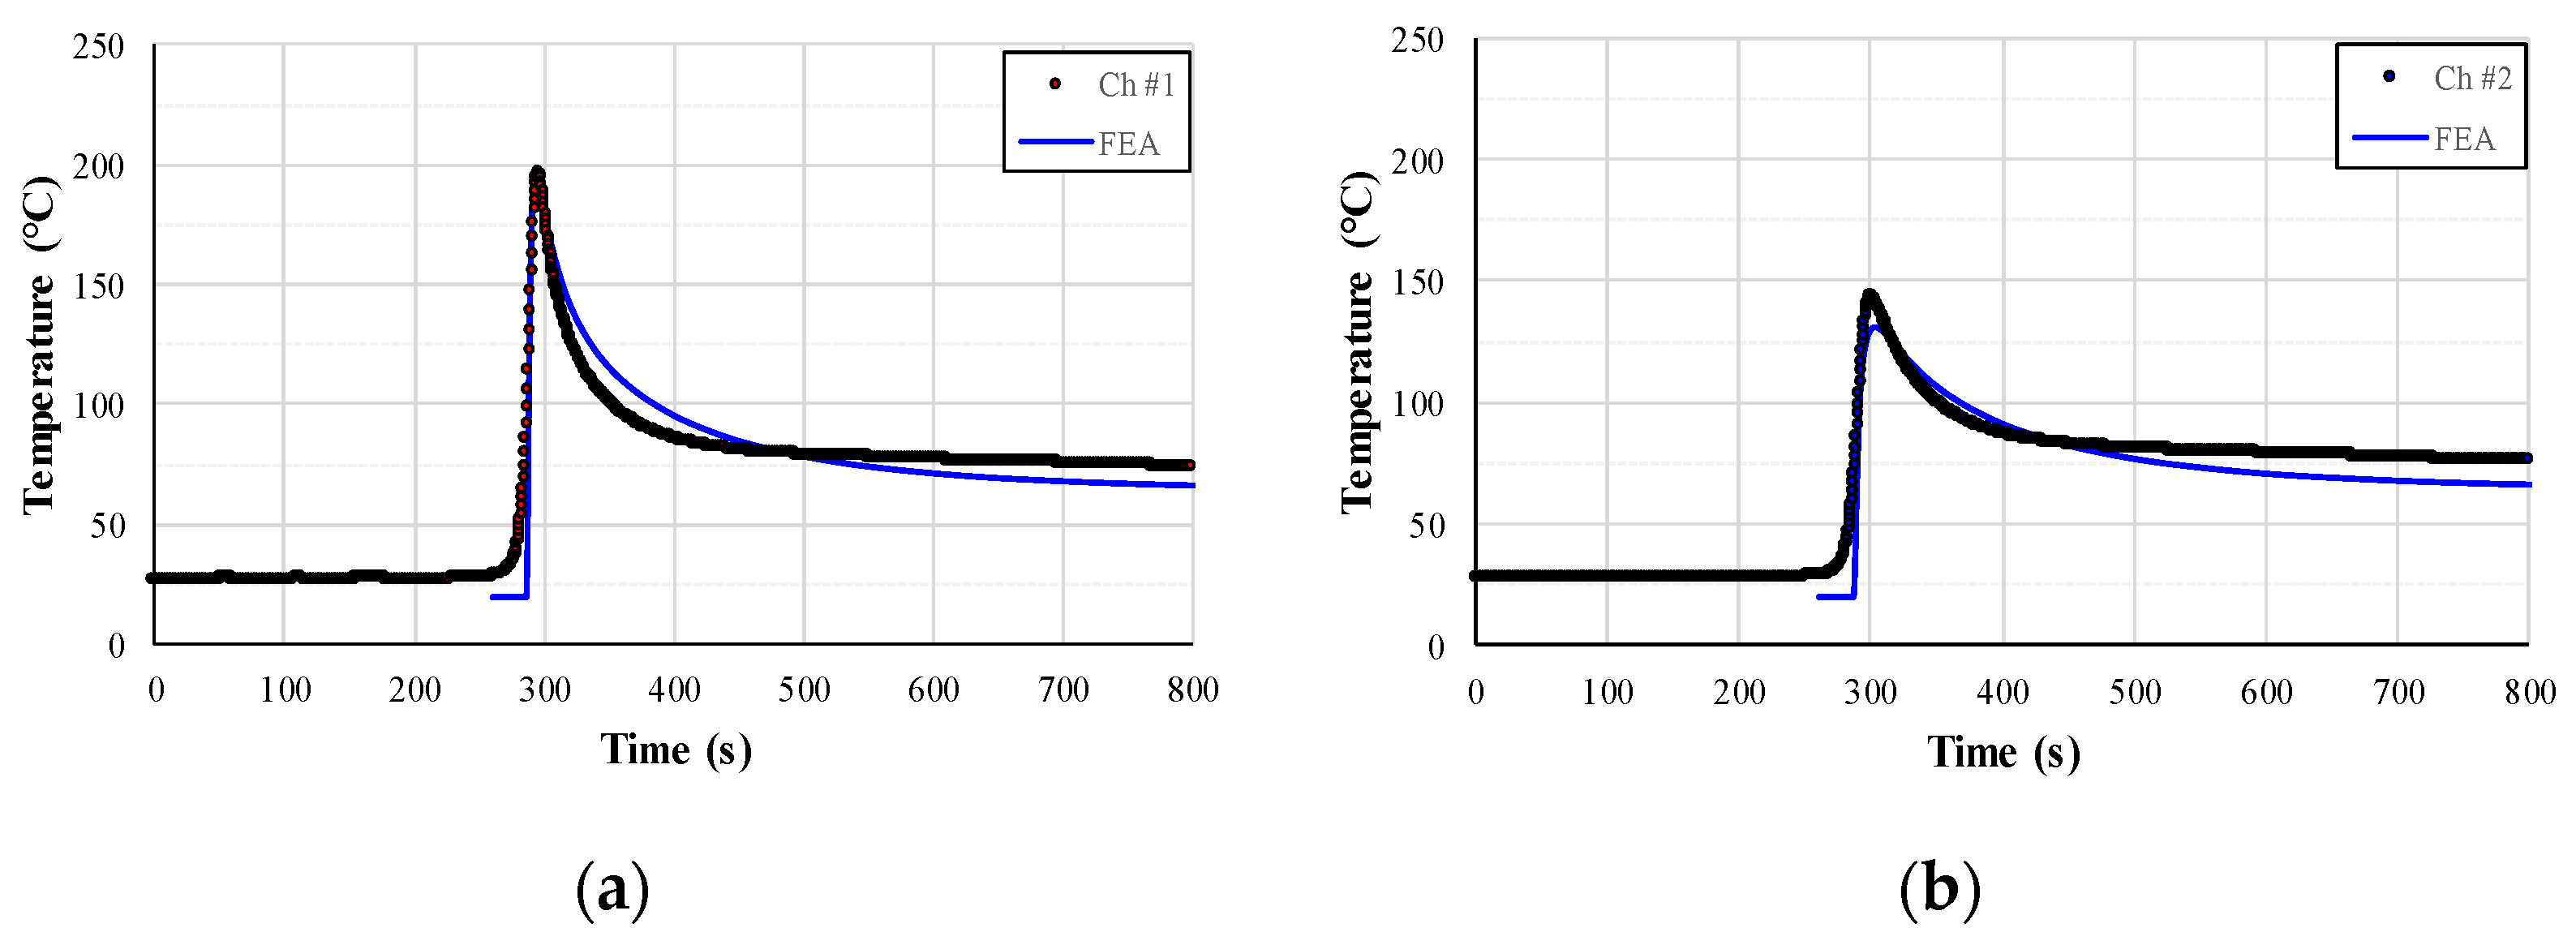
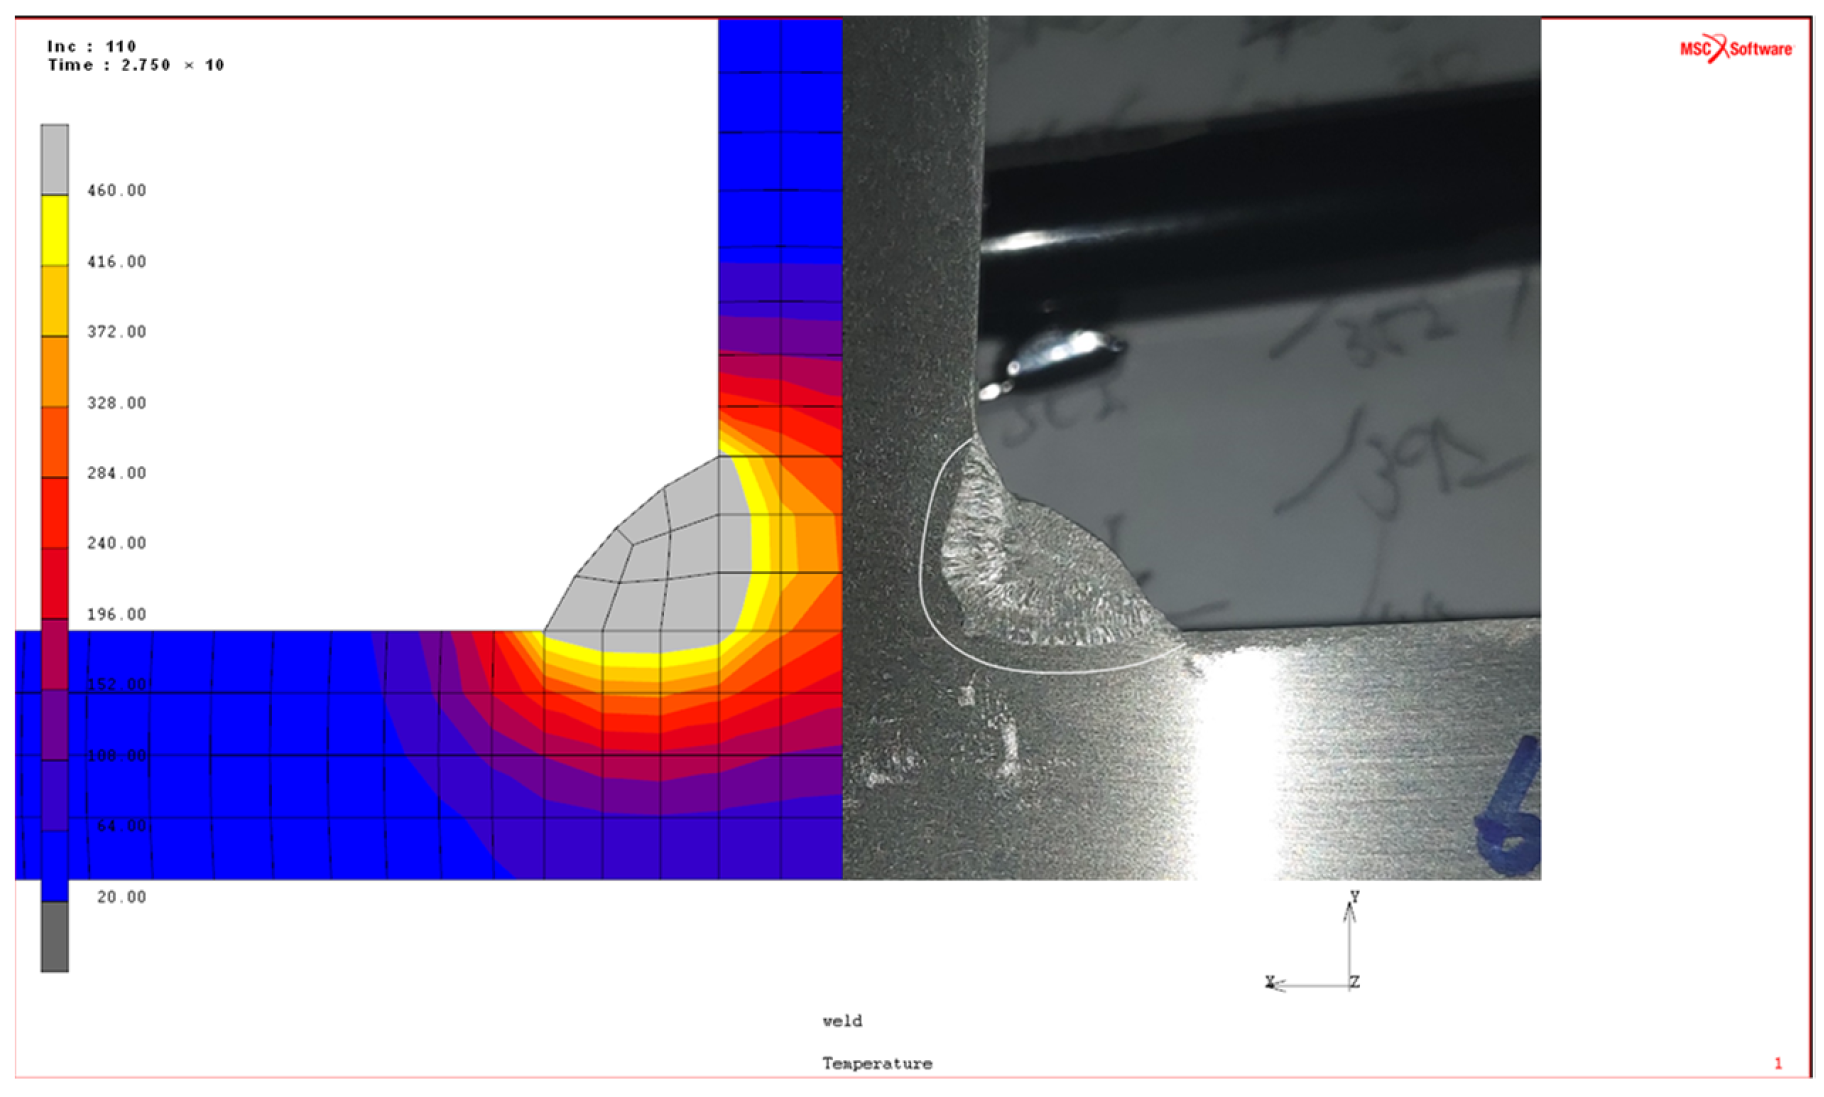
Figure 13 shows the heat transfer through 3D thermo–elasto–plastic FE analysis. At around 600 °C (the melting temperature of the Al alloy) a welding material is generated by arcing, and heat conduction is shown. Further, Figure 14 shows the results of comparison and verification of the experiment based on the analysis results.
From these results, the proposed heat source model is confirmed to be valid due to the consistency between the maximum temperature by welding and the similarity of the cooling rate after welding.
In addition to verifying the accuracy of the heat source model through the temperature history, comparison and verification through the HAZ area during Al alloy welding were also performed. According to the related literature [31], the HAZ temperature range of the Al alloy is known to be about 460 °C.
Figure 15 shows the comparison between the thermal analysis model and the actual HAZ through the macro section. As can be seen, the validity of the proposed GMAW of Al alloy welding-heat-source model was confirmed through HAZ region comparison.

3.2. FE Analysis of Welding-Induced Residual Stress

Residual stress is inevitably generated during structural welding due to periphery restraint, thermal expansion and contraction, elastic/plastic deformation and material phase transformation. Several methods are used to measure welding-induced residual stresses. In this study, the hole drilling method, which is a destructive residual stress measurement method, was used. The measured residual stress values were compared and verified with the precise thermo–elastic–plastic FE analysis proposed in this study.
As mentioned above, the FE analysis method used in this study is a 3D thermo–elastic–plastic mechanical analysis. Welding is a very complex physical phenomenon, and knowledge of materials, heat transfer and solid mechanics must be combined and analyzed. In particular, all material properties should use a temperature-dependent value. This is because welding occurs from room temperature to the melting point of the metal, and the physical properties change for each temperature, and expansion/shrinkage of the metal occurs, thereby generating residual stress (see Figure 16 for details). Therefore, in the analysis of this study, the temperature-dependent values for both the thermal and mechanical properties of the Al alloys were used. Table 10 summarizes the temperature-dependent thermal and mechanical properties [32]. Further, the FE analysis program used was MSC/MARC, a commercial tool for nonlinear finite element analysis.
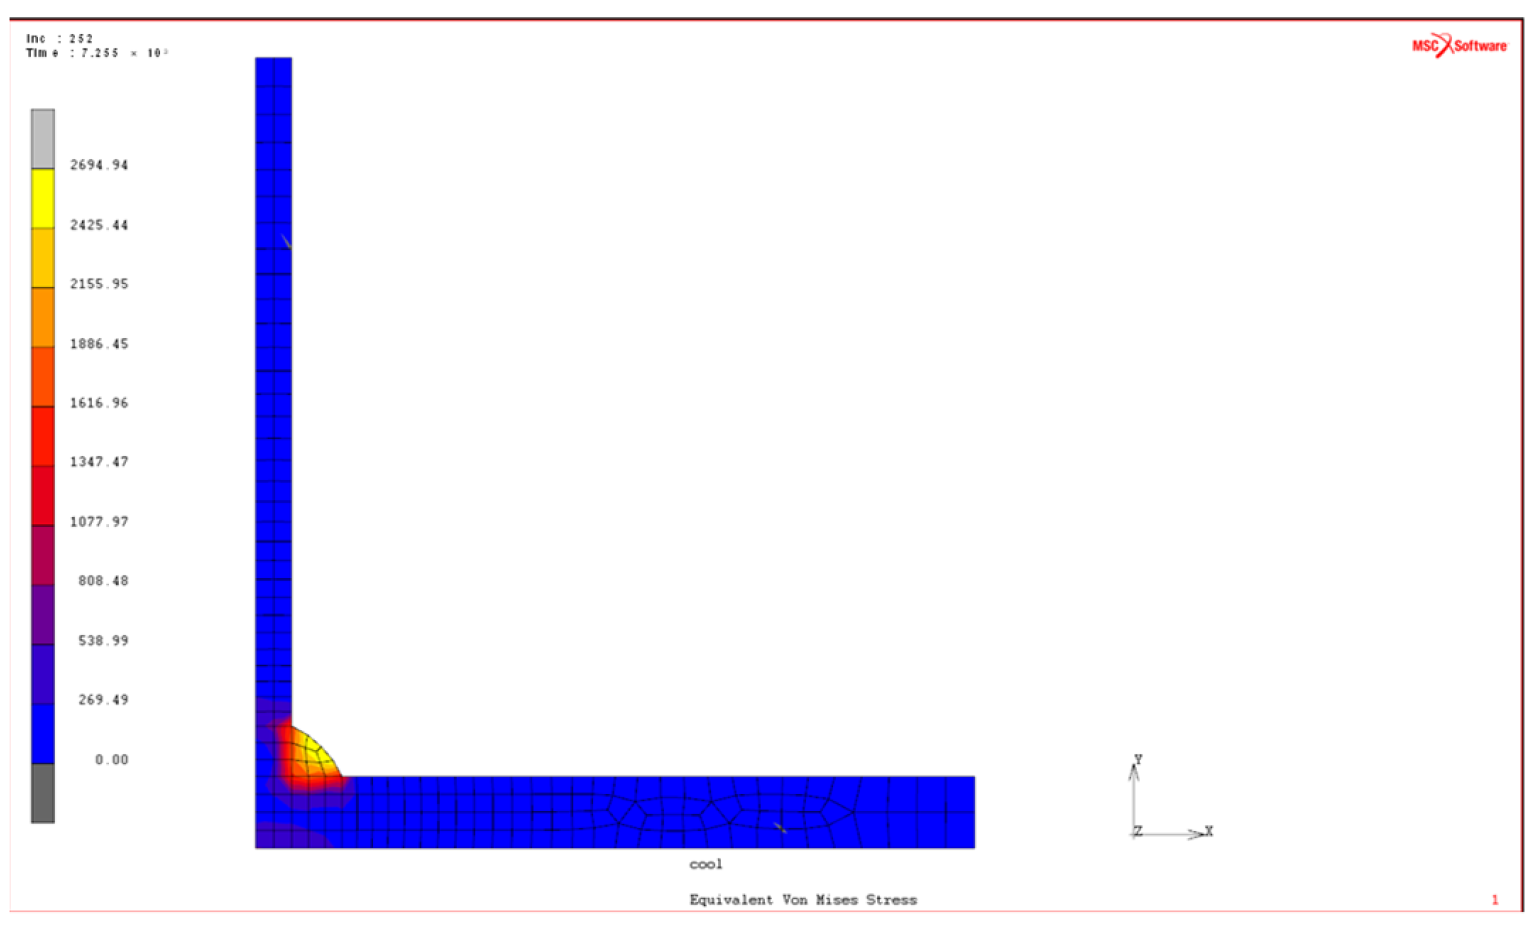
Figure 17 is the equivalent von Mises stress distribution of Al 6061 T6 in the final state after the proposed FE analysis.
In this study, the hole drilling method was used to measure the welding-induced residual stress. This is a method of measuring the residual stress with the strain value that is relaxed when a strain gauge is attached to the point to be measured and a hole is drilled.
The measurement position is the opposite side of the fillet weld (the reason for measuring the opposite side is to avoid interference between instrumentation and the weld, and the welding residual stress pattern is known to be almost identical if the material is thin). This experiment was conducted based on ASTM E837 and E251. Figure 18 shows the details of the specimen (Al 6061 T6) measured for welding-induced residual stress, with the measurement location and the strain gauge attached.
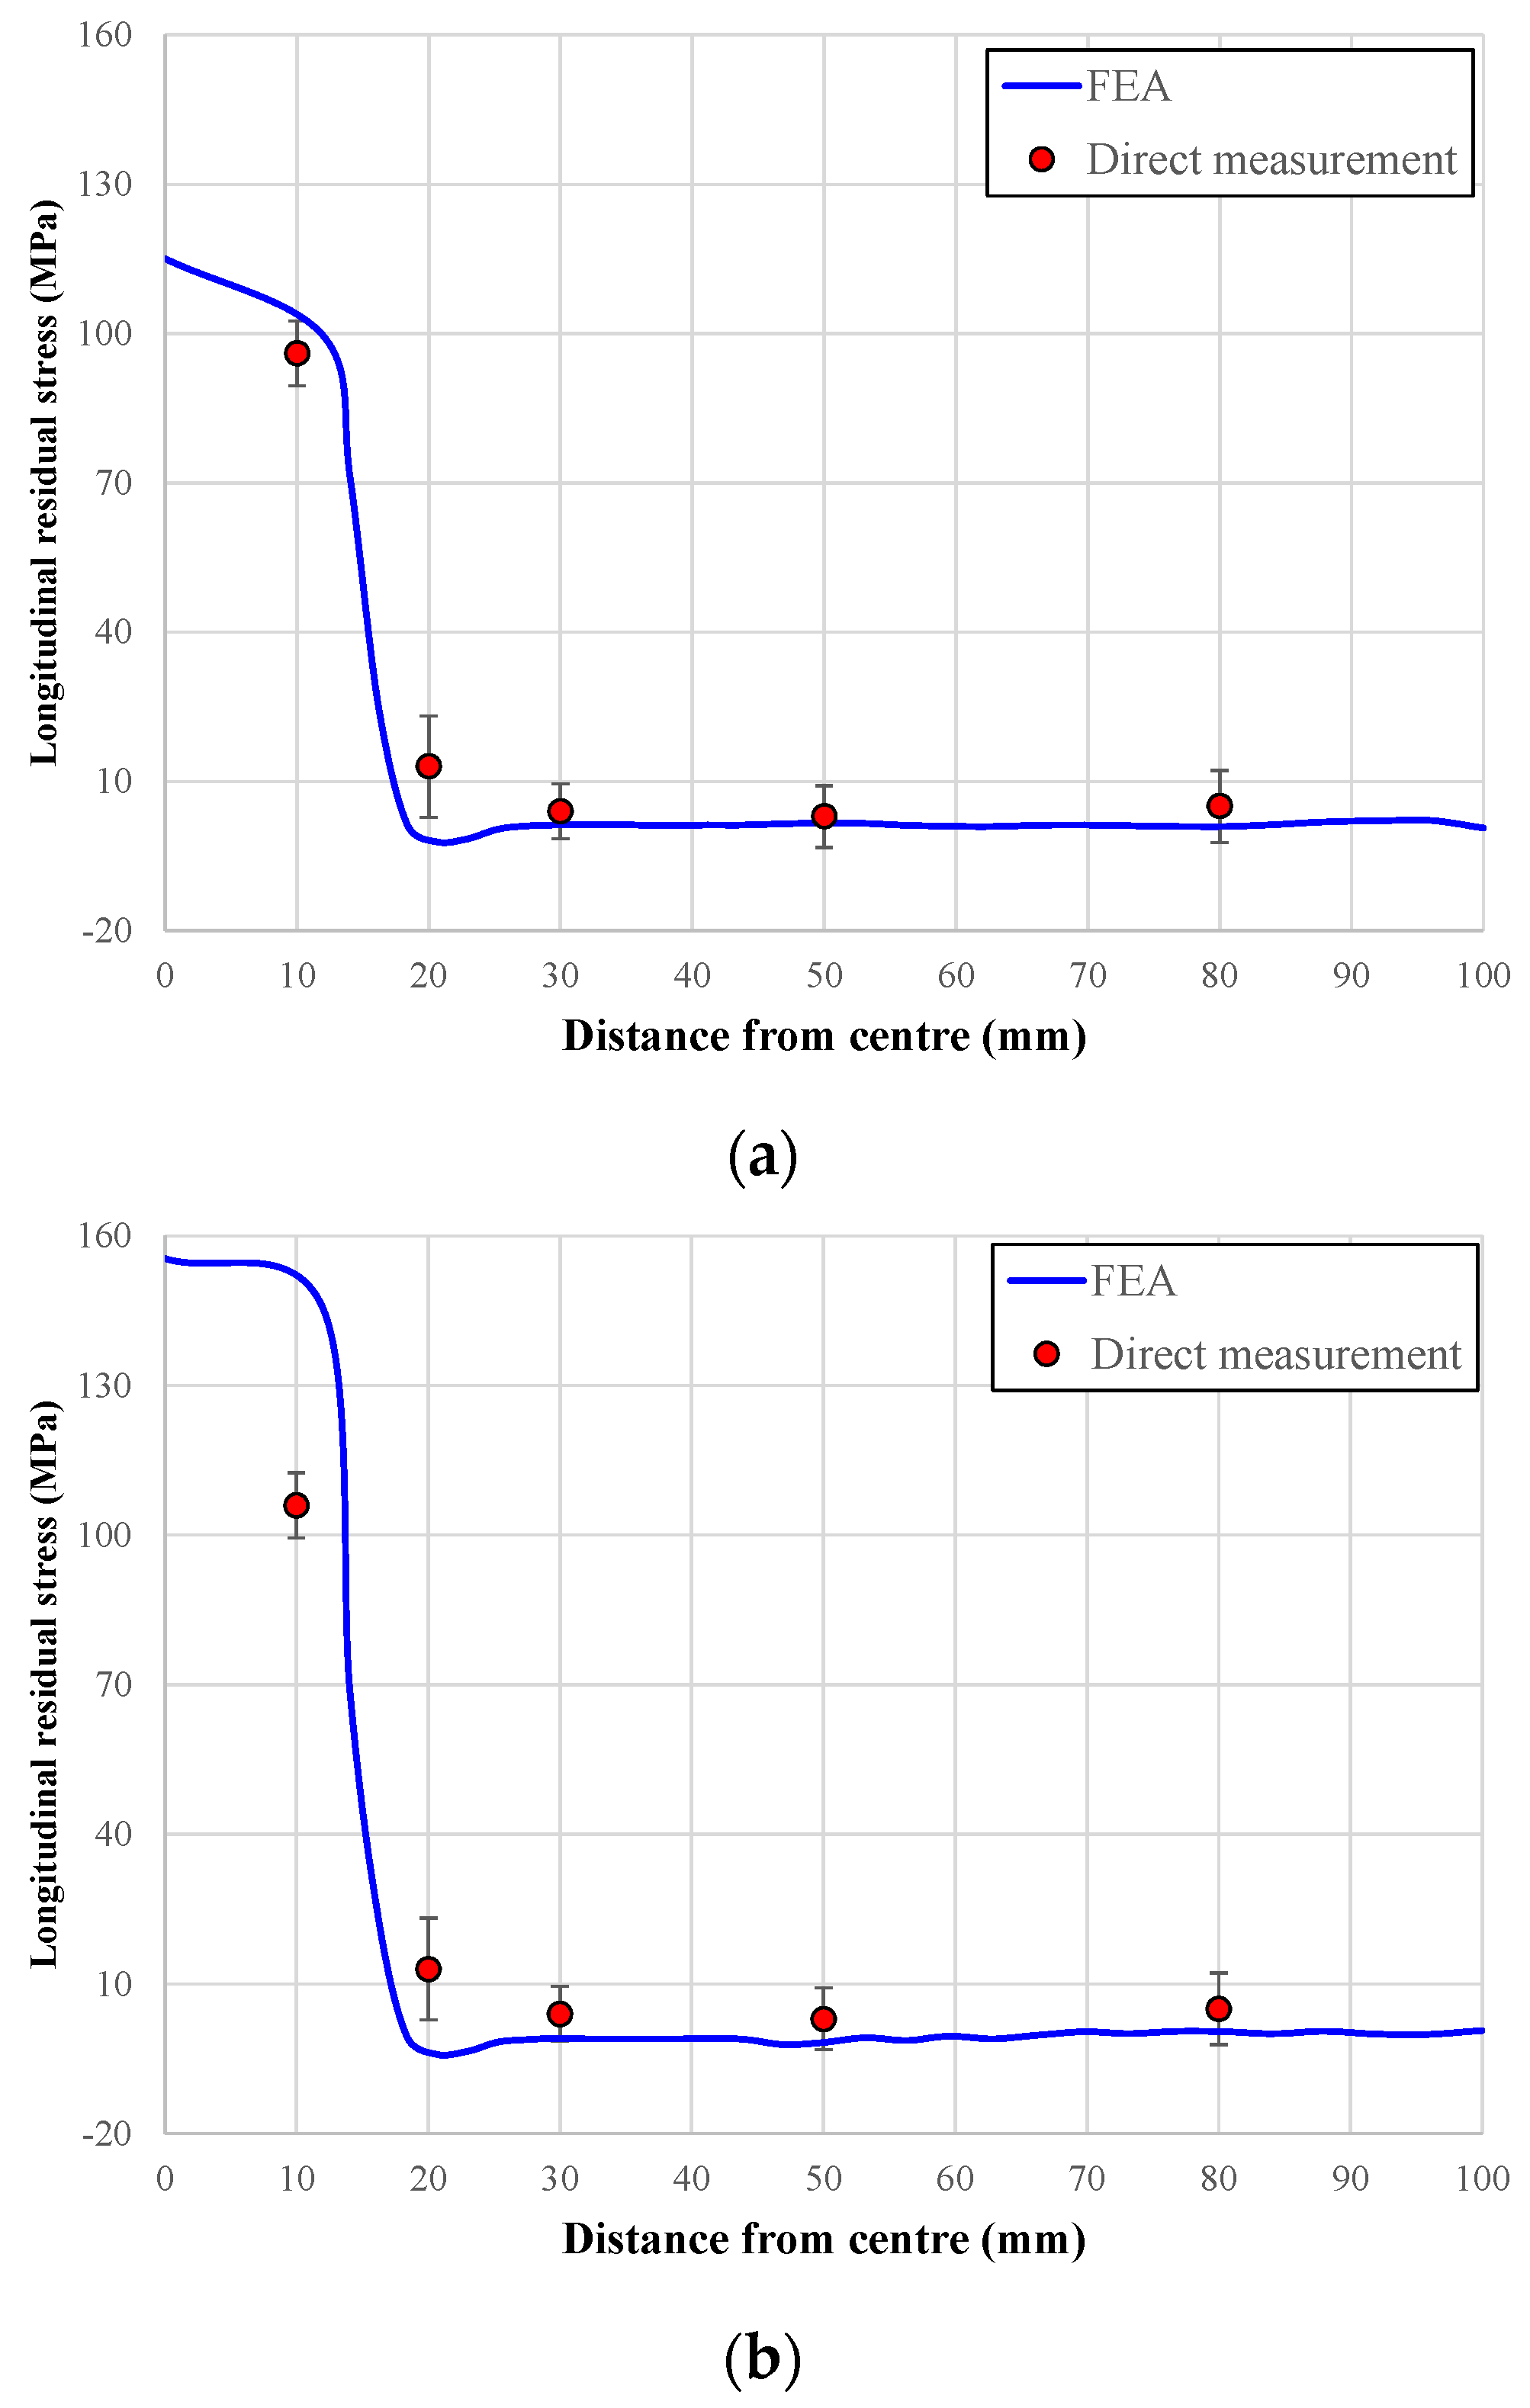
Figure 19 compares the residual stress in the direction of the weld line derived through analysis with the value measured through the hole drilling method in Al 5083, Al 6061 and Al 6082. This confirms that the heat source model proposed in this study is valid in terms of residual stress distribution and quantitatively.
Table 11 shows the welding-induced residual stress measurements of each Al alloy as determined by the hole drilling method.

4. Conclusions

When manufacturing structures through welding of Al alloys, various predictions and experimental verifications are performed through precise numerical analysis to improve productivity and rationally change future Class Rule Specifications.
(1) In particular, the GMAW welding heat source used for Al alloy welding, which is a prerequisite for precise prediction, was defined. To verify the defined heat source model, comparison of temperature history through temperature measurement on the back side and HAZ area comparison through the macro section were performed. In addition, it was verified with the proposed analysis method by measuring residual stress through the hole drilling method.
(2) As a result, the accuracy of the proposed Goldak’s double ellipsoidal model was confirmed, and it is expected that the proposed model can be used in various ways for welding each Al alloy in the future.
(3) As a result of the hole drilling residual stress measurement and FE analysis results, the tensile stress at the weld was found to be high for Al 6082, Al 6061 and Al 5083, on the same order as the actual yield stress of the base material, and the residual stress due to Al welding also shows that the residual stress near the weld is close to the yield stress of the base material.
(4) In particular, it is expected that the residual stress generated during the welding of stiffened structural Al alloys plates, as determined by this study, could be used as basic data for initial imperfections in the future in terms of structural integrity. Further research is necessary to predict and measure the residual stress of Al-stiffened plates in actual sizes rather than in the units of specimens.

Author Contributions

M.-S.Y. and J.-S.P. jointly conceived and designed the experiment, performed the experiment, and conducted the data analysis. M.-S.Y. performed the FE analysis, analyzed the data, plotted the figures and wrote this paper. J.-S.P. provided scientific guidance. All authors have read and agreed to the published version of the manuscript.

Funding

This study was supported by research fund from Chosun University, 2021.

Institutional Review Board Statement

Not applicable.

Informed Consent Statement

Not applicable.

Data Availability Statement

The data are not publicly available. The data presented in this study are available on request from the corresponding author.

Conflicts of Interest

The authors declare no conflict of interest.

References

  1. Masubuchi, K. Analysis of Welded Structures: Residual Stresses, Distortion and Their Consequences, 1st ed.; Pergamon Press: Oxford, UK, 1980. [Google Scholar]
  2. Smith, C.S.; Davidson, P.C.; Chapman, J.C.; Dowling, P.J. Strength and Stiffness of Ships’ Plating under in-Plane Compression and tension. Trans RINA Lond. 1988, 130, 277–296. [Google Scholar]
  3. Ueda, Y. Computational Welding Mechanics (A volume of Selected Papers in the Commemoration of the Retirement from Osaka University); Joining and Welding Research Institute, Osaka University: Osaka, Japan, 1999. [Google Scholar]
  4. Paik, J.K.; Thayamballi, A.K.; Ryu, J.Y.; Jang, J.H.; Seo, J.K.; Park, S.W.; Seo, S.K.; Andrieu, C.; Cojeen, H.P.; Kim, N.I. The statistics of weld induced initial imperfections in aluminum stiffened plate structures for marine applications. Int. J. Marit. Eng. 2006, 148, 19–63. [Google Scholar]
  5. Paik, J.K. Characteristics of welding induced initial deflections in welded aluminum plates. Thin-Walled Struct. 2007, 45, 493–501. [Google Scholar] [CrossRef]
  6. Paik, J.K. Mechanical Collapse Testing on Aluminum Stiffened Panels for Marine Applications; Ship Structure Committee: Washington, DC, USA, 2008. [Google Scholar]
  7. Paik, J.K.; Andrieu, C.; Cojeen, H.P. Mechanical Collapse Testing on Aluminum Stiffened Plate Structures for Marine Applications. Mar. Technol. SNAME News 2008, 45, 228–240. [Google Scholar] [CrossRef]
  8. Paik, J.K.; Kim, B.J.; Sohn, J.M.; Kim, S.H.; Jeong, J.M.; Park, J.S. On buckling collapse of a fusion-welded aluminum stiffened plate structure: An experimental and numerical study. J. Offshore Mech. Arct. Eng. 2012, 134, 1–8. [Google Scholar]
  9. Vhanmane, S.; Bhattacharya, B. Estimation of ultimate hull girder strength with initial imperfections. Ships Offshore Struct. 2008, 3, 149–158. [Google Scholar] [CrossRef]
  10. Luís, R.M.; Soares, C.G.; Nikolov, P.I. Collapse strength of longitudinal plate assemblies with dimple imperfections. Ships Offshore Struct. 2008, 3, 359–370. [Google Scholar] [CrossRef]
  11. Bruno, G.; Yordan, G.; Soares, C.G. Effect of weld shape imperfections on the structural hot-spot stress distribution. Ships Offshore Struct. 2011, 6, 145–159. [Google Scholar]
  12. Khedmati, M.R.; Pedram, M.; Rigo, P. The effects of geometrical imperfections on the ultimate strength of aluminium stiffened plates subject to combined uniaxial compression and lateral pressure. Ships Offshore Struct. 2012, 9, 88–109. [Google Scholar] [CrossRef]
  13. Teresa, M.; Craig, F. Effect of weld-induced imperfections on the ultimate strength of an aluminium patrol boat determined by the ISFEM rapid assessment method. Ships Offshore Struct. 2013, 9, 218–235. [Google Scholar]
  14. Cheng, J.J.R.; Elwi, A.E.; Grodin, G.Y.; Kulak, G.L. Material testing and residual stress measurements in a stiffened steel plate. In Strength and Stability of Stiffened Plate Components; Ship Structure Committee: Washington, DC, USA, 1996. [Google Scholar]
  15. Kenno, S.Y.; Das, S.; Kennedy, J.; Rogge, R.; Gharghouri, M. Distributions of residual stresses in stiffened plates with one and two stiffeners. Ships Offshore Struct. 2010, 5, 211–225. [Google Scholar] [CrossRef] [Green Version]
  16. Kenno, S.Y.; Das, S.; Rogge, R.B.; Gharghouri, M.A. Changes in residual stresses caused by an interruption in the weld process of ships and offshore structures. Ships Offshore Struct. 2016, 12, 341–359. [Google Scholar] [CrossRef]
  17. Yi, M.S.; Hyun, C.M.; Paik, J.K. Full-scale measurements of welding-induced initial deflections and residual stresses in steel-stiffened plate structures. Int. J. Marit. Eng. 2018, 160, A397–A412. [Google Scholar] [CrossRef]
  18. Yi, M.S.; Hyun, C.M.; Paik, J.K. An empirical formulation for predicting welding-induced biaxial compressive residual stresses on steel stiffened plate structures and its application to thermal plate buckling prevention. Ships Offshore Struct. 2019, 14, S18–S33. [Google Scholar] [CrossRef]
  19. Yi, M.S.; Noh, S.H.; Lee, D.H.; Seo, D.H.; Paik, J.K. Direct measurements, numerical predictions and simple formula estimations of welding-induced biaxial residual stresses in a full-scale steel stiffened plate structure. Structures 2020, 29, 2094–2105. [Google Scholar] [CrossRef]
  20. Rosenthal, D. The theory of moving sources of heat and its application to metal treatments. Trans ASME 1946, 68, 849–866. [Google Scholar]
  21. Pavelic, V.; Tanbakuchi, R.; Uyehara, O.A.; Myers, P.S. Experimental and computed temperature histories in gas tung-sten-arc welding of thin plates. Weld J. 1969, 48, 295–305. [Google Scholar]
  22. Eager, T.W.; Tasi, N.S. Temperature fields produced by travelling distributed heat source. Weld J. 1983, 12, 346–354. [Google Scholar]
  23. Wahab, M.A.; Painter, M.J.; Davies, M.H. The prediction of the temperature distribution and weld pool geometry in the gas metal arc welding process. J. Mater. Process Technol. 1998, 77, 233–239. [Google Scholar] [CrossRef]
  24. Murugan, S.; Kumar, P.V.; Raj, B.; Bose, M.S.C. Temperature distribution during multipass welding of plates. Int. J. Press Vessels Pip. 1998, 75, 891–905. [Google Scholar] [CrossRef]
  25. Choo, R.T.C.; Szekely, J.; Westhoff, R.C. On the calculation of the free surface temperature of gas-tungsten-arc weld pools from first principles. Metall. Trans. 1992, 23, 357–384. [Google Scholar] [CrossRef]
  26. Nguyen, N.T.; Ohta, A.; Matsuoka, K.; Suzuki, N.; Maeda, Y. Analytical solutions for transient temperature of semi-infinite body subjected to 3-D moving heat sources. Weld J. 1999, 78, 265–274. [Google Scholar]
  27. Fan, H.G.; Tsai, H.L.; Na, S.J. Heat transfer and fluid flow in a partially or fully penetrated weld pool in gas tungsten arc welding. Int. J. Heat Mass Transfer 2001, 44, 417–428. [Google Scholar] [CrossRef]
  28. Sharma, A.; Chaudhary, A.K.; Arora, N.; Mishra, B.K. Estimation of heat source model parameters for twin-wire submerged arc welding. Int. J. Adv. Manuf. Technol. 2009, 45, 1096–1103. [Google Scholar] [CrossRef]
  29. Bajpei, T.; Chelladurai, H.; Ansari, M.Z. Experimental investigation and numerical analyses of residual stresses and distortions in GMA welding of thin dissimilar AA5052-AA6061 plates. J. Manuf. Process. 2017, 25, 340–350. [Google Scholar] [CrossRef]
  30. Lee, S.H.; Kim, E.S.; Park, J.Y.; Choi, J. MIG Welding Optimization of Muffler Manufacture by Microstructural Change and Thermal Deformation Analysis. J. Weld. Join. 2017, 35, 29–37. [Google Scholar] [CrossRef] [Green Version]
  31. Aleo, V. Effect of Welding on the Width of Heat Affected Zone of Aluminum Alloys. Ph.D. Thesis, University of Windsor, Windsor, ON, Canada, 2004. [Google Scholar]
  32. Sel, H.; Awang, M.; Md, A.I.; Ismailc, E.R.; Ahmadi, Z.A. Evaluation of properties and FEM model of the friction welded mild steel-Al6061-alumina. Mater. Res. 2013, 16, 453–467. [Google Scholar] [CrossRef] [Green Version]
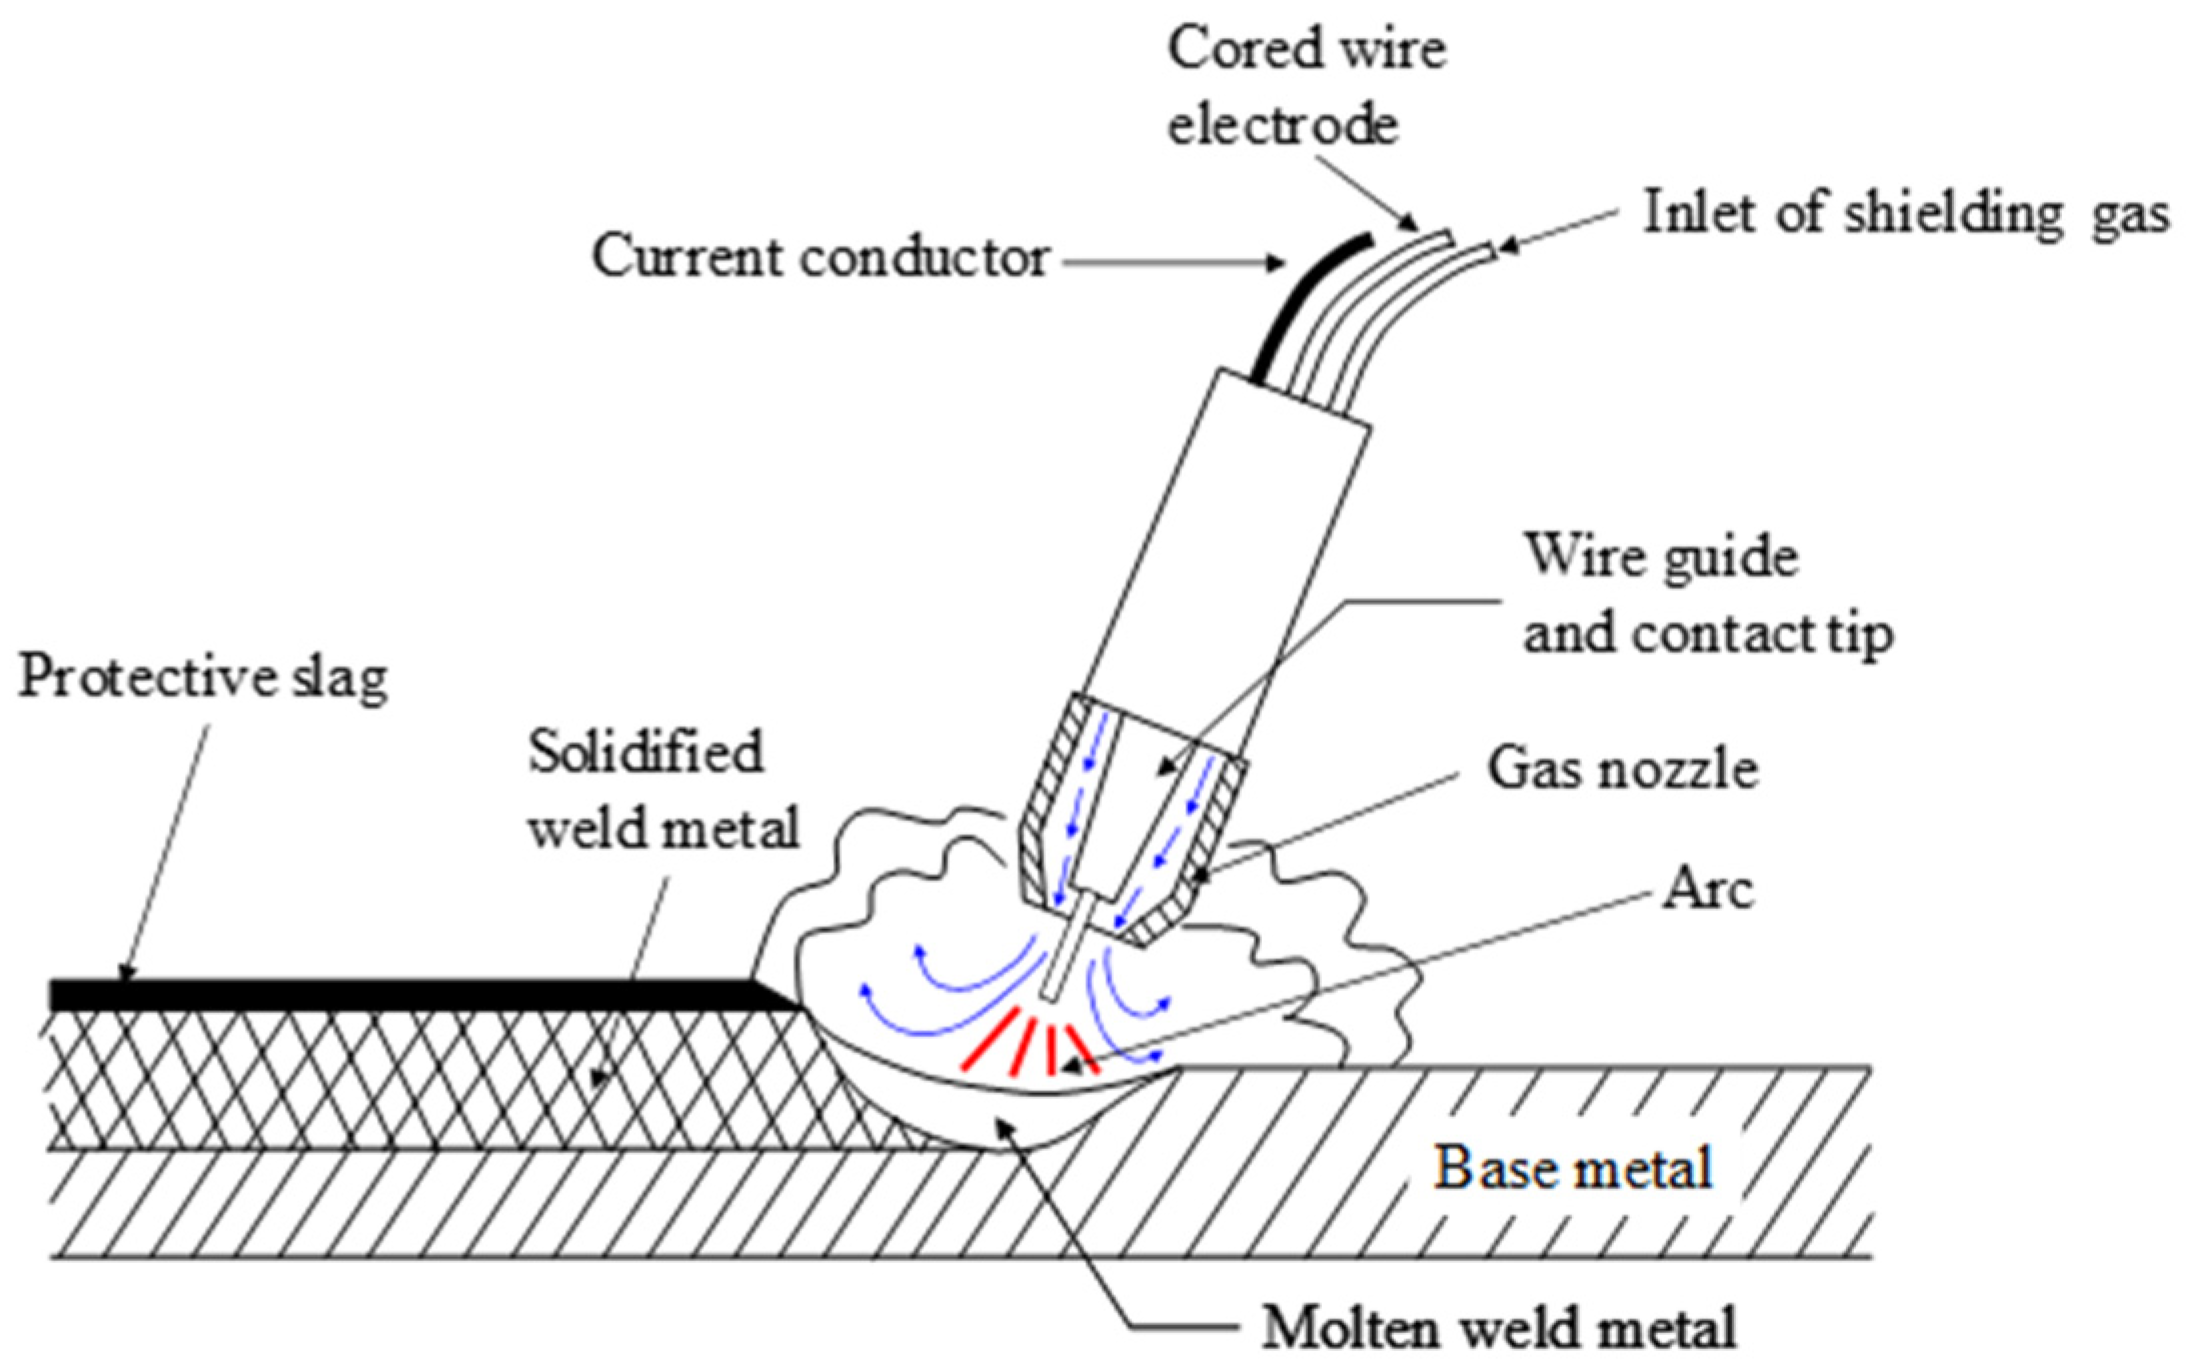
Figure 1. Configuration of gas metal arc welding (GWAM).
Metals 12 00891 g001
Figure 2. Design of specimen (dimension and welding detail): (a) Dimension and joint detail of butt welding; (b) Dimension and joint detail of fillet welding.
Metals 12 00891 g002aMetals 12 00891 g002b
Figure 3. (a) Fillet welding; (b) Butt welding.
Metals 12 00891 g003
Figure 4. Leg length of fillet welding: (a) Bottom leg length; (b) Upper leg length.
Metals 12 00891 g004
Figure 5. Extraction zone of tensile test and macro section: (a) Test specimen for butt welding; (b) Test specimen for fillet welding.
Metals 12 00891 g005
Figure 6. Tensile test of Al alloys: (a) Test specimens; (b) Tensile test machine.
Metals 12 00891 g006
Figure 7. Fracture state of test specimens: (a) Base metal; (b) Welded metal.
Metals 12 00891 g007
Figure 8. Engineering stress versus engineering strain curves for Al alloys: (a) Base metal of Al 5083 H321; (b) Welded metal of Al 5083 H321; (c) Base metal of Al 6061 T6; (d) Welded metal of Al 6061 T6; (e) Base metal of Al 6082 T6; (f) Welded metal of Al 6082 T6.
Metals 12 00891 g008aMetals 12 00891 g008b
Figure 9. Macro section of Al alloys as: (a) Al 5083 H321 for butt welding; (b) Al 6061 T6 for butt welding; (c) Al6082 T6 for butt welding; (d) Al 5083 H321 for fillet welding; (e) Al 6061 T6 for fillet welding; (f) Al 6082 T6 for fillet welding.
Metals 12 00891 g009
Figure 10. Attachment location of thermocouple (K-type): (a) Schematic figure; (b) Attached thermocouple of real specimen.
Metals 12 00891 g010
Figure 11. A Definition of geometric parameters for the heat source distribution with a double ellipsoidal shape.
Metals 12 00891 g011
Figure 12. A Temperature history during GMAW (Al 6061 T6).
Metals 12 00891 g012
Figure 13. Results of thermal FE analysis (Al 6061 T6).
Metals 12 00891 g013
Figure 14. Comparison of temperature history of Ch#1 and #2 of Al 6061 T6 based on experiment versus FE analysis: (a) Ch#1 position; (b) Ch#2 position.
Metals 12 00891 g014
Figure 15. HAZ Verification Al 6061 T6 (macro section vs. FE analysis).
Metals 12 00891 g015
Figure 16. Schematic diagram coupling temperature, microstructure and stress.
Metals 12 00891 g016
Figure 17. Distribution of equivalent von Mises stress for Al 6061 T6.
Metals 12 00891 g017
Figure 18. Location of attached stain gauge.
Metals 12 00891 g018
Figure 19. Comparison of FEA versus direct measurement: (a) Al 5083 H321; (b) Al 6061 T6; (c) Al 6082 T6.
Metals 12 00891 g019aMetals 12 00891 g019b
Table 1. Heat-treated and non-heat-treated aluminum and its alloys.
TypeSeriesNote
Non-heat-treatable1xxxpure metal Al(>99.0%)
3xxxAl-Mn series alloys
4xxxAl-Si series alloys
5xxxAl-Mg series alloys
Heat-treatable2xxxAl-Cu series alloys
6xxxAl-Mg-Si series alloys
7xxxAl-Si-Mg series alloys
Table 2. Specimen specifications.
TypeDimension
(L × W × t)
Al 5083 H321Al 6061 T6Al 6082 T6
Butt
specimen
350 × 100 × 10222
Fillet
specimen
(plate)
350 × 200 × 10
111
(web)
350 × 100 × 10
111
Total444
(unit: mm).
Table 3. Heat input parameter for making the fillet weld length.
Welding
Parameter
Current
(A)
Voltage
(V)
Speed
(cm/min)
Heat Input
(kJ/cm)
Leg Length
(mm)
WPS
Condition
145.6–218.423.5–31.730.1–45.16–84.2–8.4
Real
Condition
2102539.67.87.5
Table 4. Heat input parameter for butt welding.
Welding
Parameter
Number of PassCurrent
(A)
Voltage
(V)
Speed
(cm/min)
Heat Input
(kJ/cm)
WPS
Condition
#1132.2–184.819–25.822.4–33.65.6–9.3
#2128–19219–25.828.9–43.325.9–8.8
Back gouging
#3124–18619–25.822.1–33.15.6–9.4
Real
Condition
#115023289
#216022307.04
Back gouging
#315523258.57
Table 5. Chemical composition of Al 5083 H321.
Si
(%)
Fe
(%)
Cu
(%)
Mn
(%)
Mg
(%)
Cr
(%)
Ni
(%)
Zn
(%)
Ti
(%)
Others
EachTotal
Actual0.190.360.0290.664.790.0830.00810.110.016--
LimitMin.---0.404.000.050-----
Max.0.400.400.101.004.900.25-0.250.150.0500.15
Table 6. Chemical composition of Al 6061 T6.
Si
(%)
Fe
(%)
Cu
(%)
Mn
(%)
Mg
(%)
Cr
(%)
Ni
(%)
Zn
(%)
Ti
(%)
Others
EachTotal
Actual0.690.430.220.151.000.170.00980.0480.017--
LimitMin.0.40-0.15-0.800.040-----
Max.0.800.700.400.151.200.35-0.250.150.0500.15
Table 7. Chemical composition of Al 6082 T6.
Si
(%)
Fe
(%)
Cu
(%)
Mn
(%)
Mg
(%)
Cr
(%)
Ni
(%)
Zn
(%)
Ti
(%)
Others
EachTotal
Actual1.010.100.010.530.720.01-0.010.02--
LimitMin.0.7--0.40.6------
Max.1.30.500.11.01.20.25-0.20.10.050.15
Table 8. Tensile test results (nominal stress and strain).
Yield Stress
(MPa)
Tensile Strength
(MPa)
Fracture Strain
(mm/mm)
Al 5083 H321
(Base metal)
#1207.4326.70.316
#2209.8328.60.327
Al 5083 H321
(Weld metal)
#1179.8292.50.240
#2178.1287.90.044
Al 6061 T6
(Base metal)
#1297.4325.50.289
#2280.4327.20.301
Al 6061 T6
(Weld metal)
#1187.3227.40.087
#2180.4233.40.112
Al 6082 T6
(Base metal)
#1307.1328.80.205
#2302.7326.30.207
Al 6082 T6
(Weld metal)
#1180.9236.20.103
#2192.1234.10.093
Table 9. Values of the double ellipsoidal heat source model.
a
(mm)
b
(mm)
cf
(mm)
cr
(mm)
ff
(-)
fr
(-)
55240.41.6
Table 10. Material properties of Al 6061 T6.
Temperature
(°C)
Thermal
Conductivity
(W m−1 K−1)
Heat
Capacity
(J kg−1 K−1)
Density
(kg m−3)
Thermal
Expansion
(×10−6 K−1)
Young’s
Modulus
(GPa)
Yield
Stress
(MPa)
Poisson’s
Ratio
(-)
0162917270322.469.7277.70.33
98177978268524.666.2264.6
2011921028265726.659.2218.6
3162071078263027.647.866.2
4282231133260229.631.717.9
5712531230257434.200
Table 11. Measured data of welding-induced residual stresses.
Kinds of MaterialDistance
from Weld Center Line (mm)
σrx (MPa)±Error (MPa)
Al 5083 H32110964.8
201310.5
30412.1
5034.5
8058.2
Al 6061 T6101066.5
202110.2
3055.5
5016.2
80−57.2
Al 6082 T61023212.8
20368.6
30814.9
5065.1
80715.8
Publisher’s Note: MDPI stays neutral with regard to jurisdictional claims in published maps and institutional affiliations.