Article

A Study on the Thermo-Mechanical History, Residual Stress, and Dynamic Recrystallization Mechanisms in Additively Manufactured Austenitic Stainless Steels

State Key Laboratory of Advanced Design and Manufacturing for Vehicle Body, Hunan Provincial Key Laboratory of Intelligent Laser Manufacturing, Hunan University, Changsha 410082, China
*
Authors to whom correspondence should be addressed.
Metals 2022, 12(7), 1109; https://doi.org/10.3390/met12071109
Submission received: 26 May 2022 / Revised: 14 June 2022 / Accepted: 23 June 2022 / Published: 28 June 2022

Abstract

:
In this work, both numerical simulations and experimental characterization were used to obtain a broad understanding of the thermo-mechanical history, residual stress, and microstructure of the directed energy deposition (DED) process of austenitic stainless steels. To investigate the effect of process factors on residual stress, the global sensitivity analysis approach based on D-MORPH-HDMR was utilized. The results of the research reveal that the amplified effect of the influence of the three input variables (layer thickness, L; laser power, P; and scanning speed, v) on the transverse residual stress and thickness-direction residual stress is L > P > v; in contrast, the influence of longitudinal residual stress is P > L > v. We also found that general tendencies in local plastic strain accumulation are analogous to the relative distribution of geometrically necessary dislocations (GNDs). Additionally, we investigated post-solidification structures connected to residual stress, such as submicron dislocation cells and dynamic recrystallization (DRX) in austenitic stainless steels during DED. The investigation revealed that the DDRX and CDRX phenomena were caused by the bulging of initial grain boundaries and progressive sub-grain rotation (PSR). The fact that the sample bottom had more thermo-mechanical cycles than the top led to a higher dislocation density and hence more DDRX. This study presents a unique perspective on the link between residual stress and microstructure in additive manufacturing.

1. Introduction

Metal additive manufacturing (MAM) is gaining popularity due to its ability to rapidly fabricate structural components that would be prohibitively expensive or difficult to fabricate using conventional manufacturing procedures [1,2,3]. For structural applications and printability, MAM methods such as directed energy deposition (DED) and laser-based powder bed fusion (LPBF) have focused on steels [4,5,6,7,8], nickel alloys [9,10,11,12], and titanium alloys [13,14]. Because of this, additive manufacturing has tremendous prospects for Industry 4.0 intelligent production [8,15]. However, in both techniques, the powder or wire is melted by a concentrated energy source. Temperature gradients (up to 1000 K/m) would invariably produce residual stress (RS) and residual deformation, which will deteriorate the fatigue and fracture resistance and potentially lead to component failure. The printing method has a substantial impact on residual stress (RS), which is one of the major issues in additive manufacturing [3,16]. As a result, optimizing printing techniques to reduce residual stress (RS) and distortion is a key issue. Stainless steel is currently one of the most widely used materials in metal additive manufacturing (particularly 316L stainless steel, which is widely used in marine, medical, and nuclear pressurized water reactors (PWRs) due to its high strength and good ductility) in the petrochemical industry, which requires high corrosion resistance [4].
Until now, the majority of research has focused only on the relationship between specific parameters and the resultant RS magnitude or distribution (as represented in Table 1). These findings exclude the possibility of synergistic effects of many parameters or material property influences [17]. For instance, Mukherjee et al. [18] discovered that the residual stresses increased linearly with increasing laser power. Nevertheless, other research [19,20] found the opposite effect (a residual stress reduction). A similar pattern of diminishing residual stress was discovered as the scanning speed was increased [18]. Brückner et al. [21], on the other hand, found a linear connection between scanning speed and residual stress. Furthermore, Shiomi et al. [22] discovered that when the scanning speed increased, the residual stress decreased initially and subsequently increased. Meanwhile, Mukherjee et al. [23] discovered that thinner layers resulted in reduced residual stresses. However, Vastola et al. [24] discovered that residual stress reduction had a different effect. The influence of eight different scanning methods on residual stresses was investigated by Cheng et al. [25]. The out-o-in scanning strategy resulted in the highest stresses, whereas the horizontal line scanning method resulted in significant directional stresses. Saboori et al. [26] studied the effects of two deposition strategies (67° and 90°) on the residual stress of 316L produced by the DED process and found that the residual stresses on the top surfaces were similar for both deposition patterns, although higher stress values were observed on the lateral surfaces of the cubes produced using the 90° rotation per layer. Yakout et al. [27] discovered that the principal stress increases almost linearly with increasing laser density. Zou et al. [28] found that if the number of laser beams was raised from one to four, the residual stresses would be substantially greater, resulting in an increase in the intake of heat. Compared with no preheating, Sharma et al. [29] found that preheating the substrate to 673 K decreased the residual stresses by 41% at the highest value. According to the above-mentioned research, laser power, layer thickness, and scanning speed are known to affect the residual stress, but no definitive conclusions can be drawn about the relationship between these key process parameters and the residual stress generated during the SLM or DED process.
To gain a better understanding of the relation between process parameters and residual stress in additive manufacturing, the global sensitivity analysis method based on D-MORPH-HDMR was used to study the influence of process parameters on residual stress. This method is a sensitivity analysis method based on variance and has a wide range of applications. By combining Diffeomorphic Modulation Under Observable Response Preserving Homotopy (D-MORPH) with Random Sampling High-Dimensional Model Representation (RS-HDMR), a model of high-dimensional problems can be realized and accurate sensitivity analysis results can be obtained under the premise of a small number of samples. For more details, please refer to our previous paper [30] for the MATLAB code.
The DED process is characterized by cooling rates greater than 103 K/s, resulting in nonequilibrium and rapid solidification conditions [3,31]. The location-specific microstructures and attributes associated with DED constructions present a considerable barrier to planning and forecasting component responses [32]. As documented in the literature, changes in the thermal–mechanical evolution imposed during the deposition of austenitic stainless steels produce trans-scale heterogeneous structures that can lead to significant variations in mechanical characteristics [3,33,34,35,36]. A simple equation may be used to explain the strengthening mechanism in theory: σ y = Δ σ gb + Δ σ dis + Δ σ p + Δ σ SEG , where Δ σ gb , Δ σ dis ,   Δ σ p , and Δ σ SEG represent the yield stress contributions from grain boundaries, dislocations, precipitates, and micro-segregations, respectively [37,38]. It was previously shown that the dislocation intensity accounted for 60% of the total and became the leading strength-contributing factor [39]. At present, a deeper understanding of the intrinsic relationship between them is still lacking, and further quantitative evaluation of the thermo-mechanical history and microstructural responses is required. Mechanical restrictions resulting from the construction substrate provide a significant amount of residual stress and a high density of dislocations [40] in the metallic components during thermal expansion and contraction [4,5,6,41,42,43]. Repeated heating and cooling cycles provide an inherent heat treatment effect in previously deposited layers, and a solid-state phase transition and recrystallization can occur in some instances [44,45]. Dynamic recrystallization can be divided into continuous dynamic recrystallization (CDRX) and discontinuous dynamic recrystallization (DDRX). According to the authors, research on dynamic recrystallization in the additive manufacturing process is uncommon and additional exploration is required.
In view of the state of the research and the research gaps, this work takes austenitic stainless steel as the research object and carries out research through the method of combining finite element simulation and experiments. One aim is to quantify the effect of the process parameters on residual stresses that are currently controversial in the literature based on global sensitivity analysis methods. The other aim is to determine the relationship between the post-solidification microstructure and thermal stresses in the additive manufacturing process.
Table 1. A summary of correlations between processing parameters and residual stress formation.
Process ParameterGeneral Effect on RSReferences
Laser power, P ※Higher power results in higher RS[18,19,20,46]
Scan speed, v ※Higher speed results in lower RS[18,21,46,47,48]
Layer thickness ※A thicker layer lowers the RS[23,24]
Substrate heatingHigher temperatures result in lower RS[29,47,48,49,50,51]
Scan orientationAffects the RS distribution and the RS magnitude[25,52,53,54]
Interlayer dwelling timeMaterial dependent. Affects the RS magnitude[50,55]
Some factors were found to have varying impacts in various studies. In these circumstances, the disputed parameters discovered in the literature are denoted by ※.

2. Materials and Methods

2.1. Materials and Processing Parameters

Figure 2a depicts a schematic representation of the additive manufacturing process. The samples were created using a Yb-fiber laser (IPG YLS-5000, IPG Photonics, New York, NY, USA). A continuous fiber laser bar creates a liquid pool by co-pivotally transporting gas-atomized 316L particles. As stated in Table 2, the samples were made of commercial 316L steel powder (20–90 m). Table 2 shows the composition of the 316L austenitic stainless steels used in this study. Table 3 displays the experimental parameters used to assess the association between process parameters and RS. An experimental design based on orthogonal arrays (OA9matrix) was used to examine three variables (laser power, layer thickness, and scanning speed). Table 4 depicts the orthogonal-array-based experimental design.

2.2. Experimental Procedures

Electro-discharge machining was used to cut samples from the clad bulk in order to examine the microstructure (EDM). A 30 mL HCl + 10 mL HNO3 solution was used to prepare the specimens for optical micrography (OM) and electron scanning microscopy (SEM, JSM-5600LV, JEOL, Tokyo, Japan). A step size of 1 μm was utilized for EBSD observations, while a step size of 15 nm was used for TKD observations. The EBSD data were examined using the Oxford Instruments Channel 5 and MTEX 5.6 software packages. The samples were thinned further using the lift-out sample preparation procedure and a Focused Ion beam (FIB). A TecnaiG2F20 field emission transmission electron microscope was used to examine the morphology in the micro region. In the test, the acceleration voltage was 200 kV. Additively manufactured 316L specimens for the residual stress tests were measured by the contour method, which is an acceptable technique for mapping residual stresses as a cross-sectional (2D) map of the residual stresses normal to the cross-section can be provided. A detailed description is given in [56].

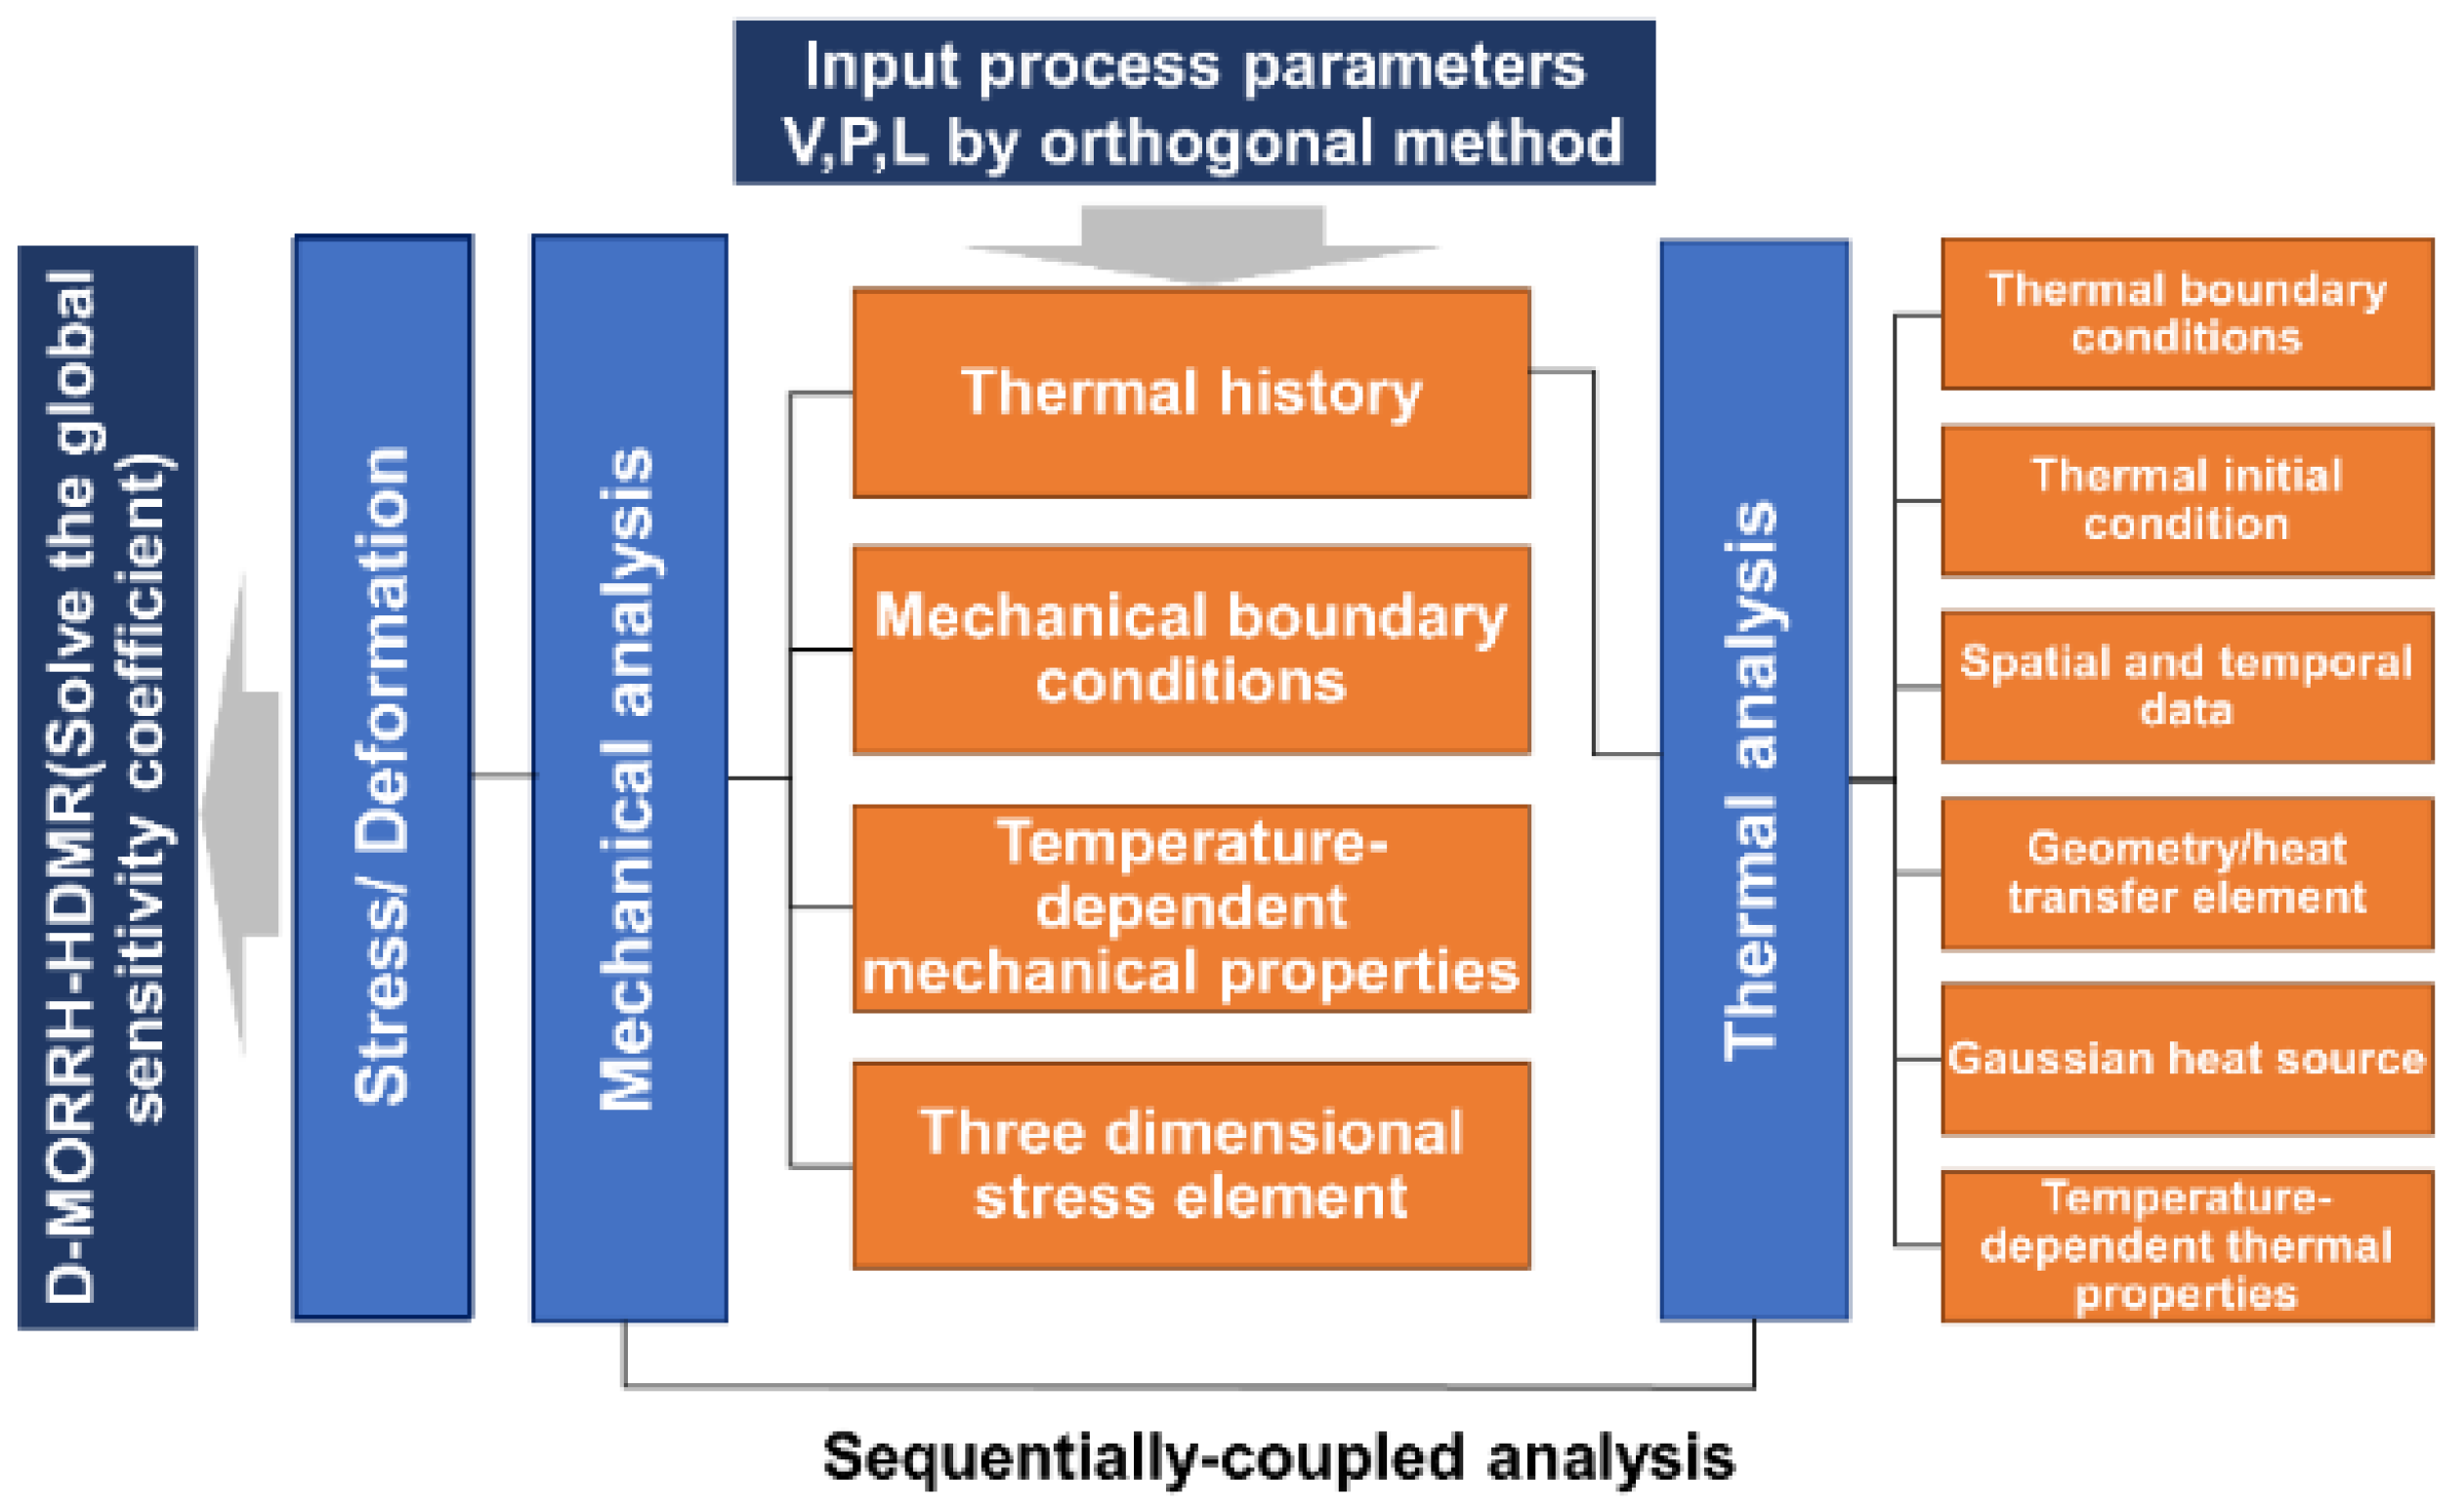
2.3. Thermo-mechanical Simulations

To simulate the development of the RS field during DED of austenitic stainless steels, the FEM was utilized. A sequential thermal–mechanical model that was previously built [56] was used in this study. As shown in Figure 1, the difference is that this study focuses on the multilayer sedimentary model. To compute the temperature field and thermal stresses in both single-track and single-channel multilayer DED of 316L, a 3D thermos-mechanical model was created as shown in Figure 2b. Figure 3a depicts the model’s geometric mesh. The substrate had dimensions of 16 mm × 8 mm × 5 mm, while the deposition zone had maximum dimensions of 12 mm × 2 mm × 4 mm. The birth–death element method was employed during the simulation procedure. As a result of previous research on austenitic stainless steels, we were able to obtain the relevant modeling parameters, such as temperature-dependent mechanical properties such as the Young’s modulus, as well as the modeling size, boundary conditions, and controlling equations necessary for the simulation of these materials [57]. A description of this model is briefly given here.
The governing equation for transient heat conduction in the DED process is:
Q ( x , t ) q ( x , t ) = ρ C p d T d t
where C p denotes the temperature-dependent specific heat capacity, ρ denotes the density, t denotes the time, T   denotes the temperature, and q denotes the conductive heat flux.
For a laser beam, the mean volumetric heat source model is:
Q ( x , t ) = η P V
where η denotes the alloy laser absorption and P denotes the laser power.
There are three forms of heat transfer involved in the DED process: conductive heat transfer ( q ), radiative heat transfer ( q rad ), and convective heat transfer ( q conv ). The Fourier law, the Boltzmann law, and Newton’s convective cooling law are followed by these heat transfer processes.
q = k T
q rad = ε σ b ( T S 4 T 4 )
q conv = h ( T S T )
where k denotes the temperature-dependent thermal conductivity; ε denotes the surface emissivity; σ b denotes the Stefan–Boltzmann constant; T S and T represent the room temperature and peak temperature, respectively; and h denotes the convective heat transfer coefficient.
The controlling mechanical stress equilibrium equation can be written as follows:
σ = 0
where σ represents the third-order stress tensor.
The mechanical constitutive law is as follows:
σ = C ε e
where C denotes the fourth-order stiffness tensor and ε e denotes the elastic strain:
ε e = ε ε p ε T
where ε e represents the total strain, ε p denotes the plastic strain, and ε T denotes the thermal strain. The equivalent stress ( σ e ), often referred to as the von Mises stress, is frequently employed in DED to estimate residual stress [16]. It is written as follows:
σ e = 1 2 [ ( σ x σ y ) 2 + ( σ y σ z ) 2 + ( σ x σ z ) 2 + 6 ( τ x y 2 + τ y z 2 + τ x z 2 ) ]

3. Results and Discussion

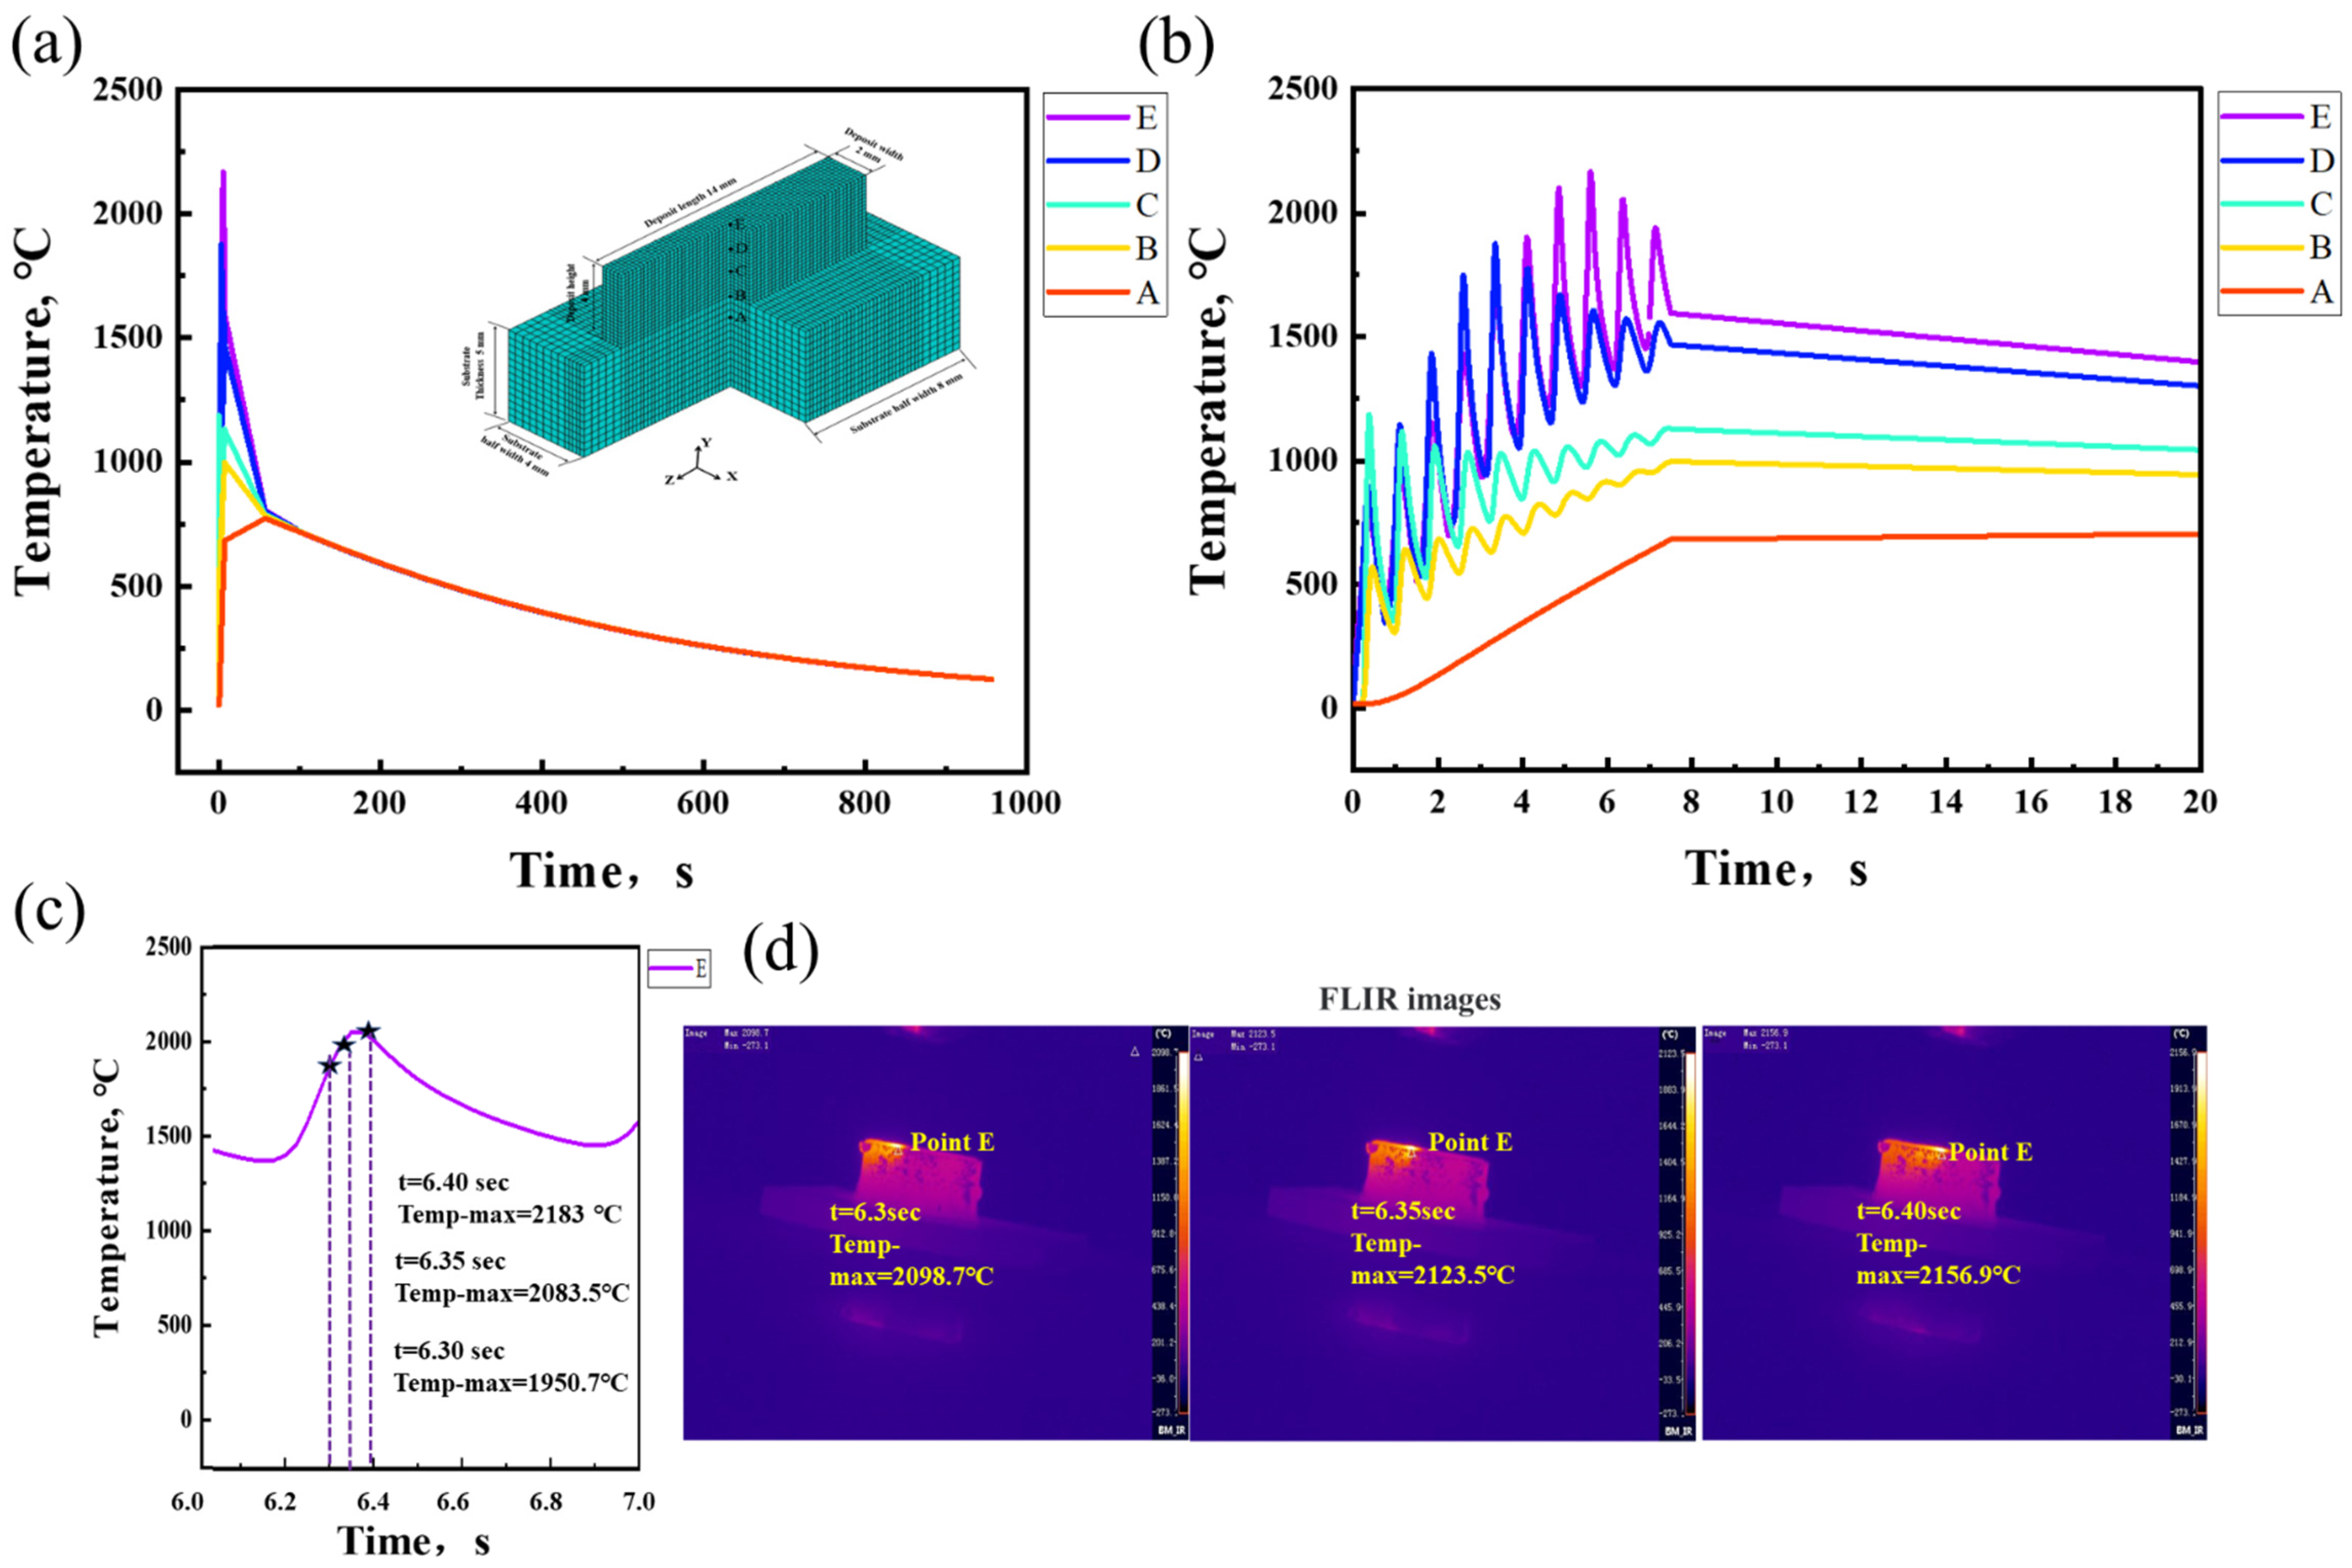
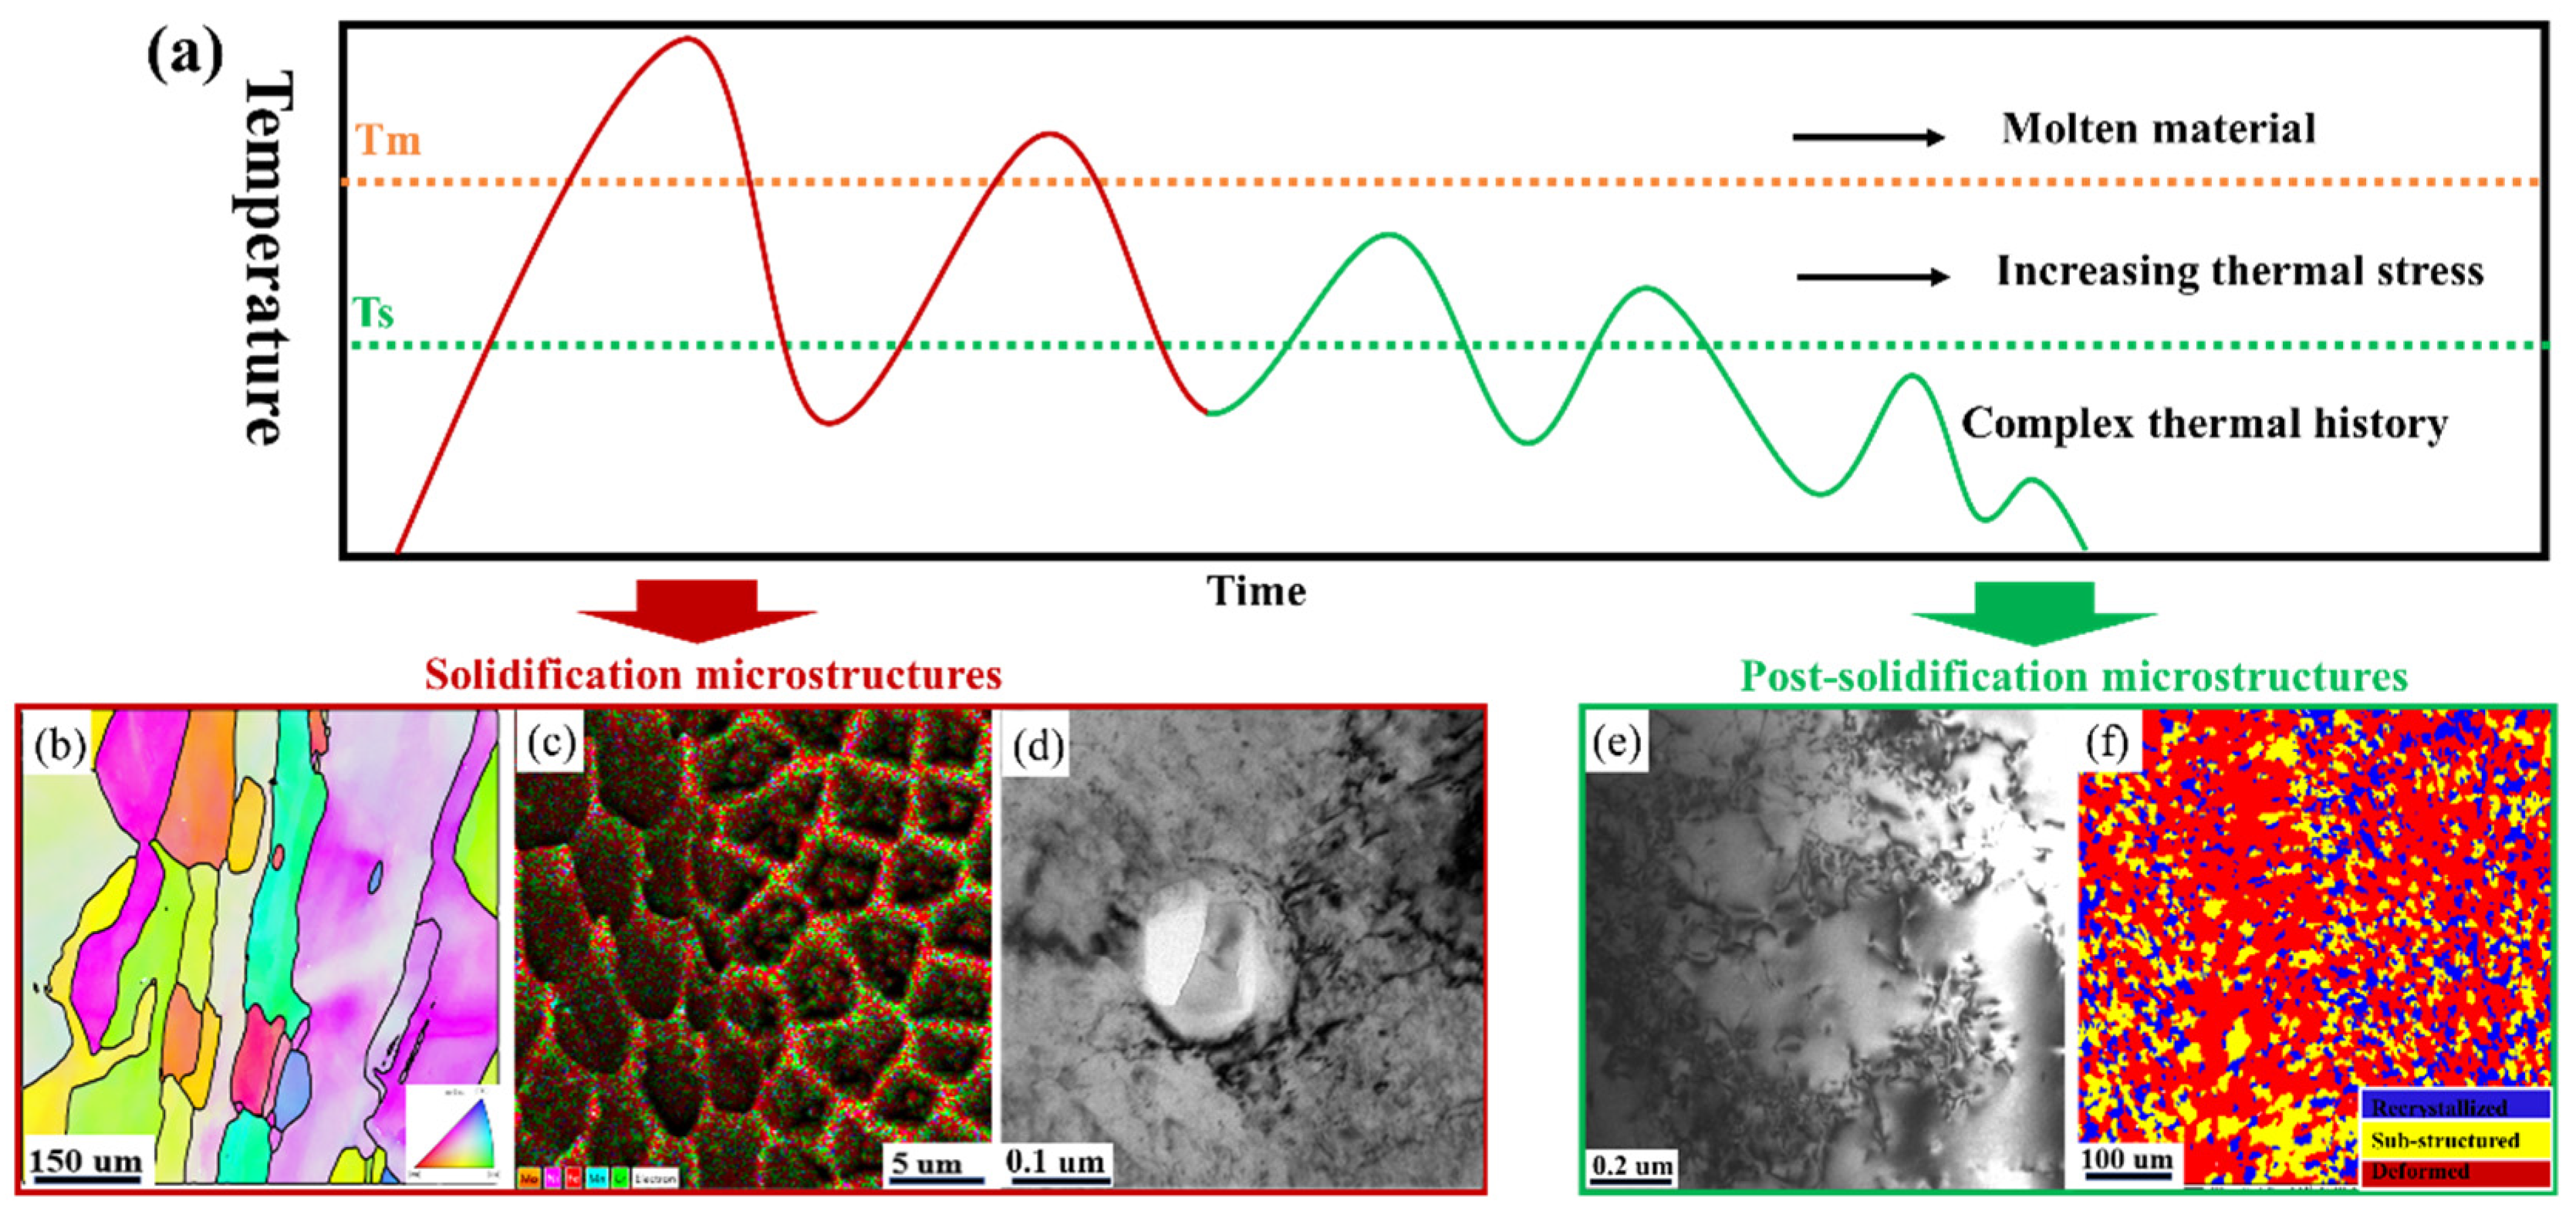
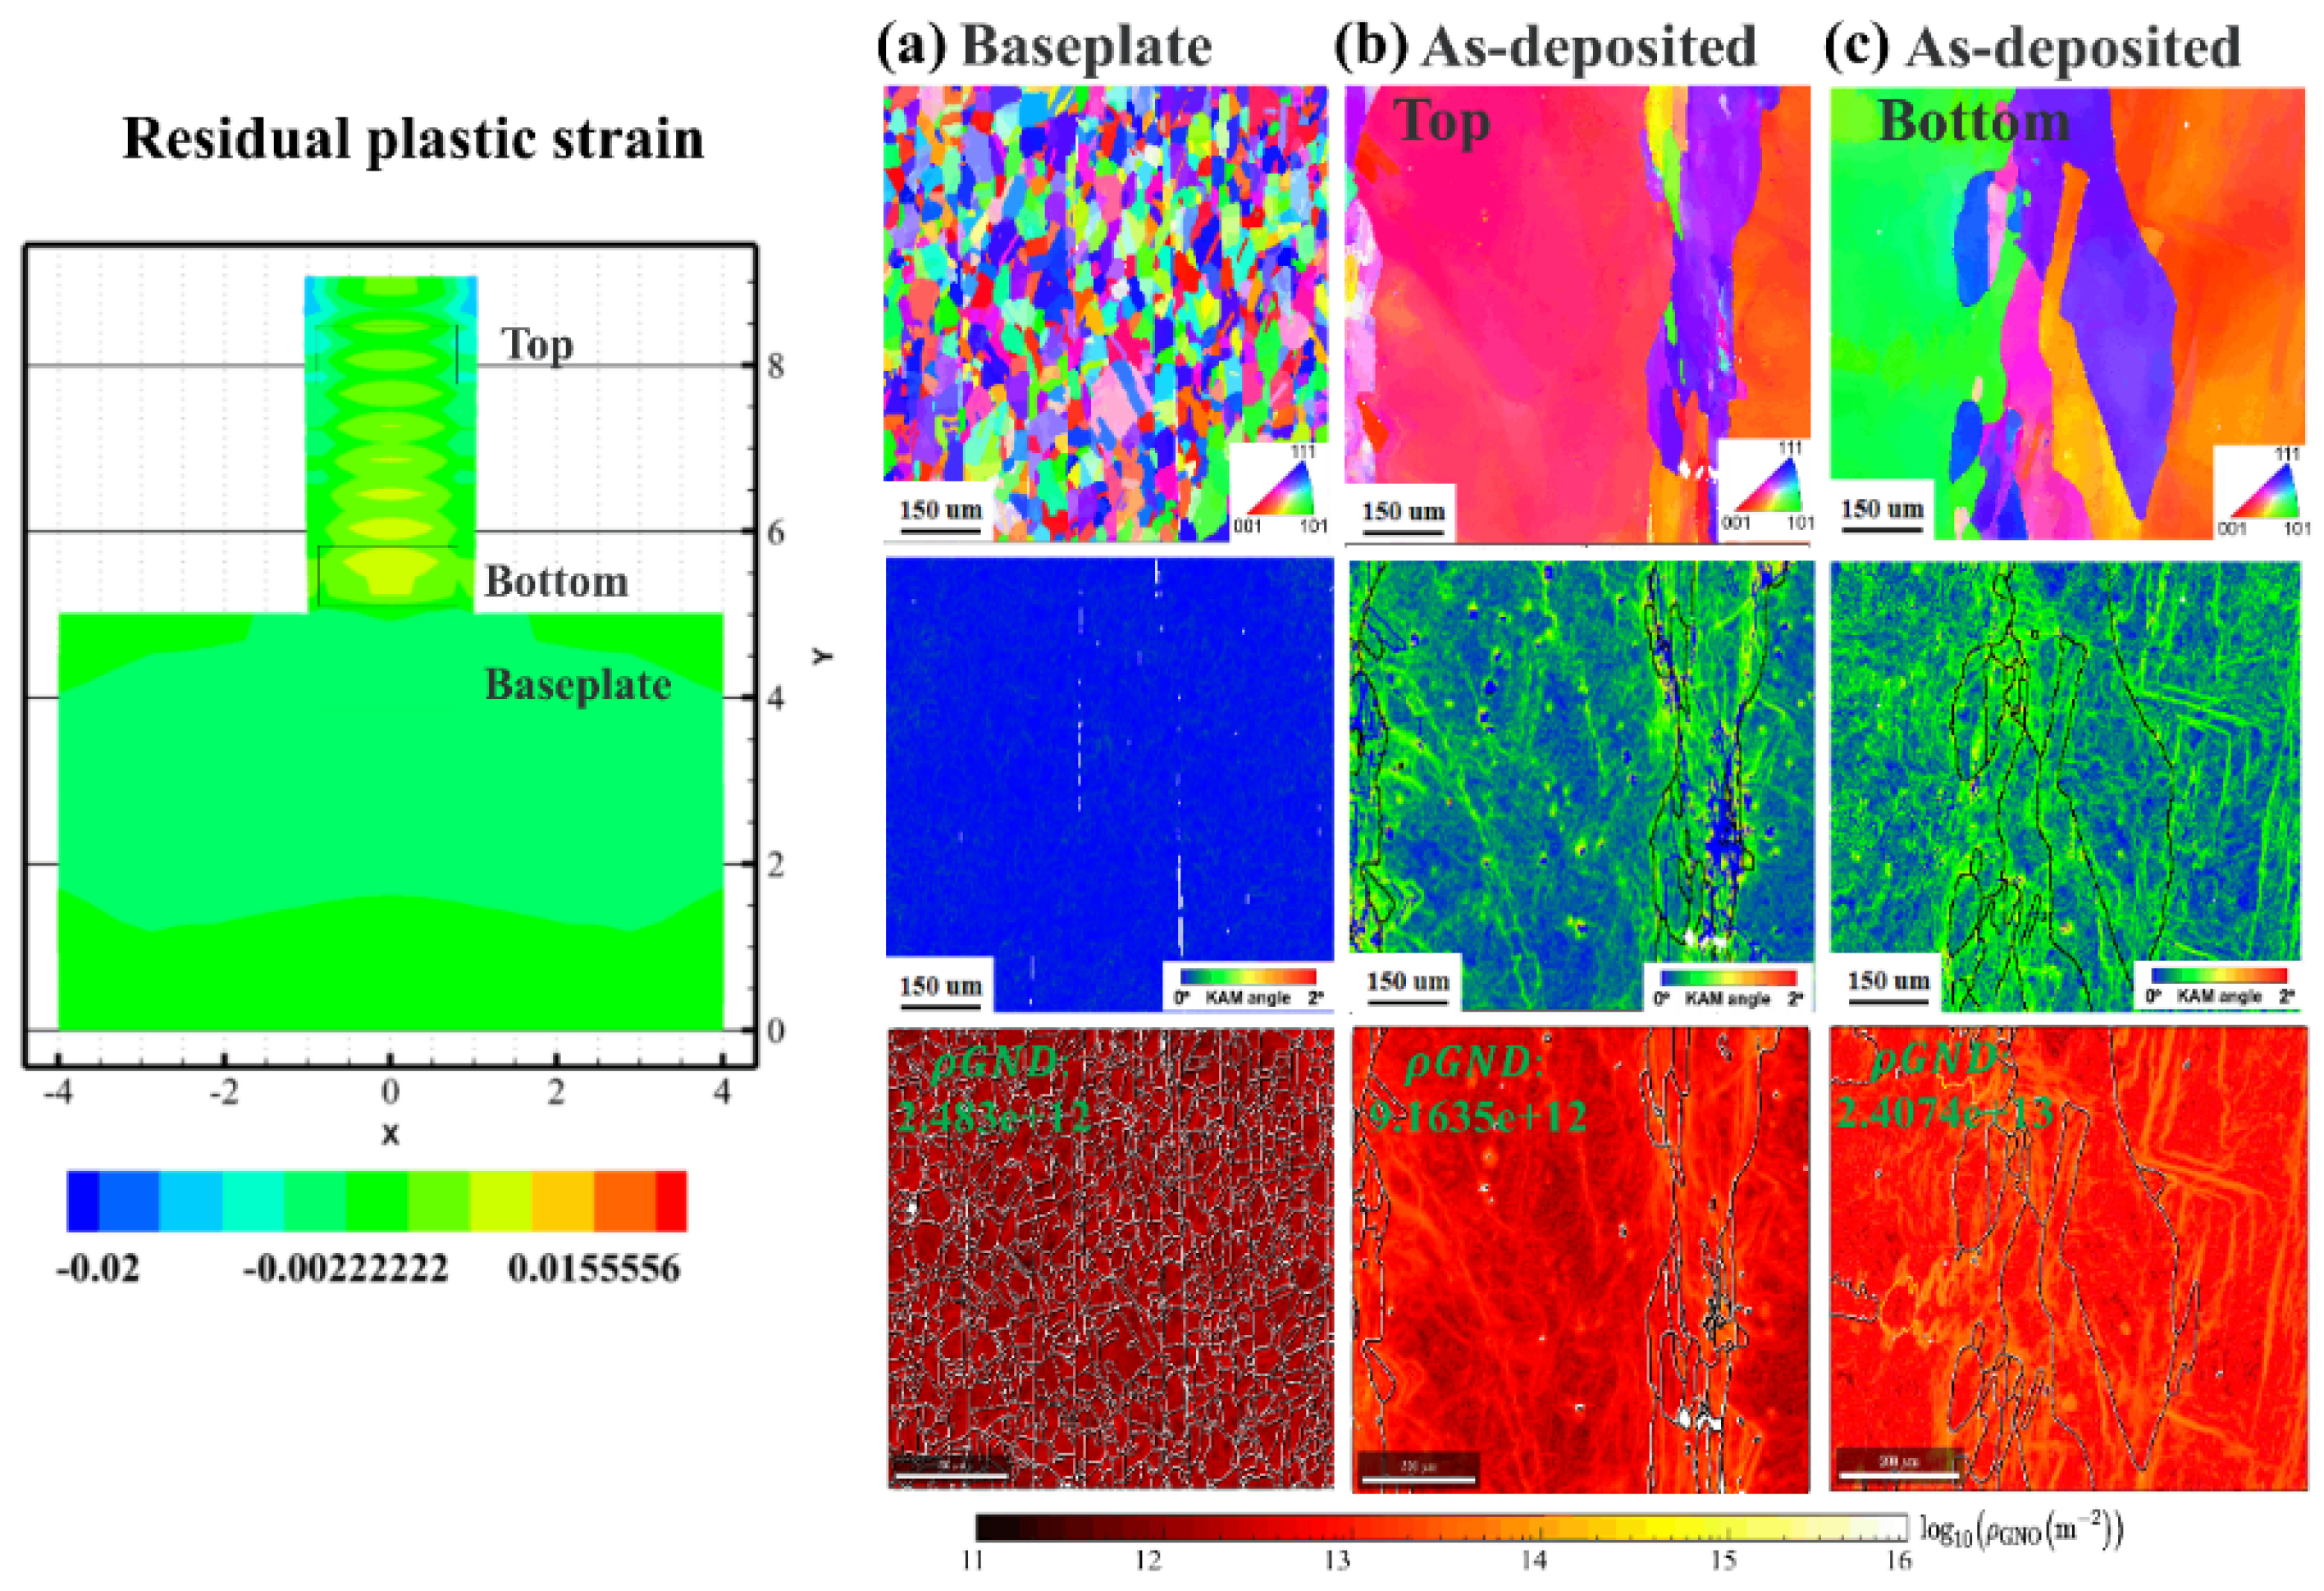
3.1. Thermo-Mechanical History

To elucidate the mechanism by which residual stress is generated in thin steel sheets during laser additive manufacturing, the influence of temperature changes on the additive manufacturing process’s transient thermodynamic behavior was investigated. Figure 2a shows the shape of molten pools in the DED additive process, and Figure 2b shows temperature–stress evolution curves at different locations. In the molten pool cross-section, four spots (0, 1, 2, and 3) in Figure 2a were successively chosen as the distance from the molten pool. The temperature–stress relationship curve for various positions is presented in Figure 2d. Point 1, Point 2, and Point 3 were placed in the center of the first track. For Point 1, we can see that as the temperature increases, the cladding metal will be impacted upon by a particular compressive stress, and when the peak temperature is 1850 °C, the cladding metal’s stress value is about −100 MPa. When the cladding metal solidifies from a liquid to a solid, the stress is very low, but when the temperature reaches 1100 °C tensile stress begins to appear. The temperature range known as “the brittleness temperature zone” is also a high-temperature crack-prone area; if the cladding metal’s tensile stress is greater than the cladding metal’s plastic stress, cracking may occur. The coating metal entirely solidifies as the temperature continues to fall. Once the laser spot exits, a high tensile tension is formed as the item cools to the ambient temperature. The residual tensile stress eventually reaches 180 MPa. The temperature–stress relationship curve might provide useful information for understanding crack creation mechanisms during the cladding process. Point 2 and Point 3, which are further away from the molten pool, undergo a similar temperature–stress evolution history and may avoid crack-sensitive areas due to lower peak temperatures.
In order to obtain the temperature evolution patterns under different thermal cycling conditions, in the single-track multilayer model, we took a point from the center bottom to the top of the model at approximately 1 mm intervals, named points A, B, C, D, and E. Figure 3a shows the thermal histories of the different points, Figure 3b is a partial enlargement of Figure 3a, Figure 3c shows the maximum temperature of the melt pool at t = 6.3 s, t = 6.35 s, and t = 6.4 s, and Figure 3d shows the FLIR A615 infrared thermal imager at t = 6.30 s, t = 6.35 s, and t = 6.40 s. As the number of printed layers increases, the temperature climbs layer by layer. This image records the change in the melt pool’s shape and the temperature for the last printed layer. The maximum temperature of the melt pool at t = 6.3 s, t = 6.35 s, and t = 6.4 s was 2098.7 °C, 2123.5 °C, and 2156.9 °C, respectively. The simulation results agree well with the experimental results of the infrared thermal imager. Figure 4 depicts the longitudinal residual stress distribution along the component direction. As can be observed, the simulation and experimental values are well matched, implying that the model can reasonably anticipate the distribution and development of residual stress and residual strain.

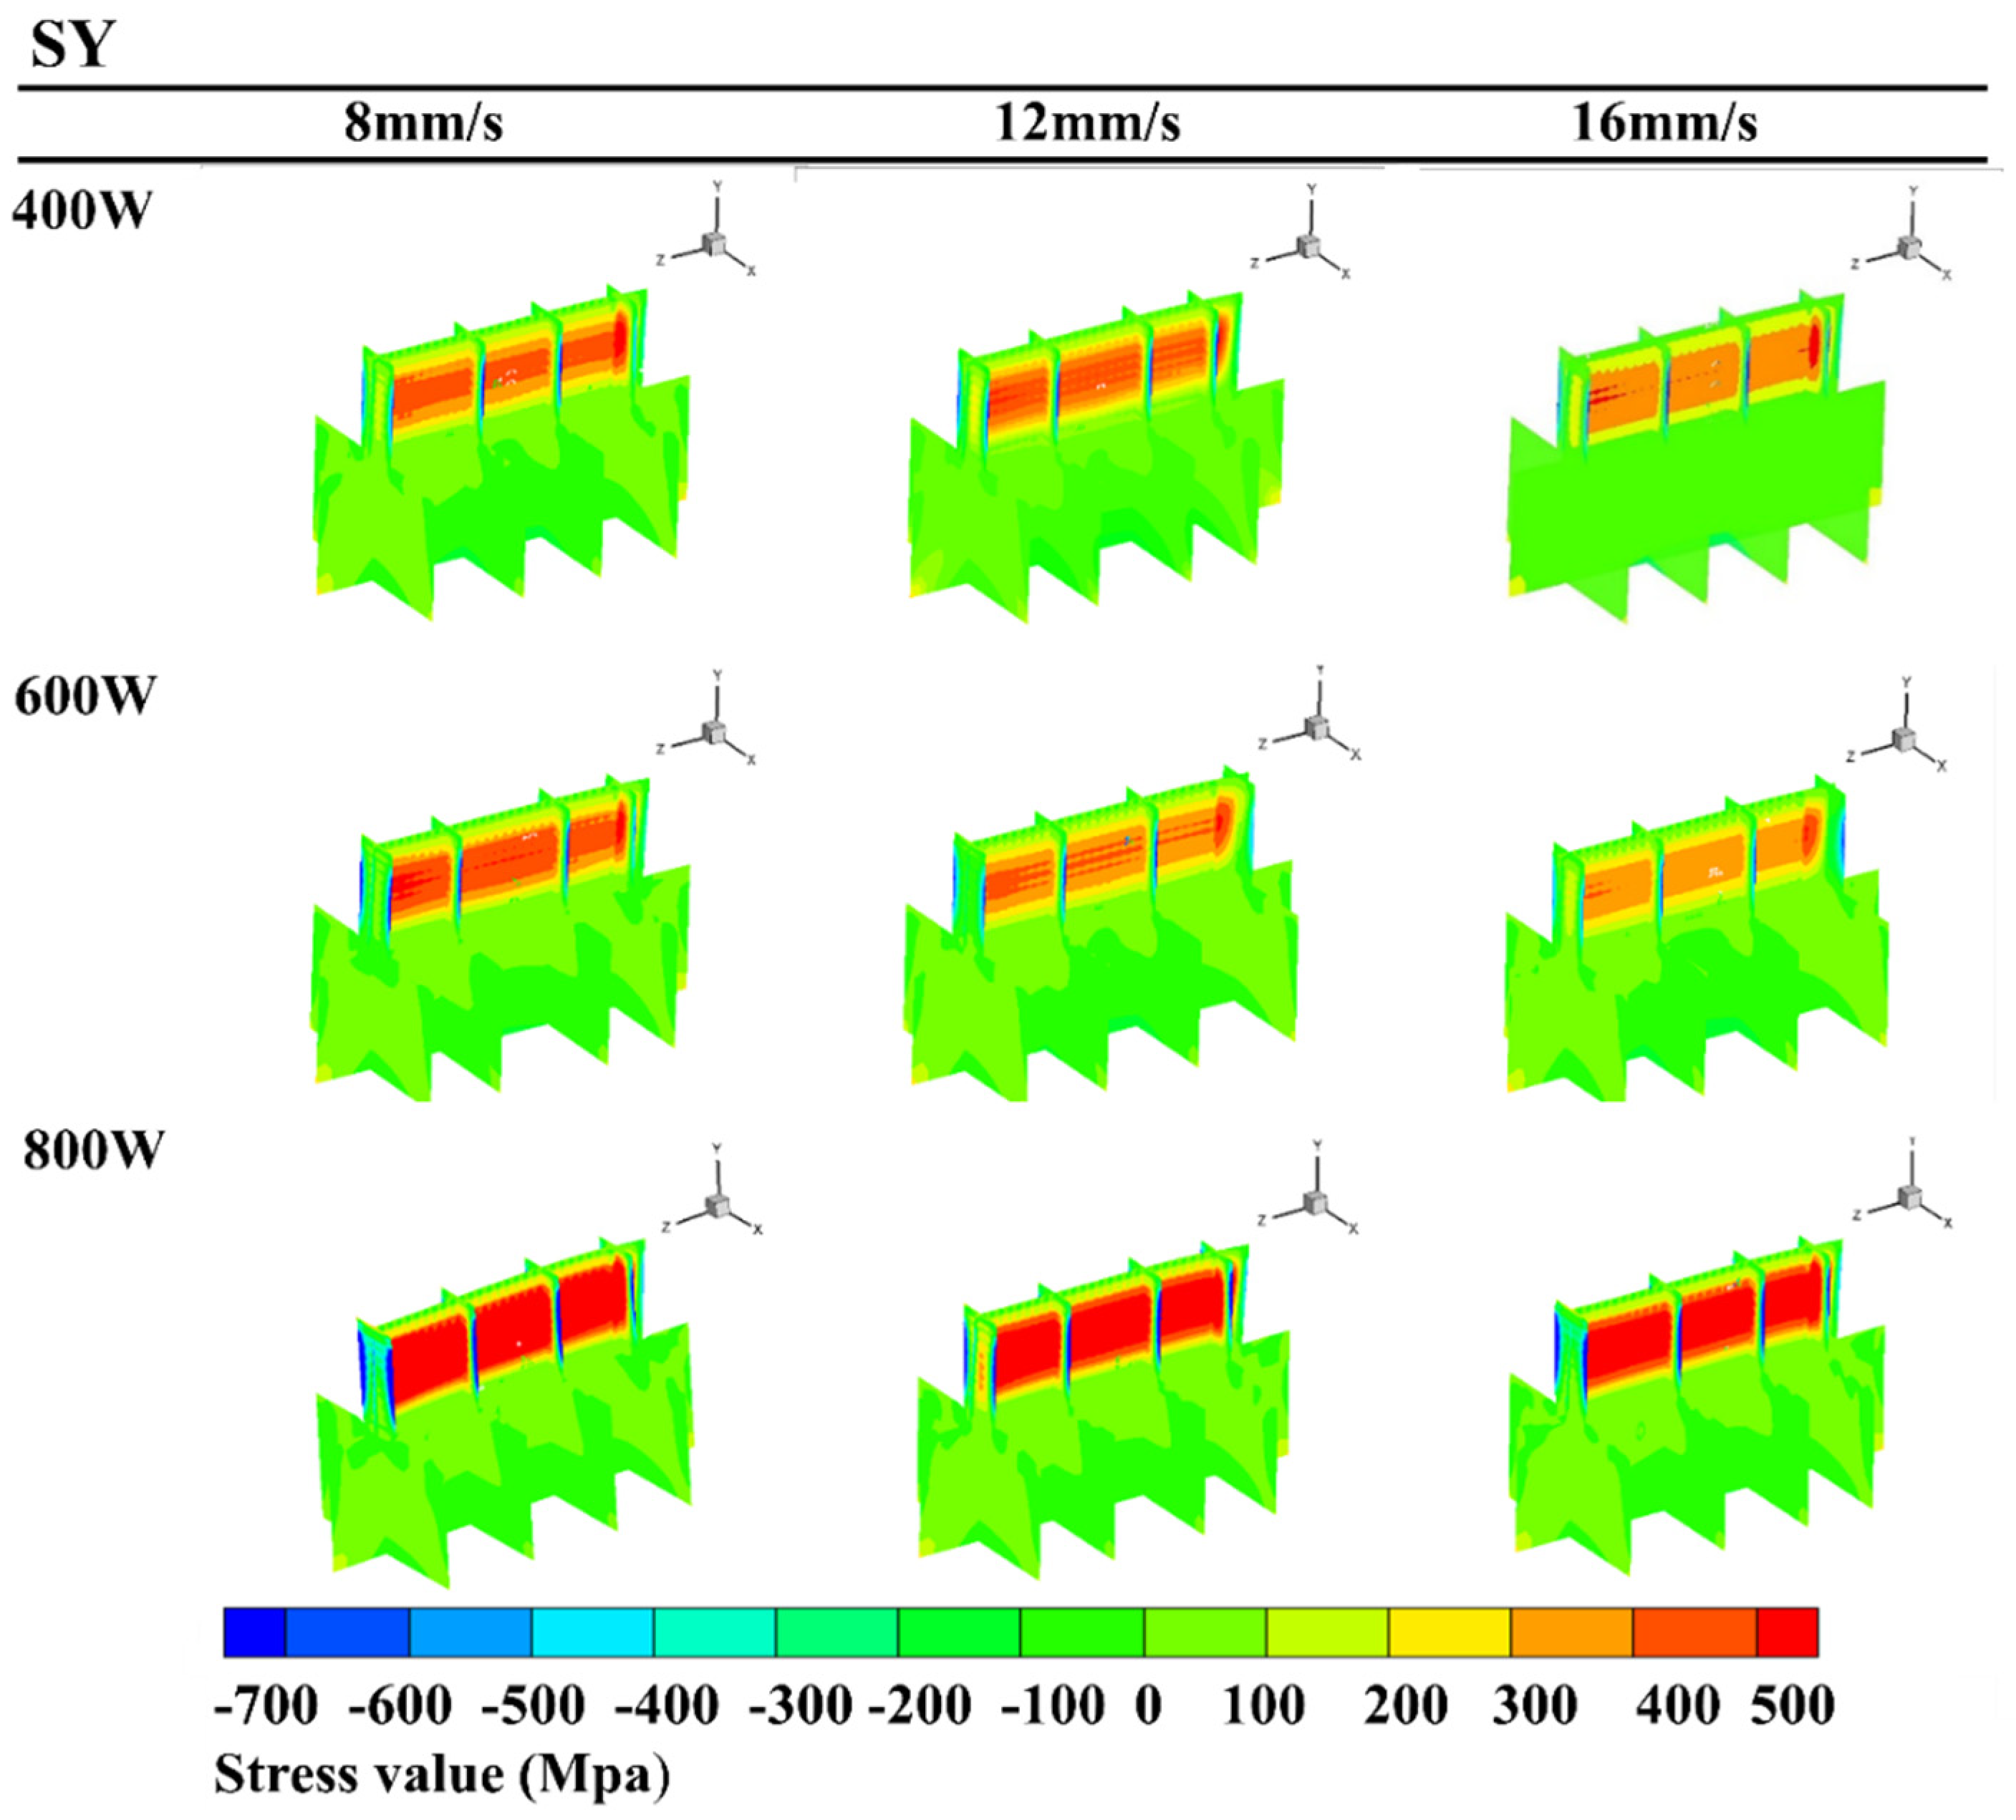
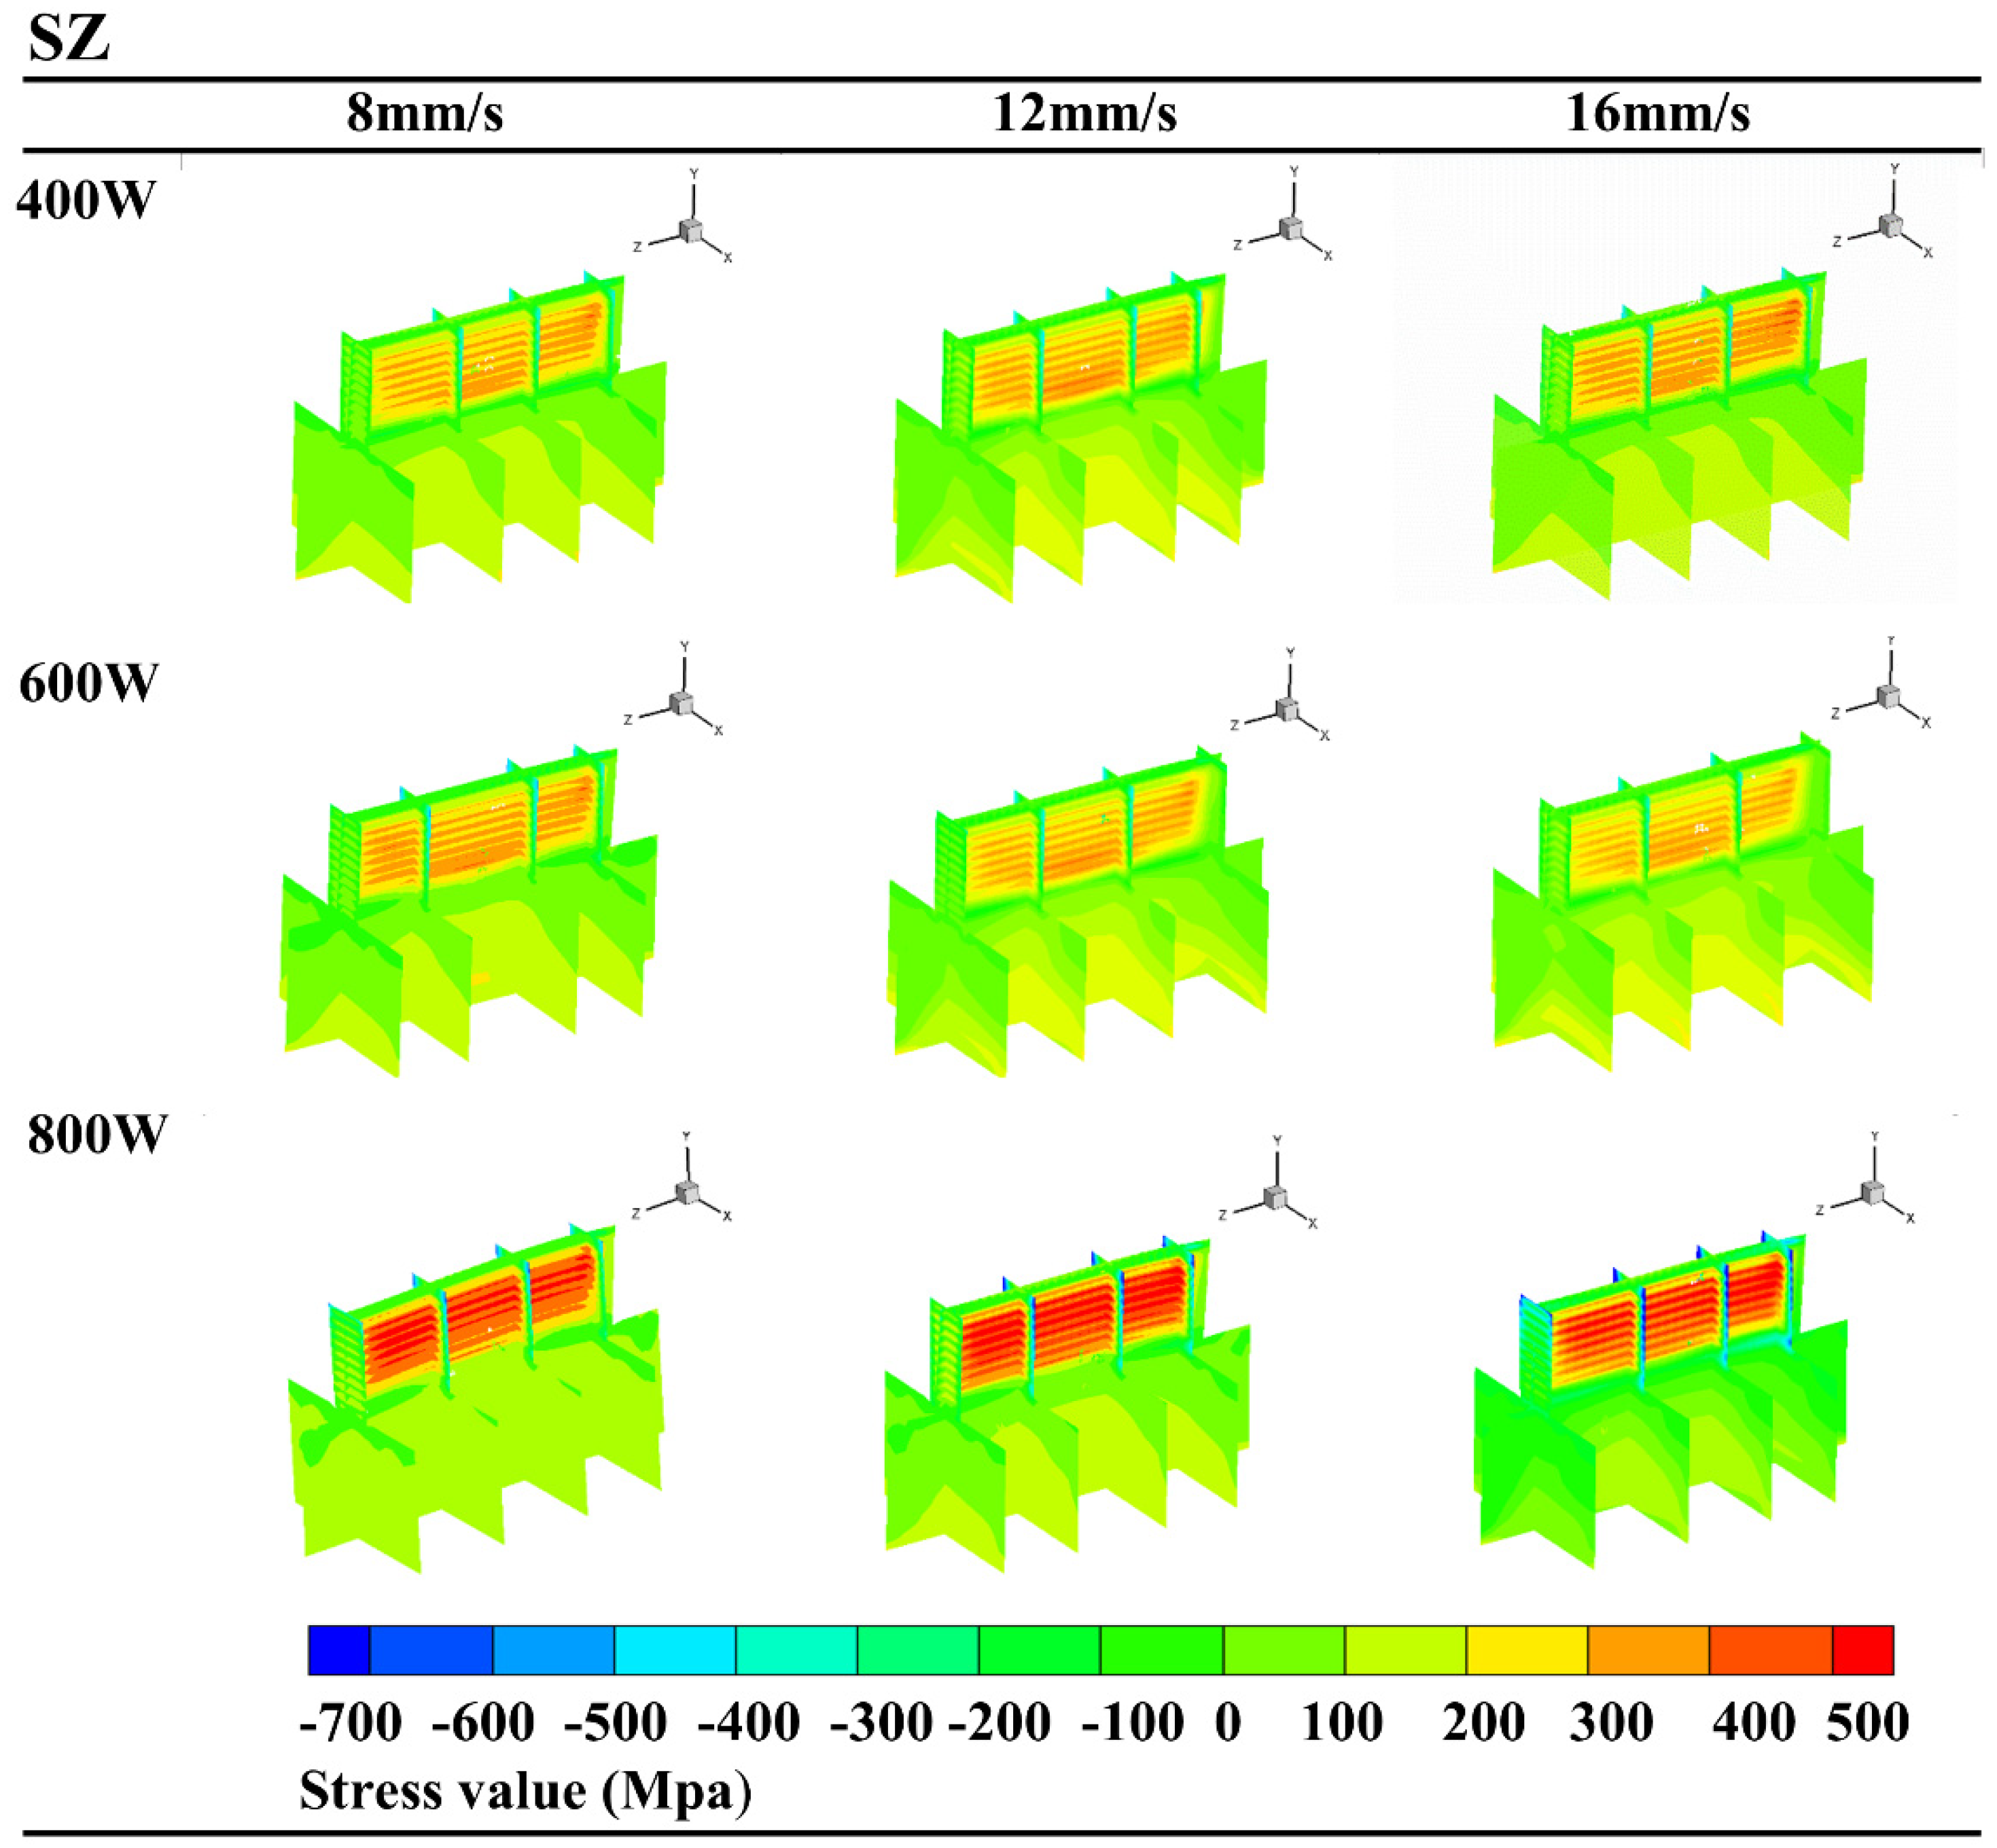
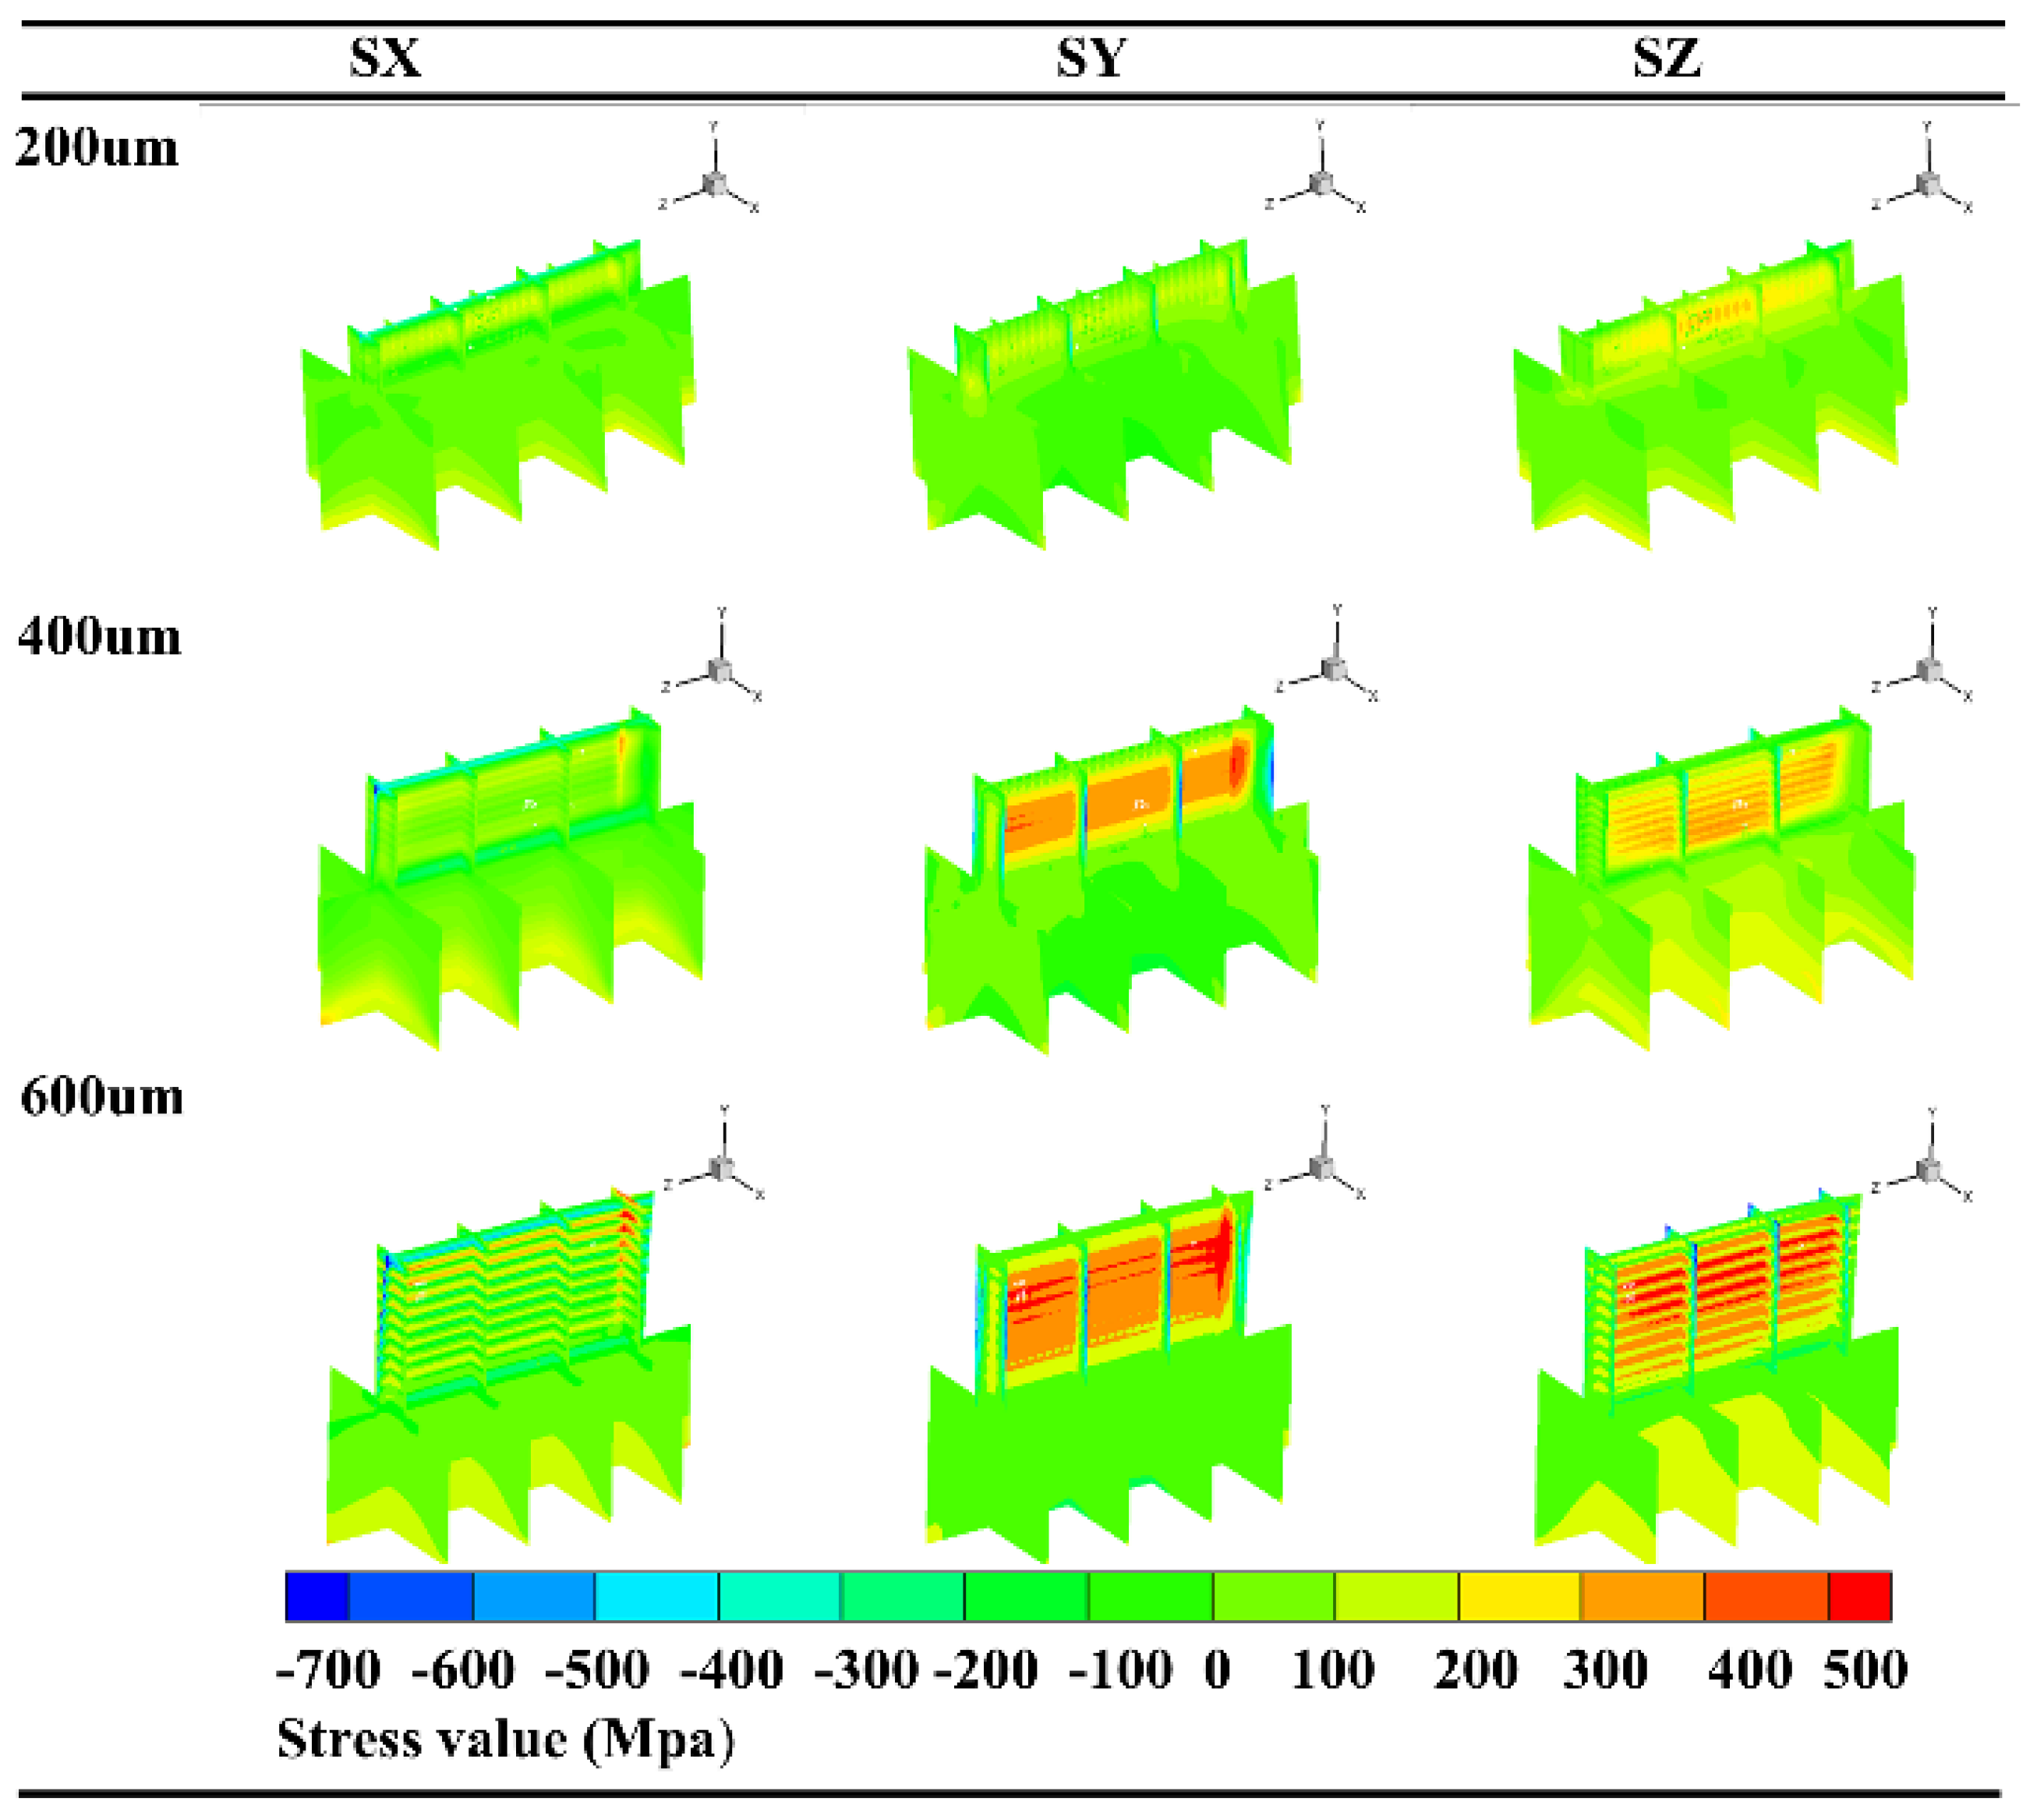
3.2. The Effect of Process Factors on Residual Stress

Figure 5 shows the SX, SY, and SZ stresses for Layer 1, Layer 4, and Layer 8 under a scanning speed of 16 mm/s, a laser power of 400 W, and a layer thickness of 400 μm. Figure 6, Figure 7, Figure 8 and Figure 9 show the distribution of the RS along the SX (transverse), SY (through-thickness), and SZ (longitudinal) directions under different process parameters. These findings lead to the following key conclusions. The largest through-thickness and transverse (tensile) RSs are towards the deposit’s top. The largest longitudinal (tensile) RS, on the other hand, occurs towards the deposit’s bottom. Table 5 describes the maximum RS of the orthogonal array experiment.
Figure 6 shows the transverse stress distribution at different scanning speeds and laser powers when the layer thickness is 400 μm. When the scanning speed is set at 8 mm/s, the residual stress first decreases as the laser power increases from 400 W to 600 W, and then increases as the laser power increases from 600 W to 800 W. However, when the scanning speed is 16 mm/s or 12 mm/s, the maximum residual tensile stress increases linearly with the increase in the laser power from 400 W to 800 W, and the maximum residual compressive stress also increases linearly. The findings demonstrate that the RS behavior is diverse as the laser power increases under various scanning speeds. Moreover, comparable stress distribution laws can be found in Figure 7 and Figure 8. Figure 7 shows the stress distribution in the thickness direction under different scanning speeds and laser powers when the layer thickness is 400 μm. However, when the scanning speed is set at 8 mm/s, the residual stress increases linearly with the increase in the laser power from 400 W to 800 W, and the high-stress region also increases. However, when the scanning speed is 16 mm/s or 12 mm/s, the maximum residual tensile stress firstly decreases and then increases with the increase in the laser power from 400 W to 800 W, which is nonlinear. Figure 8 shows the longitudinal stress distribution at different scanning speeds and laser powers when the layer thickness is 0.4 mm. However, when the scanning speed is set at 8 mm/s, the residual stress increases linearly with the increase in the laser power from 400 W to 800 W, and the high-stress region also increases. However, when the scanning speed is 16 mm/s or 12 mm/s, the maximum residual tensile stress firstly decreases with the increase in the laser power from 400 W to 600 W and then increases with the increase in the laser power to 800 W, and the residual tensile stress region also increases. It can be seen that when the longitudinal stress is 16 mm/s or 12 mm/s, the maximum residual tensile stress firstly decreases and then increases with the increase in the laser power, which is nonlinear.
Figure 9 depicts the stress distributions under various layer thickness conditions when the laser power is 600 W and the scanning speed is 16 mm/s. When the layer thickness is increased, the residual stresses at the interfaces of the two subsequent layers change from tensile to compressive, as can be seen in these Figures. In the last stage, the transverse residual stresses shown in Figure 10 are compressive in the deposit’s interior and tensile towards the beginning and end of the deposit at the substrate deposit interface. These calculated stress data may be relevant in the future for studying deposit delamination from the substrate, layer separation, and bending.

3.3. Reducing Residual Stress through Optimization

Despite the fact that a large number of studies have examined patterns and evaluated the influencing factors, a pattern evaluation and optimization criterion that combines these factors is lacking. This study provides a quantitative sensitivity analysis for evaluating the effects of laser power, scanning speed, and deposition thickness on the residual stress in additive manufacturing processes. The D-MORPH regression has the benefit of being able to solve linear algebraic equations with a small number of sample points [30].
In variance-based global sensitivity analysis, the global sensitivity coefficient is a parameter that reflects the contribution rate of the coupling between input variables to the system output response. The first-order sensitivity coefficient represents the independent contribution rate of input variable X i to the system output response, and the second-order sensitivity coefficient represents the contribution rate of the coupling between input variables X i and X j to the system output response. Only the second-order sensitivity coefficient is considered here. The expression is:
S X i = V X i V
S X i , X j = V X i , X j V
where V is the sum of variances in the system output responses, V X i represents the partial variance in the system input variable X i , and V X i , X j represents the partial variance in the first-order coupling term of the system input variables X i and X j . The specific derivation and calculation processes of the formula can be found in [30].
Based on the above, the global sensitivity analysis approach based on D-MORPH-HDMR was utilized to quantitatively examine the degree of the effect of laser power, scanning speed, and layer thickness on the SX, SY, and SZ residual stresses in single-pass layers.
S = [ S X 1 S X 1 , X 2 S X 1 , X 3 0 S X 2 S X 2 , X 3 0 0 S X 3 ]
The system input variables were defined as the thickness of the deposited layer, the laser power, and the scanning speed, which are numbered X1, X2, and X3, respectively. The system output responses are the SX, SY, and SZ residual stresses in the single-pass deposited layer, respectively. By inputting multiple groups of data samples from a single deposition process experiment into the program of the global sensitivity analysis algorithm based on D-MORPH-HDMR, the global sensitivity coefficient matrix S of the geometric dimensions of a single deposition layer was obtained.
S X X = [ 0.391 0.0425 0.0705 0 0.0626 0.3988 0 0 0.0346 ]
S Y Y = [ 0.2357 0.0931 0.1906 0 0.1518 0.2745 0 0 0.0543 ]
S Z Z = [ 0.1305 0.1028 0.2828 0 0.2506 0.1627 0 0 0.0706 ]
Figure 10 shows the degree of influence of the three input variables (process parameters) (deposition layer thickness, L; laser power, P; and scanning speed, v) on the residual stress during single-pass multilayer deposition. The influence of the three input variables (process parameters) on the residual stresses in SX is L > P > v, where the degree of influence of the deposition layer thickness, laser power, and scanning speed is 39.1%, 6.26%, and 3.46%, respectively, the sum of the independent contributions of P, v, and L is 48.82%, and the sum of the two coupling effects of P, v, and L on the residual stresses in SX is 51.18%. The degree of influence of the three input variables (process parameters) on the SY residual stresses is L > P > v, where the degree of influence of the deposition layer thickness, laser power, and scanning speed is 23.57%, 15.18%, and 5.43%, respectively, the sum of the independent contributions of P, v, and L is 44.18%, and the sum of the two coupling effects of P, v, and L on the SY residual stresses is 55.82%. In contrast, the degree of influence of the three input variables (process parameters) on the SZ residual stresses is P > L > v, where the degree of influence of the deposition layer thickness, laser power, and scanning speed is 13.05%, 25.06%, and 7.06%, respectively, the sum of the independent contributions of P, v, and L is 45.12%, and the sum of the two coupling effects of P, v, and L on the SZ residual stresses is 55.88%.
As mentioned above, several process parameters (deposition layer thickness, L; laser power, P; and scanning speed, v) that are controversial with respect to residual stresses in the current state of research on direct energy single-pass multilayer deposition of 316L austenitic stainless steel were analyzed. It can be concluded that these process parameters have the greatest degree of influence on SX residual stress, SY residual stress, and SZ residual stress. Nevertheless, the sum of the effects of the two parameters coupled together is much greater than the sum of the independent contributions of each parameter in any one direction, including the average residual stress. According to the theory of temperature gradient (TGM)-induced thermal stress, the process parameters are influenced by simultaneous temperature field changes, and their effects on the end-state residual stresses are indirectly related. By mapping the complex process parameters, we obtained nine groups of test windows (L, 200–600 μm; P, 400–800 W; and v, 8–16 mm/s) by designing orthogonal experiments to reduce the average residual stress of the parameters in the second and third groups more effectively. Based on the analysis of the results of the D-MORPH-HDMR multifactorial influencing factors, the degree of influence of the process parameters on the residual stress was further quantified considering the important role of the coupling of different parameters. For the DED of thin-walled parts formed from austenitic stainless steel, the selection of a lower deposition layer thickness L (200 μm), a moderate laser power P (600–800 W), and a higher scan rate v (12–16 mm/s) is of great significance to the reduction of residual stresses in the workpiece.

3.4. Structural Characterization of Post-Solidification-Related Stress

As is well known, additively made components are generally classified as having a cross-scale heterogeneous structure induced by non-uniform temperature gradients and rapid melting (103–106 K/s for the cooling rate). According to our past research [39], fine-scale TEM and meso-scale EBSD revealed multi-scale heterogeneous structures in additive manufacturing products made up of grains, nano-oxides, dislocations, and chemical cells. Smith et al. [31] used the phenomenological welding model theory to describe the formation of oxide inclusions, micro segregations, grains, and dislocation substructures in austenitic stainless steels during deposition. They claimed that the dislocation structure is connected to the thermo-mechanical history and residual stresses during DED processing, rather than the initial material composition. Liu et al. [33] proposed that all microscopic structures are divided into solidified structures and post-solidified structures before and after the solidification time according to a time scale. Post-solidified structures are related to the residual thermal stress and transient strain. The intricate thermal history only prints solidification microstructures on metals when melting occurs, as illustrated schematically in Figure 11a. Figure 11b–f show the solidification structures, which are grain, solidified cell, and nano oxide structures, respectively. In this work, we named the above-mentioned heterogeneous multiscale microstructure related to residual stress the ‘post-solidification’ organization as shown in Figure 11. Post-solidification consists mostly of dislocation and dynamic recrystallization structures as shown in Figure 11e,f, which will be studied in detail in subsequent sections.

3.5. Dislocation Density

Figure 12 shows the strain component images of different regions and the necessary geometric dislocation (GND) density mapping for the EBSD analysis of (a) the baseplate zone, (b) the top zone, and (c) the bottom zone. According to GND arrays, several articles have demonstrated that EBSD date-gauged kernel-averaged misorientation (KAM) may be used to predict GND. The strain slope hypothesis [58,59,60] states that the density of GNDs can be expressed as follows:
ρ GND = 2 θ u b
where ρGND denotes the GND density, u denotes the scanning step (1 μm), the local misorientation is given by θ, and b denotes Burger’s vector. The mean ρGND of the bottom, top, and baseplate parts were 2.40 × 10¹³ m2, 9.14 × 10¹² m2, and 2.48 × 10¹² m−2, respectively.
The peak plastic strain magnitudes are predicted to occur at the interfaces between successive layers and are usually greater closer to the substrate as shown in Figure 12. The experimental results shown in Figure 12 also support this tendency, with dislocation concentrations around the substrate. Thus, the modeling and observations reveal that the substrate’s thermo-mechanical restriction creates gradients in the microstructure and characteristics, with greater plastic strain accumulating close to the baseplate. To create more complex geometries, this phenomenon is important because the mechanical performance of an adjacent layer is affected by the limitation of an underlying layer, such as the substrate.

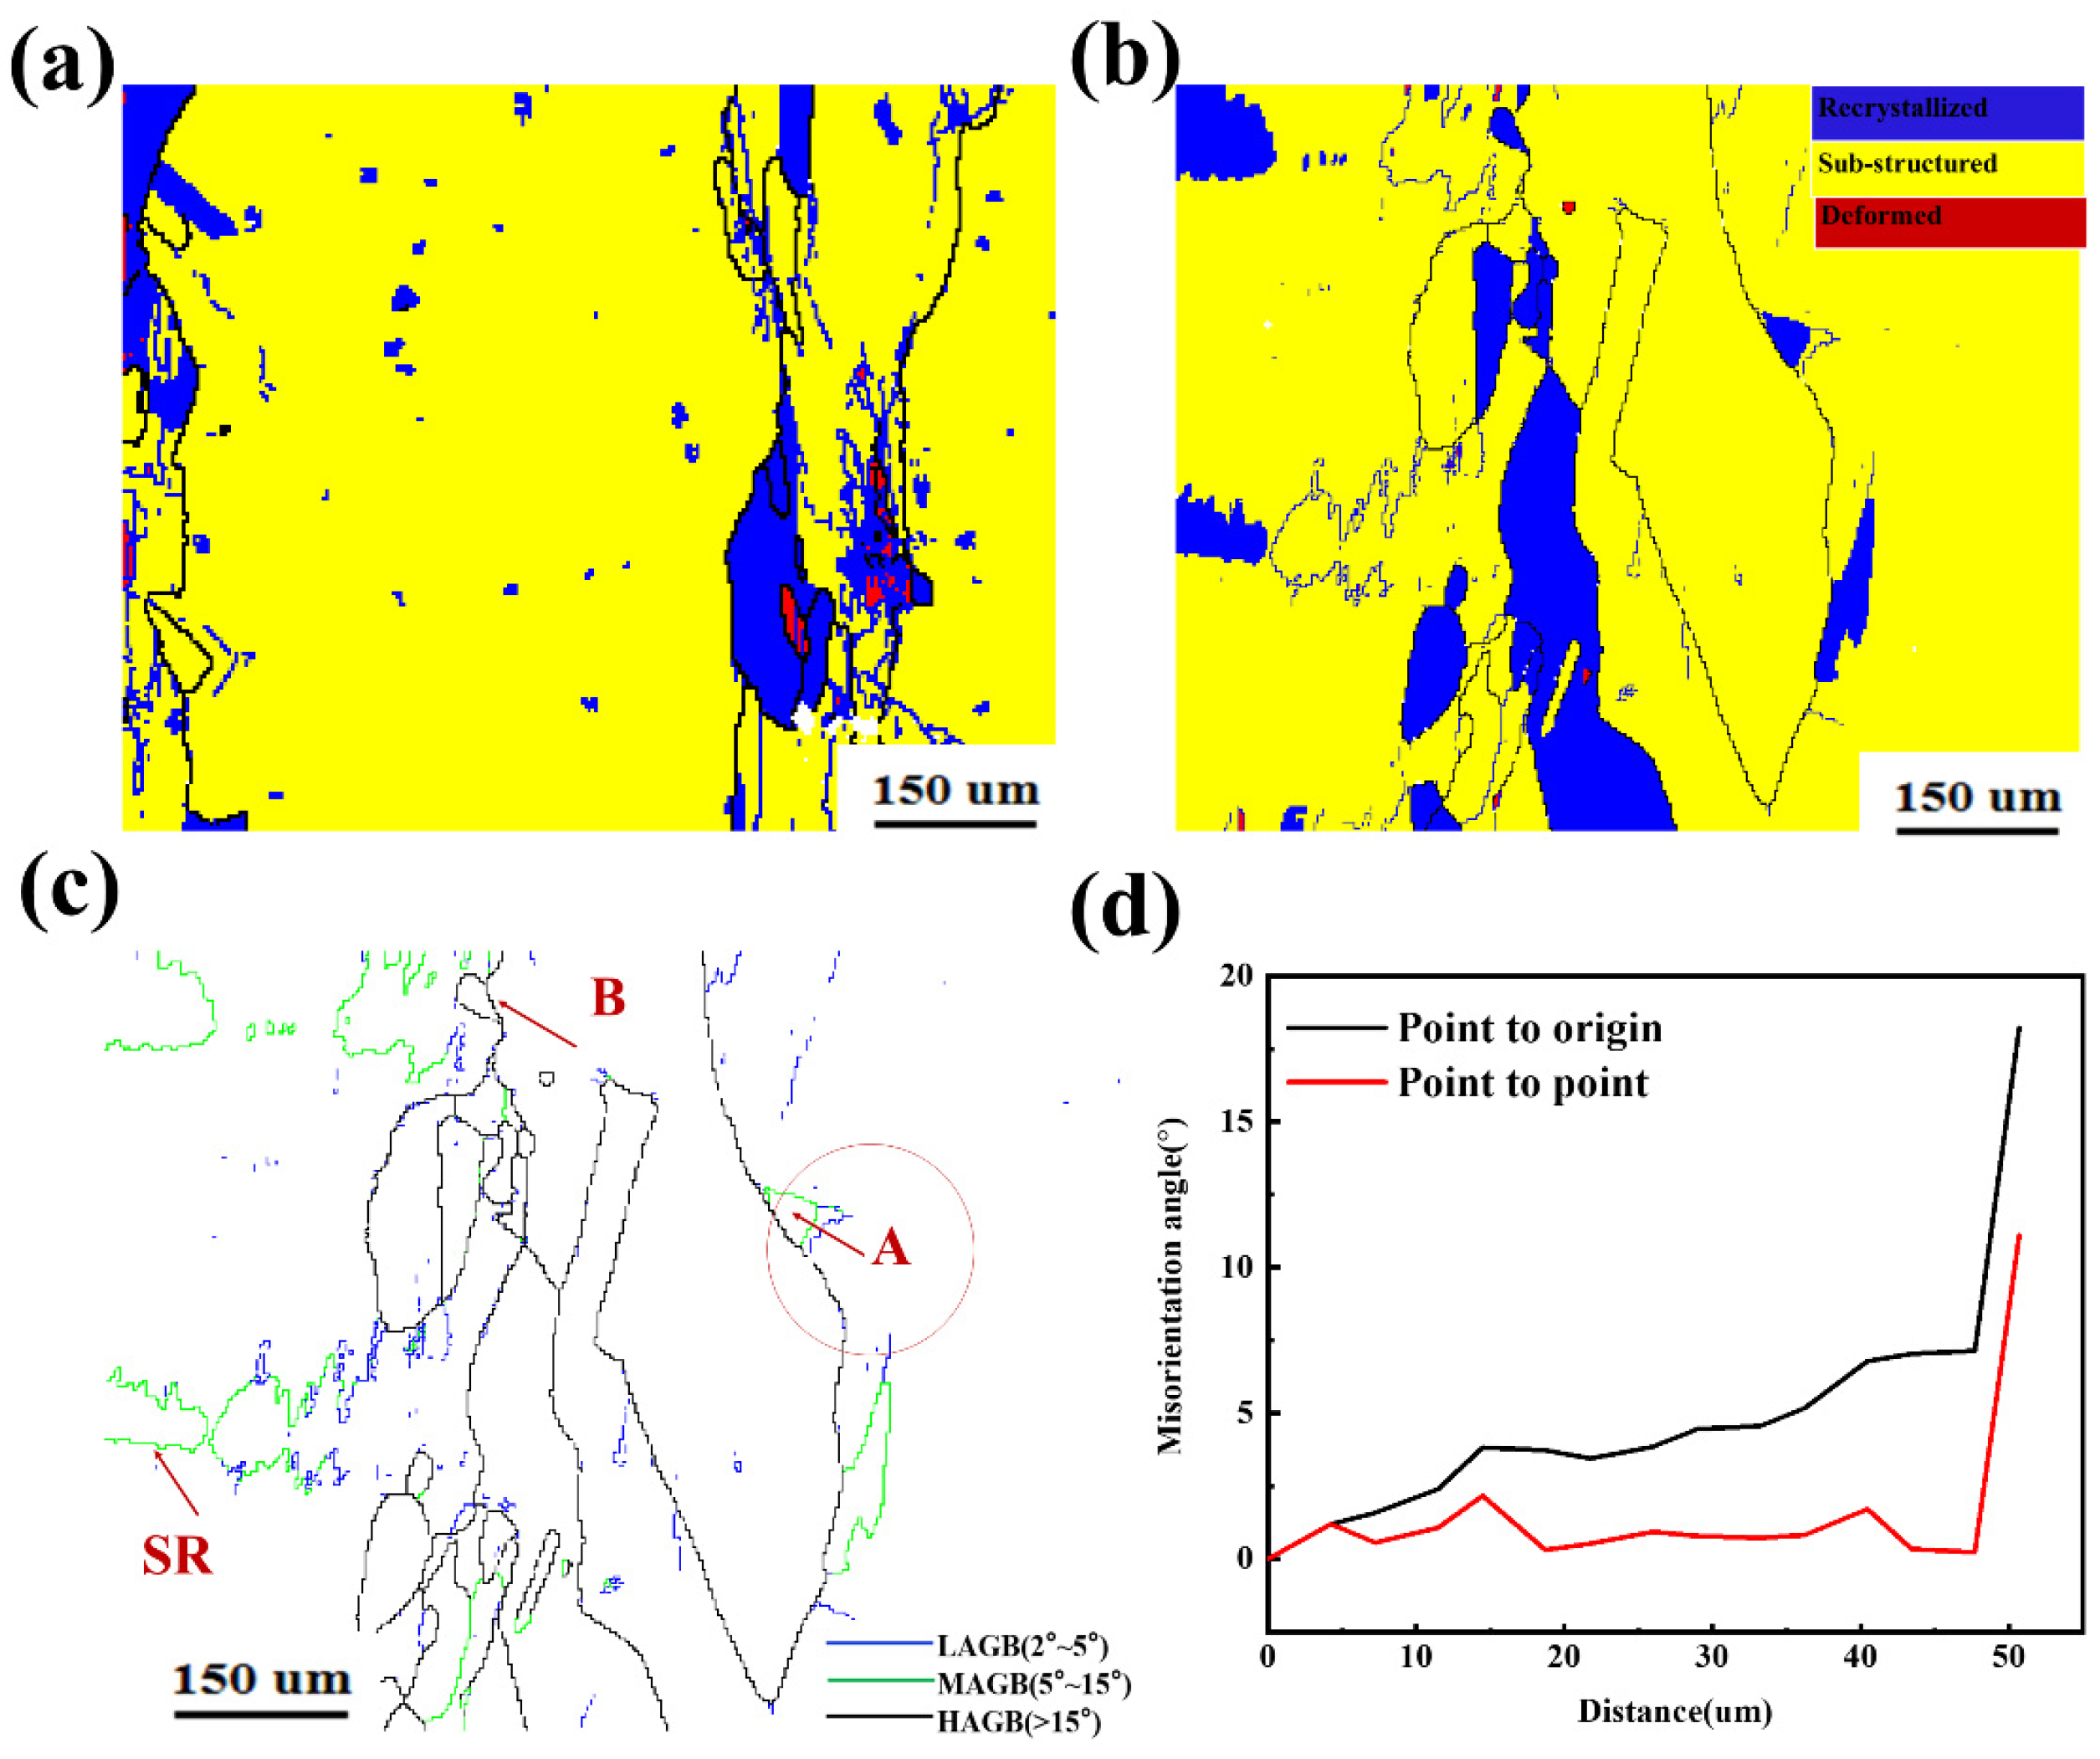
3.6. Dynamic Recrystallization Behavior

Recently, Wang et al. [61] revealed that dynamic recrystallization arises during the tensile distortion of a single crystal, in addition to dislocation slipping and deformation twins, resulting in a greater strength–ductility combination. Nevertheless, Sabzi et al. [44] revealed that DRX occurs during the entire AM process with no post-distortion. Additionally, they demonstrated that a contraction caused by heat loss during cooling results in significant plastic deformation (SPD) at ultra-high strain rates during L-PBF. Since the cooling rate during DED processing is much lower than that during L-PBF [62], to the best of the authors’ knowledge, there remains a gap in the literature on in situ dynamic recrystallization during DED of austenitic stainless steels. So, we used transmission electron microscopy (TEM), EBSD, and Transmission Kikuchi Diffraction (TKD) to study the dynamic recrystallization mechanism of DED-processed austenitic stainless steels in this work.
As can be seen in Figure 13a,b, the EBSD’s recrystallization module [44,45] may be used to map the distribution of recrystallized grains in disparate zones of a cladding sample. Recrystallization occurs in the blue area whereas deformation occurs in red areas. The top areas of the deposit had recrystallization volumes close to ten percent, whereas the bottom zone had recrystallization volumes in the range of roughly twenty percent. Additionally, the recrystallized grains were smaller in size, and most grains were distributed along grain boundaries, with some microscopic recrystallized grains forming inside larger grains.
For CDRX to work, it must first generate LAGBs or perform dynamic recovery. When grains in polycrystalline materials are not compatible, GNDs are formed. When dislocations are further distorted, they might develop geometrically necessary boundaries that are crucial to their structure. The misorientation angle of HAGBs climbs to 15 degrees as a consequence of the increasing strain, which is the critical threshold for the dislocation density. CDRX is therefore formed as a result of the continuous development and conversion of LAGBs to HAGBs [63]. As can be seen in Figure 13c, microstructural properties of discontinuous DRX (DDRX) and continuous DRX (CDRX) activities may be present in the orientation imaging microscopy (OIM) maps of the bottom zone of the deposit. Grain boundaries of high and low angles are drawn in black and blue lines, respectively, on the OIM maps. Grains with misorientation angles of greater than 15 degrees are referred to as HAGBs, whereas grains with misorientation angles of 2 to 5 degrees are referred to as LAGBs. The green lines on the OIM maps depict medium-angle grain boundaries (MAGBs), which have misorientation angles ranging from 5 to 15 degrees. Details of the misorientation analysis for line A in Figure 13c are depicted in Figure 13d. Figure 13d demonstrates that the majority of the point-to-point misorientations are less than 2 degrees, but accumulated misorientations from the originating point are greater than 10 degrees. SGBs can rotate to create HAGBs because of this buildup of misorientations between a grain and a grain border, which leads to an increase in the gradient of the misorientation. During the CDRX process, the dislocations pile up and are rearranged to produce a dislocation wall, as can be seen in Figure 14a.
Around the original grain boundaries, many tiny dynamically recrystallized grains are visible in Figure 13a, and these freshly manufactured grains are composed of HAGBs. The shape of the grain boundaries suggests that the nucleation mechanism is DDRX, which is driven by strain-induced grain boundary migration. TEM images of newly generated recrystallized grains are clearly shown in Figure 14. The recrystallized grains predominantly form and grow at the original grain borders and the trigeminal grain boundaries. In contrast to the deformed area, which is crowded with dislocations, the DDRX grains are absent of or contain just a few dislocations. The arrow labeled ‘B’ in Figure 13c indicates the typical microstructural features of the DDRX, which include bulging and jagged original grain boundaries. The TKD images shown in Figure 15a,b depict the findings. The red, yellow, and blue sections depict deformed, sub-structured, and recrystallized grains, respectively. The observed DRX grains range in size from 50 nm to a few micrometers. Additionally, dislocations were released following the occurrence of DRX, and the recrystallized grains exhibit no deformation on the KAM distribution map. According to the Zener–Holloman equation [64], recrystallized grains of nanometer size and those larger than a micron may be in different stages of DDRX nucleation and growth, respectively.
DDRX, in general, arises discontinuously through separate nucleation and growth stages [44]. The concomitant occurrence of DDRX and CRDX in our research during DED can be expressed as follows. Bulging occurs at the initial stage of DDRX, such as nucleation, when the geometrically required boundaries, or LAGBs, are formed close and normal to the existing HAGBs. By generating LAGB borders behind them, the bulging functions as a nucleation location for DDRX grains [45]. The following conditions must exist in order for DDRX to occur [65]:
ρ m / ε . > 2 γ C B / K M L s G b 5
where ρ m is the GND density, ε . is the strain rate of induced deformation, G is the shear modulus, K is a constant, M is the mobility, Ls is the mean slip distance of the dislocations, and B is Burger’s vector magnitude off the shear modulus. As in the principle (17), a critical value of ρ m / ε . must be met in order for DDRX to occur. A high-speed cooling rate during solidification causes DED to produce a high GND density. For this reason, the dislocation density of the as-deposited 316L is higher than that of conventional as-cast samples, allowing for the nucleation of DDRX grains during the post-solidification of DED samples.
As mentioned above, the bottom of the sample underwent more thermo-mechanical cycles than the top, leading to a higher dislocation density. In addition, multiple cycles would also lead to lower strain rates. Therefore, it can be inferred from the formula ρ m / ε . that DDRX is more likely to occur in the bottom area than in the top area as seen in Figure 13a,b.
The above analysis suggests that these small equiaxed grains may have been created by the DDRX and CDRX processes, which were both triggered by the cyclic thermal stress generated by repetitive laser cladding. The key mechanisms behind the DDRX and CDRX phenomena were bulging of the original grain boundaries and progressive sub-grain rotation, respectively. It is worth noting that in the DED process, the heating/cooling thermal mechanical cycle may result in the formation of a new sample recrystallization grain size, which relies on the power input, scanning speed, layer thickness, etc. Controlling the development of recrystallization is critical to the performance of austenitic stainless steels and should be the focus of future research.

4. Conclusions

In this paper, the D-MORPH-HDMR global sensitivity analysis method was combined with a finite element model to construct a new residual stress optimization framework, which was used to investigate the effects of processing parameters (deposition layer thickness, L; laser power, P; and scanning speed, v) on RS. Additionally, the residual-stress-induced post-solidification structures, including submicron-scale dislocation cells and dynamic recrystallization (DRX), that formed during the directed energy deposition (DED) of the austenitic stainless steels were analyzed. Our main conclusions are as follows:
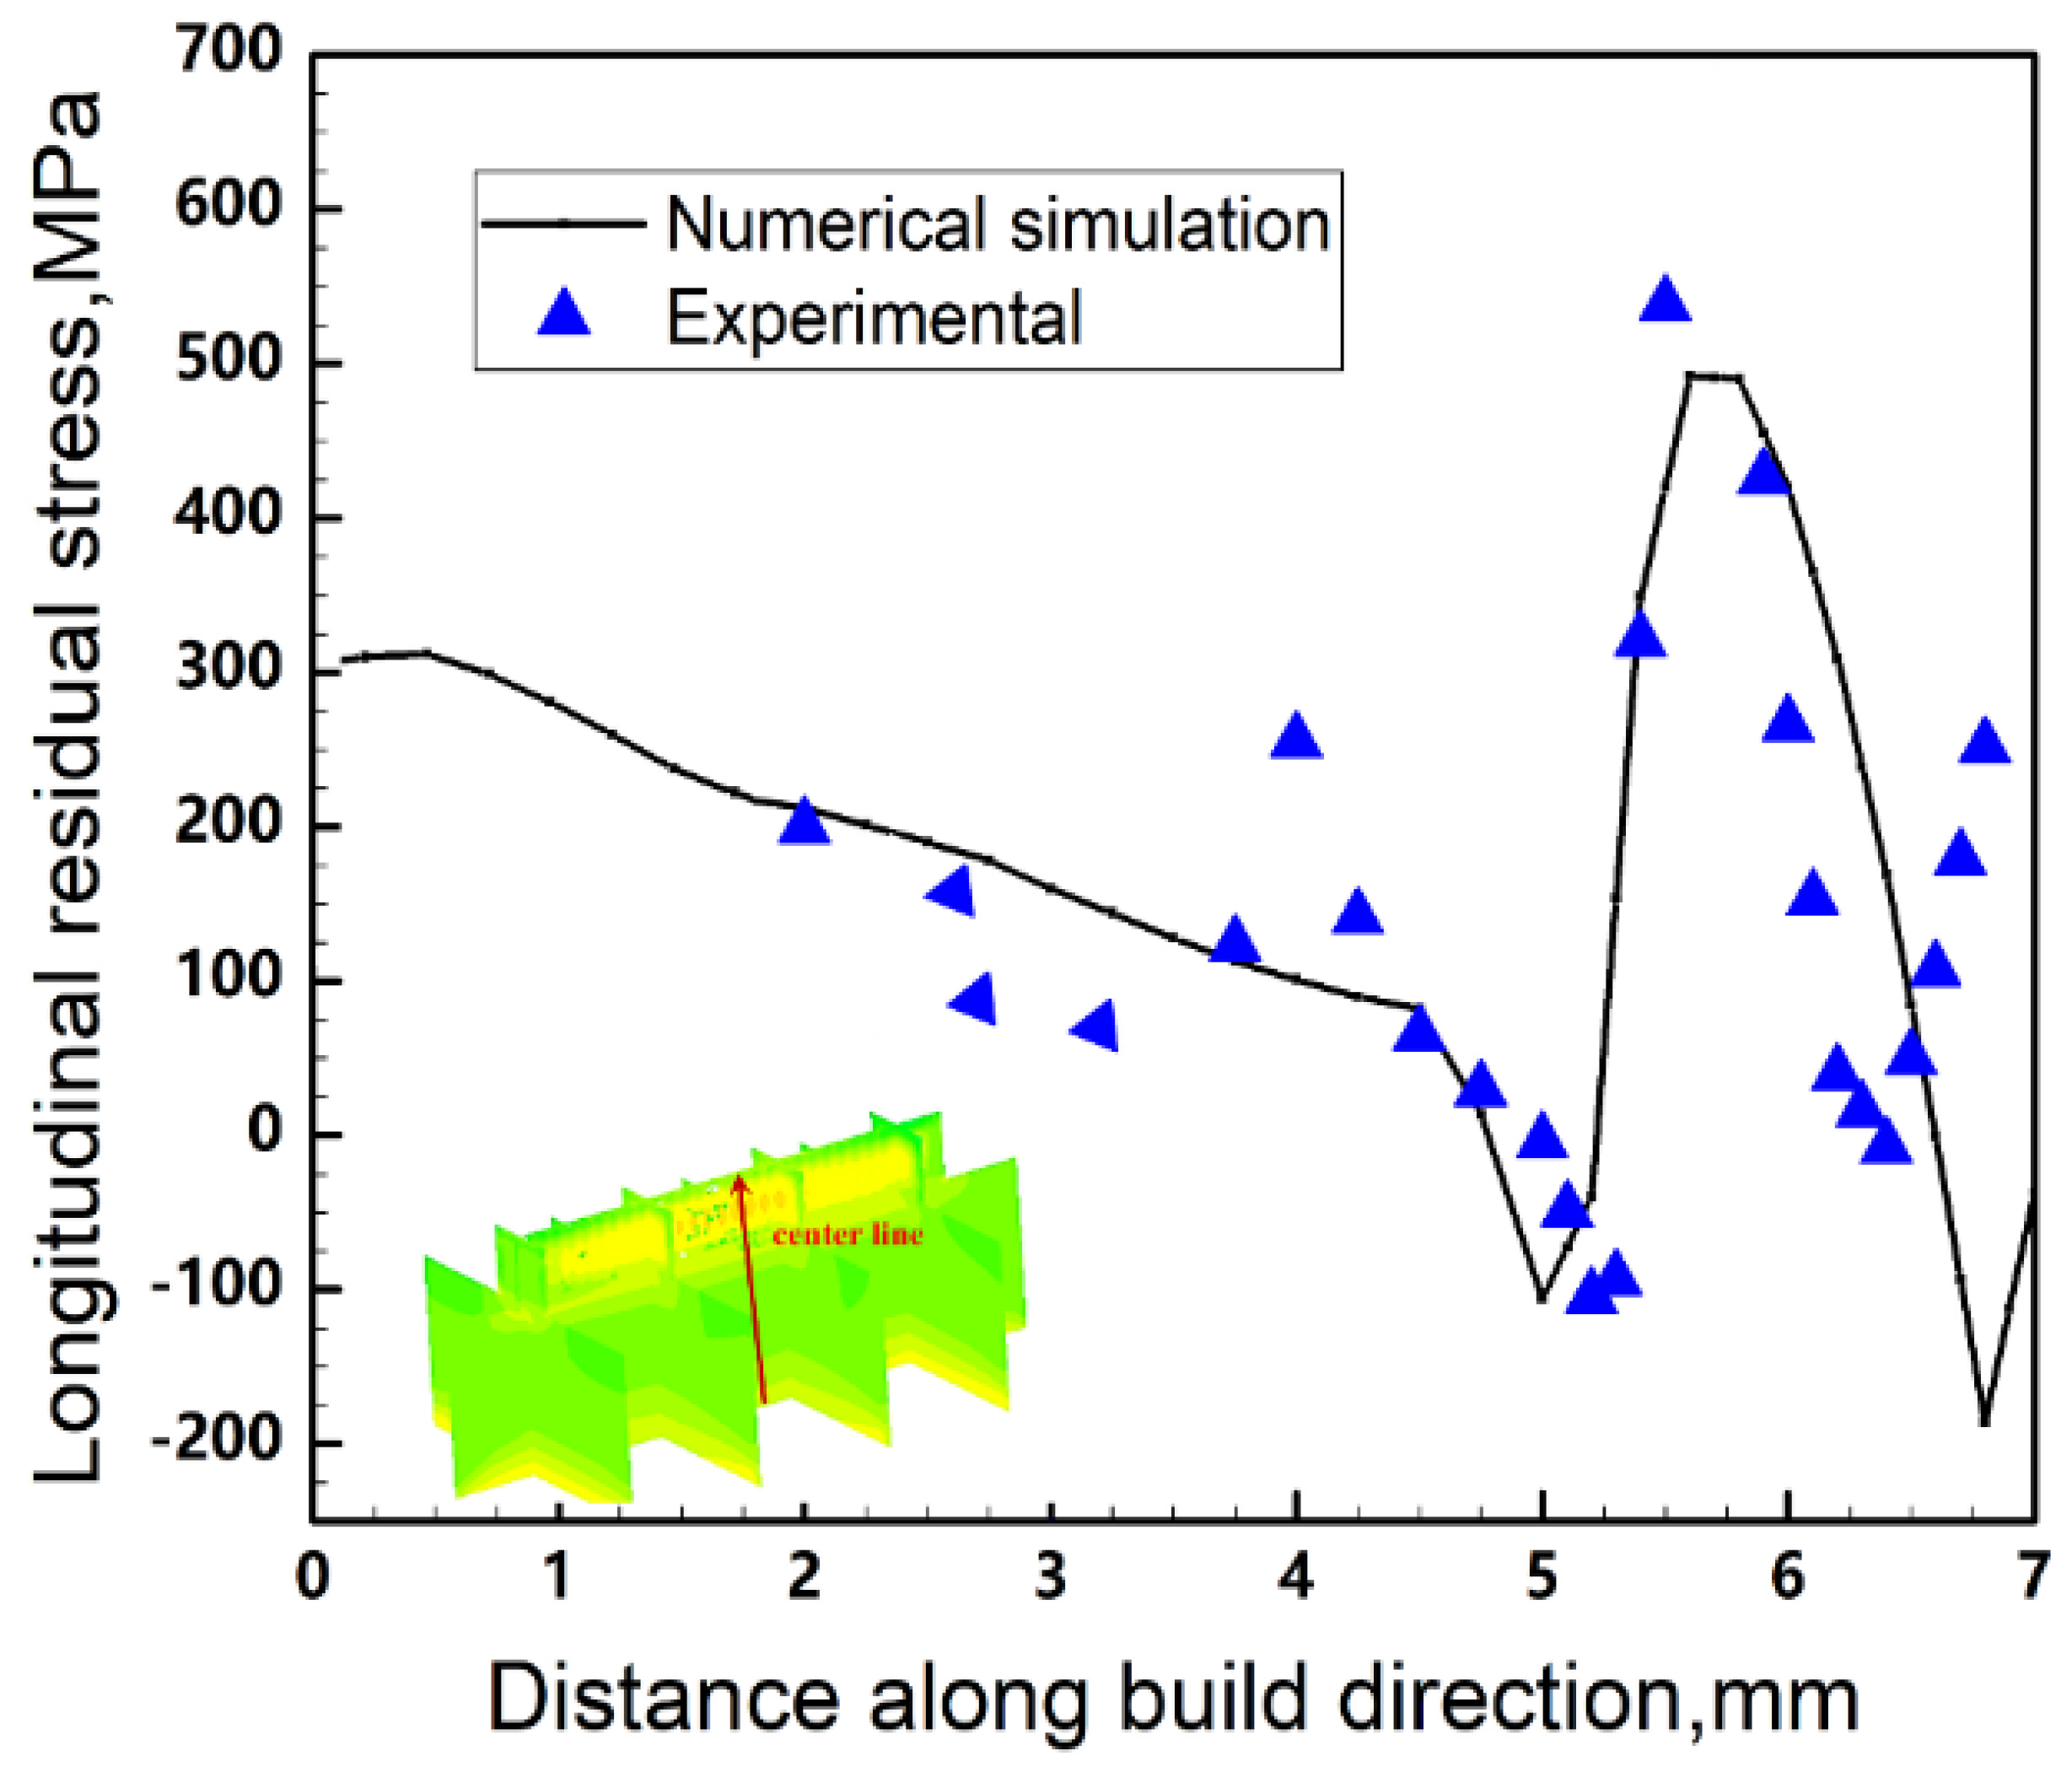
  • The proposed modeling’s residual stress results are in good agreement with the experimental data, including the residual strain and GND distributions;
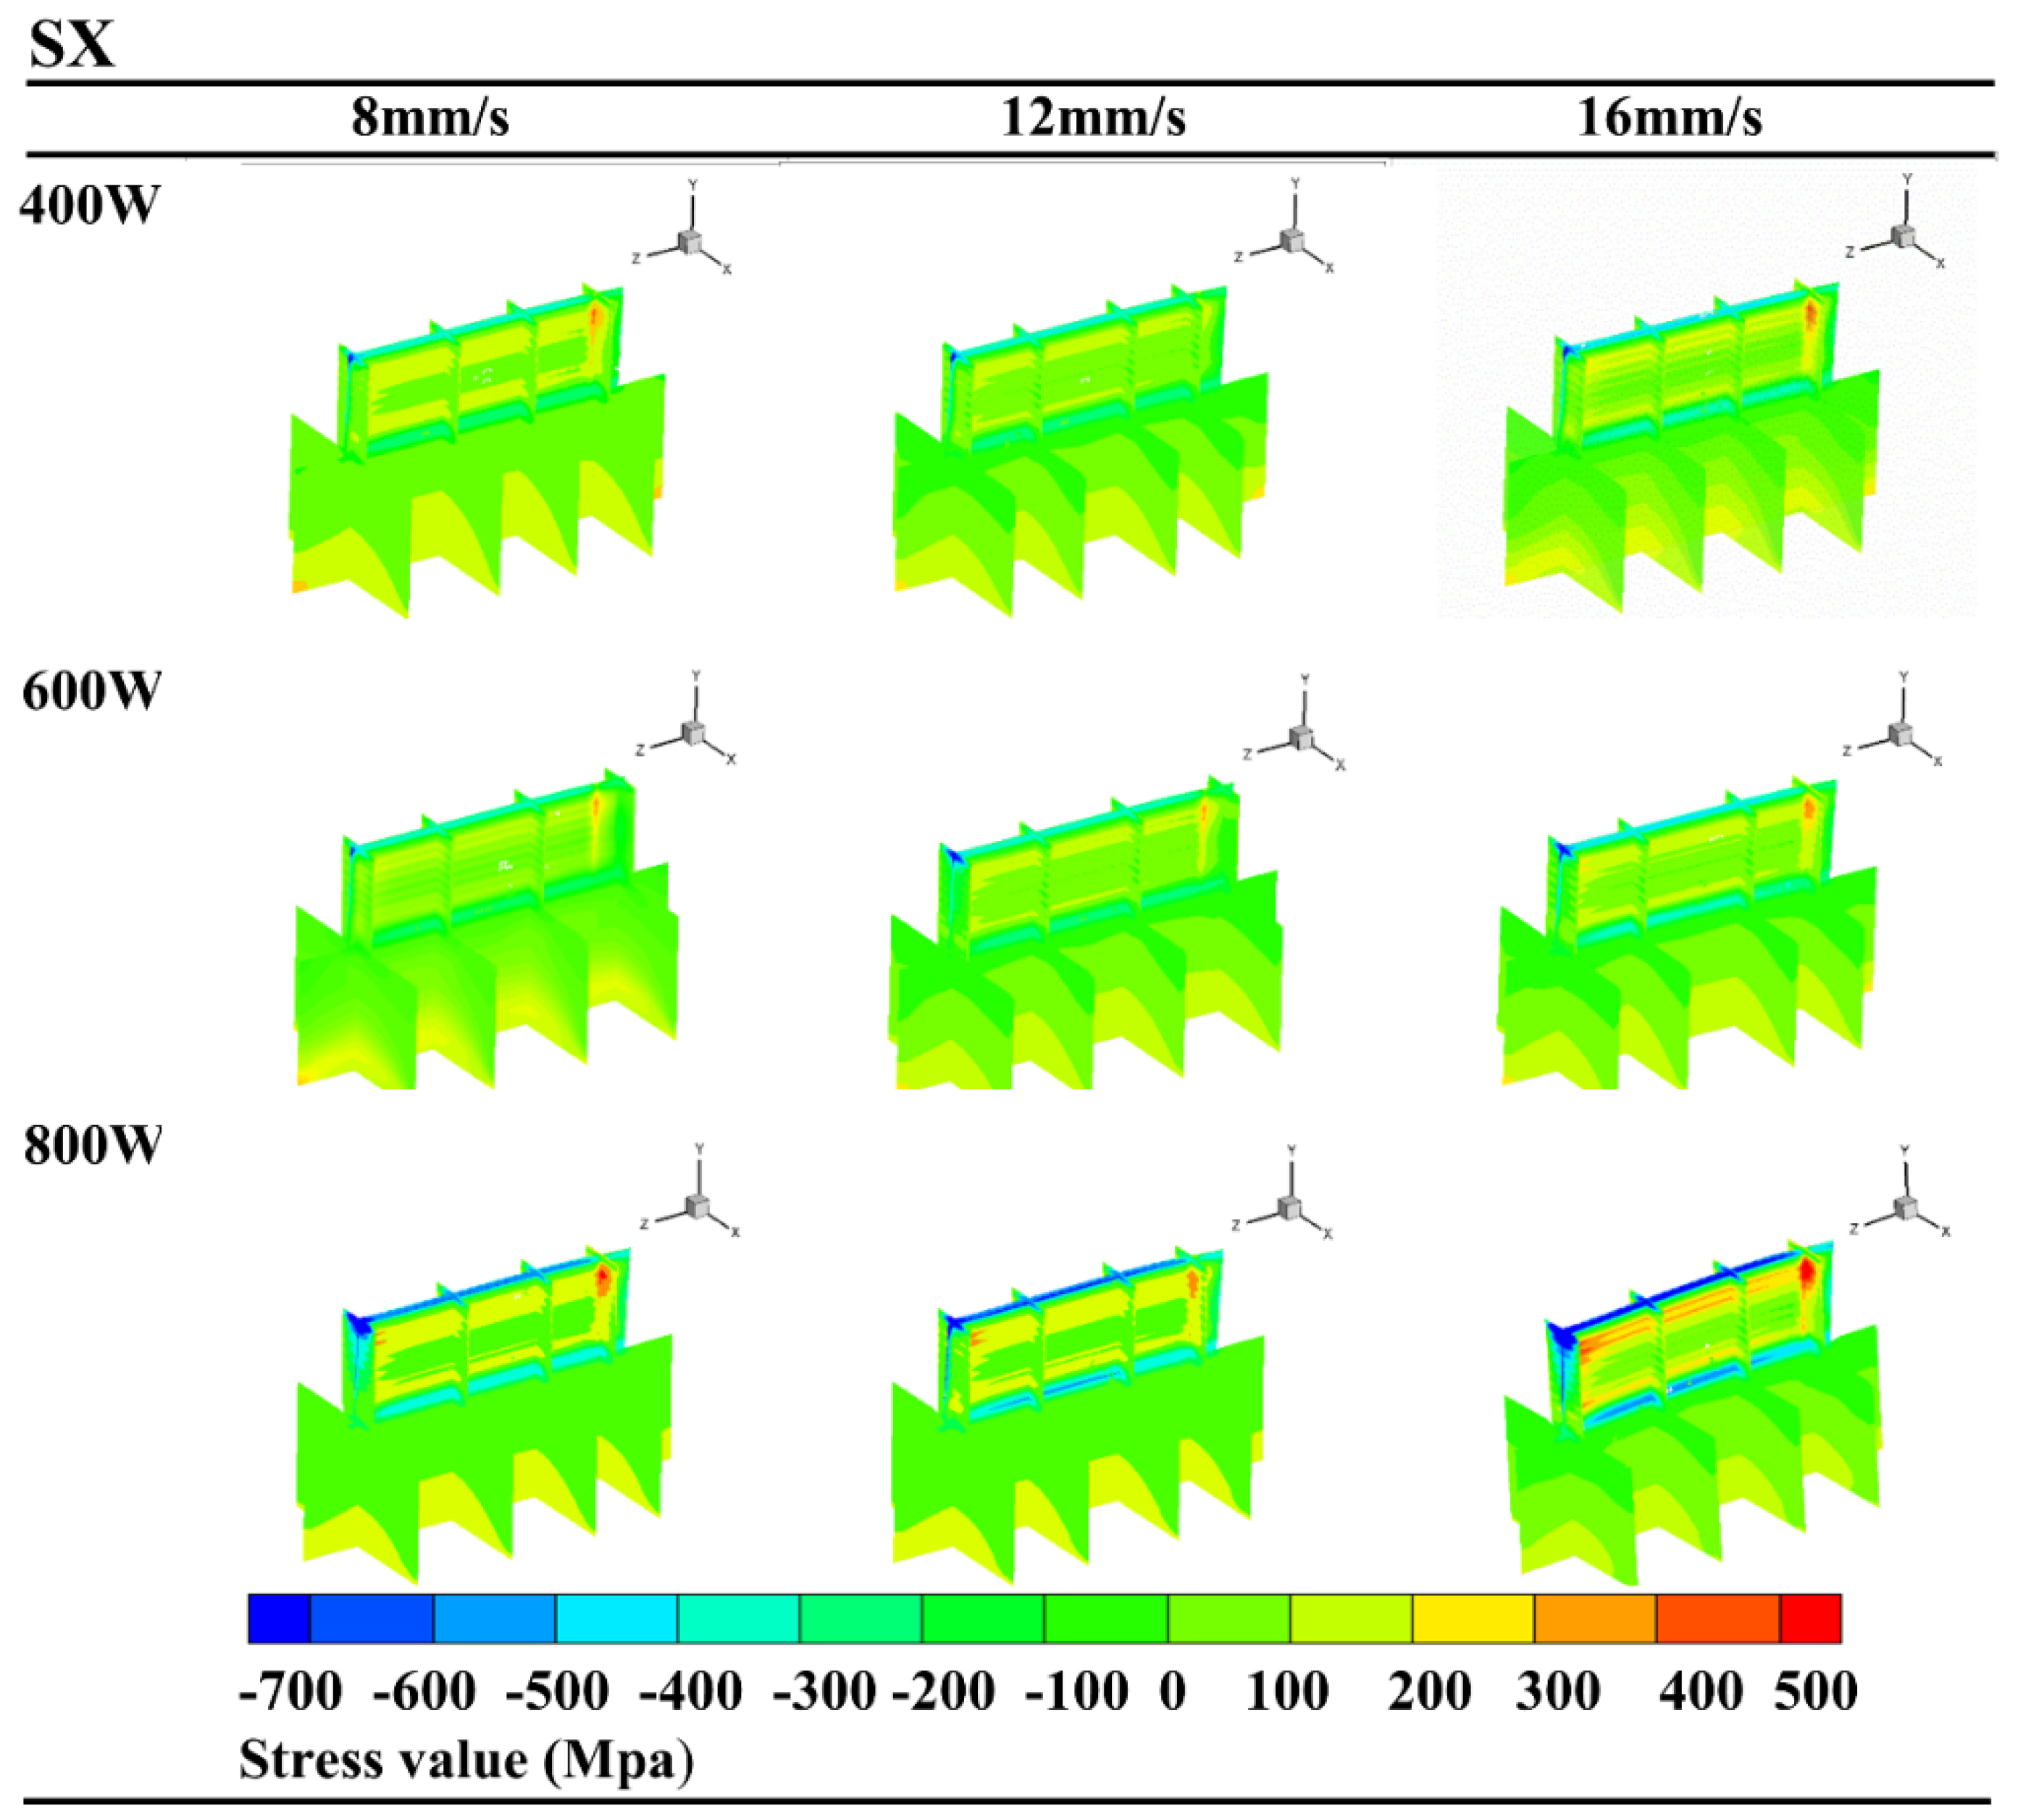
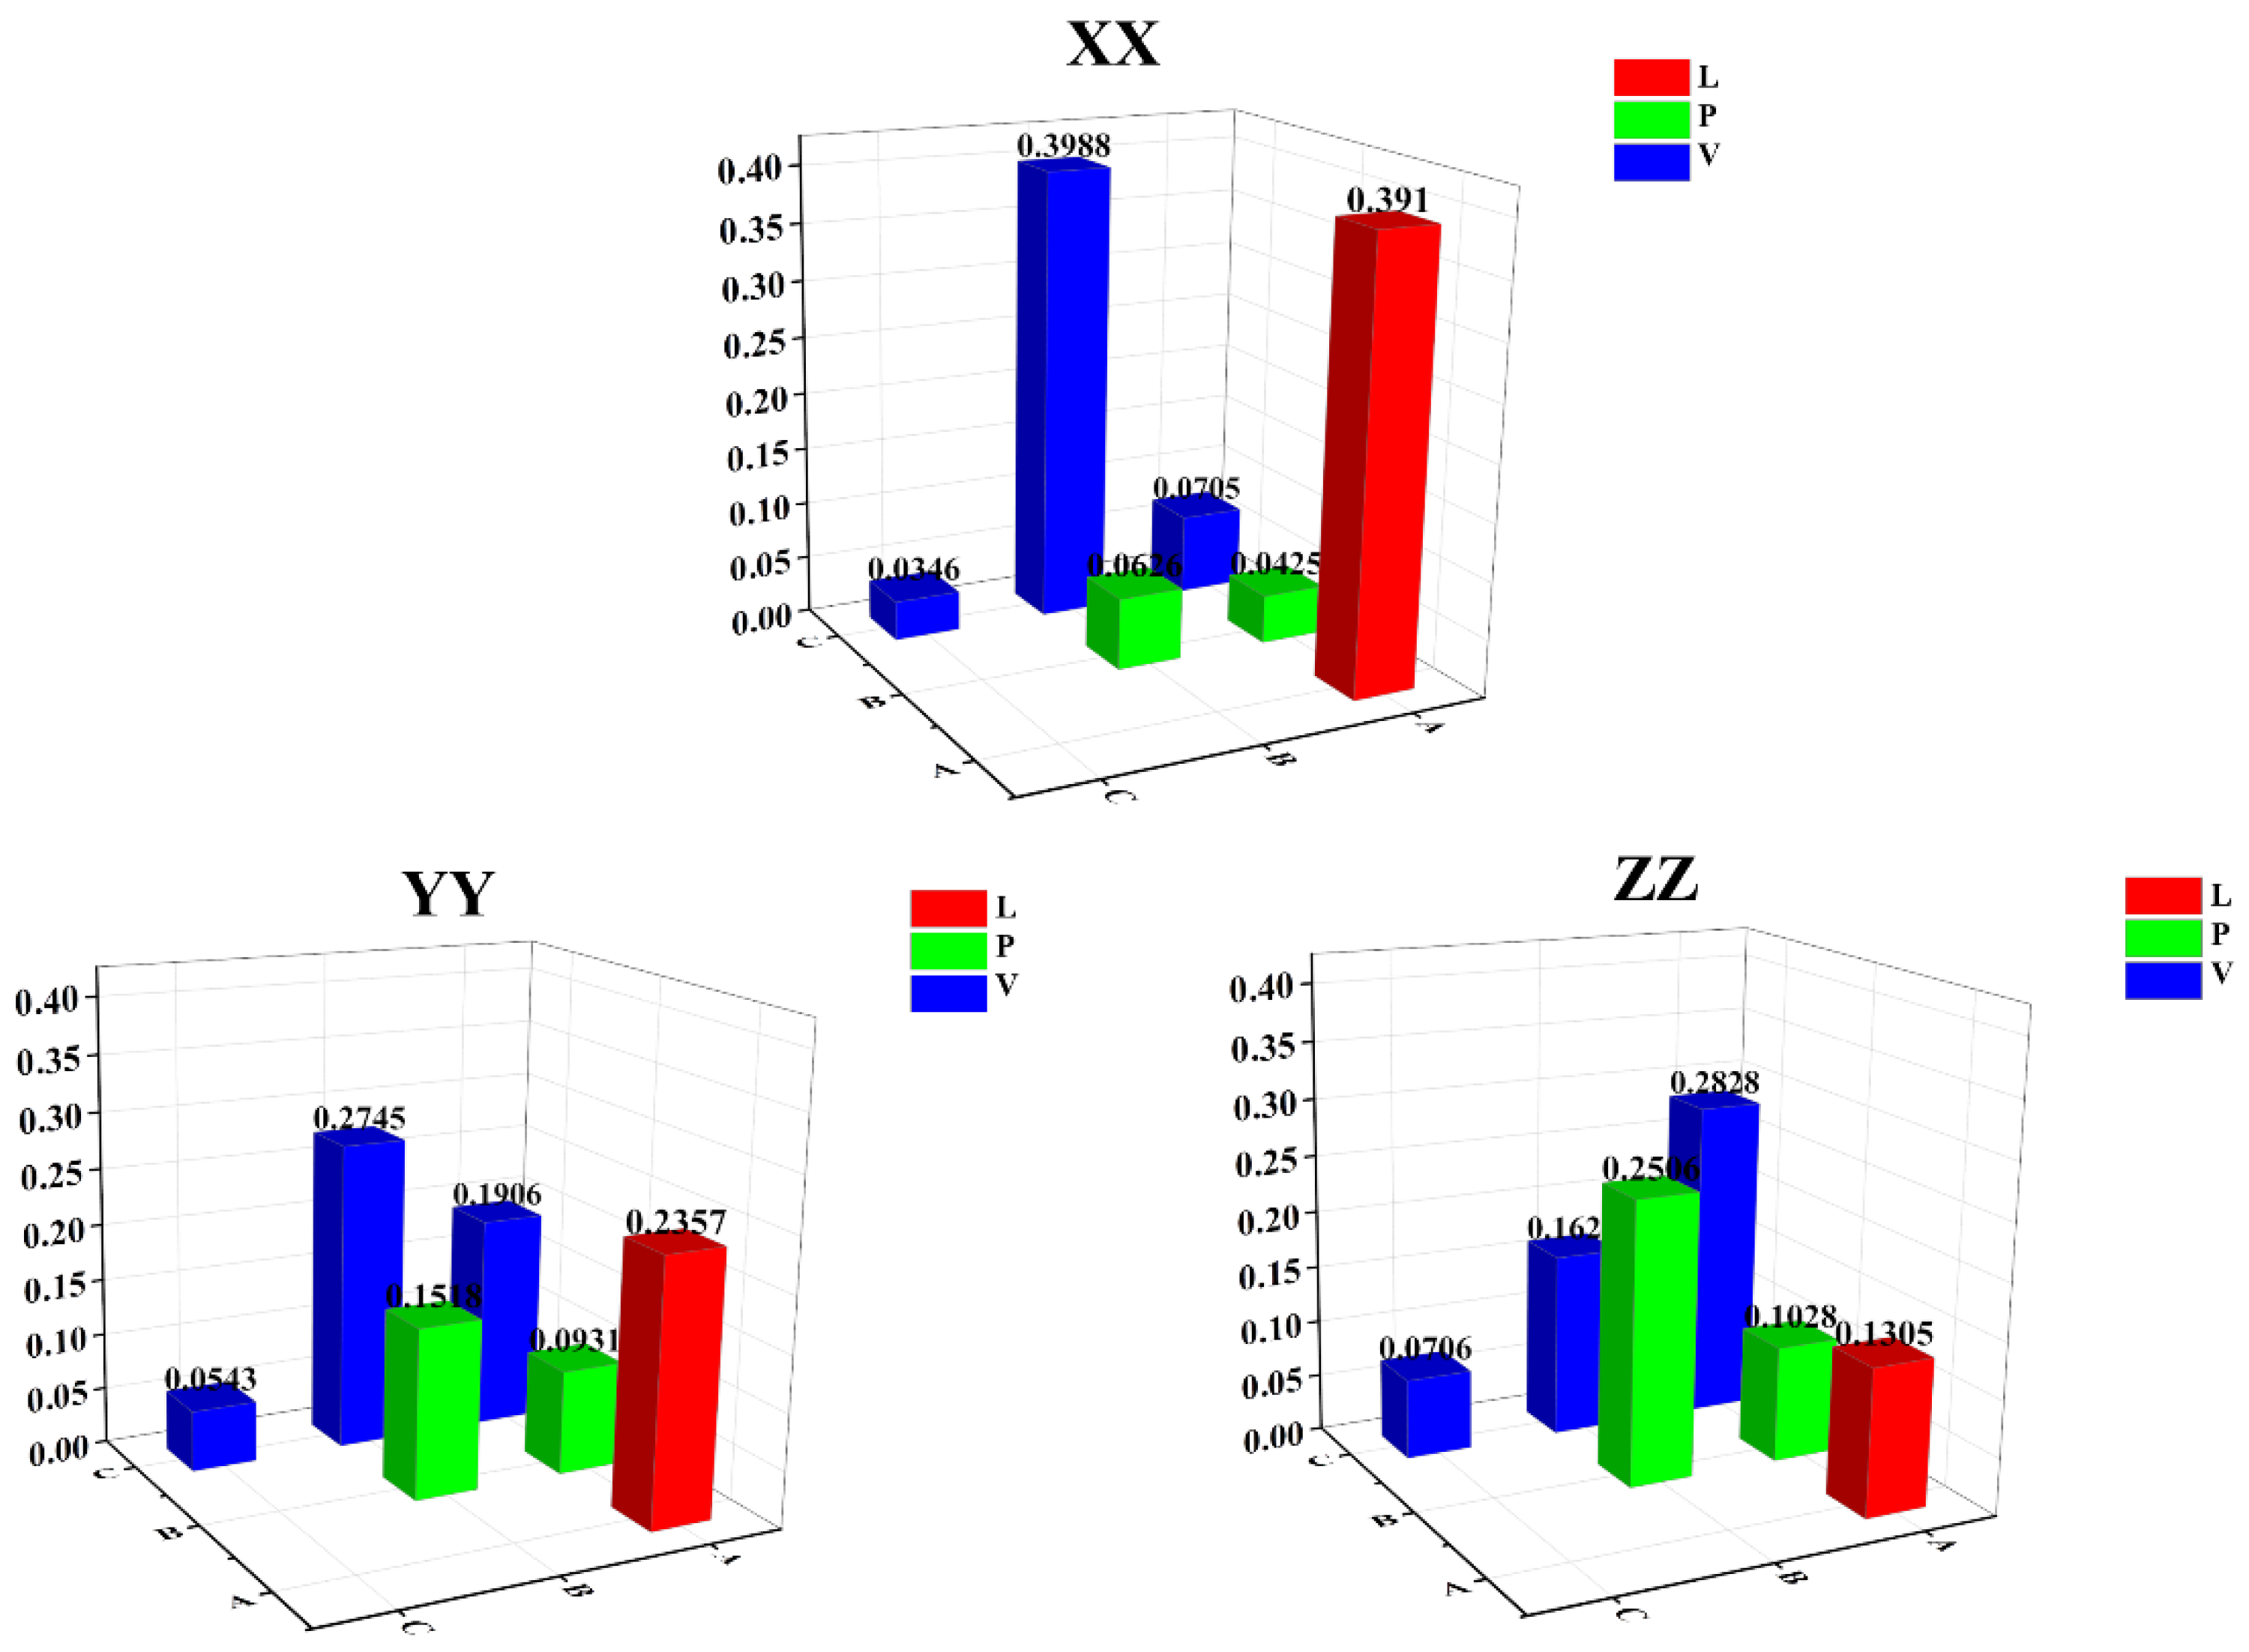
  • Based on the analysis of the D-MORPH-HDMR influencing factor results, the degree of impact of process parameters on the RS for multilayer deposition was further quantified, taking into account the important role of the coupling of different parameters. The results of the research reveal that the amplified effect of the influence of the three input variables (layer thickness, L; laser power, P; and scanning speed, v) on the transverse stress and thickness-direction stress is L > P > v. In contrast, the influence of the three variables on the longitudinal stress is P > L > v;
  • For DED of thin-walled parts formed from austenitic stainless steel, the selection of a lower deposition layer thickness L (200 μm), a moderate laser power P (600–800 W), and a higher scan rate v (12–16 mm/s) is of great significance to the reduction of residual stresses in the workpiece;
  • The main mechanism for the formation of DDRX and CDRX is the expansion of pre-existing grains and the rotation of sub-grains, respectively. The sample bottom had more thermo-mechanical cycles than the top, resulting in a larger dislocation density and hence a higher likelihood of DDRX.

Author Contributions

Conceptualization, Z.Y. and X.Z.; methodology, Z.Y. and X.Z.; validation, Z.Y., G.L. and X.Z..; formal analysis, Z.Y.; investigation, S.L.; resources, L.S.; writing—original draft preparation, Z.Y. and X.Z.; writing—review and editing, L.S.; supervision, L.S.; funding acquisition, L.S. All authors have read and agreed to the published version of the manuscript.

Funding

This research was funded by the National Key Research and Development Program of China, grant number 2018YFB0407300, and the National Natural Science Foundation of China, grant number 51875190.

Institutional Review Board Statement

Not applicable.

Informed Consent Statement

Not applicable.

Data Availability Statement

Not applicable.

Conflicts of Interest

The authors declare no conflict of interest.

References

  1. Chen, Y.; Clark, S.J.; Collins, D.M.; Marussi, S.; Hunt, S.A.; Fenech, D.M.; Connolley, T.; Atwood, R.C.; Magdysyuk, O.V.; Baxter, G.J. Correlative synchrotron X-ray imaging and diffraction of directed energy deposition additive manufacturing. Acta Mater. 2021, 209, 116777. [Google Scholar] [CrossRef]
  2. Bajaj, P.; Hariharan, A.; Kini, A.; Kürnsteiner, P.; Raabe, D.; Jägle, E.A. Steels in additive manufacturing: A review of their microstructure and properties. Mater. Sci. Eng. A 2019, 772, 138633. [Google Scholar] [CrossRef]
  3. DebRoy, T.; Wei, H.L.; Zuback, J.S.; Mukherjee, T.; Elmer, J.W.; Milewski, J.O.; Beese, A.M.; Wilson-Heid, A.; De, A.; Zhang, W. Additive manufacturing of metallic components—Process, structure and properties. Prog. Mater. Sci. 2018, 92, 112–224. [Google Scholar] [CrossRef]
  4. Voisin, T.; Forien, J.-B.; Perron, A.; Aubry, S.; Bertin, N.; Samanta, A.; Baker, A.; Wang, Y.M. New insights on cellular structures strengthening mechanisms and thermal stability of an austenitic stainless steel fabricated by laser powder-bed-fusion. Acta Mater. 2021, 203, 116476. [Google Scholar] [CrossRef]
  5. Wang, Y.M.; Voisin, T.; McKeown, J.T.; Ye, J.; Calta, N.P.; Li, Z.; Zeng, Z.; Zhang, Y.; Chen, W.; Roehling, T.T. Additively manufactured hierarchical stainless steels with high strength and ductility. Nat. Mater. 2018, 17, 63–71. [Google Scholar] [CrossRef] [Green Version]
  6. Liu, L.; Ding, Q.; Zhong, Y.; Zou, J.; Wu, J.; Chiu, Y.-L.; Li, J.; Zhang, Z.; Yu, Q.; Shen, Z. Dislocation network in additive manufactured steel breaks strength–ductility trade-off. Mater. Today 2018, 21, 354–361. [Google Scholar] [CrossRef] [Green Version]
  7. Yin, Y.; Sun, J.; Guo, J.; Kan, X.; Yang, D. Mechanism of high yield strength and yield ratio of 316 L stainless steel by additive manufacturing. Mater. Sci. Eng. A 2019, 744, 773–777. [Google Scholar] [CrossRef]
  8. Kong, D.; Dong, C.; Wei, S.; Ni, X.; Zhang, L.; Li, R.; Wang, L.; Man, C.; Li, X. About metastable cellular structure in additively manufactured austenitic stainless steels. Addit. Manuf. 2020, 38, 101804. [Google Scholar] [CrossRef]
  9. Xiao, H.; Li, S.M.; Xiao, W.J.; Li, Y.Q.; Cha, L.M.; Mazumder, J.; Song, L.J. Effects of laser modes on Nb segregation and Laves phase formation during laser additive manufacturing of nickel-based superalloy. Mater. Lett. 2017, 188, 260–262. [Google Scholar] [CrossRef]
  10. Xiao, W.; Li, S.; Wang, C.; Shi, Y.; Mazumder, J.; Xing, H.; Song, L. Multi-scale simulation of dendrite growth for direct energy deposition of nickel-based superalloys. Mater. Des. 2019, 164, 107553. [Google Scholar] [CrossRef]
  11. Zhang, S.; Lin, X.; Wang, L.; Yu, X.; Hu, Y.; Yang, H.; Lei, L.; Huang, W. Strengthening mechanisms in selective laser-melted Inconel718 superalloy. Mater. Sci. Eng. A 2021, 812, 141145. [Google Scholar] [CrossRef]
  12. Xiao, W.; Xu, Y.; Xiao, H.; Li, S.; Song, L. Investigation of the Nb element segregation for laser additive manufacturing of nickel-based superalloys. Int. J. Heat Mass Transf. 2021, 180, 121800. [Google Scholar] [CrossRef]
  13. Promoppatum, P.; Rollett, A.D. Influence of material constitutive models on thermomechanical behaviors in the laser powder bed fusion of Ti-6Al-4V. Addit. Manuf. 2021, 37, 101680. [Google Scholar] [CrossRef]
  14. Xiao, Z.; Chen, C.; Zhu, H.; Hu, Z.; Nagarajan, B.; Guo, L.; Zeng, X. Study of residual stress in selective laser melting of Ti6Al4V. Mater. Des. 2020, 193, 108846. [Google Scholar] [CrossRef]
  15. Tofail, S.A.M.; Koumoulos, E.P.; Bandyopadhyay, A.; Bose, S.; O’Donoghue, L.; Charitidis, C. Additive manufacturing: Scientific and technological challenges, market uptake and opportunities. Mater. Today 2018, 21, 22–37. [Google Scholar] [CrossRef]
  16. Bartlett, J.L.; Li, X. An overview of residual stresses in metal powder bed fusion. Addit. Manuf. 2019, 27, 131–149. [Google Scholar] [CrossRef]
  17. Yakout, M.; Elbestawi, M.; Veldhuis, S.C.; Nangle-Smith, S. Influence of thermal properties on residual stresses in SLM of aerospace alloys. Rapid Prototyp. J. 2020, 26, 213–222. [Google Scholar] [CrossRef]
  18. Mukherjee, T.; Manvatkar, V.; De, A.; DebRoy, T. Mitigation of thermal distortion during additive manufacturing. Scr. Mater. 2017, 127, 79–83. [Google Scholar] [CrossRef] [Green Version]
  19. Wu, A.S.; Brown, D.W.; Kumar, M.; Gallegos, G.F.; King, W.E. An experimental investigation into additive manufacturing-induced residual stresses in 316L stainless steel. Metall. Mater. Trans. A 2014, 45, 6260–6270. [Google Scholar] [CrossRef]
  20. Levkulich, N.; Semiatin, S.; Gockel, J.; Middendorf, J.; DeWald, A.; Klingbeil, N. The effect of process parameters on residual stress evolution and distortion in the laser powder bed fusion of Ti-6Al-4V. Addit. Manuf. 2019, 28, 475–484. [Google Scholar] [CrossRef]
  21. Brückner, F.; Lepski, D.; Beyer, E. Modeling the influence of process parameters and additional heat sources on residual stresses in laser cladding. J. Therm. Spray Technol. 2007, 16, 355–373. [Google Scholar] [CrossRef]
  22. Shiomi, M.; Osakada, K.; Nakamura, K.; Yamashita, T.; Abe, F. Residual stress within metallic model made by selective laser melting process. CIRP Ann. 2004, 53, 195–198. [Google Scholar] [CrossRef]
  23. Mukherjee, T.; Zhang, W.; DebRoy, T. An improved prediction of residual stresses and distortion in additive manufacturing. Comput. Mater. Sci. 2017, 126, 360–372. [Google Scholar] [CrossRef] [Green Version]
  24. Ghasri-Khouzani, M.; Peng, H.; Rogge, R.; Attardo, R.; Ostiguy, P.; Neidig, J.; Billo, R.; Hoelzle, D.; Shankar, M. Experimental measurement of residual stress and distortion in additively manufactured stainless steel components with various dimensions. Mater. Sci. Eng. A 2017, 707, 689–700. [Google Scholar] [CrossRef]
  25. Cheng, B.; Shrestha, S.; Chou, K. Stress and deformation evaluations of scanning strategy effect in selective laser melting. Addit. Manuf. 2016, 12, 240–251. [Google Scholar]
  26. Saboori, A.; Piscopo, G.; Lai, M.; Salmi, A.; Biamino, S. An investigation on the effect of deposition pattern on the microstructure, mechanical properties and residual stress of 316L produced by Directed Energy Deposition. Mater. Sci. Eng. A 2020, 780, 139179. [Google Scholar] [CrossRef]
  27. Yakout, M.; Elbestawi, M.A.; Veldhuis, S.C. Density and mechanical properties in selective laser melting of Invar 36 and stainless steel 316L. J. Mater. Process. Technol. 2019, 266, 397–420. [Google Scholar] [CrossRef]
  28. Zou, S.; Xiao, H.; Ye, F.; Li, Z.; Tang, W.; Zhu, F.; Chen, C.; Zhu, C. Numerical analysis of the effect of the scan strategy on the residual stress in the multi-laser selective laser melting. Results Phys. 2020, 16, 103005. [Google Scholar] [CrossRef]
  29. Sharma, R.; Kumar, A. Track-scale simulations of selective laser melting to investigate development and mitigation of thermal stresses. Lasers Manuf. Mater. Process. 2019, 6, 464–492. [Google Scholar] [CrossRef]
  30. Wang, H.; Chen, L.; Ye, F.; Chen, L. Global sensitivity analysis for fiber reinforced composite fiber path based on D-MORPH-HDMR algorithm. Struct. Multidiscip. Optim. 2017, 56, 697–712. [Google Scholar] [CrossRef]
  31. Smith, T.R.; Sugar, J.D.; San Marchi, C.; Schoenung, J.M. Microstructural development in DED stainless steels: Applying welding models to elucidate the impact of processing and alloy composition. J. Mater. Sci. 2020, 56, 762–780. [Google Scholar] [CrossRef]
  32. Banerjee, A.; Messina, S.; Begley, M.R.; Schwalbach, E.J.; Groeber, M.A.; Musinski, W.D.; Shade, P.A.; Cox, M.E.; Miller, J.D.; Hemker, K.J. The mechanical response of additively manufactured IN625 thin-walled structures. Scr. Mater. 2021, 205, 114188. [Google Scholar] [CrossRef]
  33. Liu, Z.; Zhao, D.; Wang, P.; Yan, M.; Yang, C.; Chen, Z.; Lu, J.; Lu, Z. Additive manufacturing of metals: Microstructure evolution and multistage control. J. Mater. Sci. Technol. 2022, 100, 224–236. [Google Scholar] [CrossRef]
  34. Li, H.; Huang, Y.; Sun, J.; Lu, Y. The relationship between thermo-mechanical history, microstructure and mechanical properties in additively manufactured CoCrFeMnNi high entropy alloy. J. Mater. Sci. Technol. 2021, 77, 187–195. [Google Scholar] [CrossRef]
  35. Fu, J.; Qu, S.; Ding, J.; Song, X.; Fu, M.W. Comparison of the microstructure, mechanical properties and distortion of stainless steel 316 L fabricated by micro and conventional laser powder bed fusion. Addit. Manuf. 2021, 44, 102067. [Google Scholar] [CrossRef]
  36. Gorsse, S.; Hutchinson, C.; Gouné, M.; Banerjee, R. Additive manufacturing of metals: A brief review of the characteristic microstructures and properties of steels, Ti-6Al-4V and high-entropy alloys. Sci. Technol. Adv. Mater. 2017, 18, 584–610. [Google Scholar] [CrossRef] [Green Version]
  37. Chew, Y.; Zhu, Z.; Weng, F.; Gao, S.; Ng, F.; Lee, B.; Bi, G. Microstructure and mechanical behavior of laser aided additive manufactured low carbon interstitial Fe49. 5Mn30Co10Cr10C0. 5 multicomponent alloy. J. Mater. Sci. Technol. 2021, 77, 38–46. [Google Scholar] [CrossRef]
  38. Smith, T.R.; Sugar, J.D.; San Marchi, C.; Schoenung, J.M. Strengthening mechanisms in directed energy deposited austenitic stainless steel. Acta Mater. 2019, 164, 728–740. [Google Scholar] [CrossRef]
  39. Yan, Z.; Zou, K.; Cheng, M.; Zhou, Z.; Song, L. Revealing relationships between heterogeneous microstructure and strengthening mechanism of austenitic stainless steels fabricated by directed energy deposition (DED). J. Mater. Res. Technol. 2021, 15, 582–594. [Google Scholar] [CrossRef]
  40. Wang, G.; Ouyang, H.; Fan, C.; Guo, Q.; Li, Z.; Yan, W.; Li, Z. The origin of high-density dislocations in additively manufactured metals. Mater. Res. Lett. 2020, 8, 283–290. [Google Scholar] [CrossRef]
  41. Wang, H.; Zhu, Z.; Chen, H.; Wang, A.; Liu, J.; Liu, H.; Zheng, R.; Nai, S.; Primig, S.; Babu, S. Effect of cyclic rapid thermal loadings on the microstructural evolution of a CrMnFeCoNi high-entropy alloy manufactured by selective laser melting. Acta Mater. 2020, 196, 609–625. [Google Scholar] [CrossRef]
  42. Bertsch, K.; de Bellefon, G.M.; Kuehl, B.; Thoma, D. Origin of dislocation structures in an additively manufactured austenitic stainless steel 316L. Acta Mater. 2020, 199, 19–33. [Google Scholar] [CrossRef]
  43. Barkia, B.; Aubry, P.; Haghi-Ashtiani, P.; Auger, T.; Gosmain, L.; Schuster, F.; Maskrot, H. On the origin of the high tensile strength and ductility of additively manufactured 316L stainless steel: Multiscale investigation. J. Mater. Sci. Technol. 2020, 41, 209–218. [Google Scholar] [CrossRef]
  44. Sabzi, H.E.; Aboulkhair, N.T.; Liang, X.; Li, X.-H.; Simonelli, M.; Fu, H.; Rivera-Díaz-del-Castillo, P.E. Grain refinement in laser powder bed fusion: The influence of dynamic recrystallization and recovery. Mater. Des. 2020, 196, 109181. [Google Scholar] [CrossRef]
  45. Hu, Y.; Lin, X.; Lu, X.; Zhang, S.; Yang, H.; Wei, L.; Huang, W. Evolution of solidification microstructure and dynamic recrystallisation of Inconel 625 during laser solid forming process. J. Mater. Sci. 2018, 53, 15650–15666. [Google Scholar] [CrossRef]
  46. Denlinger, E.R.; Jagdale, V.; Srinivasan, G.V.; El-Wardany, T.; Michaleris, P. Thermal modeling of Inconel 718 processed with powder bed fusion and experimental validation using in situ measurements. Addit. Manuf. 2016, 11, 7–15. [Google Scholar] [CrossRef]
  47. Vasinonta, A.; Beuth, J.L.; Griffith, M. Process maps for predicting residual stress and melt pool size in the laser-based fabrication of thin-walled structures. J. Manuf. Sci. Eng. 2007, 129, 101–109. [Google Scholar] [CrossRef]
  48. Vastola, G.; Zhang, G.; Pei, Q.X.; Zhang, Y.W. Controlling of residual stress in additive manufacturing of Ti6Al4V by finite element modeling. Addit. Manuf. 2016, 12, 231–239. [Google Scholar] [CrossRef]
  49. Lua, X.; Lin, X.; Chiumentic, M.; Cerverac, M.; Li, J.; Ma, L.; Wei, L.; Hu, Y.; Huang, W. Finite element analysis and experimental validation of the thermomechanical behavior in laser solid forming of Ti-6Al-4V. Addit. Manuf. 2018, 21, 30–40. [Google Scholar] [CrossRef]
  50. Wang, Z.; Denlinger, E.; Michaleris, P.; Stoica, A.D.; Ma, D.; Beese, A.M. Residual stress mapping in Inconel 625 fabricated through additive manufacturing: Method for neutron diffraction measurements to validate thermomechanical model predictions. Mater. Des. 2017, 113, 169–177. [Google Scholar] [CrossRef] [Green Version]
  51. Cao, J.; Gharghouri, M.A.; Nash, P. Finite-element analysis and experimental validation of thermal residual stress and distortion in electron beam additive manufactured Ti-6Al-4V build plates. J. Mater. Process. Technol. 2016, 237, 409–419. [Google Scholar] [CrossRef]
  52. Ali, H.; Ghadbeigi, H.; Mumtaz, K. Effect of scanning strategies on residual stress and mechanical properties of Selective Laser Melted Ti6Al4V. Mater. Sci. Eng. A 2018, 712, 175–187. [Google Scholar] [CrossRef]
  53. Yan, W.; Yue, Z.; Feng, J. Study on the role of deposition path in electron beam freeform fabrication process. Rapid Prototyp. J. 2017, 23, 1057–1068. [Google Scholar] [CrossRef]
  54. Lu, Y.; Wu, S.; Gan, Y.; Huang, T.; Yang, C.; Junjie, L.; Lin, J. Study on the microstructure, mechanical property and residual stress of SLM Inconel-718 alloy manufactured by differing island scanning strategy. Opt. Laser Technol. 2015, 75, 197–206. [Google Scholar] [CrossRef]
  55. Denlinger, E.R.; Heigel, J.C.; Michaleris, P.; Palmer, T.A. Effect of inter-layer dwell time on distortion and residual stress in additive manufacturing of titanium and nickel alloys. J. Mater. Process. Technol. 2015, 215, 123–131. [Google Scholar] [CrossRef]
  56. DeWald, A.T.; Hill, M.R. Multi-Axial Contour Method for Mapping Residual Stresses in Continuously Processed Bodies. Exp. Mech. 2006, 46, 473. [Google Scholar] [CrossRef]
  57. Yan, Z.; Song, L.; Liu, W.; Zou, X.; Zhou, Z. Numerical analysis of thermal stress evolution of pulsed-wave laser direct energy deposition. Int. J. Adv. Manuf. Technol. 2021, 115, 1399–1410. [Google Scholar] [CrossRef]
  58. Gao, H.; Huang, Y. Geometrically necessary dislocation and size-dependent plasticity. Scr. Mater. 2003, 48, 113–118. [Google Scholar] [CrossRef]
  59. Hollomon, J.H. Tensile deformation. Aime Trans. 1945, 12, 1–22. [Google Scholar]
  60. Smith, T.R.; Sugar, J.D.; Schoenung, J.M.; San Marchi, C. Anomalous annealing response of directed energy deposited type 304L austenitic stainless steel. Jom 2018, 70, 358–363. [Google Scholar] [CrossRef]
  61. Wang, X.; Muñiz-Lerma, J.; Sanchez-Mata, O.; Shandiz, M.A.; Brodusch, N.; Gauvin, R.; Brochu, M. Characterization of single crystalline austenitic stainless steel thin struts processed by laser powder bed fusion. Scr. Mater. 2019, 163, 51–56. [Google Scholar] [CrossRef]
  62. Zhang, H.; Xu, M.; Liu, Z.; Li, C.; Zhang, Y. Role of local recrystallization behavior on fatigue performance of SLMed 304L austenitic stainless steels. Mater. Charact. 2021, 177, 111159. [Google Scholar] [CrossRef]
  63. Gao, S.; Hu, Z.; Duchamp, M.; Krishnan, P.S.R.; Tekumalla, S.; Song, X.; Seita, M. Recrystallization-based grain boundary engineering of 316L stainless steel produced via selective laser melting. Acta Mater. 2020, 200, 366–377. [Google Scholar] [CrossRef]
  64. Sakai, T.; Belyakov, A.; Kaibyshev, R.; Miura, H.; Jonas, J.J. Dynamic and post-dynamic recrystallization under hot, cold and severe plastic deformation conditions. Prog. Mater. Sci. 2014, 60, 130–207. [Google Scholar] [CrossRef] [Green Version]
  65. Heidarzadeh, A.; Zavašnik, J.; Shabadi, R.; Mousavian, R.T. Dynamic recrystallization’s role in strength-ductility trade-off in polycrystalline Fe–Cr–Ni stainless steels produced by laser powder bed fusion. Mater. Sci. Eng. A 2021, 814, 141214. [Google Scholar] [CrossRef]
Figure 1. A block diagram summarizing the global sensitivity analysis method associated with the indirect thermal–structural coupling analysis method.
Metals 12 01109 g001
Figure 2. (a) The shape of molten pools in the DED additive process; (b) temperature–stress evolution curves at different locations.
Metals 12 01109 g002
Figure 3. (a) Schematic image of selected points in the longitudinal section and temperature curve of different points during the DED process; (b) a partial enlargement of (a); (c) the temperature field and temperature gradient field distribution of point B at t = 6.30 s, t = 6.35 s, and t = 6.40 s, respectively; (d) FLIR A615 infrared thermal imager at t = 6.30 s, t = 6.35 s, and t = 6.40 s.
Metals 12 01109 g003
Figure 4. Comparison of experimental and simulated values of residual stress under a layer thickness of 200 μm, a laser power of 400 W, and a scanning speed of 8 mm/s.
Metals 12 01109 g004
Figure 5. The XX, YY, and ZZ stresses for Layer 1, Layer 4, and Layer 8 under a scanning speed of 16 mm/s, a laser power of 400 W, and a layer thickness of 400 μm.
Metals 12 01109 g005
Figure 6. The XX stress distributions under different scanning speed and laser power values when the layer thickness is 0.4 mm.
Metals 12 01109 g006
Figure 7. The YY stress distributions under different scanning speed and laser power values when the layer thickness is 0.4 mm.
Metals 12 01109 g007
Figure 8. The ZZ stress distributions under different scanning speed and laser power values when the layer thickness is 0.4 mm.
Metals 12 01109 g008
Figure 9. The stress distributions under different layer thicknesses when the laser power is 600 W and the scanning speed is 16 mm/s.
Metals 12 01109 g009
Figure 10. Results of the global sensitivity analysis.
Metals 12 01109 g010
Figure 11. (a) Typical thermal cycle curves in the DED process and the typical time division of solidified and post-solidified microstructures; (bf) images of macrocrystalline grains, solidified cells, nano oxides, dislocation cells, and recrystallized grains.
Metals 12 01109 g011
Figure 12. EBSD-analyzed strain images of different zones and the geometrically necessary dislocation (GND) density mapping of (a) the baseplate zone; (b) the top zone; and (c) the bottom zone.
Metals 12 01109 g012
Figure 13. (a) Recrystallized fraction component map for the top zone; (b) recrystallized fraction component map for the bottom zone; (c) OIM map boundary distribution with HAGBs for black lines, LAGBs for blue lines, and MAGBs for green lines. SR, sub-grain rotation; B, bulging of grain boundaries; (d) misorientation analysis along line A marked in (c). The black line shows the misorientation between each point to the first point, and the red line indicates the misorientation from point to point along line A.
Metals 12 01109 g013
Figure 14. TEM images of the recrystallization mechanism in the deposition sample of 316L. (a) Rearrangement of the dislocations during the CDRX; (b,c) the formation of DDRX recrystallized grains preferentially found on the GBs (green dotted lines) in sizes ranging from nanometers to micrometers; (d) a partial enlargement of (c).
Metals 12 01109 g014
Figure 15. (a) TKD images of the as-received sample; (b) recrystallized fraction component map showing the process-induced deformed, sub-structured, and recrystallized grains; (c) the formation of recrystallized grains consumes dislocations.
Metals 12 01109 g015
Table 2. Chemical compositions of the as-received 316L powder (wt.%).
ElementCrNiMoSiMnCSPOFe
A16.911.62.250.590.540.0130.0050.0110.011Bal.
Table 3. Process parameters applied in this study.
Process ParameterValue
Laser power, P (W)400, 600, 800
Scanning speed, v (mm/s)8, 12, 16
Powder layer thickness, L (μm)200, 400, 600
Beam diameter, D (mm)1.2
Interlayer powder laying time (s)0
Table 4. Design of the orthogonal array experiment.
Trial No.Factor AFactor BFactor C
Layer Thickness, L (μm)Laser Power, P (W)Scanning Speed, v (mm/s)
12004008
220060016
320080012
440040016
540060012
64008008
760040012
86006008
960080016
Table 5. Maximum residual stresses of all the samples.
Trial No.XX-StressYY-StressZZ-Stress
MpaMpaMpa
1525463488
2392299274
3412358385
4442666473
5368548390
6712790992
7841871489
81030536470
9130314411483
Publisher’s Note: MDPI stays neutral with regard to jurisdictional claims in published maps and institutional affiliations.

