Review

Acoustic Analysis of Slag Foaming in the BOF

1
Fluid and Process Dynamics (FPD) Group, Department of Mechanical and Product Design Engineering, Swinburne University of Technology, Hawthorn 3123, Australia
2
ARC Research Hub for Australian Steel Innovation, University of Wollongong, Wollongong 2500, Australia
3
BlueScope Steel Limited, Level 11, 120 Collins Street, Melbourne 3000, Australia
*
Author to whom correspondence should be addressed.
Metals 2022, 12(7), 1142; https://doi.org/10.3390/met12071142
Submission received: 30 May 2022 / Revised: 19 June 2022 / Accepted: 1 July 2022 / Published: 5 July 2022
(This article belongs to the Special Issue Clean Ironmaking and Steelmaking Processes)

Abstract

:
The control of slag foam that is produced during the Basic Oxygen Furnace (BOF) process has been the subject of significant research. The behaviour of slag foams is complex. Hence, the control of slag foam in the dynamic process of the BOF is challenging. Acoustic analysis of the BOF is one of the most promising methods for the indirect measurement of slag foam height. This paper reviews different studies on the fundamental behaviour of acoustics in liquid foams and various acoustic studies related to determining the slag foam height during the BOF process. Studies on the BOF have been carried out using both cold water models and plant trials, where acoustic measurements taken directly from the process were analysed. These studies showed that the attenuation of sound through liquid foam was influenced mainly by factors such as viscosity, bubble size, and foam height. Current systems are said to be 70 to 87 per cent accurate in detecting and/or predicting slopping events in the BOF, though there is a lack of systematic data in the literature to fully quantify this accuracy. There have been various attempts to combine sound with vibration and image signals to improve the prediction of slopping events in BOFs. The review substantiates the lack of accuracy of the current systems in determining the slag foam height using acoustic analysis and the need to address fundamental questions about the behaviour of sound in dynamic foam, its reliance on different factors, and the relatability of comparing cold model data to industrial data.

1. Introduction

Foaming occurs in many industrial processes, including the process of steelmaking. The by-products of the steelmaking process combine with fluxes to form a slag layer that floats on the metal bath and transforms into a foamy texture during the process. Studies have found that the main contributor to slag foaming is the decarburisation of metal droplets ejected into the slag emulsion during the impact of the oxygen jet on the metal bath [1,2]. Slag foam is instrumental in the steelmaking process due to several advantages to both the Electric Arc Furnace (EAF) and BOF, the two dominant steelmaking technologies. The foam creates an increased surface area that promotes high rates of reactions taking place in the furnace while acting as an insulator that reduces the heat lost to the environment through the mouth of the BOF vessel. One major drawback is the excessive production of slag foam, which can cause the foam to overflow the furnace, and is known as “slopping”. This can be detrimental to the work personnel of the plant, the environment, and the production process. Therefore, the optimum heat would be that which produces the appropriate amount of slag foam, allowing it to have high rates of reaction but not overflow. There has been extensive research carried out on the forming of slag foam, but it is often difficult to relate laboratory-scale experiments to the industry due to its adverse working environment and the difficulty of obtaining physical measurements [3,4].
The control of slag foam in the BOF is often based on the ability to accurately measure the height of slag foam during the dynamic foaming process. There are several different technologies used and studied, including image analysis, vibrational measurements, audio analysis, and off-gas analysis, in monitoring slopping [5,6,7,8,9]. Sonic meters or microphones have been a common method used in the BOF since the 1970s. Yet there remain doubts on how accurate and repeatable these measurements are in industrial practice. Accuracy and repeatability are extremely difficult to achieve due to the complex characteristics and the evolving structure of liquid foams in general.
The behaviour of sound through liquid foam is known to be dependent on various factors of the liquid foam, such as its viscosity, bubble size, and liquid fraction [10,11,12,13]. Sound attenuates when travelling through a heterogenous medium such as a foam. However, there has been limited research carried out on the attenuation of sound through slag foam. This paper will provide a brief introduction to the creation of slag foam in the BOF and the behaviour of sound through liquid foam. Cold model experimental studies on determining the dynamic foam height using acoustic analysis will be discussed, followed by an analysis of various industrial studies performed on the BOF, using acoustic analysis in predicting and determining the overflow of slag foam from the vessel (slopping). This article will summarise the current level of understanding on the topic and distinguish clear gaps in knowledge that require further study.

2. Foaming in the Basic Oxygen Furnace

Foaming of slag is a crucial part of the steel-making process. The proper control of slag foam is necessary to make the process of steel making efficient. The slag by-product is less dense than molten steel, which allows it to float on molten steel. For much of the process, the “slag” can be correctly described as an emulsion, where droplets of metal, entrained gas bubbles, undissolved fluxes, and liquid oxides are mixed by turbulent flow patterns. However, there are other periods during the “blow” where a distinct foaming slag is formed, and this foaming is associated with small bubbles generated from the decarburisation reactions occurring between metal droplets in the slag. The transition from an emulsion to a foam can be sudden in the process [3,4,14].
There are several oxidation reactions that take place during the oxygen blowing stage at the impact area of the oxygen jet and within the metal droplets ejected into the slag foam. Experimental studies conducted by Zhang and Fruehan found that the reduction of iron oxide produced small bubbles, and their sizes were dependent on the amount of sulphur in the iron, as sulphur is a surface-active element and can limit the decarburisation reaction at the surface of the droplet. They studied a range of bubble sizes from 1 to 15 mm and found that smaller bubble sizes produced a more stable foam than the larger bubbles [15]. Dynamic modelling by Rout et al. predicted that about three-quarters of all carbon was removed from the reactions that take place within the slag emulsion and the rest through the reactions in the impact area of the oxygen jet [1]. This was an improved estimate from Dogan et al.‘s initial model predictions of around sixty per cent of decarburisation occurring in the slag emulsion zone [2]. Kadrolkar and Dogan mathematically modelled the decarburisation kinetics of metal droplets in the slag emulsion and estimated decarburisation rates [16]. They predicted that three-quarters of the decarburisation occurs in the slag emulsion at the start of the blow and this reduces to around five per cent towards the end of the blow [16]. These recent studies on metal droplet behaviour in the slag emulsion zone were built on earlier studies by He and Standish [17], Molloy [18], and Subagyo et al. [19]. Equations (1)–(6) elaborate on the sequence of reactions that take place in the jet impact zone and within the metal droplets ejected into the slag foam. The gases generated create bubbles in the slag, turning it into a foamy texture. The chemicals present in the slag act as surfactants, which help create a foam on top of the metal bath [3,4,20,21]. Figure 1 schematically shows the main processes involved with foaming in the BOF and different regions in the furnace [6].
[ C ] + 1 2 O 2     CO   ( Impact   zone )
[ C ] + O 2     CO   2 ( Impact   zone )
Fe   + 1 2   O 2   FeO   ( Metal   bath )
CO   + FeO     Fe   +   CO 2   ( Slag   Surface )
CO 2 + [ C ]     2 CO   ( Metal   Surface )
( FeO ) + [ C ]     Fe   +   CO   ( Overall   Reaction )
The event of slag foam overflowing the BOF vessel is known as “slopping”. Slopping entails several unfavourable consequences, from monetary losses to harmful effects on the environment. Slopping causes loss of metal, damage to the vessel and its equipment, workplace hazards, and contributes to environmental pollution through excessive emission of dust [6]. The optimum level of slag foam in the BOF is a level that is both high enough to allow maximum decarburisation and not too high to overflow. This is a difficult condition for an operator to maintain due to the lack of real-time monitoring and unpredictability of the slag foam height. Vos et al. stated that from industry experience, slopping often took place when 30 to 40 per cent of oxygen had been blown into the vessel [22].
Based on Bikerman’s [23] foaming index, Ito and Fruehan [24] introduced the slag foam index (∑). Ito and Fruehan conducted their studies in a small alumina crucible that was held in an isothermal state using an electric resistance furnace. The crucible held slag (comprising FeO, CaO, and SiO2), and argon gas was bubbled through in low velocities to create slag foam [24]. Ito and Fruehan’s studies were built on earlier fundamental research by Cooper and Kitchener [25] and Swisher and McCabe [26] on slag foaming [27].
Σ = Δ H Δ V s g  
The slag foam index, as shown in Equation (7), is the ratio between the change in slag height in cm ( H ) and the change in superficial gas velocity in cm/s ( V s g ). Fruehan and his associates performed dimensional analysis to produce a mathematical model for the slag foaming index; this was revised several times by himself and other researchers to include variables that directly influenced the predictability of the foam height [15,28,29,30,31]. Some of the important properties that were found to affect the slag foam behaviour were bubble size, acidity/basicity of the slag, and effective surface elasticity.
Gou et al. objected to the industrial application of the slag foam index based on the velocity differences used in Fruehan’s modelling experiments and the actual dynamic foaming process of slag [32]. Gou et al. explained that the low gas velocities of up to 0.1 m/s used in Fruehan’s experiments of slag foaming created a soap-like foam that was clearly split into two layers of wet and dry foam. However, industrial reduction vessels use much higher velocities ranging from 0.3 to 3 m/s, which created a more “turbulent and churning” foam composition, which would collapse faster than a conventional liquid foam once the gas supply is cut off. Gou et al. termed this turbulent churning foam region as “expanded slag” [32]. Gou et al. observed that the high gas velocities in steelmaking are hard to directly relate to the low gas flowrates in slag foaming laboratory experiments. While this is correct, there is also substantial industrial evidence that slags in steelmaking do, in fact, foam. Evidence suggests that the localised generation of low velocity smaller bubbles from metal droplets reacting in the slag layer are responsible for slag foaming and not the large gas flow rates generated from the decarburisation of metal where the injected gas hits the surface of the bath (the impingement zone shown in Figure 1). It must be acknowledged that the distinction between slag foam and “expanded slag” inside steelmaking vessels is not clear and hence, an ongoing subject of study.
Vos et al. compared the foaming index to acoustic data obtained from an industrial BOF plant [22]. A lower acoustic measurement was expected for slag with a high foaming index [22]. The results obtained by Vos et al. displayed an inconsistent relationship between the foaming index and the acoustic measurement. It was concluded that the foam index was not a good method for predicting foamy slag heights in an industrial setting [22]. Part of the difficulty in predicting slag foam heights in industrial operations is knowing the size of bubbles generated from decarburisation, as this is known to have a significant impact on foam generation [15].

3. Sound in Liquid Foam

The existence of bubbles in a liquid can create a large difference in the acoustic properties of the liquid. To understand the movement of sound through slag foam in the BOF, it is crucial to have good knowledge of the movement of sound in bubbles and foams. The formation of bubbles creates sudden excitations that cause the bubble’s volume to oscillate about its equilibrium, which produces acoustic pressure pulses. These oscillations later return to equilibrium, which terminates the sound pulses produced [33]. The sound produced during the bubble generation can be used to determine the bubble size [34,35].
The acoustic characterisation of a continuum of bubbles or foams is very different from a single bubble system. The existence of a second neighbouring bubble would mutually interact and cause noticeable changes in the frequency [10,35,36]. Ooi and Manasseh used mathematical modelling to prove that acoustic attributes such as the natural frequency and the acoustic dampening of the system reduced with the increasing number of bubbles [35]. The attenuation of sound in liquid foams is due to the impedance difference between liquid and air interfaces in the multitude of foam cells. This is analogous to the way in which sound is attenuated in other porous materials [37]. Sound travelling through air pockets in the porous/foam media will lose its energy in the form of heat and by the vibration of the outer cell (bubble) walls. The speed of sound through a liquid foam is much lower compared to the speed of sound in air (340 m/s) and water (1500 m/s). This decrease was predicted by Wood [38], who modelled the lower speed values of 32 m/s for liquid volume fractions of 11 per cent. This low speed was due to the presence of liquid and the high compressibility of gas, which are the main factors affecting the speed of sound through foam according to Wood’s model [11]. There are studies that recorded higher speeds than predicted by Wood’s model [10,11,39]. Pierre et al. conducted experimental studies on the dispersion of acoustic waves through liquid foams over a range of frequencies from 60 to 600 kHz [10]. In their study, they measured and explained the behaviour of sound through liquid foams by relating it to the motion of the liquid films and channels surrounding the bubbles of the foam [10]. They also proposed an empirical model combining the movement of air, films, and liquid channels [10]. The attenuation of the acoustic waves was found to be frequency-dependent, and the frequency with the maximum attenuation reduced with increased median radii of the bubbles [10,12]. Pierre et al. recorded that the speed of sound increased with time as the liquid fraction of the foam reduced, creating a “drier” foam. The speed of sound through liquid foam also increased above Wood’s predictions with higher frequencies and bubble sizes [10].
The structure of foams consists of liquid films and channels known as plateau borders that have contrasting shapes and masses. The oscillations induced by an acoustic wave cause the films to move, producing strain on the plateau borders. Low-frequency sound passes through foams at low speeds, and high-frequency sound passes through liquid foam at much higher speeds. Moderate frequencies cause the lamellae films and the plateau borders to move in the opposing direction to the waveform, causing it to be blocked, hence increasing the attenuation through the foam [10,12]. Birk et al. used a relationship proposed by Ingard to model the attenuation of sound through liquid foam given by Equation (8) [8,13].
I ( h ( t ) , ω ) = I 0 e β F ( ω ) h ( t )
where I was the sound intensity, h was the foam height, I 0 was the initial sound intensity, t is denoted as time, and ω as frequency. The sound intensity was related to the frequency-dependent attenuation coefficient β F , which was distinctive to the material and the bubble size of the foam [8].

4. Cold Model Study on Control of Slag Foam Using Acoustic Analysis in the BOF

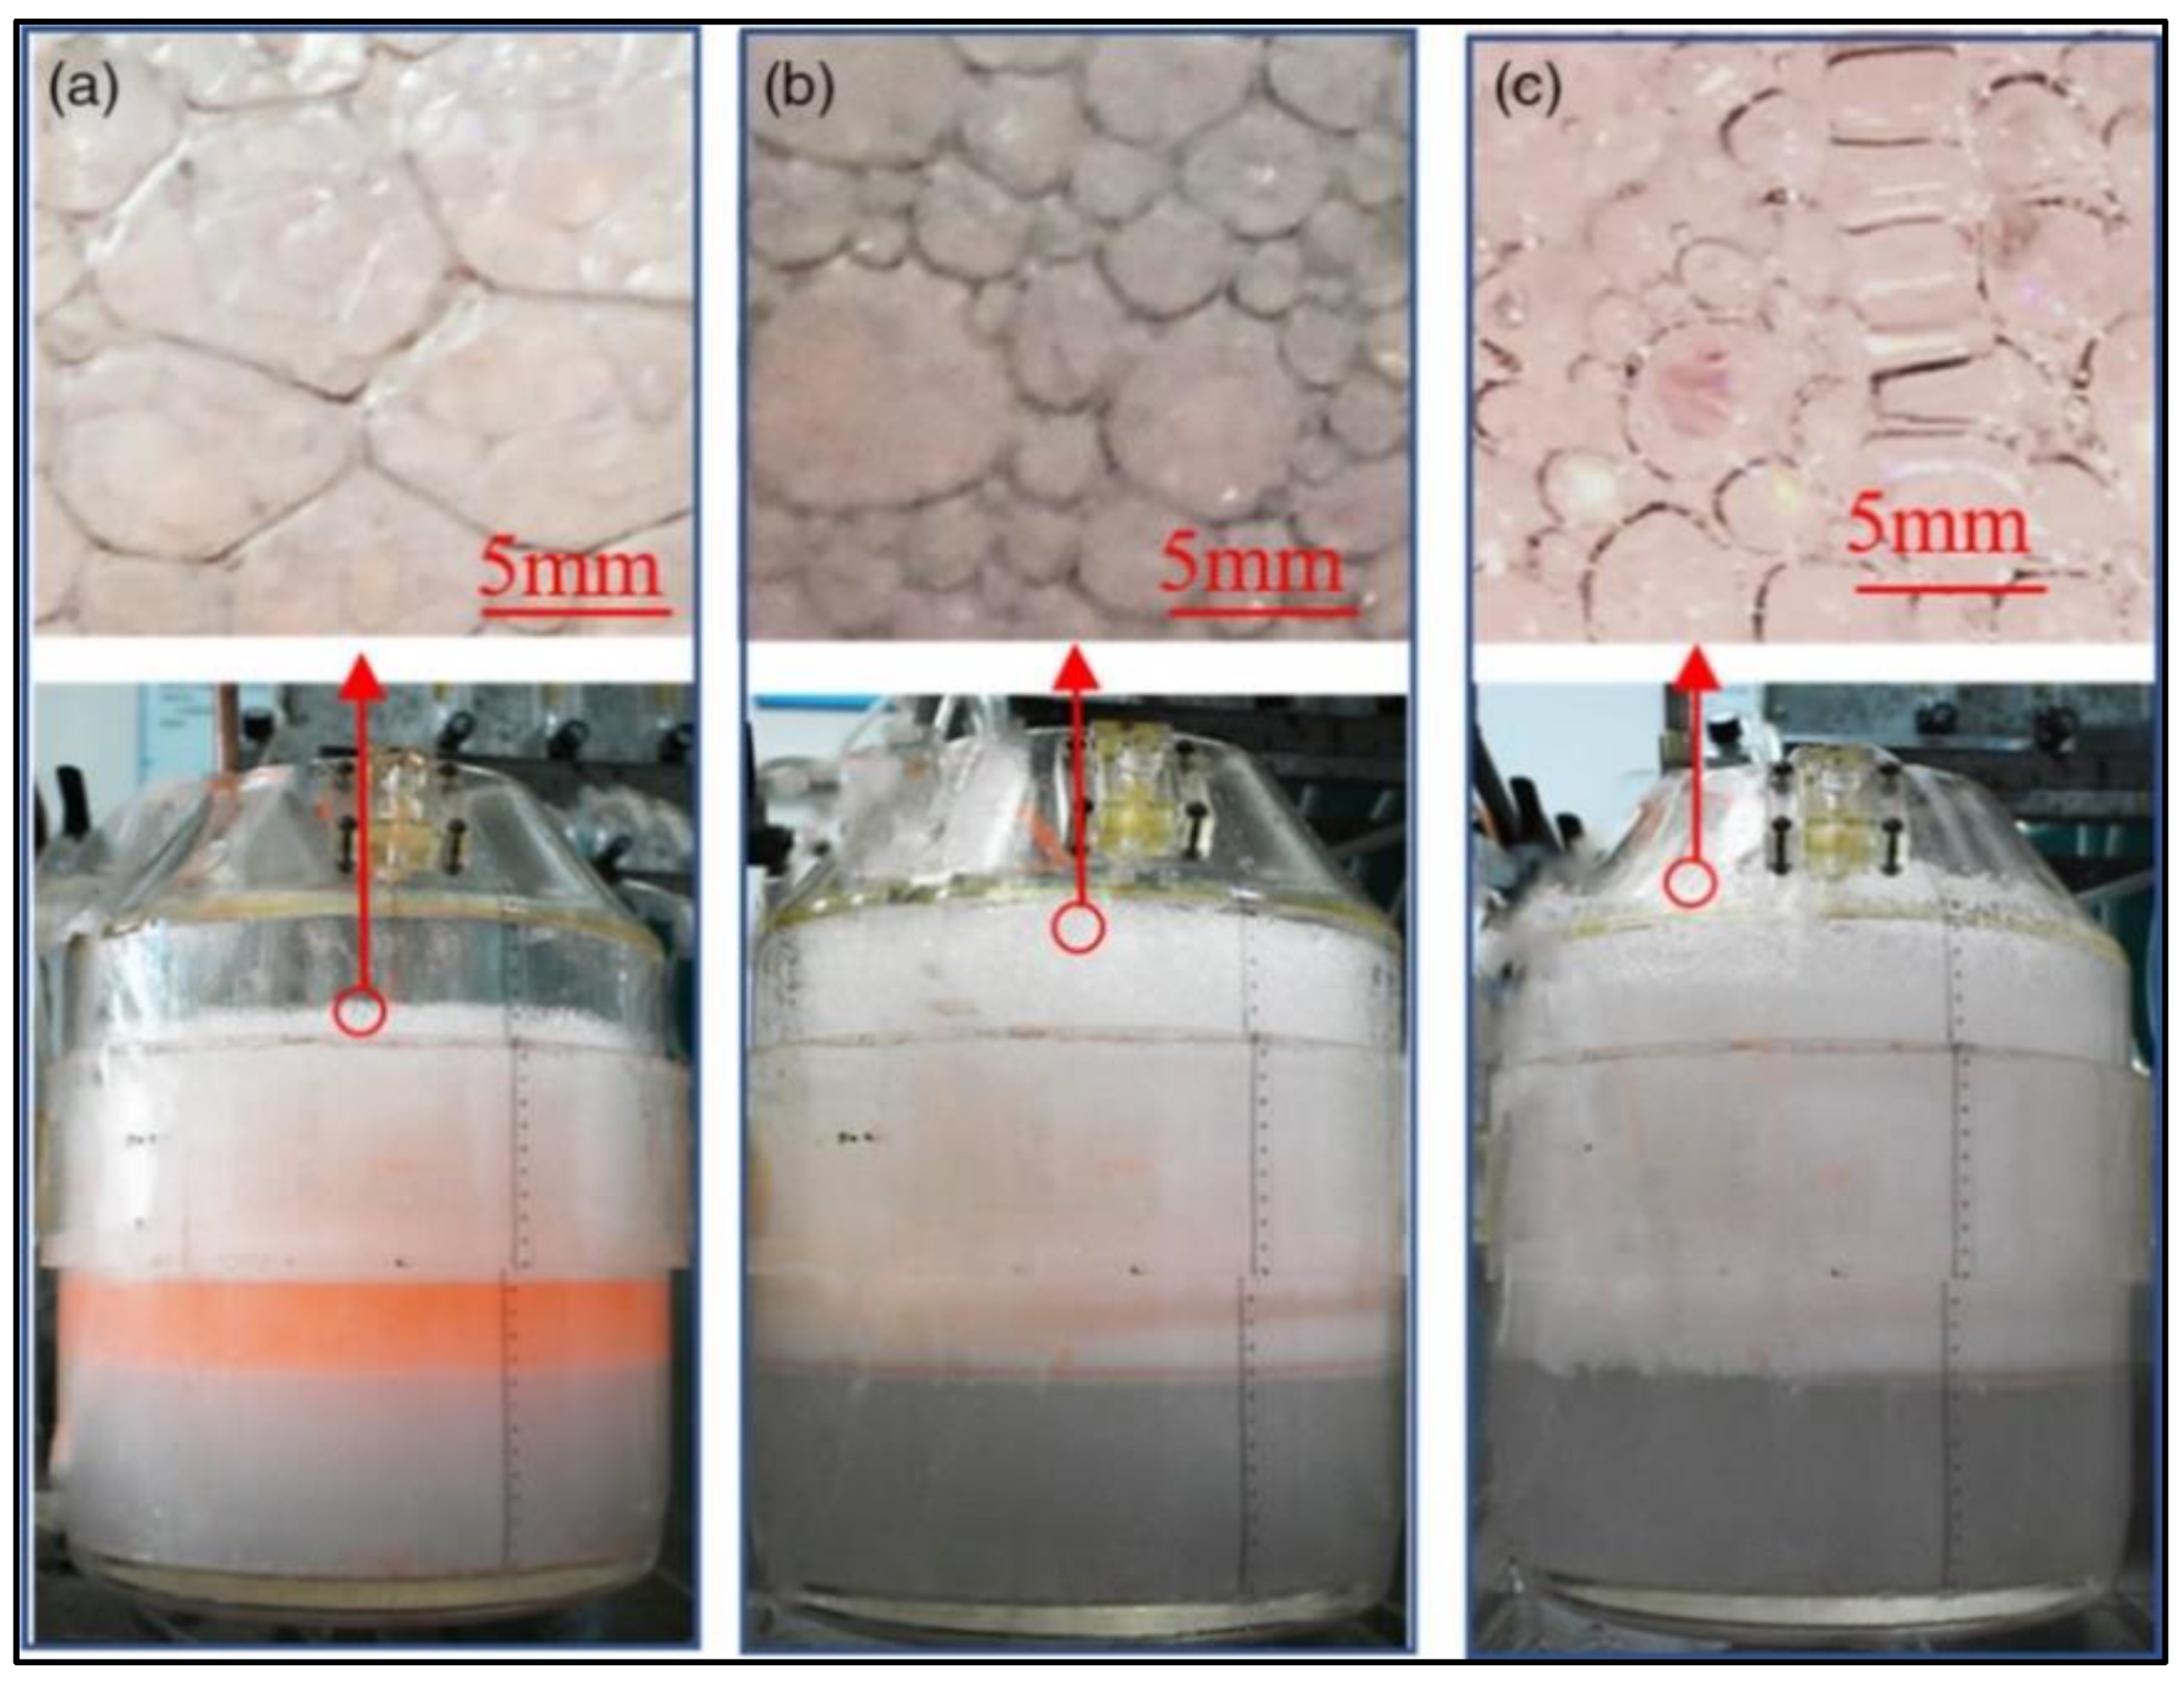
Using cold water models to conduct laboratory studies of the steel-making process is a well-known method for studying the basic aspects of the process [40,41]. Choudhary and Ajmani used the modified Froude number to scale the dimensions of the lance tip and tuyeres when designing their 1/6th scaled-cold model to study the effects of bottom stirring in the BOF [42]. The modified Froude number is adopted by most cold modelling studies conducted on the steelmaking process to achieve dynamic similarity. Cold modelling studies on splashing in the BOF by Wang et al. modelled the gas emission by the decarburisation of metal droplets in slag foam by reacting powdered NaCO3 with sulphuric acid [41]. Some images from an experimental foaming study conducted by Wang et al. are shown in Figure 2, including different foam structures created by varying the dynamic viscosity of the solution [41]. Birk et al. used a cold model for their studies on the control of dynamic foaming using acoustic analysis. They studied the relationship between the foam height and the sound intensity during the dynamic foaming process [8]. They assumed that the lance contributed to most of the sound generated in the BOF and studied how the sound from the exit of the lance attenuated as the foam height increased. They found that the sound intensity was a strong function of the foam height. The experimental results they found followed Equation (5) [13]. Sabah and Brooks investigated different cavity modes in the BOF using acoustic analysis of a cold model [43]. They performed waveform and spectral analysis and reported the successful identification of cavity modes using acoustic signals of the cold model. The amplitude of the waveform and the sound level of the spectral analysis both increased as the cavity modes changed from dimpling to penetrating flow depending on the gas velocity and lance height [43]. The study was also instrumental in understanding the different uses of acoustics in the BOF.
The cold model developed by Birk et al. was a simple meter-long tube shown schematically in Figure 3 [8]. They did not describe how the equipment was geometrically or dimensionally modelled relating to the industrial BOF. The use of an inverted tube in the experiments alienates most background noise and has no contact with the test rig to avoid vibrational disturbances.
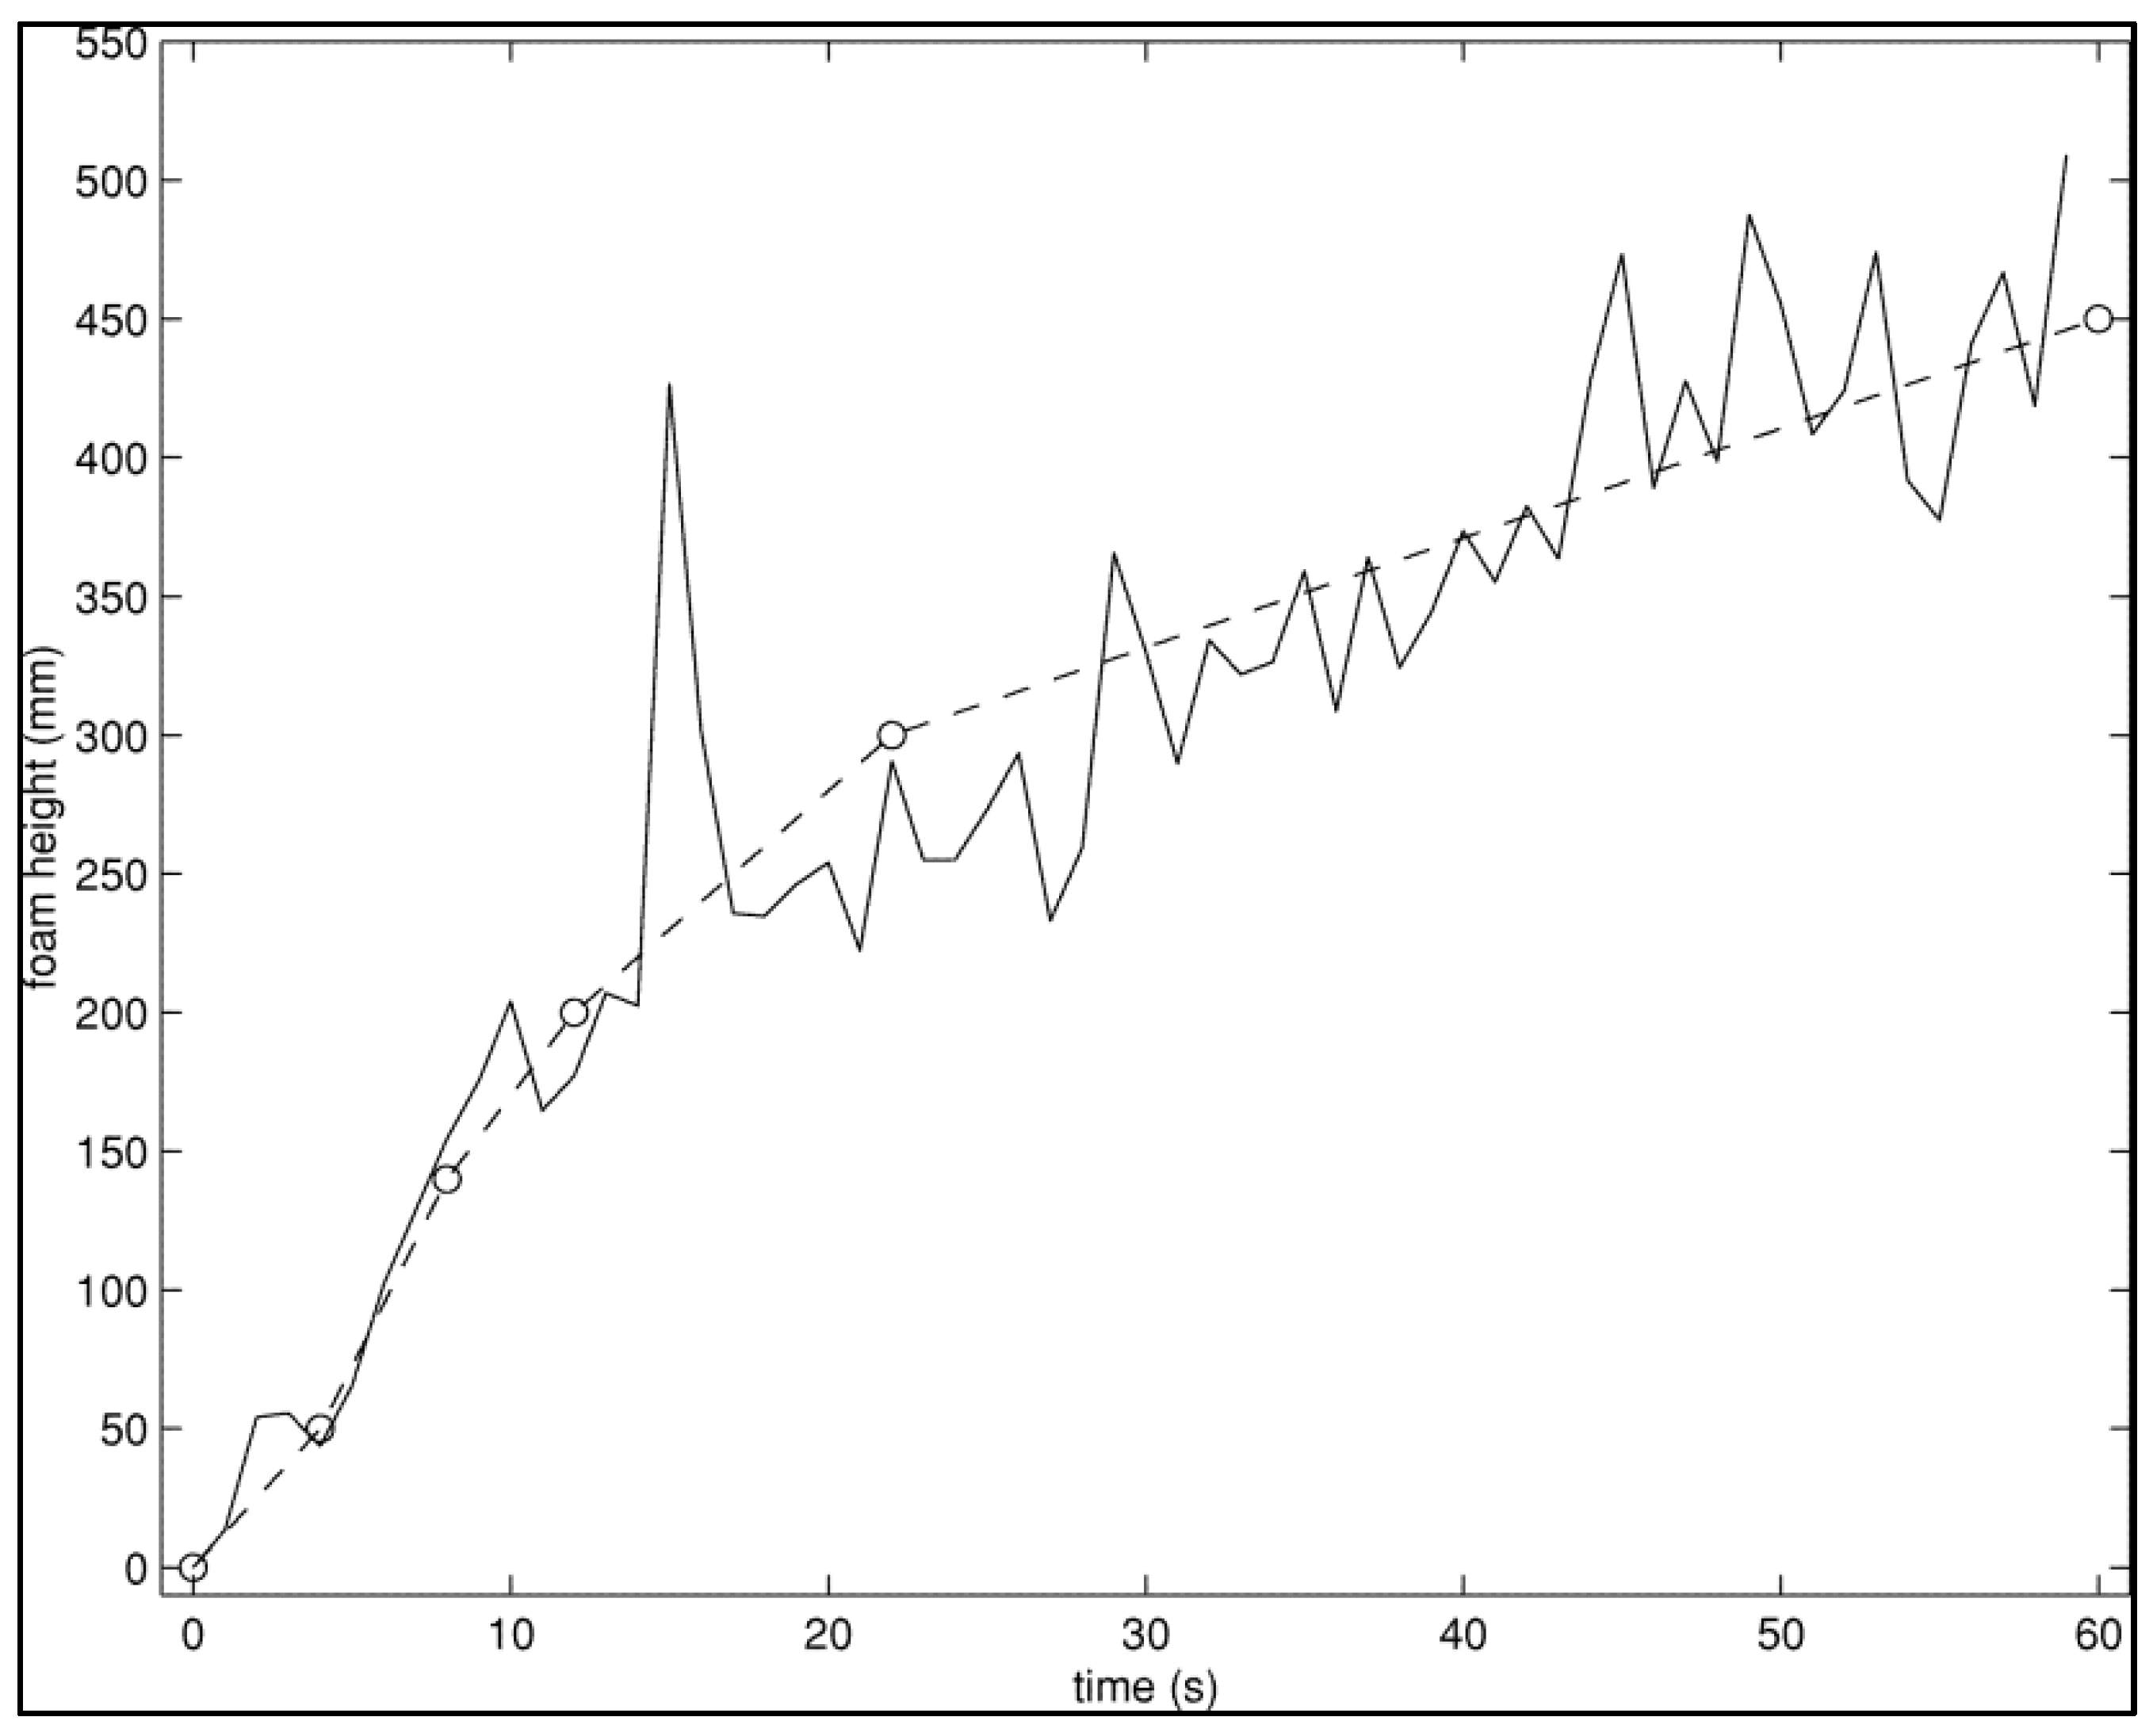
Birk et al. estimated the foam height using the logarithm of Equation (5) to analyse the signal. The data was windowed, and a Fast Fourier Transform (FFT) was applied. The FFT is an efficient application of the Discrete Fourier Transform (DFT). The DFT portrays a signal in the time domain or the spatial domain in the frequency domain [44]. The frequency range from 2 to 11 kHz was recognised as the important frequency due to its significant attenuation with the increase in foam height. The least-squares method was used, and an estimated value of 600 was obtained for the attenuation coefficient β F . Figure 4 graphically shows the relationship between the estimated foam height and the actual foam height obtained in the cold model experiments. The predicted foam height using the acoustic signals showed good agreement with the measured foam heights. Birk et al. applied the algorithm to an industrial BOF, but no details were provided [8].
The estimation of β F was conducted by measuring two known readings of the sound intensity and the foam height as reference points in the experiment. The known readings would be the sound intensity when the foam height was zero and the sound intensity when the foam height was at its maximum height. The value of β F was dependent on frequency; therefore, when estimating a range of frequencies, a weighted least-square algorithm was used.

5. Plant-Based Studies on Dynamic Control of Slag Foam Using Acoustic Analysis

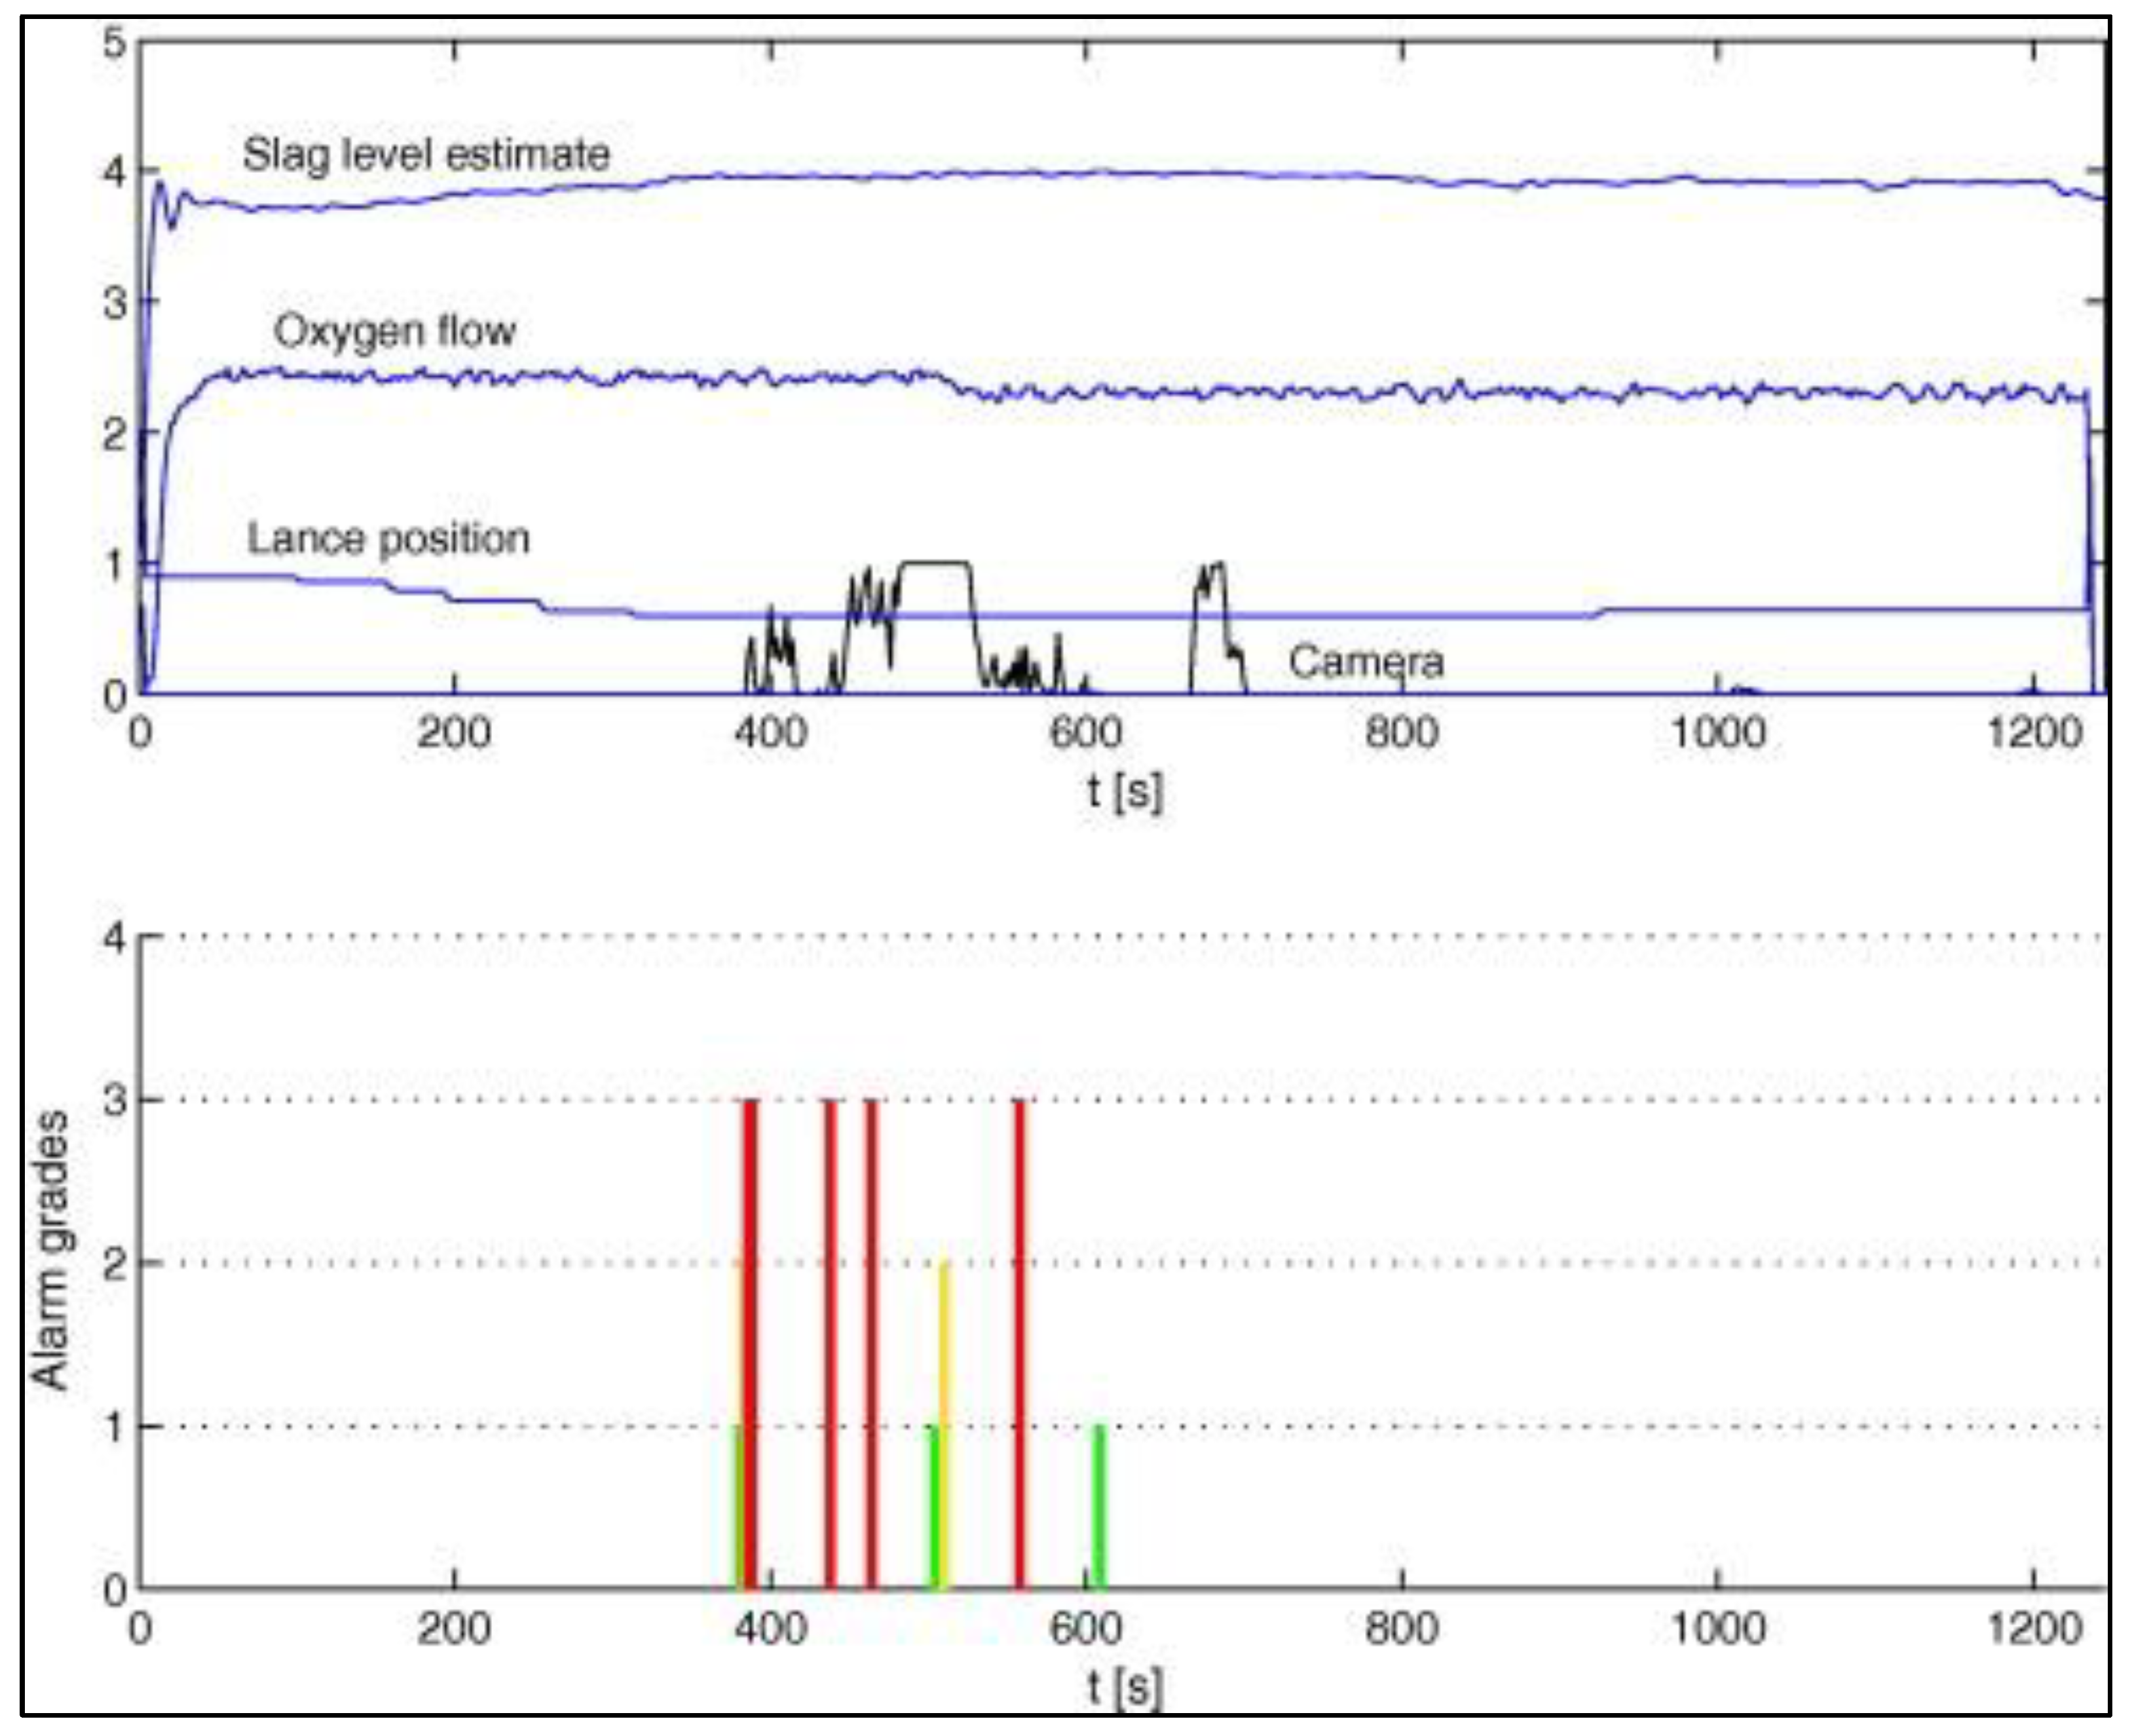
Industrial plant trials are essential in validating studies in a practical environment. Evestedt and Medvedev [7] designed a slopping warning system for the BOF process based on the weighted least-square algorithm proposed by Birk et al. [7,8]. Evestedt and Medvedev performed 100 plant trials at SSAB Oxelösund based on the warning system developed. The system used a microphone for sound and a camera for optical inputs. Using an adaptive filtering system based on the Kalman filter, the study tried incorporating the acoustic signal with information from other sensors. Table 1 summarises the different data used in the study, the methods they were measured with, the location of the sensors, and the time delay in data acquisition. The process information captured, using the relevant sensors listed in Table 1, was incorporated using the Kalman filter in their study. The Kalman filter is essentially an algorithm estimating an unknown state utilising specific measured data [45]. Figure 5 shows the slopping alarms for heat with medium slopping [7]. The model was able to correctly detect slopping events with an accuracy of 80 per cent out of the 100 trials performed. Although the study showed good accuracy in warning the operator, it did not necessarily provide a real-time slag height measurement during the blow.
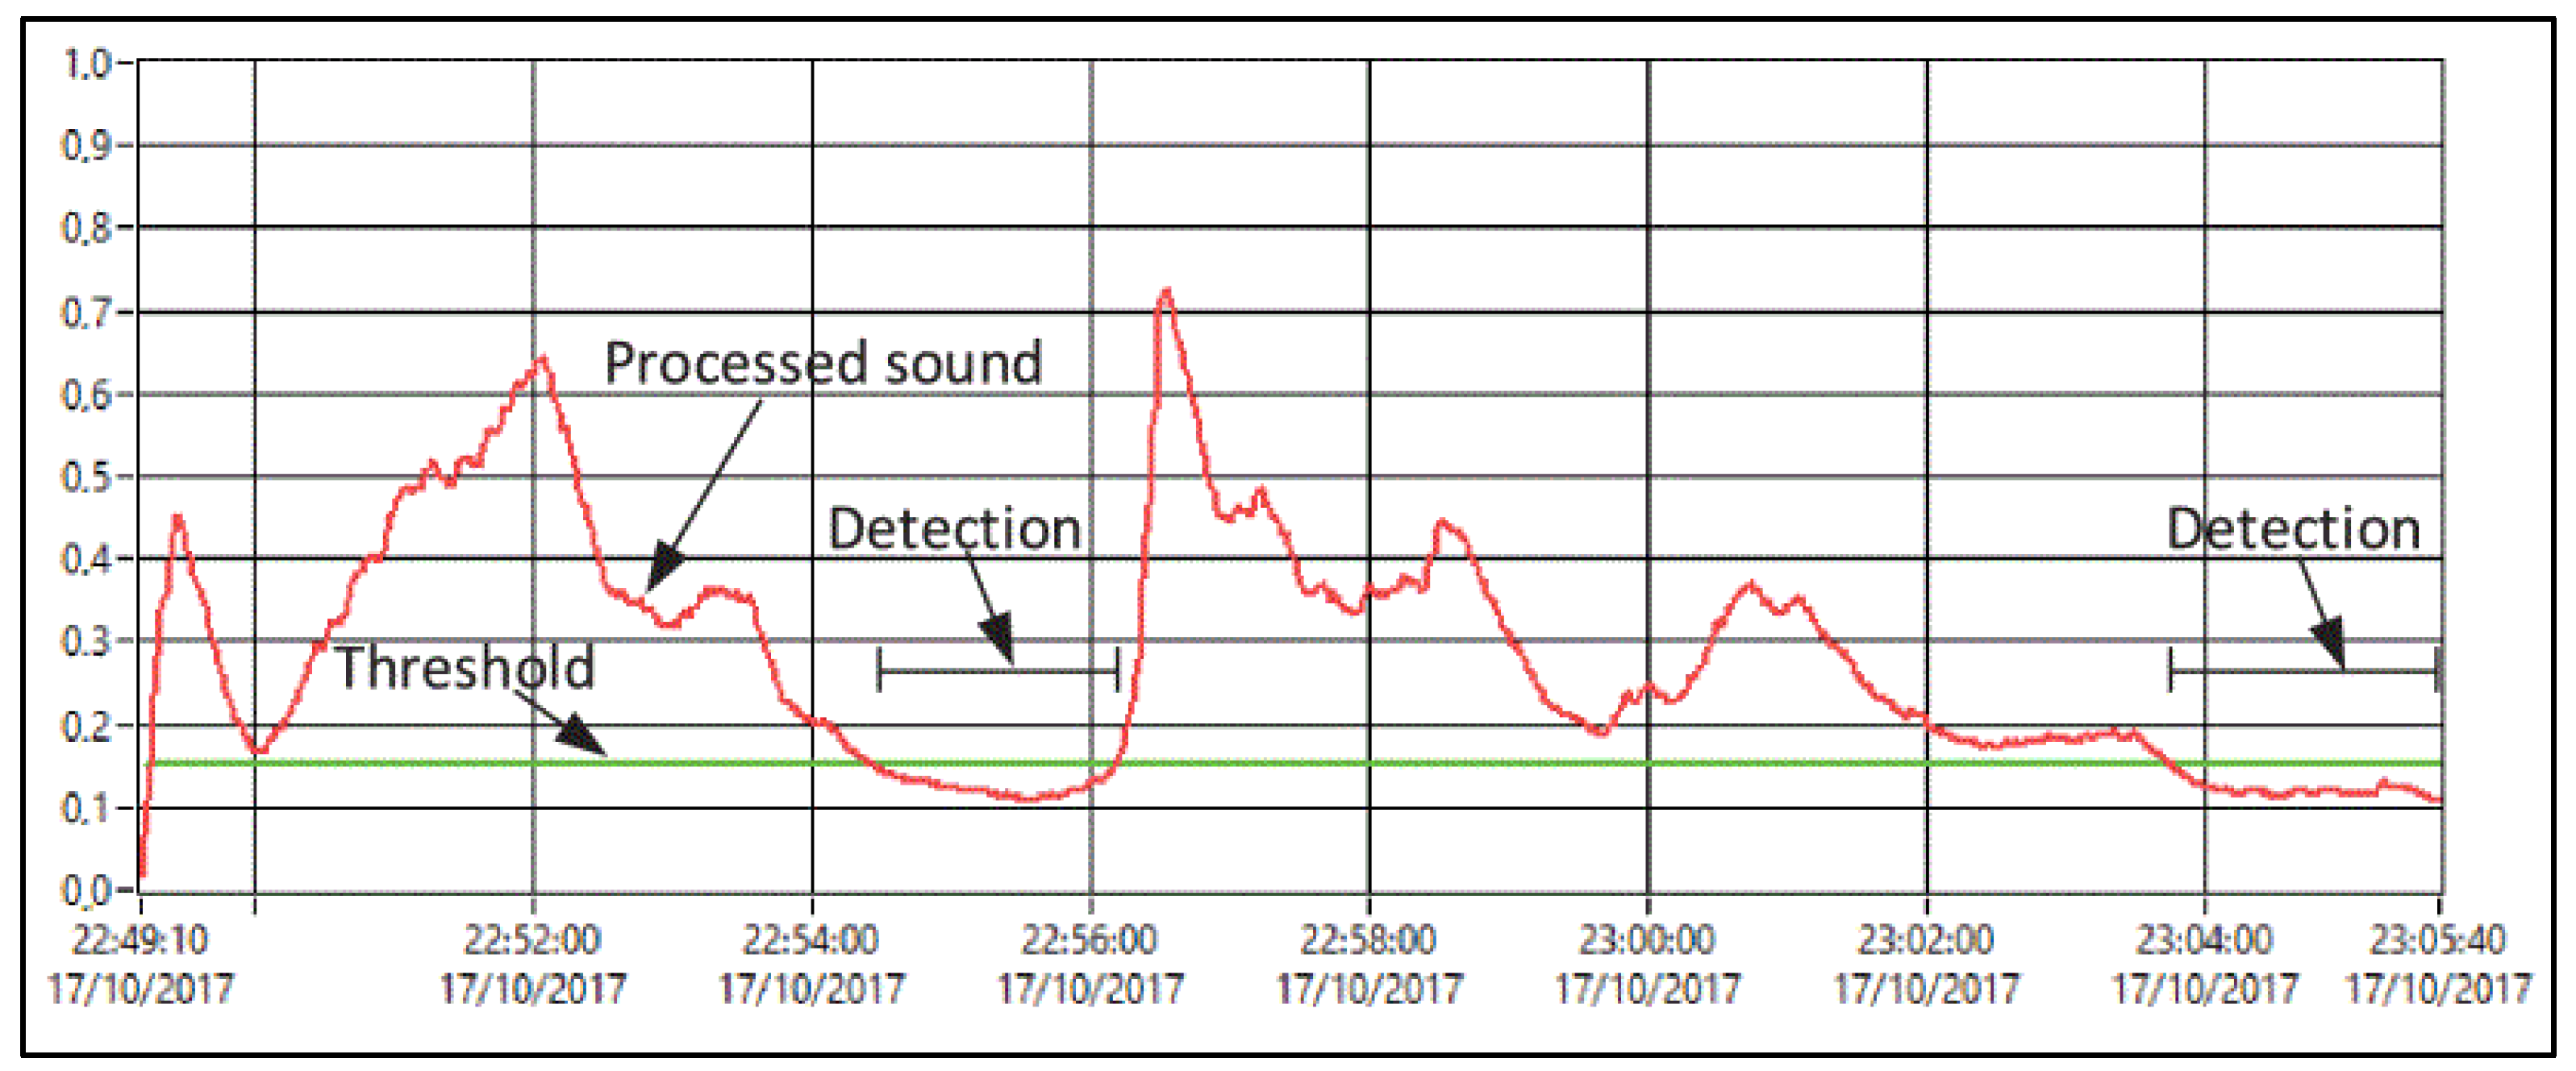
Batista et al. created a slop detection method based on sound and image analysis [46]. They described the useful attribute of the sound signal as its ability to ensure the non-occurrence of a slopping event when the bandwidth-filtered signal was above a threshold limit. Figure 6 shows a typical sound spectrum of a single heat with two detections of slopping. The sound signal identified periods with the probability of a slopping event but was not an accurate detector of slopping or the level of slag foam in the vessel. Sixty-seven plant trials were performed and evaluated based on the same criteria as by Evestedt and Medvedev [7]. The new study showed a seven per cent increase in accuracy using the combined system of image and acoustic processing [46]. This was further studied by De Menezes et al. using a similar image and sound analysis system with a fuzzy Kalman filter for the data fusion [47]. A threshold alerting system was formed using the acoustic data, and a threshold alarm level was found using image data. The system demonstrated an accuracy of 66 per cent of correct alarms over the total number of alarms and 87 per cent accuracy in correctly identified heats. The need for further trials in determining an accurate Kalman filter index is highlighted in their conclusion.
Deo et al., collaborating with Tata steel Netherlands, Tata Steel India, and Visakhhapatnam Steel Plant in India, studied chaos-based control of slag in the BOF [48]. They review the existing practical uses of acoustic sensors in the BOF. In their background study, they imply that acoustic signals have an accuracy greater than 70 per cent in detecting a slopping event but do not provide any measurements of real-time slag foam heights with existing analysis methods [48]. Acoustic signals are understood to be good indicators of slag formation—attenuating the sound intensity with increasing slag foam and accentuating with drier foam (less liquid content) [48]. The acoustic signal was found to be sensitive to changes in lance height, speed of the oxygen blow, the addition of substances mid-blow, and changes in slag composition.
Brämming performed plant trials in SSAB EMEA Metallurgy’s BOF plant in Lulea and investigated slopping prevention techniques with the use of vibrational and acoustical signal analysis [6]. The study mainly investigated the use of vibration signals with less focus on acoustic signal analysis. They speculated that the audio signal was not useful until the slag foam surpassed the lance tip during the blow and lowered its precision with the increasing slag foam height [6]. Brämming’s results showed that the vibration signals could detect a slopping event earlier than an audio signal but stated that the number of trials was too low to draw a definite conclusion on the better method and advised using a combined system. Brämming does highlight that the audio data obtained from Lulea were of a similar pattern to audio systems in other steelmaking plants and stated that the prominent frequency range for slag foam height prediction of the 130-tonne BOF vessel is between 400 and 450 Hz [6]. Brämming et al. compared the audio and vibration signal data of the 120-tonne BOF vessel in Lulea with a 300-tonne vessel in Scunthorpe [49]. They found that the use of vibration was possible in any size of BOF, provided that the optimum mid-frequency would decrease with increased vessel size. They suggested that due to the independence of the two signals, the use of a combined system would prove to be more accurate [49].
Ghosh used an opto-acoustic system for early detections of slopping and performed trials at Salzgitter steelworks, a German steel plant [50]. Ghosh explained that the audio signal did not directly correlate with the slag foam level in the BOF but helped predict slopping using a threshold acoustic level that was predetermined, as illustrated in Figure 6 by Batista et al.’s studies [46]. The threshold level was dependent on factors such as vessel geometry, blow technique, and material composition.
The present sonic systems used in most industrial settings do not undergo routine calibration of the microphones, which could lower the quality of the signal used in the analysis. There is much less knowledge in the industry on the effects of various ongoing conditions on the acoustic signal. These range from the slag composition to vessel build-up and “skulling” of the microphone hatch opening between de-skulling cycles. Developing an accurate and consistent relationship between the slag foam height and the acoustic signals using basic signal analysis methods such as Fast Fourier Transform, Short-Time Fourier Transforms and Power Spectrum is required prior to complex analysis techniques such as the Kalman filter [51,52].

6. Conclusions

The control of slag foam is an essential aspect of the oxygen steelmaking process that needs to be optimised. To do this, accurate measuring of the slag foam height during dynamic BOF process is necessary. This article outlines the current understanding and research performed on the implementation of acoustic analysis in the BOF to avoid slopping of the BOF.
The cold model studies have shown that there is a relationship between dynamic foam height and sound. The effect of solid particles on the acoustic signal during the dynamic foaming has not been explored using cold models. One of the major complications of acoustic studies of steelmaking using cold models was its difficulty to relate with industry data. It is recommended to study the use of acoustic scale modelling, similar to that used in architectural design models, to attempt to solve the issue [53].
Although acoustics have been shown to be successfully implemented in detecting slopping events, it lacks accuracy in real-time measuring of the slag height. The current use of acoustic signals in the industry is mainly focused on understanding the quality of slag formation depending on the attenuation of the sound signal. The use of a threshold intensity in the prediction of slopping in industrial trials is discussed in the literature. The present systems have accuracies ranging from 70 to 87 per cent of successful slopping detection. Several of these studies used a combination of sensory inputs such as image, vibration, and off-gas data to increase their accuracy. Current detailed acoustic studies of the BOF were instrumental in improving the BOF process via measurements of post-slopping events. The development of a real-time control system that could successfully predict and measure the slag foam height within the vessel during the blow would be a breakthrough for the industry and likely to lead to higher production yields, which would, in turn, contribute to lowering carbon dioxide emissions.
It is clear that there is a lack of knowledge on acoustic behaviour in dynamic liquid foaming, and there is a clear need for more fundamental research on the topic. In particular, there is a need to clarify the behaviour in aqueous systems before we can establish what is happening in molten slag systems. Of particular importance is understanding how the attenuation of sound in foam is influenced by foam structure, foam height, and the frequency of the sound being transmitted. This will help develop a better understanding of the behaviour of acoustics through both static and dynamic slag foams. Improving the accuracy of the acoustic system itself prior to incorporation with different sensors would help magnify the accuracy of a combined system such as combining sound with image data. Research into the possibility of being able to correlate foam heights to acoustic signals when testing algorithms during plant trials could help establish a system that could interpret the real-time foam height of the BOF, such as using sacrificial contact sensors. Industrial trials of new sensors and algorithms built on this improved understanding can realistically lead to accurate real-time measurement of slag foam height in steelmaking.

Author Contributions

Writing—original draft preparation, J.H.; writing—review, editing and supervision, G.A.B., M.D., D.S., R.S. and W.L. All authors have read and agreed to the published version of the manuscript.

Funding

The authors wish to acknowledge funding from the Australian Research Council (ARC) through the Industrial Transformation Research Hubs Scheme under Project Number: IH2001000.

Institutional Review Board Statement

Not applicable.

Informed Consent Statement

Not applicable.

Conflicts of Interest

The authors declare no conflict of interest.

References

  1. Rout, B.K.; Brooks, G.; Rhamdhani, M.A.; Li, Z.; Schrama, F.N.H.; Overbosch, A. Dynamic Model of Basic Oxygen Steelmaking Process Based on Multizone Reaction Kinetics: Modeling of Decarburization. Metall. Mater. Trans. B 2018, 49, 1022–1033. [Google Scholar] [CrossRef]
  2. Dogan, N.; Brooks, G.A.; Rhamdhani, M.A. Comprehensive model of oxygen steelmaking part 2: Application of bloated droplet theory for decarburization in emulsion zone. ISIJ Int. 2011, 51, 1093–1101. [Google Scholar] [CrossRef] [Green Version]
  3. Snigdha, G.; Bharath, B.N.; Viswanathan, N.N. BOF process dynamics. Miner. Processing Extr. Metall. 2019, 128, 17–33. [Google Scholar] [CrossRef]
  4. Holappa, L. Historical overview on the development of converter steelmaking from Bessemer to modern practices and future outlook. Miner. Processing Extr. Metall. 2019, 128, 3–16. [Google Scholar] [CrossRef]
  5. Brämming, M.; Millman, S.; Overbosch, A.; Kapilashrami, A.; Malmberg, D.; Björkman, B. BOS vessel vibration measurement for foam level detection. ISIJ Int. 2011, 51, 71–79. [Google Scholar] [CrossRef] [Green Version]
  6. Brämming, M. Avoiding Slopping in Top-Blown BOS Vessels. Ph.D. Thesis, Luleå Tekniska Universitet, Luleå, Sweden, 2010. [Google Scholar]
  7. Evestedt, M.; Medvedev, A. Model-based slopping warning in the LD steel converter process. J. Process Control. 2009, 19, 1000–1010. [Google Scholar] [CrossRef]
  8. Birk, W.; Arvanitidis, I.; Jonsson, P.G.; Medvedev, A. Physical modeling and control of dynamic foaming in an LD-converter process. IEEE Trans. Ind. Appl. 2001, 37, 1067–1073. [Google Scholar] [CrossRef]
  9. Sandlöbes, S.; Senk, D.; Sancho, L.; Diaz, A. In-situ measurement of CO- and CO2-concentrations in bof off-gas. Steel Res. Int. 2011, 82, 632–637. [Google Scholar] [CrossRef]
  10. Pierre, J.; Dollet, B.; Leroy, V. Resonant Acoustic Propagation and Negative Density in Liquid Foams. Phys. Rev. Lett. 2014, 112, 148307. [Google Scholar] [CrossRef] [Green Version]
  11. Elias, F.; Crassous, J.; Derec, C.; Dollet, B.; Drenckhan, W.; Gay, C.; Leroya, V.; Noûse, C.; Pierref, J.; Saint-Jalmes, A. The Acoustics of Liquid Foams. Curr. Opin. Colloid Interface Sci. 2020, 50, 101391. [Google Scholar] [CrossRef]
  12. Pierre, J.; Guillermic, R.-M.; Elias, F.; Drenckhan, W.; Leroy, V. Acoustic characterisation of liquid foams with an impedance tube. Eur. Phys. J. E 2013, 36, 113. [Google Scholar] [CrossRef] [PubMed]
  13. Ingard, U. Notes on Sound Absorption Technology; Noise Control Foundation: Poughkeepsie, NY, USA, 1994.
  14. Dogan, N.; Brooks, G.A.; Rhamdhani, M.A. Comprehensive model of oxygen steelmaking part 1: Model development and validation. ISIJ Int. 2011, 51, 1086–1092. [Google Scholar] [CrossRef] [Green Version]
  15. Zhang, Y.; Fruehan, R. Effect of the bubble size and chemical reactions on slag foaming. Metall. Mater. Trans. B 1995, 26, 803–812. [Google Scholar] [CrossRef]
  16. Kadrolkar, A.; Dogan, N. The Decarburization Kinetics of Metal Droplets in Emulsion Zone. Metall. Mater. Trans. B 2019, 50, 2912–2929. [Google Scholar] [CrossRef]
  17. He, Q.L.; Standish, N. A model study of droplet generation in the BOF steelmaking. ISIJ Int. 1990, 30, 305–309. [Google Scholar] [CrossRef]
  18. Molloy, N. Impinging jet flow in a 2-phase system-basic flow pattern. J. Iron Steel Inst. 1970, 208, 943. [Google Scholar]
  19. Subagyo, G.B.; Coley, K.; Irons, G. Generation of droplets in slag-metal emulsions through top gas blowing. ISIJ Int. 2003, 43, 983–989. [Google Scholar] [CrossRef] [Green Version]
  20. Miller, T.W.; Jimenez, J.; Sharan, A.; Goldstein, D.A. Oxygen steelmaking processes. Mak. Shap. Treat. Steel-Steelmak. Refin. Vol. 1998, 475–524. [Google Scholar]
  21. Ghag, S.S.; Hayes, P.C.; Lee, H.-G. Physical model studies on slag foaming. ISIJ Int. 1998, 38, 1201–1207. [Google Scholar] [CrossRef] [Green Version]
  22. De Vos, L.; Cnockaert, V.; Bellemans, I.; Vercruyssen, C.; Verbeken, K. Critical Assessment of the Applicability of the Foaming Index to the Industrial Basic Oxygen Steelmaking Process. Steel Res. Int. 2021, 92, 2000282. [Google Scholar] [CrossRef]
  23. Bikerman, J.J. Foams; Springer: Berlin/Heidelberg, Germany, 1973. [Google Scholar]
  24. Ito, K.; Fruehan, R. Study on the foaming of CaO-SiO2-FeO slags: Part I. Foaming parameters and experimental results. Metall. Trans. B 1989, 20, 509–514. [Google Scholar]
  25. Cooper, C.; Kitchener, J. The foaming of molten silicates. J. Iron Steel Inst. 1959, 193, 48–55. [Google Scholar]
  26. Swisher, J.; McCabe, C. Cr2O3 As Foaming Agent in CaO-SiO2 Slags. Trans. Metall. Soc. AIME 1964, 230, 1669. [Google Scholar]
  27. Bikerman, J.J. Surface Chemistry: Theory and Applications; Elsevier Science & Technology: Saint Louis, MO, USA, 1958. [Google Scholar]
  28. Ito, K.; Fruehan, R.J. Study on the foaming of CaO-SiO2-FeO slags: Part II. Dimensional analysis and foaming in iron and steelmaking processes. Metall. Trans. B 1989, 20, 515–521. [Google Scholar] [CrossRef]
  29. Jiang, R.; Fruehan, R. Slag foaming in bath smelting. Metall. Trans. B 1991, 22, 481–489. [Google Scholar] [CrossRef]
  30. Ghag, S.S.; Hayes, P.C.; Lee, H.-G. The prediction of gas residence times in foaming CaO–SiO2–FeO slags. ISIJ Int. 1998, 38, 1216–1224. [Google Scholar] [CrossRef]
  31. Lotun, D.; Pilon, L. Physical modeling of slag foaming for various operating conditions and slag compositions. ISIJ Int. 2005, 45, 835–840. [Google Scholar] [CrossRef]
  32. Gou, H.; Irons, G.A.; Lu, W.-K. A multiphase fluid mechanics approach to gas holdup in bath smelting processes. Metall. Mater. Trans. B 1996, 27, 195–201. [Google Scholar] [CrossRef]
  33. Boyd, J.W.; Varley, J. The uses of passive measurement of acoustic emissions from chemical engineering processes. Chem. Eng. Sci. 2001, 56, 1749–1767. [Google Scholar] [CrossRef]
  34. Roshid, M.M.; Manasseh, R. Extraction of bubble size and number data from an acoustically-excited bubble chain. J. Acoust. Soc. Am. 2020, 147, 921–940. [Google Scholar] [CrossRef]
  35. Ooi, A.; Manasseh, R. Coupled nonlinear oscillations of microbubbles. ANZIAM J. 2004, 46, C102–C116. [Google Scholar] [CrossRef]
  36. Nicholas, M.; Roy, R.A.; Crum, L.A.; Oguz, H.; Prosperetti, A. Sound emissions by a laboratory bubble cloud. J. Acoust. Soc. Am. 1994, 95, 3171–3182. [Google Scholar] [CrossRef]
  37. Guan YZhao, D.; Low, T.S. Experimental evaluation on acoustic impedance and sound absorption performances of porous foams with additives with Helmholtz number. Aerosp. Sci. Technol. 2021, 119, 107120. [Google Scholar] [CrossRef]
  38. Wood, A. A Textbook of Sound; George Bell & Sons Ltd.: London, UK, 1941. [Google Scholar]
  39. Moxon, N.; Torrance, A.; Richardson, S. The attenuation of acoustic signals by aqueous and particulate foams. Appl. Acoust. 1988, 24, 193–209. [Google Scholar] [CrossRef]
  40. Yenus, J. Vibration and Sound Signal Analysis in Gas Stirred Ladles. Ph.D. Thesis, Swinburne University of Technology, Hawthorn, Australia, 2017. [Google Scholar]
  41. Wang, R.; Zhang, B.; Hu, C.; Liu, C.; Jiang, M. Study on splashing mechanism in basic oxygen furnace based on slag foaming modeling. Steel Res. Int. 2022, 93, 2100318. [Google Scholar] [CrossRef]
  42. Choudhary, S.K.; Ajmani, S.K. Evaluation of bottom stirring system in BOF steelmaking vessel using cold model study and thermodynamic analysis. ISIJ Int. 2006, 46, 1171–1176. [Google Scholar] [CrossRef] [Green Version]
  43. Sabah, S.; Brooks, G. Study of cavity modes in BOF by analysis of sound. Ironmak. Steelmak. 2016, 43, 473–480. [Google Scholar] [CrossRef]
  44. Rao, K.; Kim, D.; Hwang, J.J. Fast Fourier Transform—Algorithms and Applications, 1st ed.; Signals and Communication Technology; Springer: Dordrecht, The Netherlands, 2010. [Google Scholar]
  45. Fronckova, K.; Slaby, A. Kalman Filter Employment in Image Processing; Springer International Publishing: Cham, Switzerland, 2020; pp. 833–844. [Google Scholar]
  46. Batista, L.G.; Salarolli, P.F.; de Menezes, R.P.; Ayres, L.M.; Pereira, R.P.D.A.; de Cuadros, S.L.M.A.; Furtado, H.S. Slopping detection system for LD converters using sound signal digital and image processing. In Proceedings of the 2018 13th IEEE International Conference on Industry Applications (INDUSCON), Sao Paulo, Brazil, 12–14 November 2018. [Google Scholar]
  47. De Menezes, R.P.; Salarolli, P.F.; Batista, L.G.; Furtado, H.S.; Cuadros, M.A.S.L. Slopping index for LD converters based on sound and image data fusion by fuzzy Kalman filter. Ironmak. Steelmak. 2021, 49, 178–188. [Google Scholar] [CrossRef]
  48. Deo, B.; Overbosch, A.; Snoeijer, B.; Das, D.; Srinivas, K. Control of slag formation, foaming, slopping, and chaos in BOF. Trans. Indian Inst. Met. 2013, 66, 543–554. [Google Scholar] [CrossRef]
  49. Brämming, M.; Parker, G.; Millman, S.; Kapilashrami, A.; Malmberg, D.; Björkman, B. Comparison between vessel vibration and audiometry for slopping control in the Top-Blown BOS Process. Steel Res. Int. 2011, 82, 683–692. [Google Scholar] [CrossRef]
  50. Ghosh, B. Opto-Acoustic Slopping Prediction System in Basic Oxygen Furnace Converters; TRITA-ICT-EX; Kth Royal Institute of Technology: Stockholm, Sweden, 2017; p. 56. [Google Scholar]
  51. Shreve, D.H. Signal Processing for Effective Vibration Analysis; IRD Mechanalysis, Inc.: Columbus, OH, USA, 1995; pp. 1–11. [Google Scholar]
  52. Rao, K.D.; Swamy, M.N.S. Spectral Analysis of Signals. In Digital Signal Processing: Theory and Practice; Springer: Singapore, 2018; pp. 721–751. [Google Scholar]
  53. Kuttruff, H. Room Acoustics; CRC Press: Boca Raton, FL, USA, 2016. [Google Scholar]
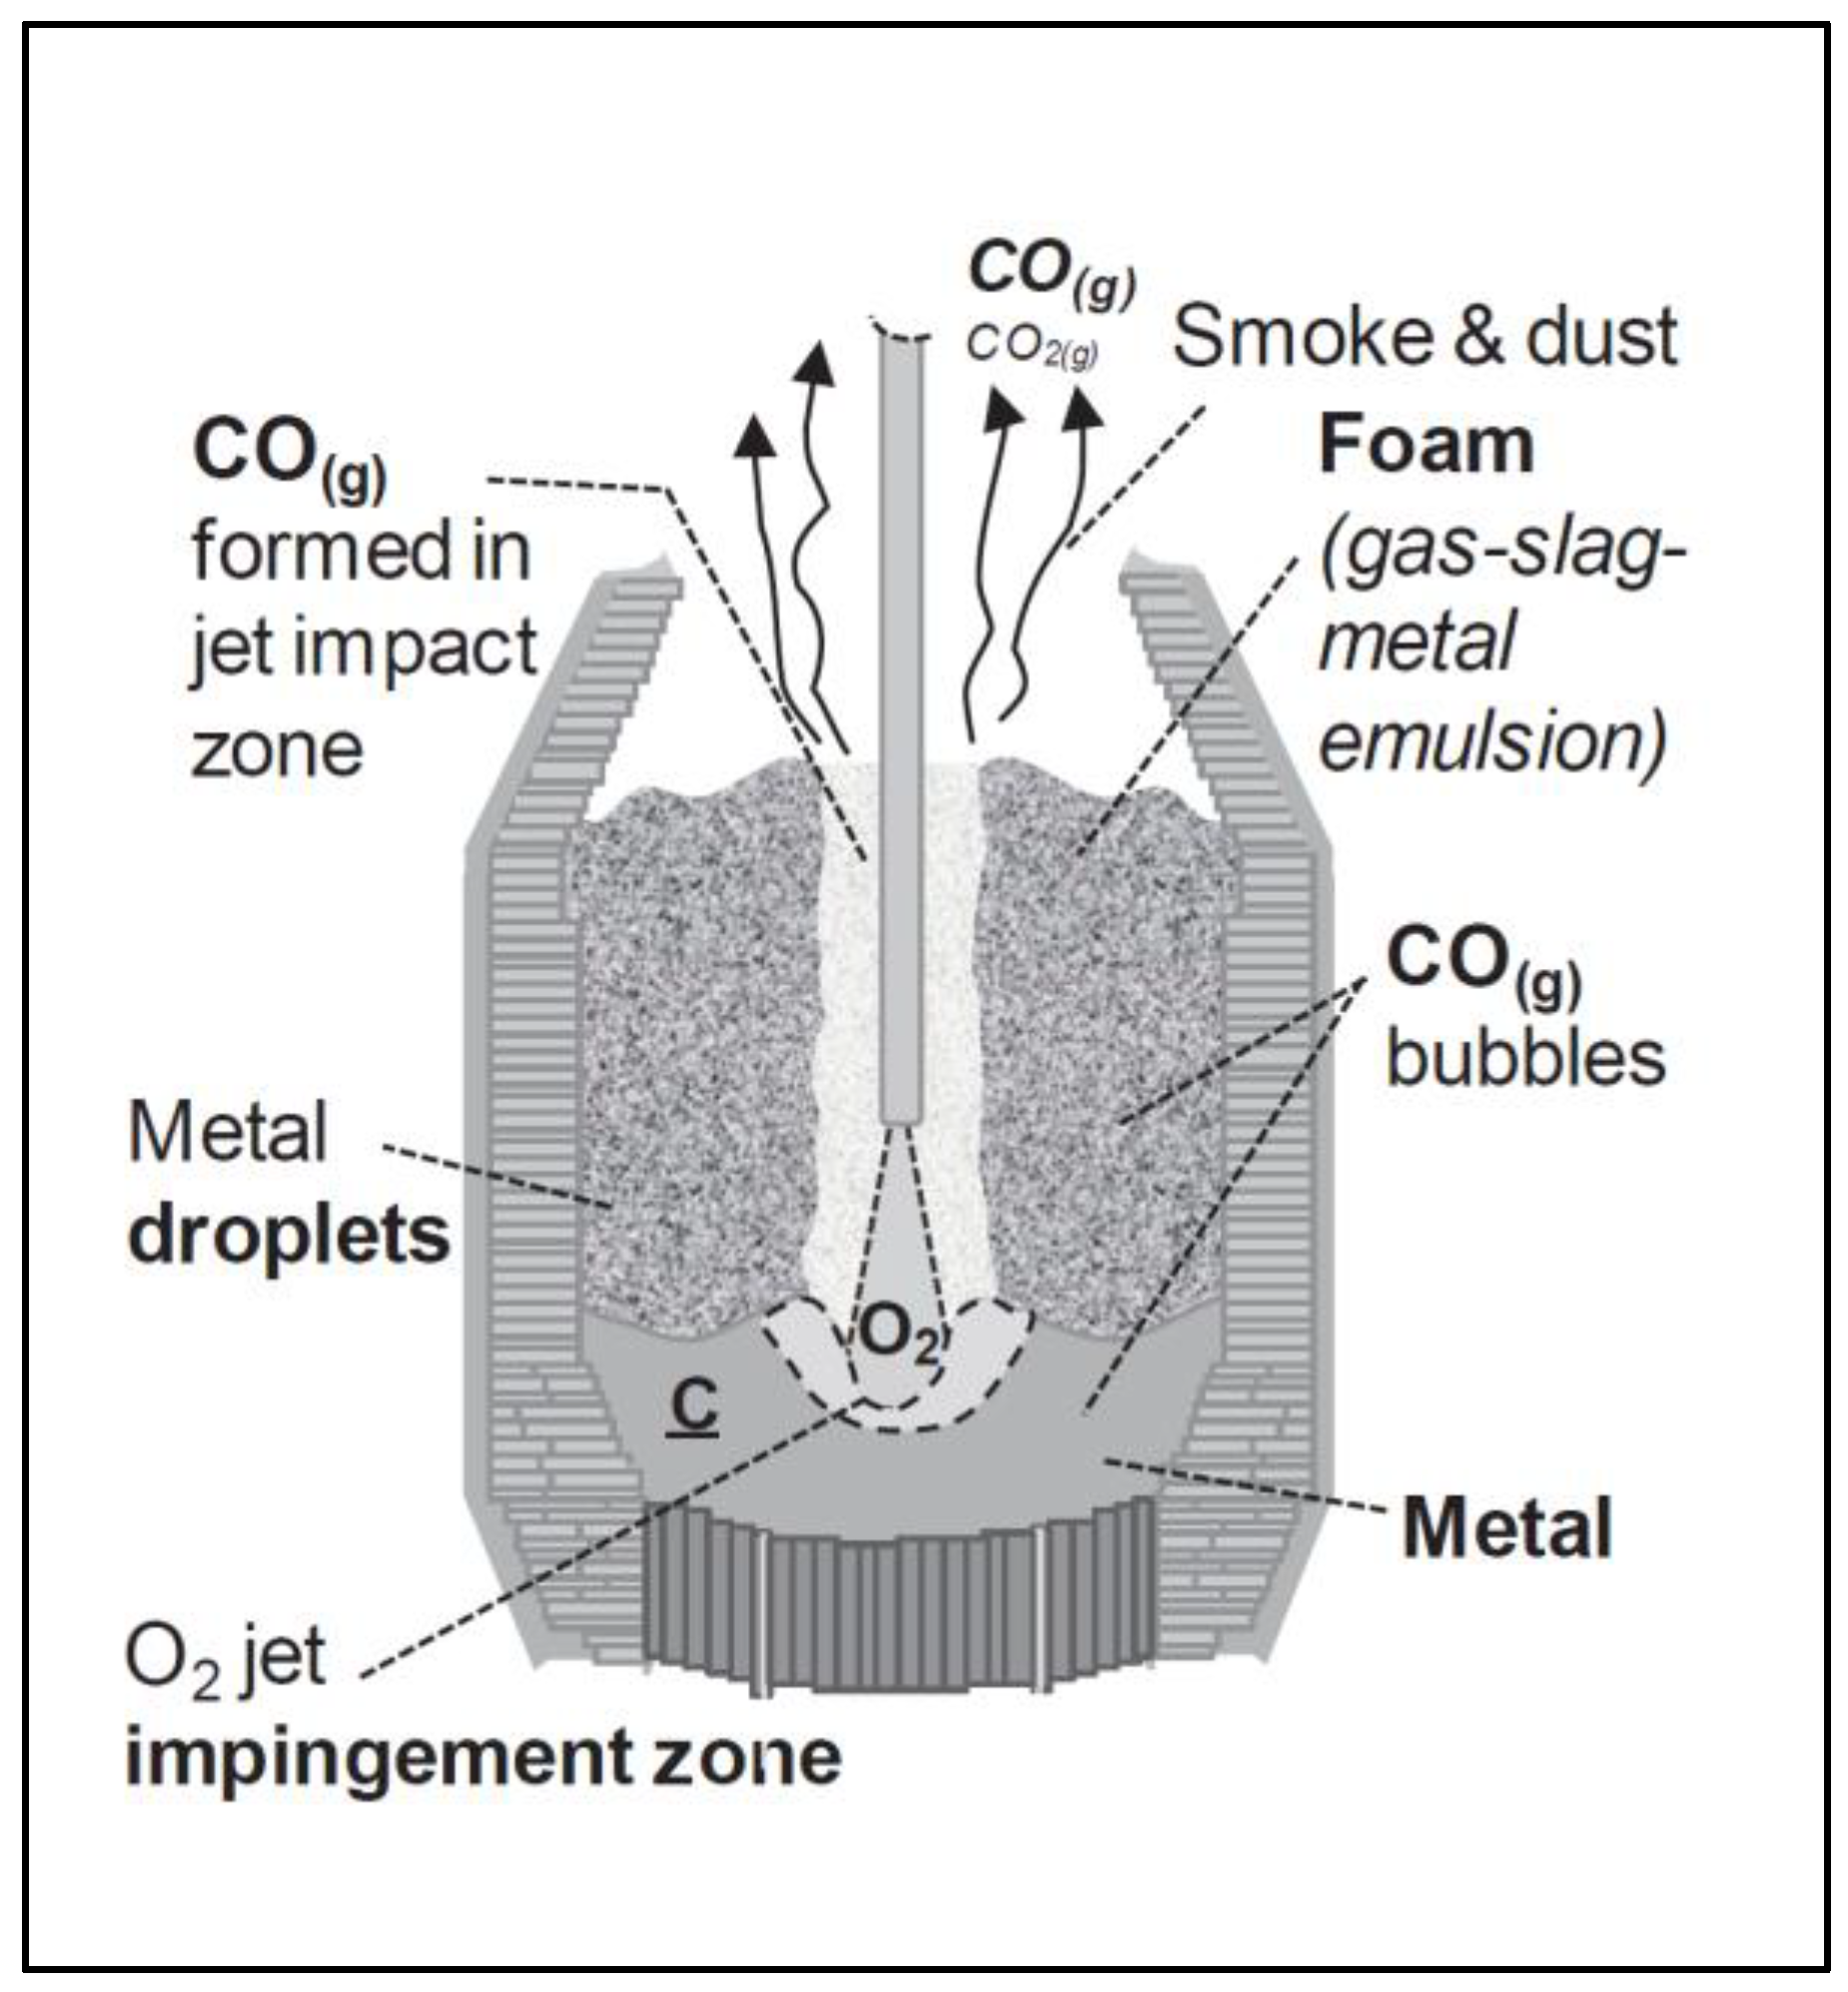
Figure 1. Primary process of foaming in the BOF; reprinted with permission from Brämming, M. (2001) [6].
Metals 12 01142 g001
Figure 2. Images of slag foaming experiments conducted by Wang et al. using different foam structures produced by varying dynamic viscosities of the silicon oil as follows; (a) 290 mPa s, (b) 490 mPa s and (c) 840 mPa s (recorded at 25 °C); copyright 2021 Wiley [41].
Metals 12 01142 g002
Figure 3. Cold model used by Birk et al.; copyright 2001 IEEE [8].
Metals 12 01142 g003
Figure 4. Graphical comparison of the estimated foam height (continuous line) and the actual foam height (dashed line); copyright 2001 IEEE [8].
Metals 12 01142 g004
Figure 5. Snapshot of the colour-coded slopping alarm system with high slopping (lower plot) and the respective data used for detection; copyright 2009 Elsevier [7].
Metals 12 01142 g005
Figure 6. Audio spectrum over an entire heat. The threshold level was signified using the green line; when the signal crossed below the threshold level, there was the probability of slopping to occur; copyright 2018 IEEE [46].
Metals 12 01142 g006
Table 1. Types of data used in Evestedt et al.’s study from SSAB Oxelösund; copyright 2009 Elsevier [7].
Measuring MethodLocationProcess InformationTime Delay
Camera surveillance/image analysisBelow the LD converterMonitors the amount of falling slag to quantify sloppingNone
Off gas analysisInside off gas systemCalculation of per centage of CO and CO2 plus
the measured off-gas flow rate.
15–20 s
Sonic MeterIn the hood above the mouthThe sound level indicates changes in slag levelNone
Oxygen flow meterIn the lanceGives the actual oxygen flow rate through the lance.None
Lance heightIn the lance control systemGives the lance position as calculated by the lance systemNone
Publisher’s Note: MDPI stays neutral with regard to jurisdictional claims in published maps and institutional affiliations.