Article

Effect of Solution Temperature on Tension-Compression Asymmetry in Metastable β-Titanium Alloys

1
Neurosurgery, The First People’s Hospital of Changde City, Changde 415003, China
2
Research Institute of Automobile Parts Technology, Hunan Institute of Technology, Hengyang 421002, China
3
School of Energy and Power Engineering, Changsha University of Science and Technology, Changsha 410114, China
*
Authors to whom correspondence should be addressed.
Metals 2022, 12(8), 1352; https://doi.org/10.3390/met12081352
Submission received: 11 July 2022 / Revised: 12 August 2022 / Accepted: 12 August 2022 / Published: 15 August 2022

Abstract

:
Three titanium alloys, Ti-10V-1Fe-3Al, Ti-10V-2Fe-3Al and Ti-10V-2Cr-3Al, were heated by solution treatment at in 700 °C (α + β phase region), 800 °C (near β phase region), 900 °C and 1000 °C (single β phase region). The effects of solution temperature on the microstructure and mechanical properties of the alloys were studied, and the mechanical asymmetry of tension and compression of three titanium alloys was analyzed; the results show that the microstructure of the three alloys changes regularly with the increase of solution temperature. Different solution temperatures have a significant effect on the compressive and tensile properties of the three alloys. During compression deformation, the stress-induced martensite transformation occurs in samples with solution at 800 °C and above; however, there is no phase transformation during the process of tensile tests. The asymmetry of yield strength, work hardening rate and final strength of the three alloys are obvious during compression deformation and tensile deformation. The difference in the number of twins between uniaxial tension and uniaxial compression, the presence or absence of stress-induced martensitic transformation, and the CRSS asymmetry of cone <c + a> slip may be the reasons for the asymmetry of mechanical properties.

1. Introduction

Titanium and titanium alloys offer excellent biocompatibility and corrosion resistance [1,2]. The elastic modulus of titanium is close to that of human tissue, about 80–110 GPa, which can reduce the mechanical inadaptability between metal implant and bone tissue. The thermal conductivity of titanium is only 1/17 of that of golden alloy. Compared with other alloys, titanium inlay and full crown can protect dental pulp and avoid thermal stimulation. In view of these advantages of titanium, since the 1980s, many countries began to study the use of titanium in oral prosthodontics, first for dental implants and later for denture brackets, crown bridges and orthodontic wires [3]. The research of titanium and titanium alloys has become a hot spot in the field of dental alloys. Ti-10V-2Fe-3Al titanium alloy is a kind of metastable β alloy with a high strength, high toughness and good corrosion resistance; developed by Timet Company in America in 1970s, it has great potential in the biomedical field [4,5,6]. Clément N et al. [7] studied the effect of heat treatment temperature on the microstructure and transformation process of metastable β alloy. Chamanfar A et al. [8] investigated the relationship between microstructure and compressive mechanical properties of Ti-10V-2Fe-3Al alloy at different heat treatment temperatures. Chen et al. [9] studied the microstructure evolution of metastable β alloy after solution treatment and revealed the effect of microstructure on the tensile properties of the alloy. Srinivasu G et al. [10] analyzed the effect of solution temperature on microstructure and mechanical properties of Ti-10V-2Fe-3Al alloy. In order to clarify the effect of alloying elements on the mechanical properties of metastable β-titanium alloy, two alloys, Ti-10V-1Fe-3Al and Ti-10V-2Cr-3Al, were prepared on the basis of Ti-10V-2Fe-3Al alloy and have been studied to some extent. As a potential biomedical titanium alloy, if it is implanted into a patient’s body as a bone substitute material, it will be subjected to tensile and compressive loads frequently. Therefore, it is of great significance to study the tensile and compressive mechanical behavior and asymmetry of titanium alloys. Tuninetti V [11] carried out a series of mechanical properties tests on Ti-6Al-4V at room temperature and low strain and found that Ti-6Al-4V has tension compression asymmetry and anisotropic hardening. Peng L also tested the tensile and compressive properties of TA1 at room temperature and studied the tension compression asymmetry of TA1 pure titanium and found that industrial pure titanium showed strong tension compression asymmetry in yield and strain hardening [12]. Zhang Q et al. studied the mechanical response of Ti-6.6A1-3.3Mo-1.8Zr-0.29Si under a high strain rate under tension and compression using split Hopkinson rod technology. It was found that Ti-6.6A1-3.3Mo-1.8Zr-0.29Si alloy has obvious tension compression asymmetry, and the asymmetry also has obvious strain sensitivity [13]. However, in the study of tension-compression asymmetry, most of the work has been focused on α-titanium alloys [14,15]; there are few studies on the asymmetry of β-titanium alloys. In this paper, the tensile and compressive properties of three metastable β alloys, Ti-10V-2Fe3Al, Ti-10V-1Fe-3Al and Ti-10V-2Cr-3Al, after different solution treatments, were investigated, and the asymmetry of tension and compression was analyzed, hoping to provide new insight for the study of mechanical properties of biological titanium alloys.

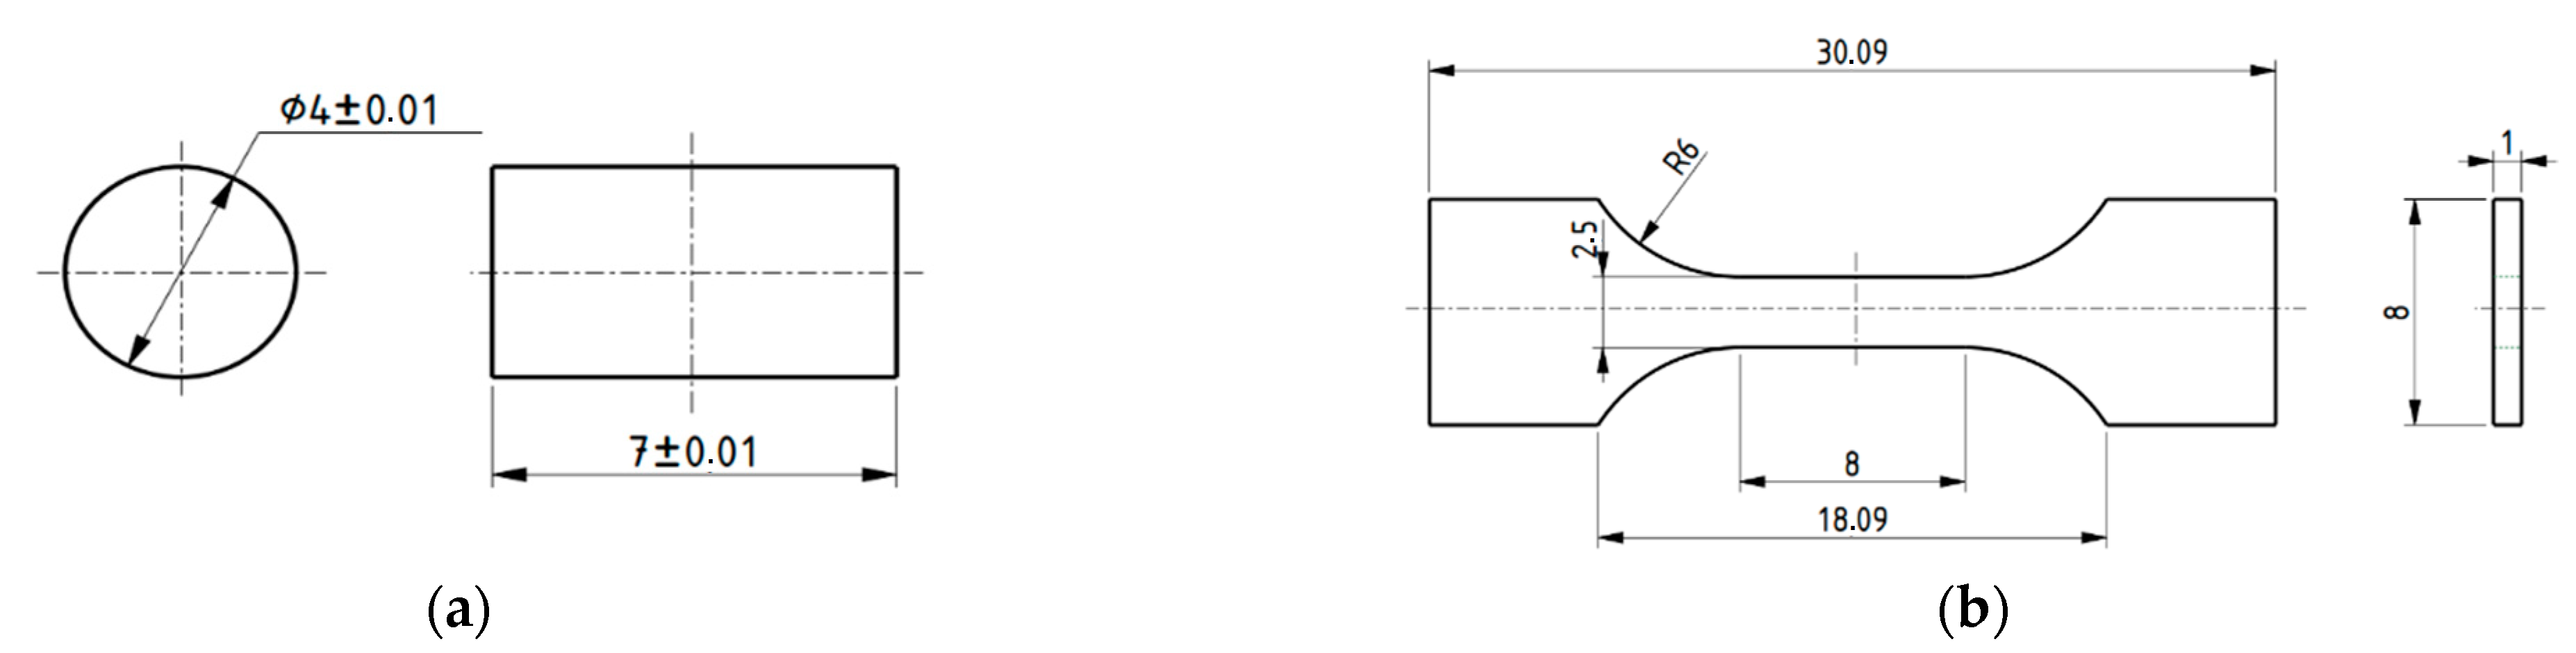
2. Materials and Methods

Three alloys, Ti-10V-1Fe-3Al, Ti-10V-2Fe-3Al and Ti-10V-2Cr-3Al, were prepared by the Shenyang Institute of Metals, Chinese Academy of Sciences. The β-transus temperatures of the three alloys were 840 °C, 810 °C and 830 °C, respectively. The specific composition of the alloys is shown in Table 1.
The as-received ingots were machined into different shapes for compressive and tensile tests by using electrical discharge machining (EDM). The dimensions for different samples are shown in Figure 1.
Three alloys were heated by solution treatments at 700 °C (α + β phase region), 800 °C (near β phase region), 900 °C and 1000 °C (β phase region) for 30 min. The specimens were polished with sandpaper until the surfaces were clean and free of scratches then etched by Kroll’s reagents (3 mL HF + 6 mL HNO3 + 100 mL H2O). A LEICA STELLARIS 8 DIVE optical microscope (Leica Inc, Wetzlar, Germany) was used for metallographic observation. After each heat treatment, samples were tested for Vickers hardness by a Veiyee QHV-1000SPTA machine (Veiyee Inc., Laizhou, China). The tensile and compressive properties of the alloy were measured by MTS Landmark fatigue test system (Mechanical Testing & Simulation Inc., Minnesota, USA), and the deformation rate was 0.014 mm·s−1. In order to reduce the experimental error, the samples were tested three times, and the average value was obtained. Detail microstructural investigation was performed by a JEOL-3010 transmission electron microscopy (TEM, JEOL Ltd., Tokyo, Japan) with an operating voltage of 300 Kv. The thin foils required for the TEM observations were prepared by a standard polishing procedure and a twin-jet electro-polishing technique.

3. Results and Discussion
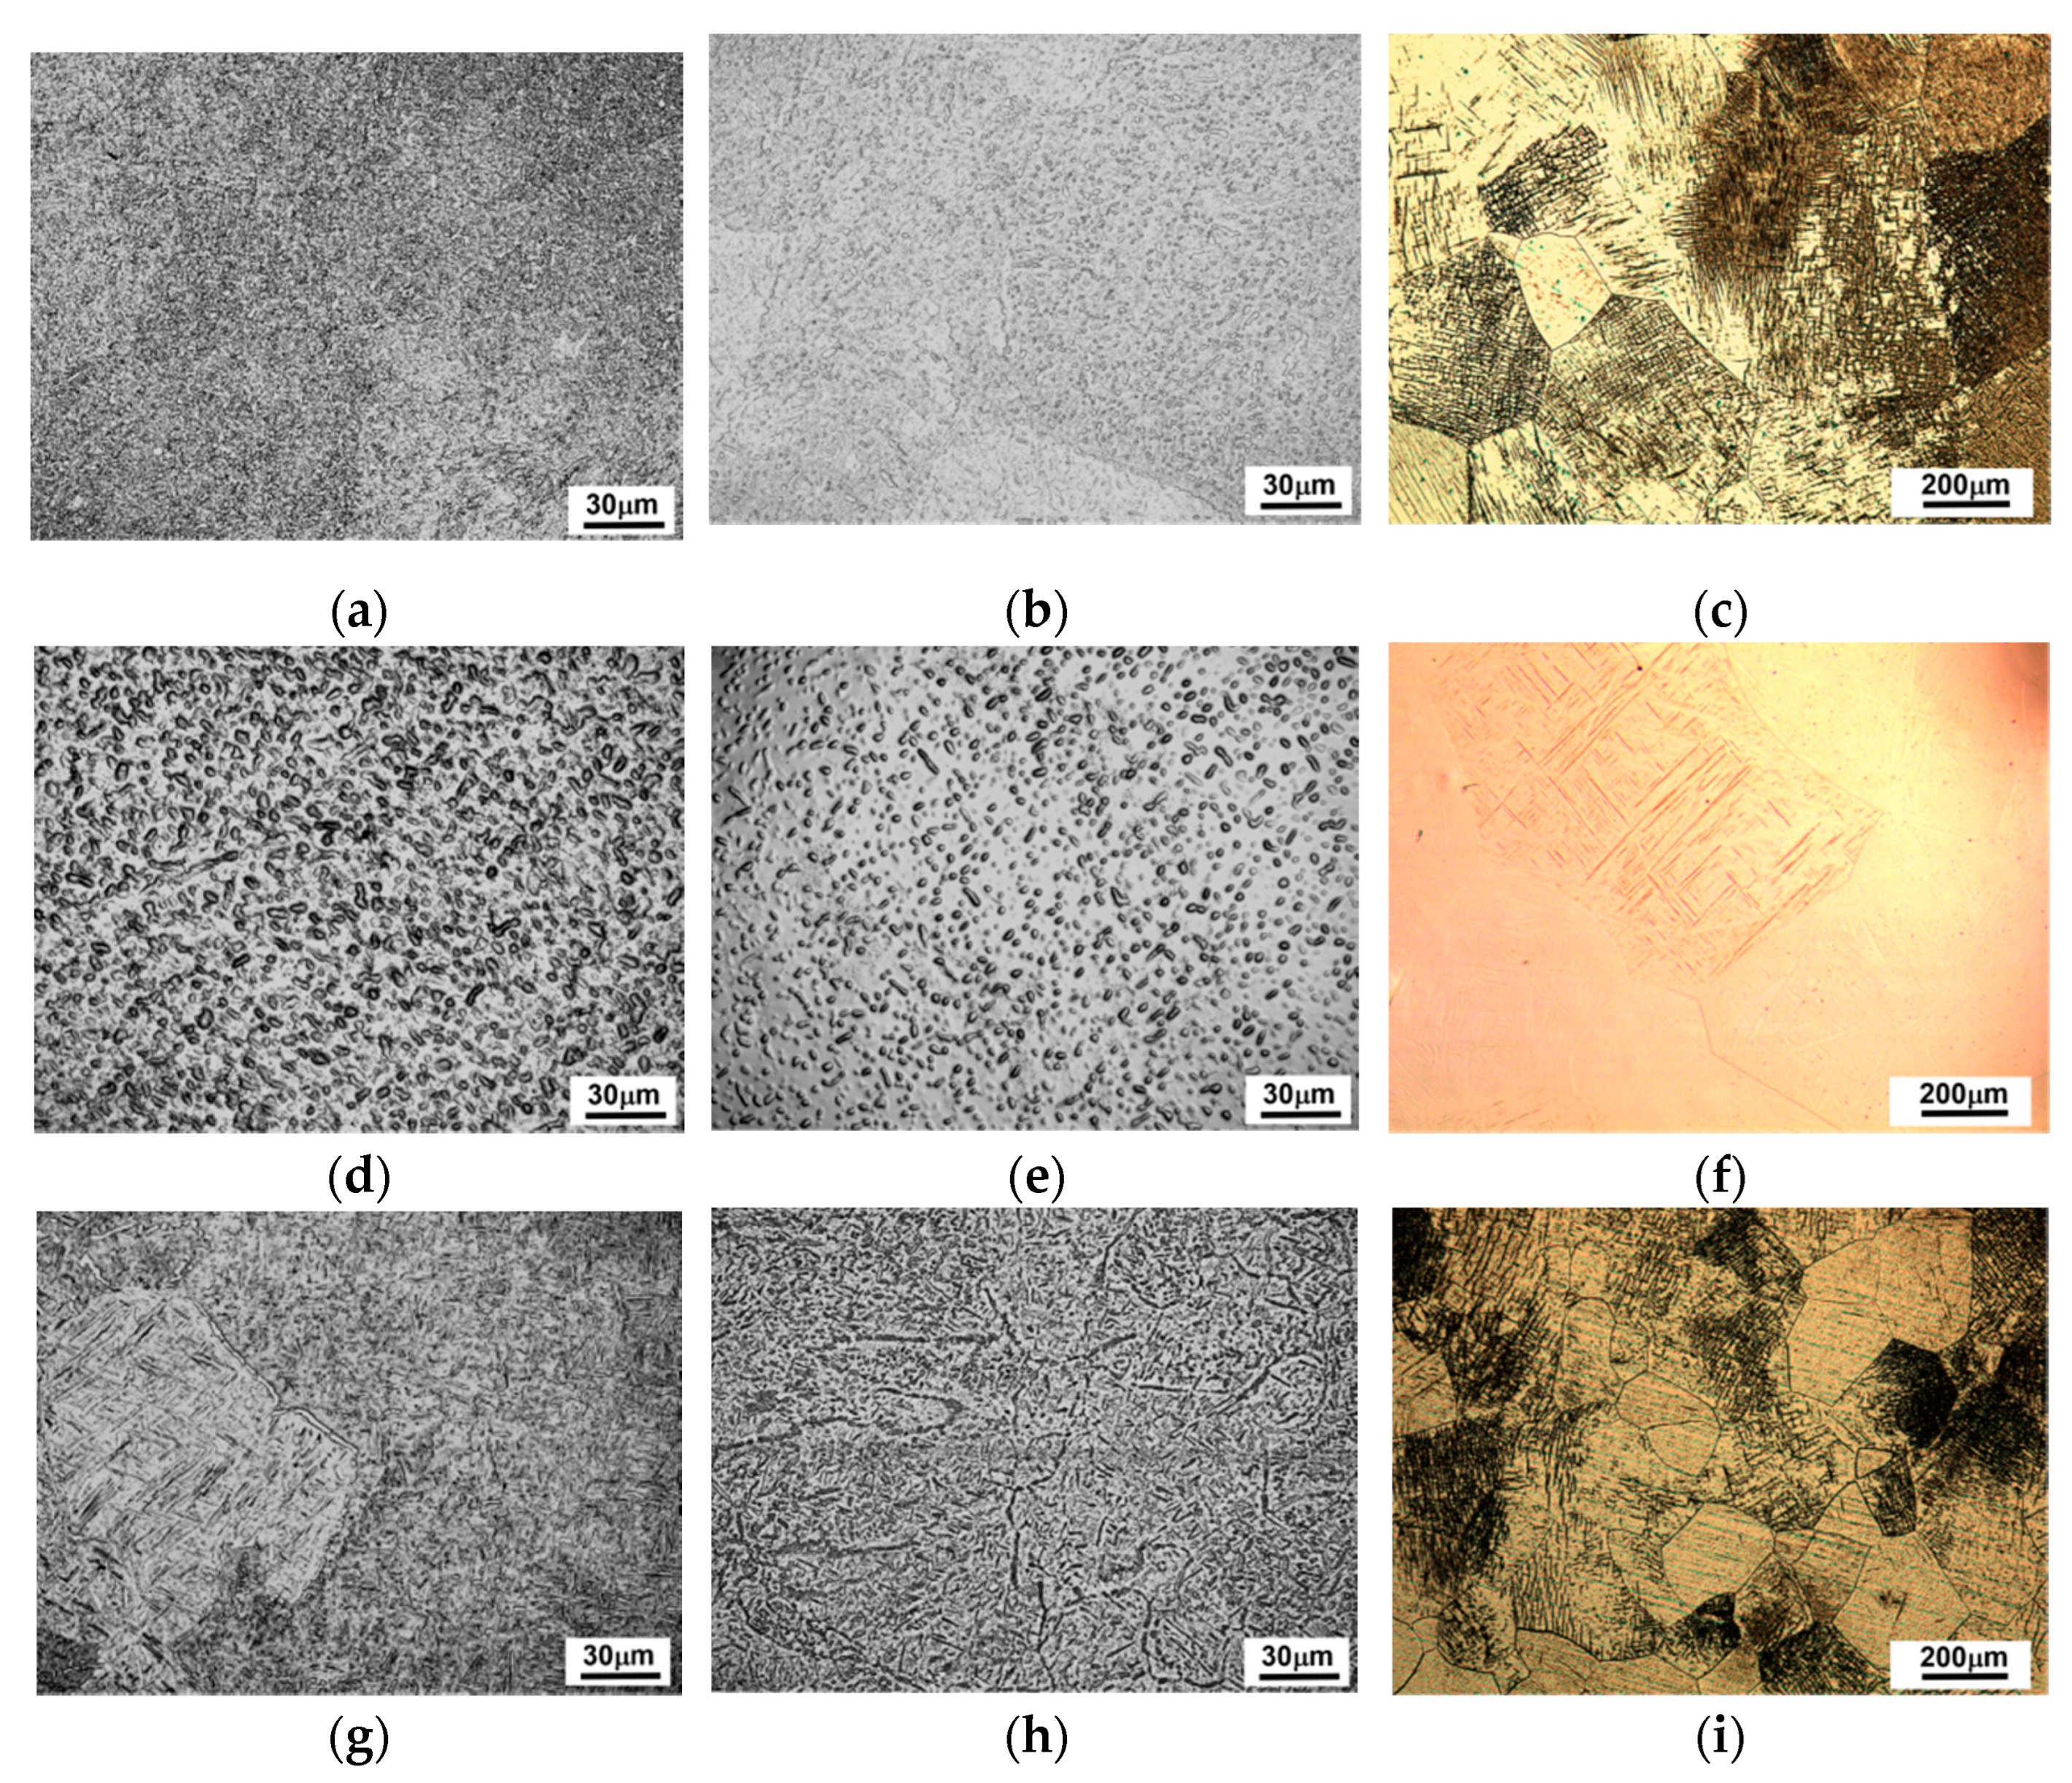
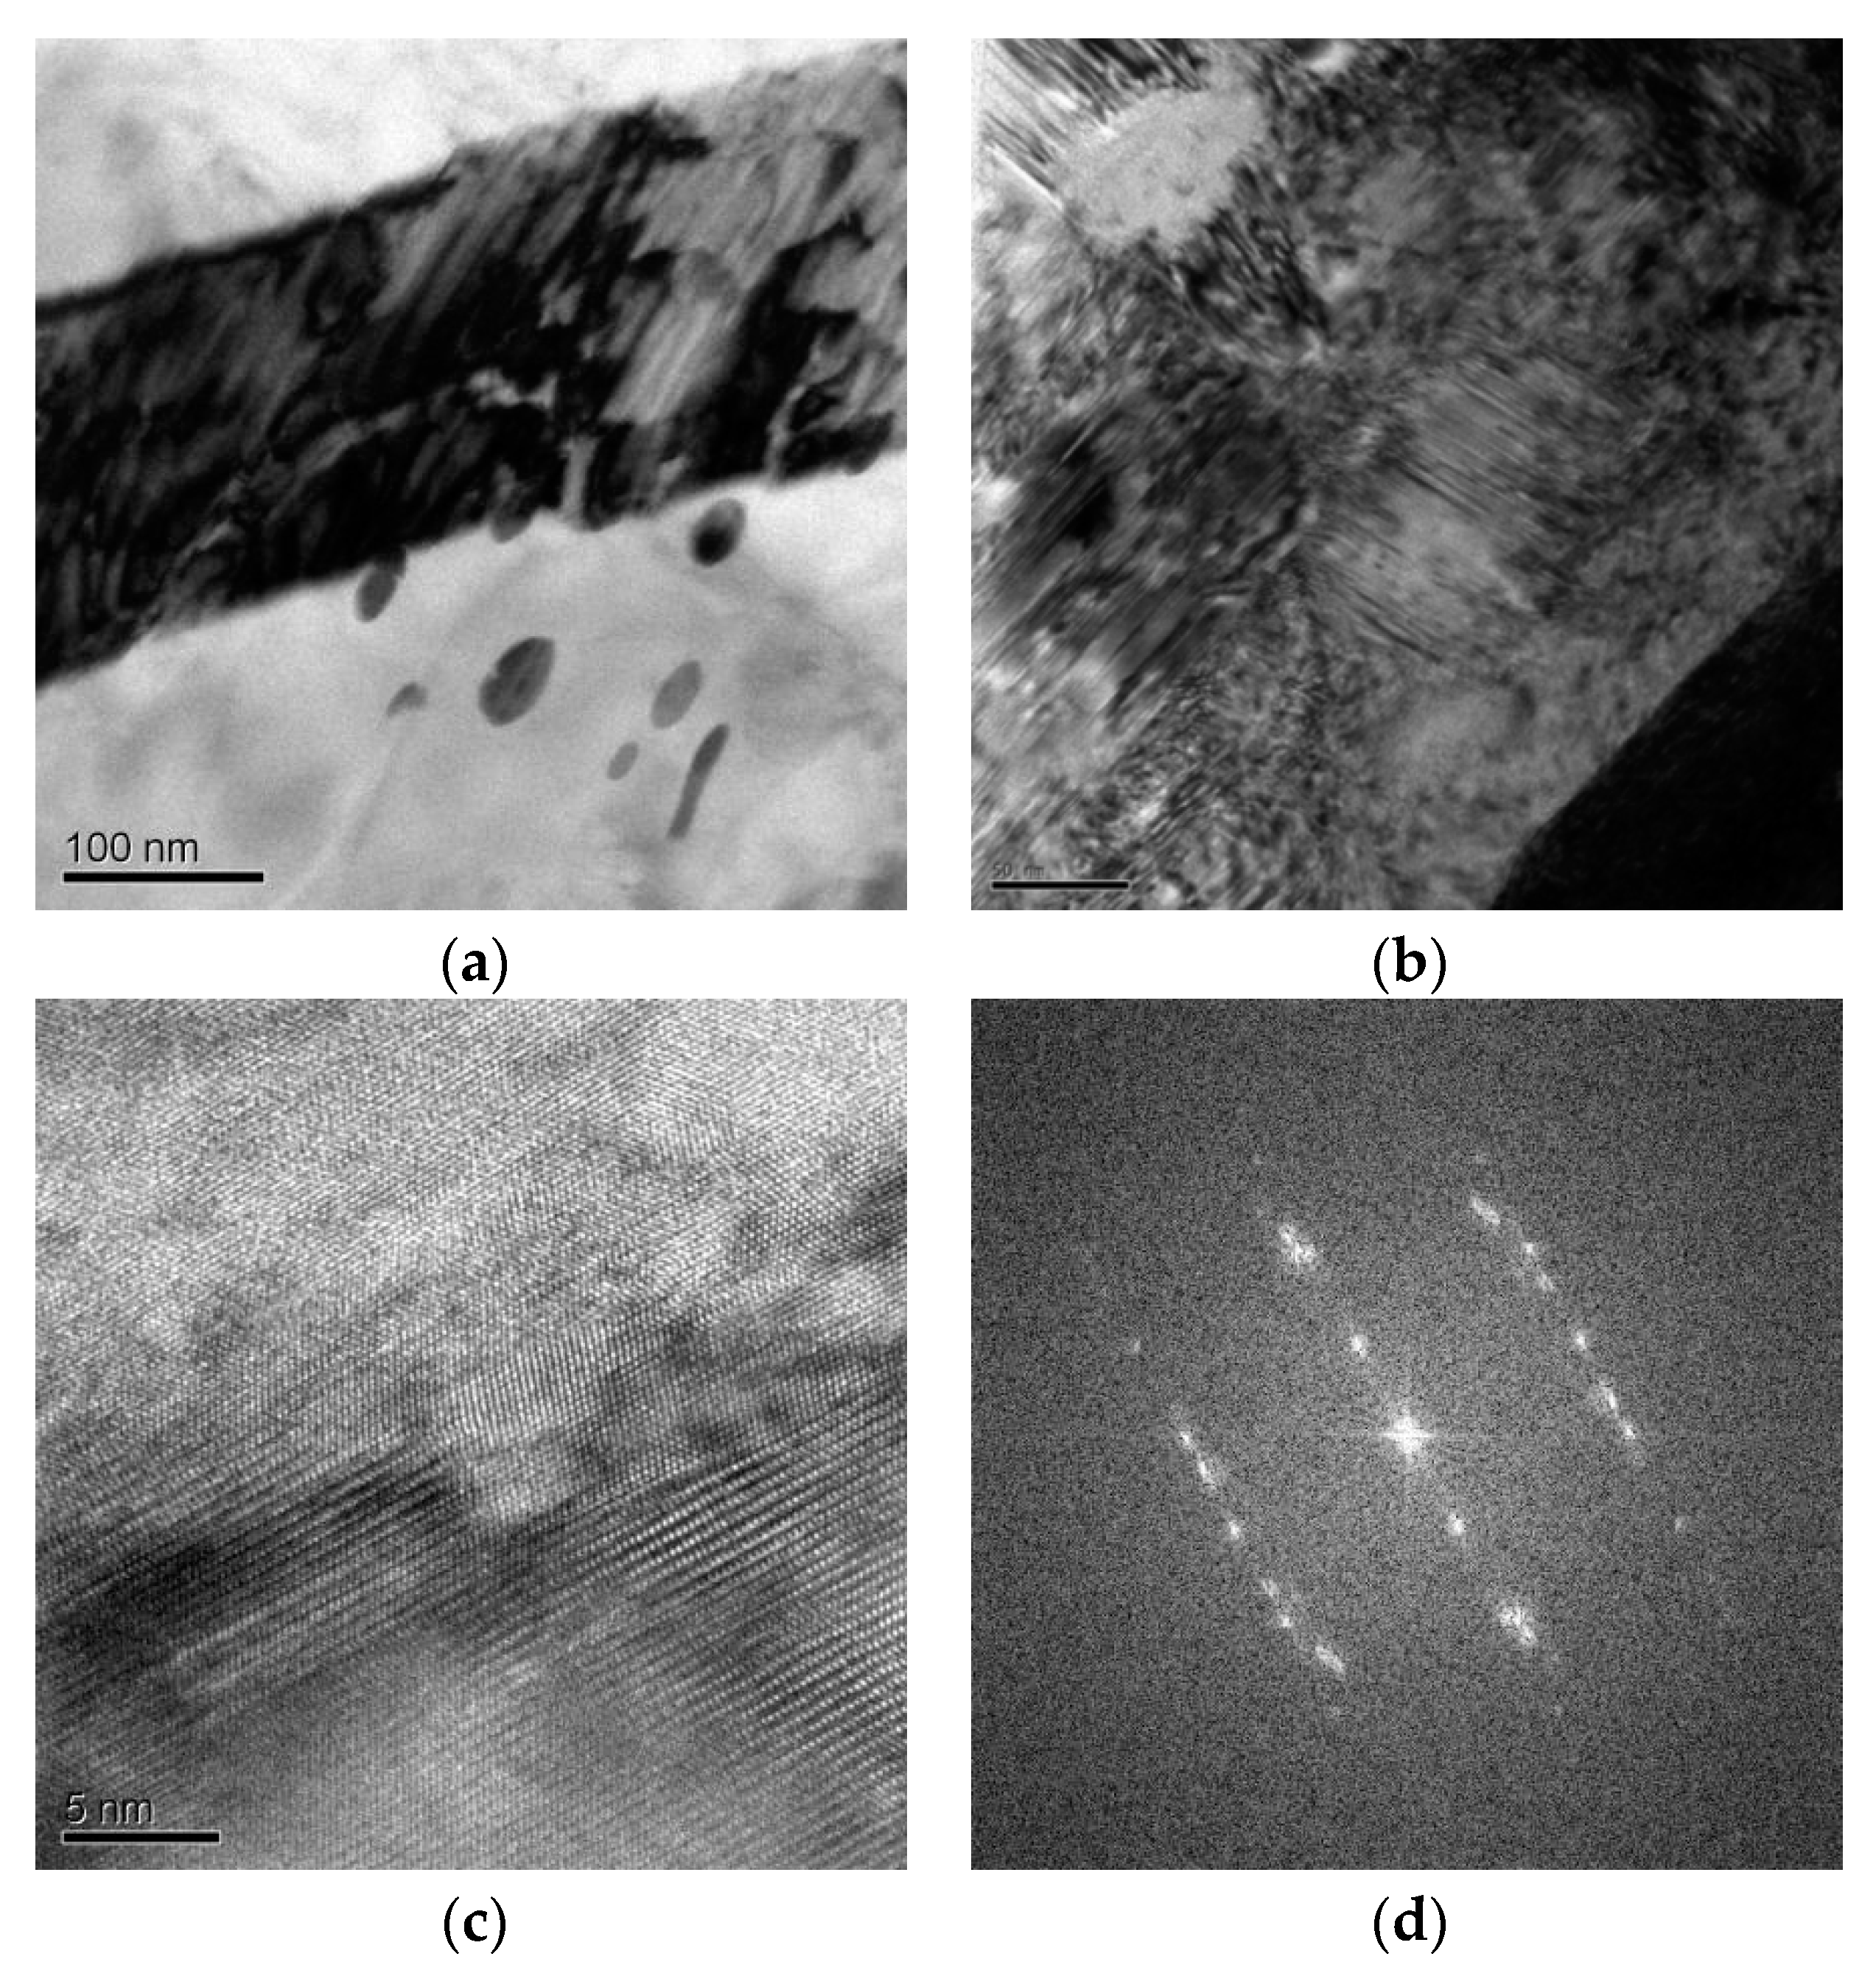
3.1. Microstructure

The original microstructure of the three alloys is shown in Figure 2a,d,g. It can be seen that Ti-10V-1Fe-3Al alloy has a large amount of fine spherical α phase with a relatively uniform distribution; Ti-10V-2Fe-3Al alloy is dominated by the bigger spherical α phase with a small amount of rod α phase; and for Ti-10V-2Cr-3Al alloy, the as-received microstructure possesses a mixture of rod α and spherical α phases, and the rod αphase is dominant. After the solution treated at 700 °C for 30min, the microstructure of the three alloys changed slightly; part of the α phase transformed to the β phase. After the solution treated at 800 °C, the microstructure of the three alloys changed significantly due to the fact that the temperature was close to the β-transus temperature of the three alloys; more of the α phase dissolved in the form of α→β phase transformation; and the volume fraction of α phase decreased significantly, but some of them were retained, as shown in Figure 2b,e,h. From the three figures, it can also be found that the rod-shaped α phase is the first to undergo phase transformation, which indicates that the spherical α phase is more stable in the high temperature range. When solution temperature reached 900 °C or 1000 °C, the microstructure of all three alloys becomes similar after quenching, consisting of coarse β grains and quenched martensite, which are perpendicular to each other and distributed within the β grains with a fine needle shape. Due to the short time of the solution treatments, the alloying elements are not uniformly distributed among different grains, resulting in different amounts of the martensite phase within different grains, especially in Ti-10V-2Cr-3Al alloy; such a phenomenon is more obvious because the element Cr has the lower diffusion rate compared to Fe. The comparison of different alloys reveals that Ti-10V-2Fe-3Al alloy has the least amount of martensite after quenching because it contains the highest content of β-stabilizing elements and, thus, the highest stability of the high-temperature β phase.

3.2. Hardness Test

The hardness test results of the three alloys are shown in Figure 3. It can be seen from the figure that the hardness of the three alloys decreased with the increase of the solution temperature. The hardness drop is most pronounced when the solution temperature rises from 700 °C to 800 °C. However, as the temperature continues to increase, the hardness decrease tends to be moderate, which is related to the change in the microstructure of the alloy. When the solution temperature is 700 °C, the three alloys are mainly composed of the α phase. These α phases are distributed on the β matrix and play a large role in strengthening. When the solution temperature reaches 800 °C, most of the α phase transforms into the β phase, as shown in Figure 2b,e,h; the strengthening effect is weakened, and the hardness of the specimen then decreases. When the temperature reaches 900 °C and 1000 °C, as shown in Figure 2c,f,i, the alloy enters the full β phase region, all of the α phase is transformed into large-sized β grains, and martensite is formed after quenching. Since the martensite of the titanium alloy does not have high strength, the hardness of the alloy continues to decrease. Comparing the hardness of different alloys, it can be found that the Ti-10V-1Fe-3Al alloy has the highest hardness, especially at a low-temperature solid solution, which is related to the fine and uniformly distributed large amount of α phase.

3.3. Compressive Mechanical Properties

The compressive stress–strain curves of the three alloys are shown in Figure 4. As can be seen from the figure: for samples solution holding at 700 °C, the main mechanical properties, such as compressive strength and failure strain, are numerically lower than samples treated at higher temperatures. All three alloys showed a significant double yield point in the stress–strain curves after solution treated at 800 °C, 900 °C and 1000 °C. According to our previous research results [16], this is the feature of stress-induced martensitic phase transformation of the alloys during compression. This phase transformation effect leads to an increase in the strength and plasticity of the samples, especially in the Ti-10V-2Fe-3Al and Ti-10V-2Cr-3Al alloys, where the strengthening effect is more obvious. Comparing the mechanical properties of the three alloys, it can be seen that the compressive strength of Ti-10V-1Fe-3Al alloy gradually increases with the further increase of the solid solution temperature, but the plasticity decreases, while for the other two alloys, Ti-10V-2Fe-3Al and Ti-10V-2Cr-3Al, the stress–strain curves are insensitive to the solution temperature, and the compressive mechanical properties are dominated by the stress-induced martensitic phase transformation.

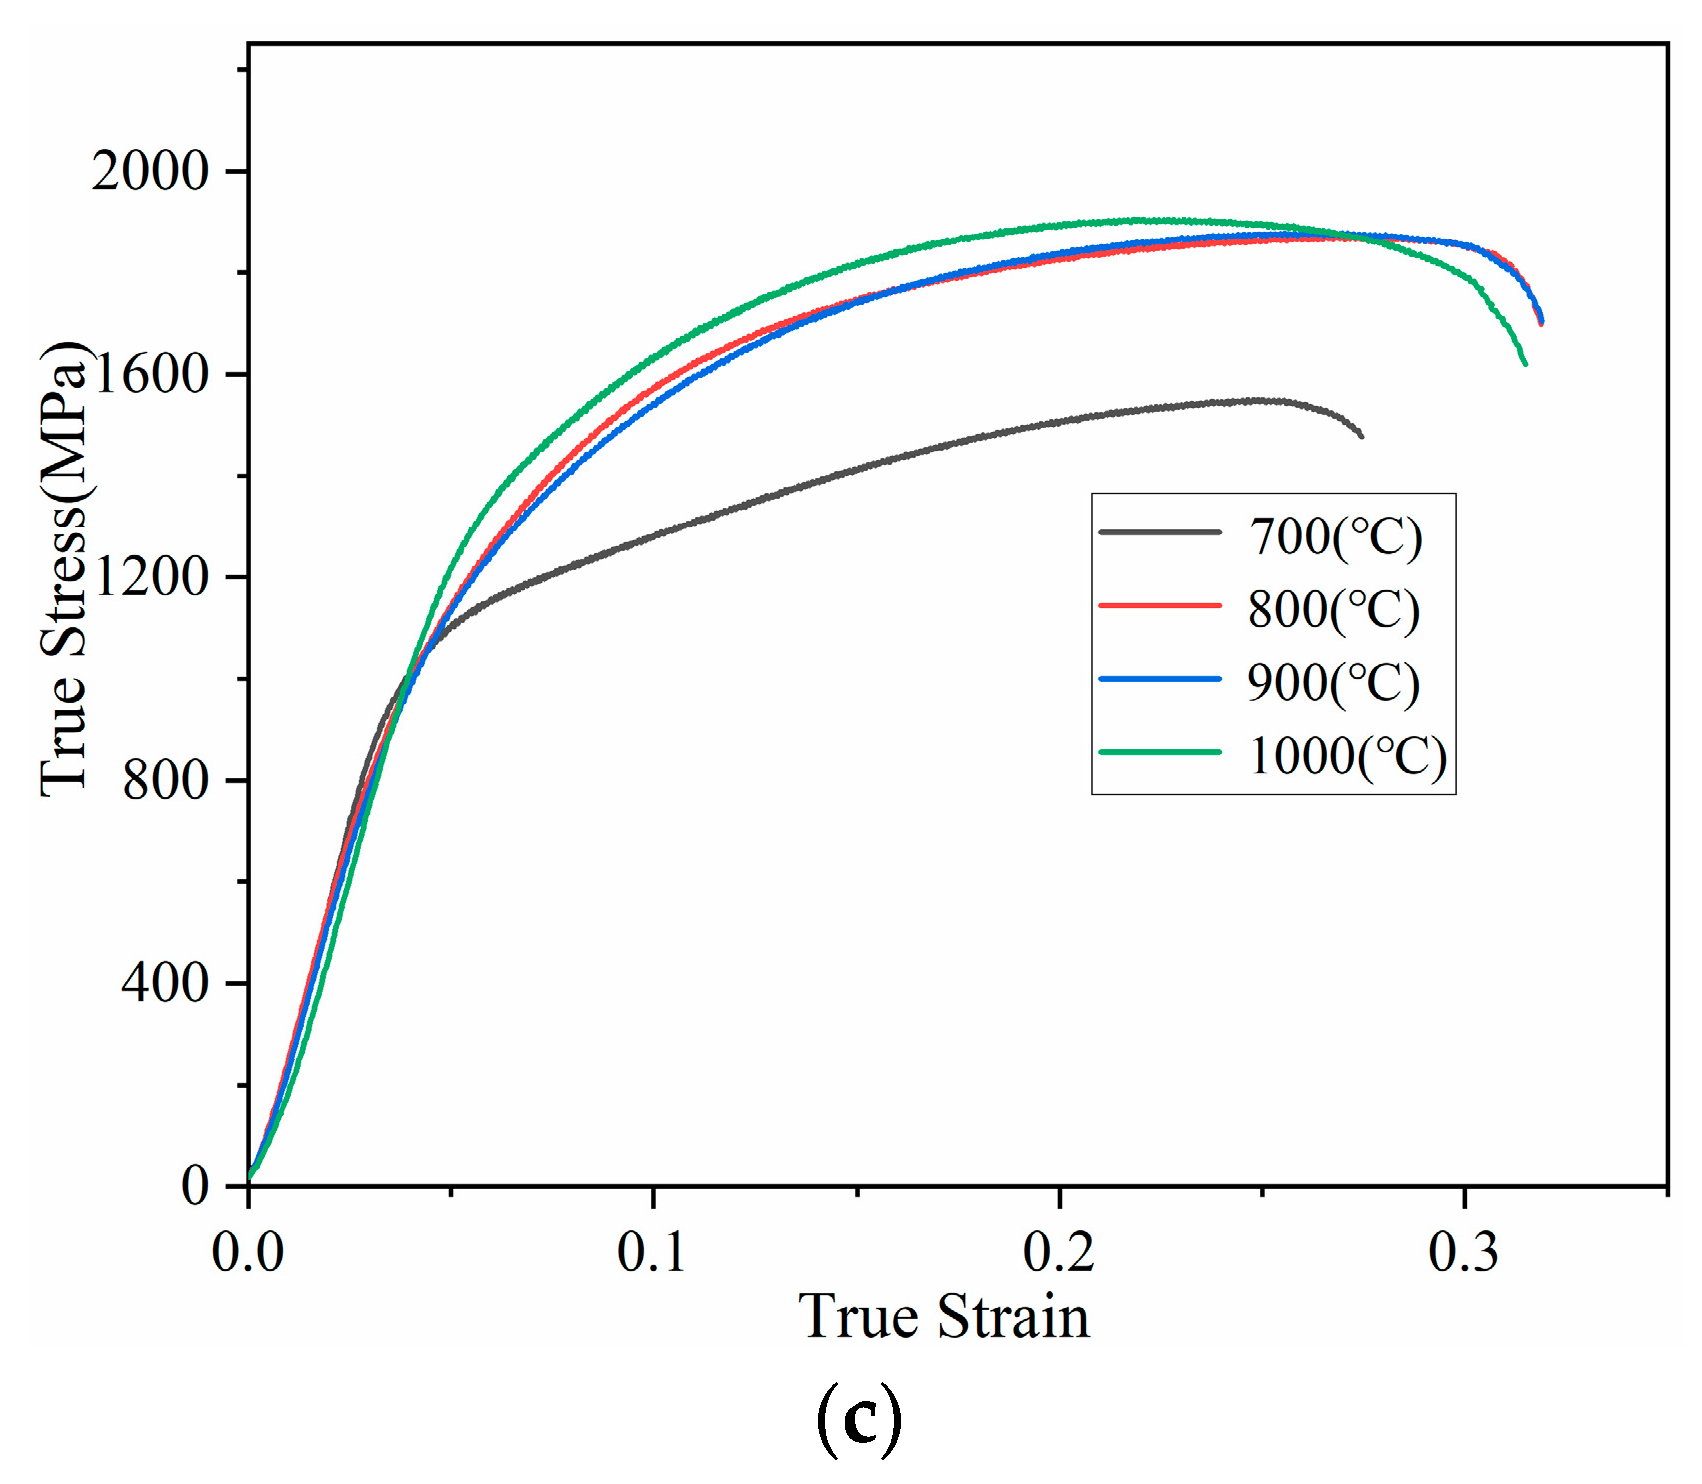
3.4. Tensile Mechanical Properties
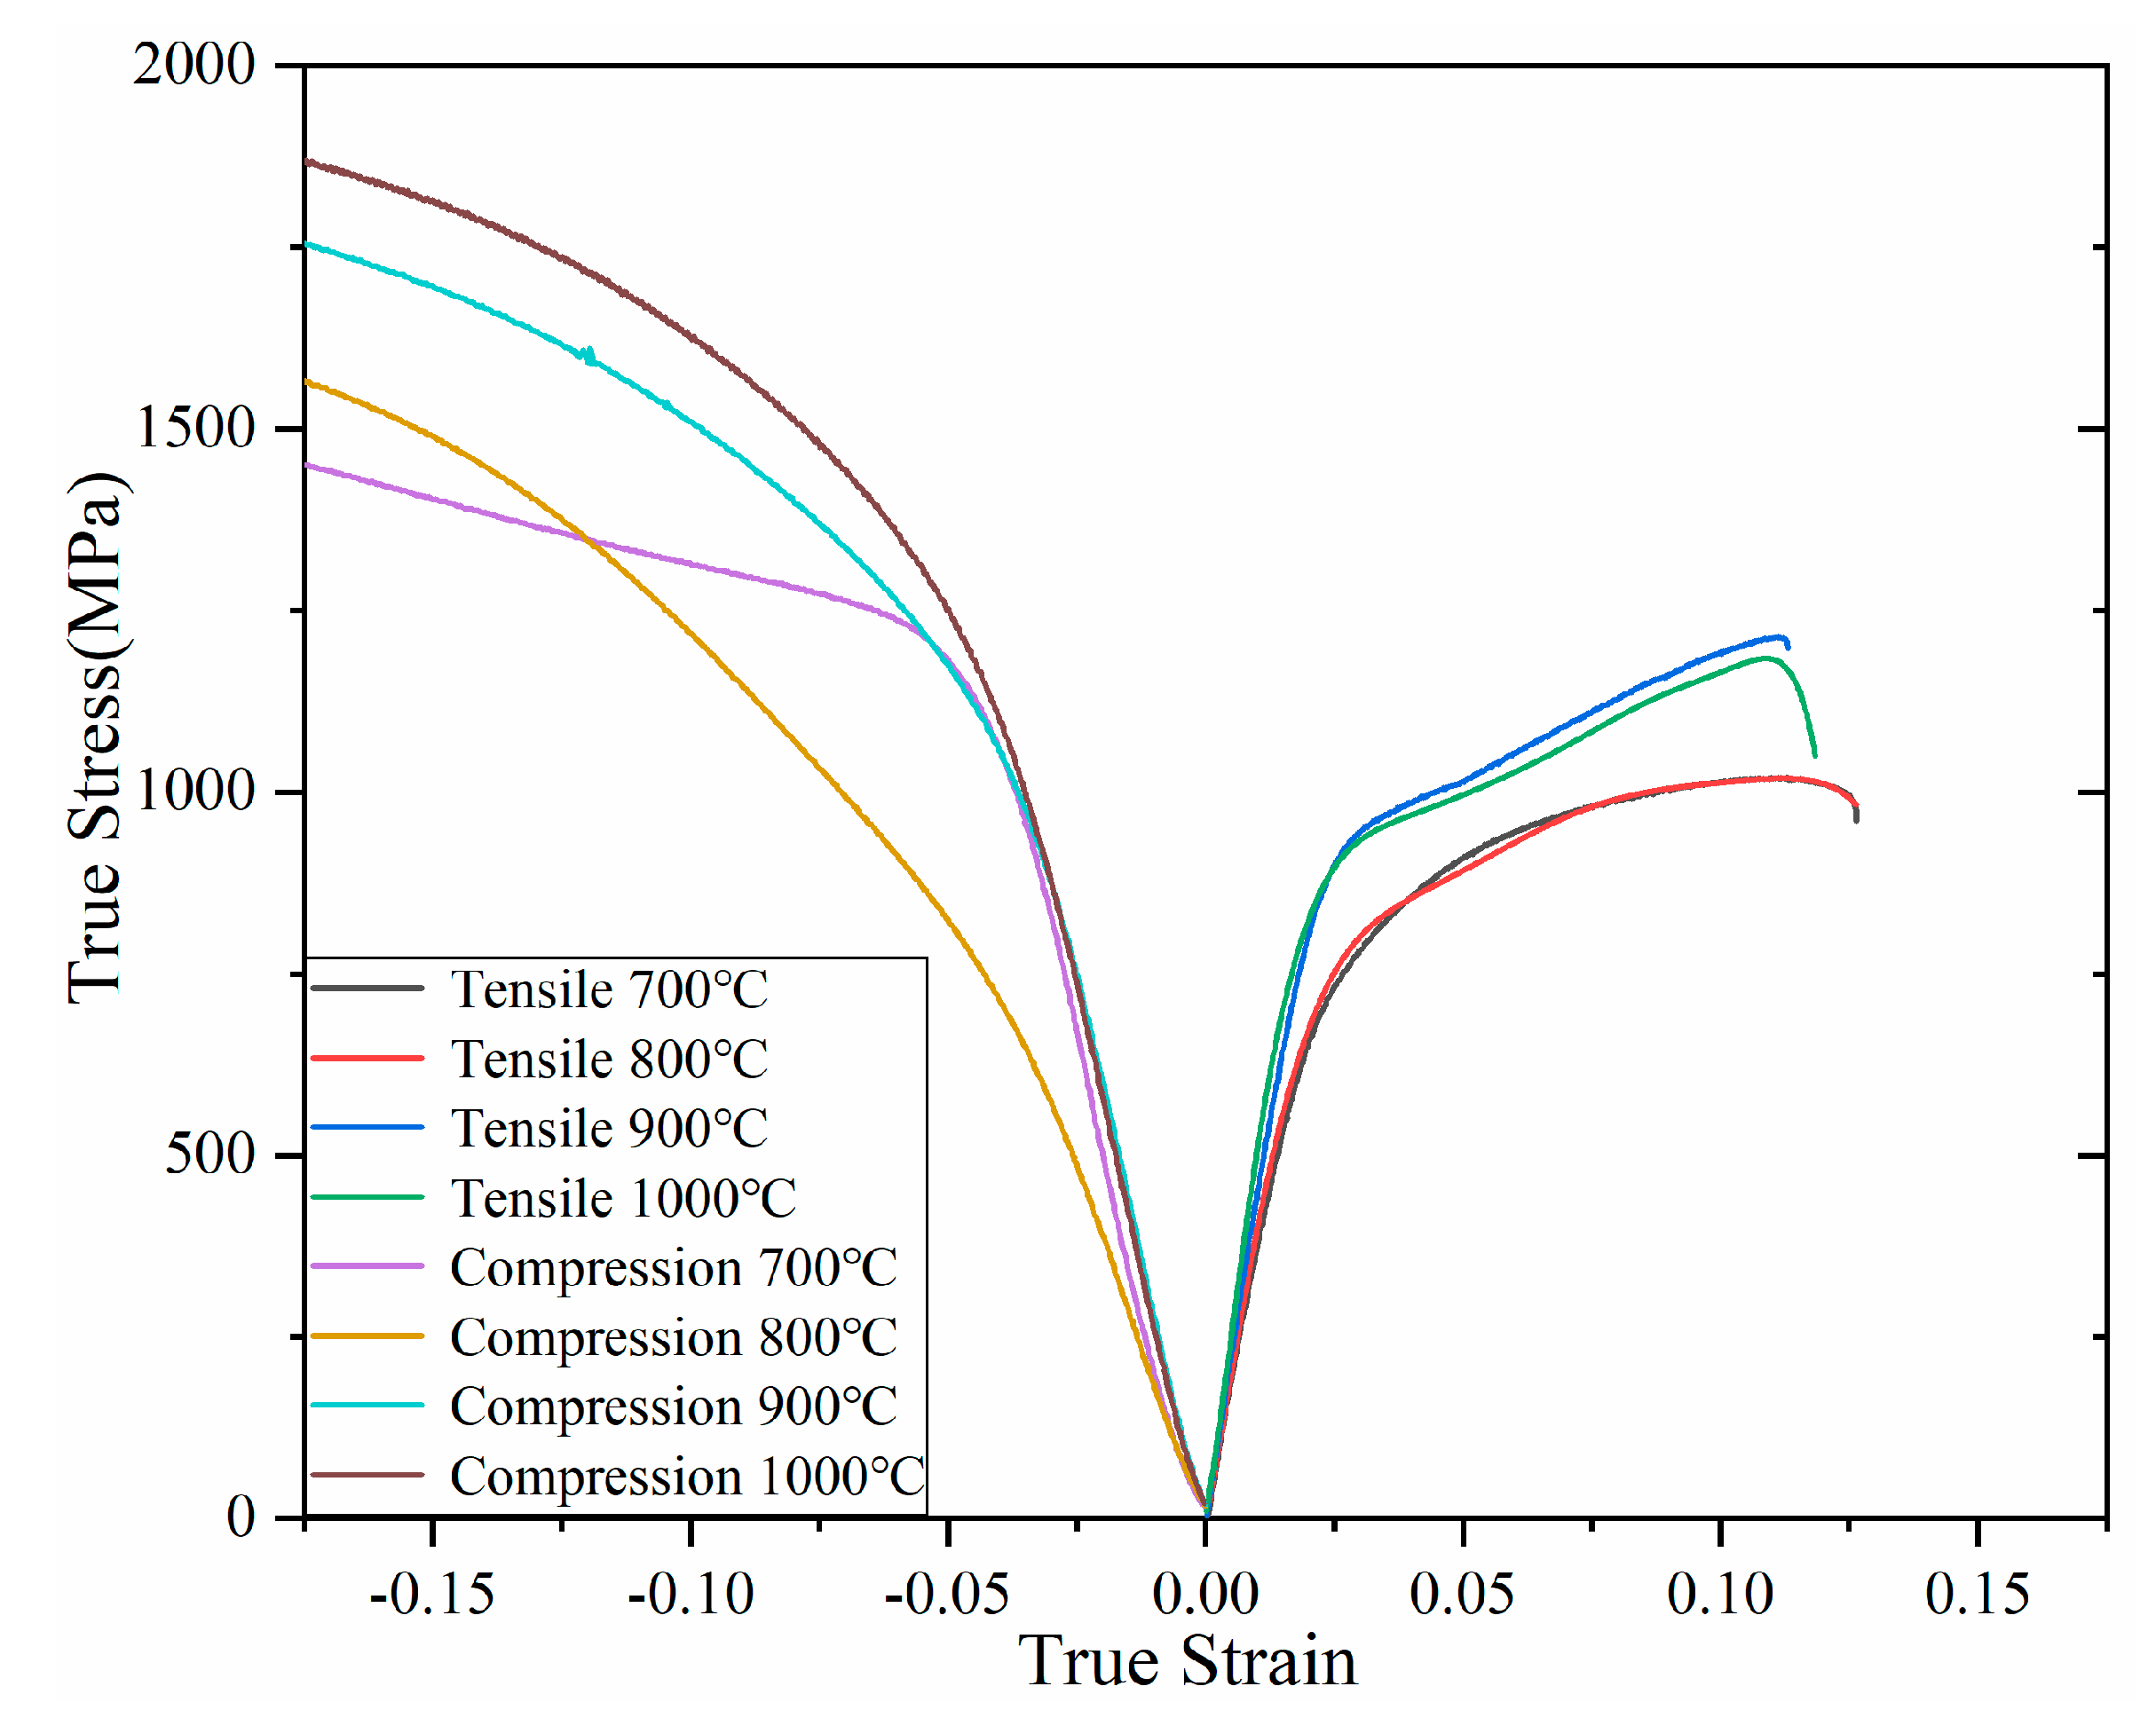
The tensile stress–strain curves of the three alloys after different solution treatments are shown in Figure 5. It can be seen from the figure that, unlike the compression stress-strain curves, there is no stress-induced martensitic transformation in the tensile process. With the increase of solution temperature, the tensile mechanical property of the alloys changes but without any specific law. For Ti-10V-1Fe-3Al and Ti-10V-2Fe-3Al alloys, when the solution temperature is 900 °C, the comprehensive properties of the samples almost reach the highest level, while for Ti-10V-2Cr-3Al alloys, when the temperature is 800 °C, the mechanical properties of the samples reach the best state.

3.5. Asymmetry

Based on the compression and tensile tests, the tension compression asymmetry was studied. Taking Ti-10V-1Fe-3Al alloy as an example, defining the compression strain as a negative value, the tensile strain as a positive value, and plotting the compression curves and the tensile curves into one figure, Figure 6 was obtained. It can be clearly seen that there is a distinct asymmetry between the tensile and compression curves of Ti-10V-1Fe-3Al alloy. The other two alloys also have similar phenomena.
In order to make a more systematic study of the tension compression asymmetry of the three titanium alloys, the following will be analyzed from three aspects: the asymmetry of yield stress, the asymmetry of strain hardening rate and the asymmetry of final strength.

3.5.1. Asymmetry of Yield Stress

Table 2 and Table 3 list the compressive yield strength and tensile yield strength of the three alloys under different solution temperatures, respectively. From the data, it can be seen that there are big differences in the yield stress between different deformation tests, and the compressive yield stress is significantly higher than the yield stress of tension; that is, the yield stress of the three alloys during tension and compression deformation is asymmetric.
In order to express the asymmetry of tension and compression, the yield strength asymmetry parameter n is defined [17] as:
n = σ c σ t σ c r σ t r
where σc is the yield stress in the compression test, σt is the yield stress in the tensile test, and σcr and σtr represent the compressive yield stress and tensile yield stress under the reference conditions, respectively. The yield stress of each alloy after 1000 °C heat treatment is selected as σcr and σtr. According to the above formula, the value of n depends on the difference between the compressive yield stress and the tensile yield stress. The greater the value of n, the larger the difference between the tensile yield stress and the compressive yield stress, and the more obvious the asymmetry of the yield stress.
The relationship between the asymmetry parameter of yield strength (n) and solution temperature is shown in Figure 7. It can be seen from the figure that the effect of solution temperature on the yield strength asymmetry parameters of the three alloys is complex. However, a common feature can be found from the figure; that is, the yield strength asymmetry of Ti-10V-2Cr-3Al alloy is significantly higher than that of the other two alloys. This should be related to the type of alloy elements. Different elements have a great impact on the deformation mode of the alloys, but this needs further research.

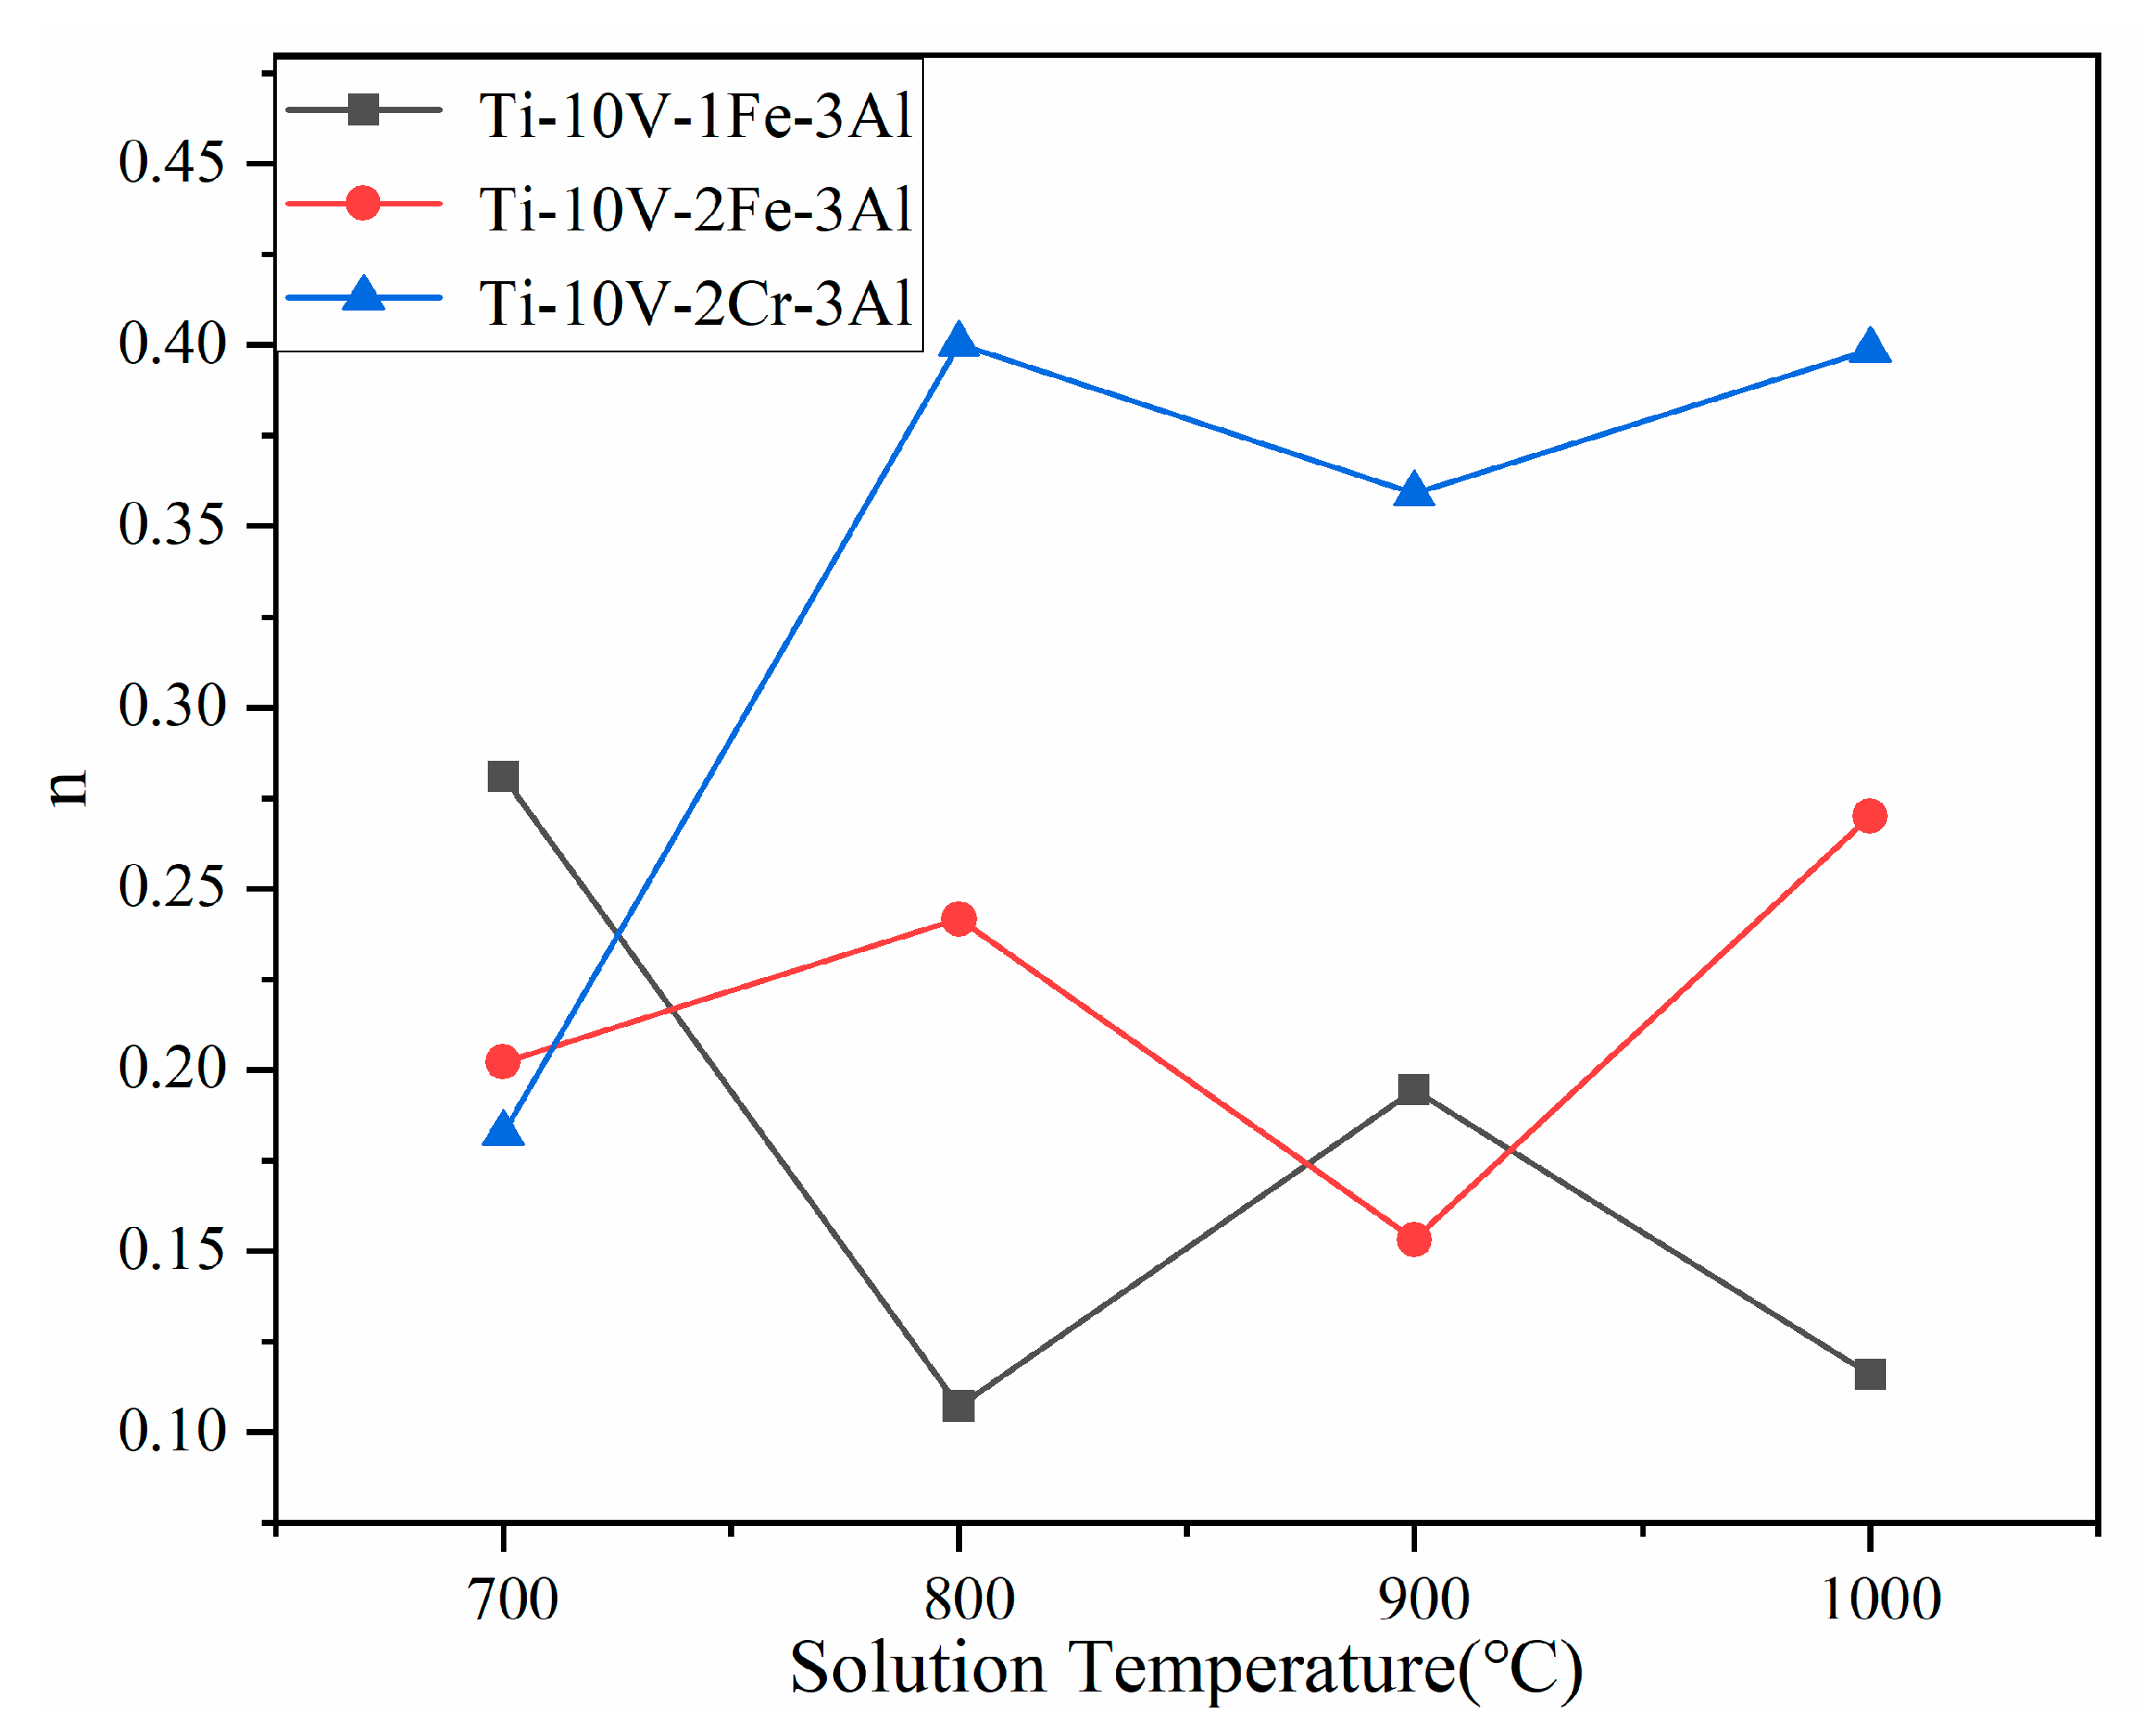
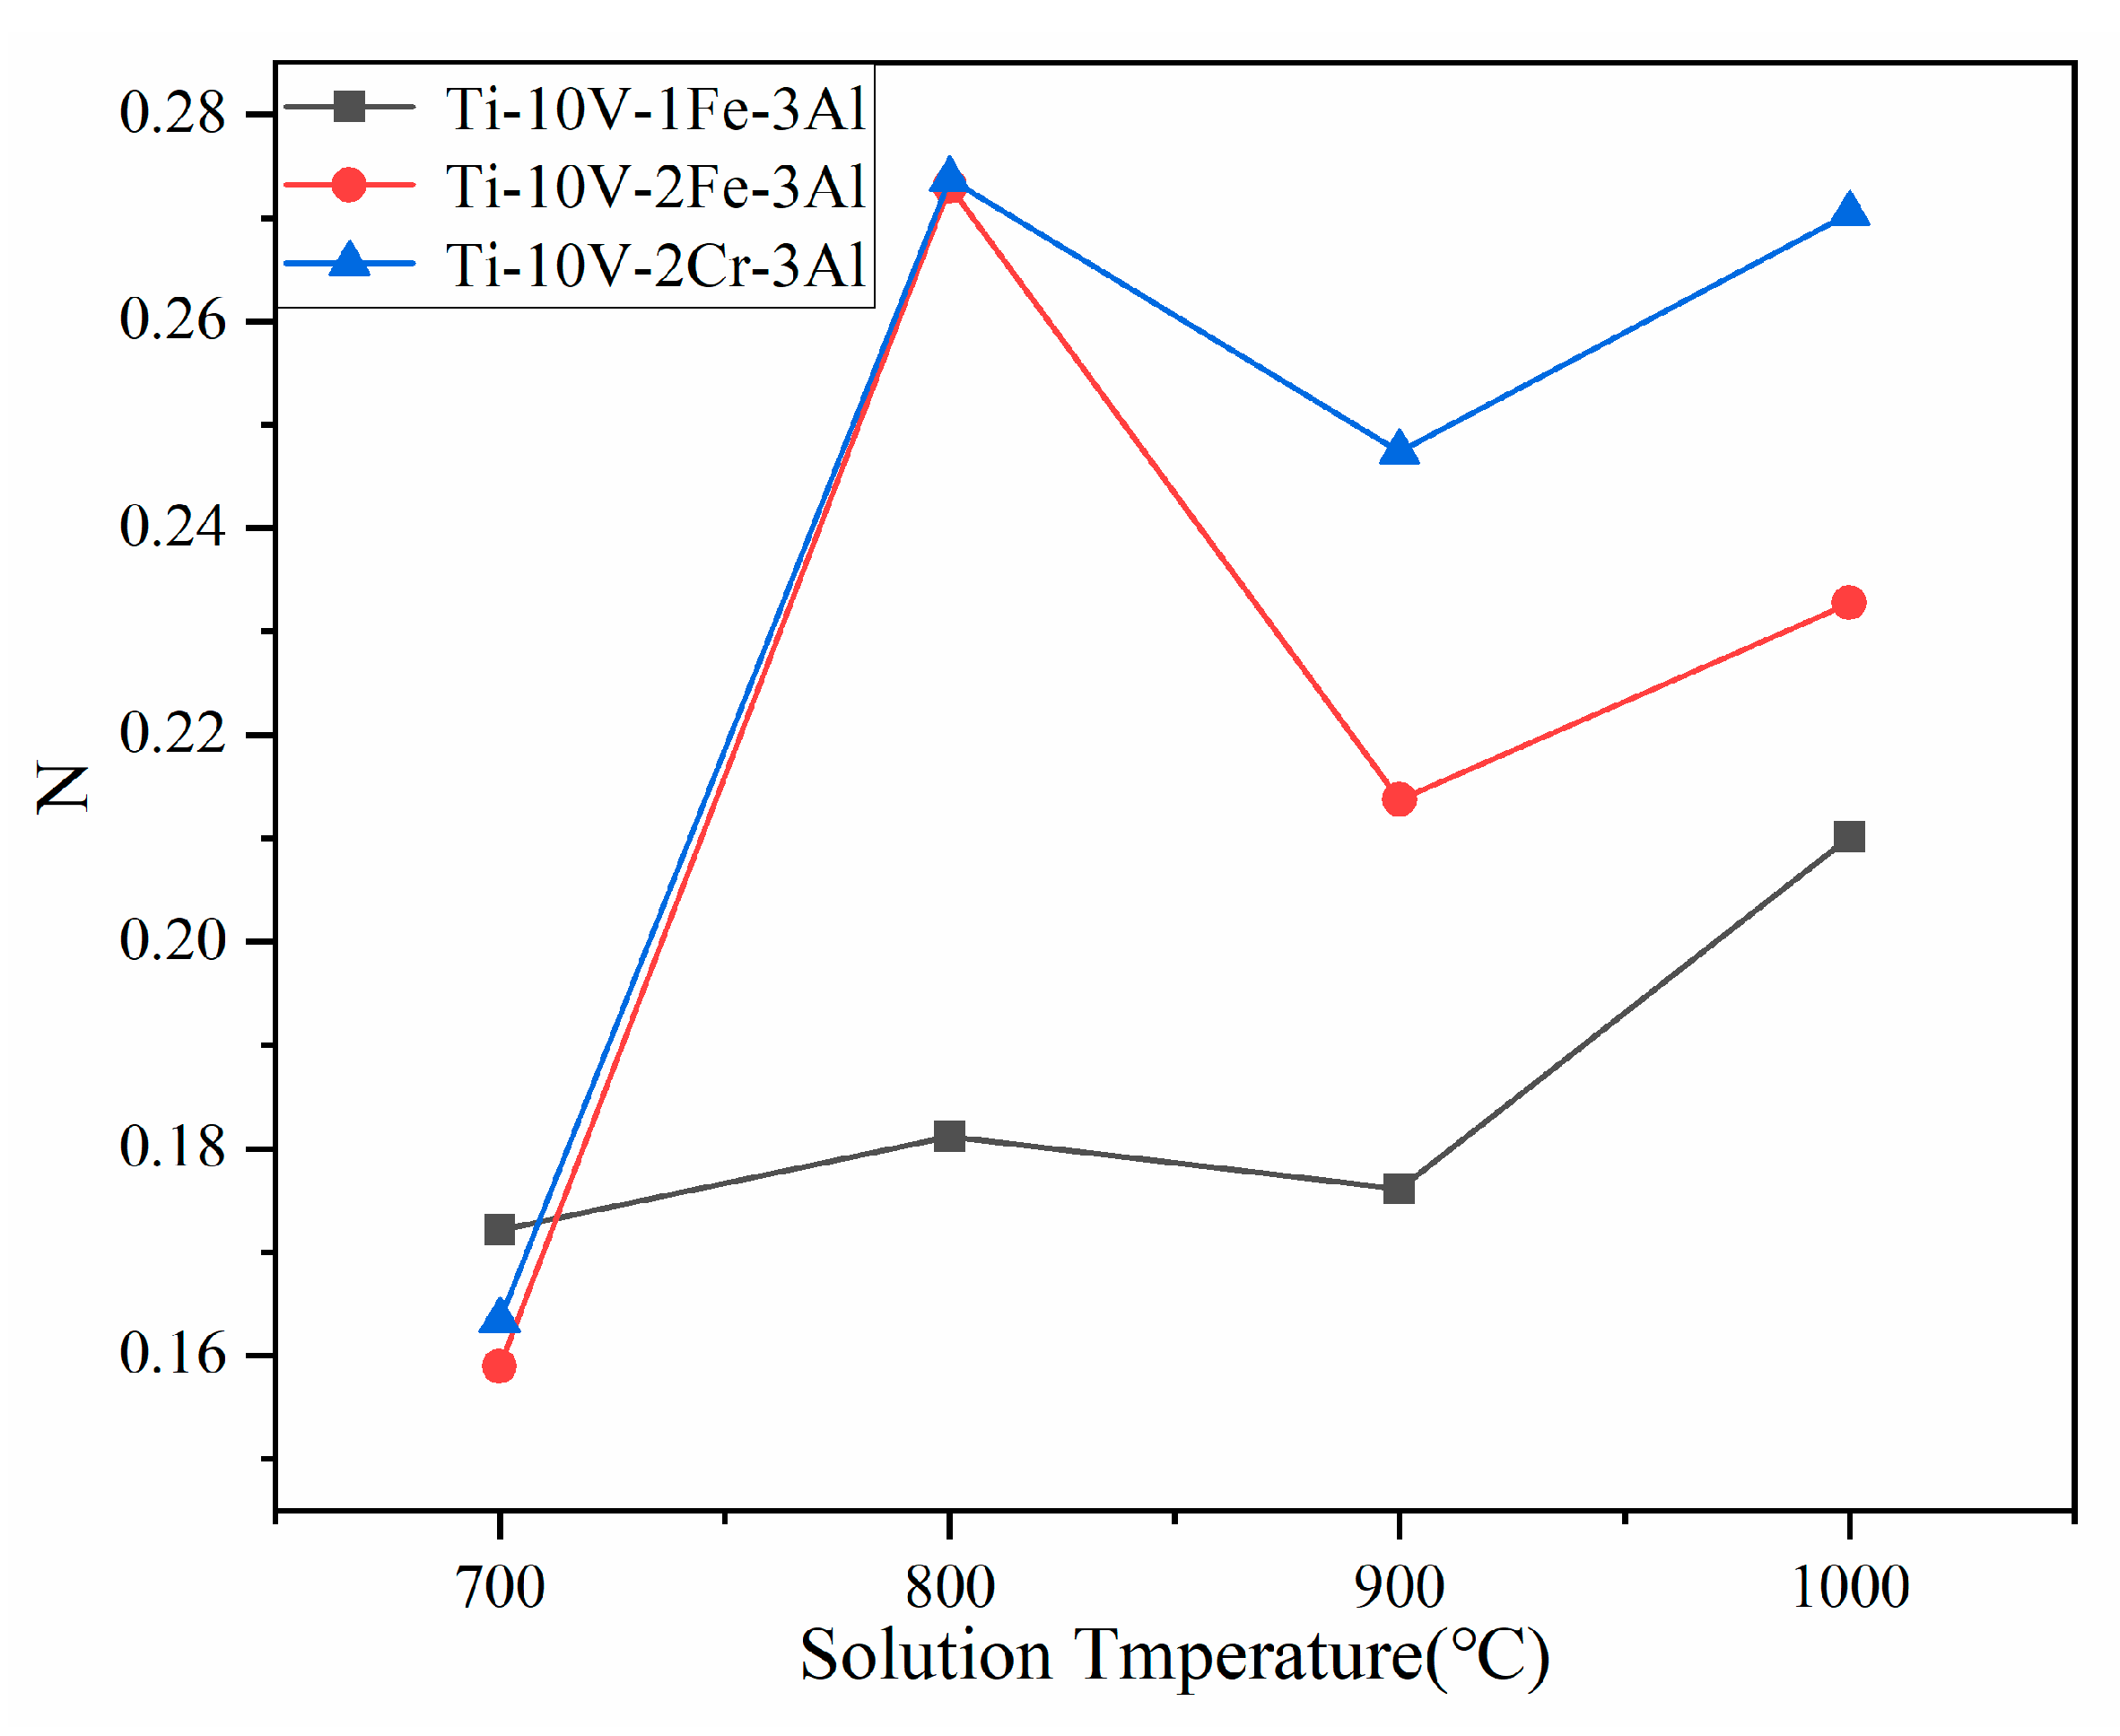
3.5.2. Asymmetry of Strain Hardening Rate

In order to compare the difference between compression strain hardening and tensile strain hardening behavior of three alloys, a strain hardening parameter C was defined [17].
C = σ 0.15 σ 0.125 0.15 0.125
σ0.15 and σ0.125 represent the flow stress when the strains are 0.15 and 0.125, respectively, and the constant C is the average slope between 0.15 and 0.125 in the stress–strain curve. Table 4 and Table 5 list the compression strain hardening rate and tensile strain hardening rate of the three alloys, respectively. It can be found that the tensile strain hardening rates are lower than those of the compressive strain hardening rates, and the strain hardening of the three alloys also presents tension and compression asymmetry.
In order to more intuitively analyze the effect of solution temperature on alloy hardening parameters, a strain hardening asymmetry parameter m is defined.
m = S c S t S c r S t r
where Sc represents the stable strain hardening in the compression test, and St represents the stable strain hardening in the tensile deformation. The strain hardening rates obtained by tensile and compression tests from samples with 1000 °C heat treatment are selected as Scr and Str.
According to the above formula, the value of m strongly depends on the discrepancy between Cc and Ct. The greater the value of m, the greater the difference between tensile hardening rate and compression hardening rate and the larger the asymmetry of strain hardening behavior. With the increase of solution temperature, the hardening rate asymmetries of Ti-10V-2Cr-3Al and Ti-10V-2Fe-3Al first increase and then decrease, but for Ti-10V-2Cr-3Al alloy, m values are more complex and changeable. This is very similar to the yield stress asymmetry discussed in the previous section, as shown in Figure 8.

3.5.3. Asymmetry of Tensile-Compressive Final Strength

The obtained compressive strength and tensile strength values of the three alloys are shown in Table 6 and Table 7. It can be observed that the tensile strength and compressive strength also have an obvious asymmetry.
An asymmetric parameter N can be calculated from the data listed in the above tables:
N = f c f t f c r f t r
where fc is the compressive strength, ft is the tensile strength, and fcr and ftr refer to the compressive strength and tensile strength under the reference conditions, respectively; they are obtained from the samples with 1000 °C heat treatment by tensile and compression tests. According to the above formula, the value of N depends on the difference between compressive strength and tensile strength. The greater the value of N, the greater the difference between compressive strength and tensile strength and the more obvious the asymmetry of ultimate strength stress.
It can be seen from Figure 9 that the asymmetry of final strength changes with the increase of solution temperature. The asymmetries of Ti-10V-1Fe-3Al, Ti-10V-2Fe-3Al and Ti-10V-2Fe-3Al alloys increase first, then decrease, and then increase with the increase of solution temperature. The asymmetries of Ti-10V-2Fe-3Al and Ti-10V-2Cr-3Al are significantly greater than that of Ti-10V-1Fe-3Al. The content of β stabilizer alloying elements has a great influence on the asymmetry.

3.5.4. The Analysis of Tension-Compression Asymmetry

In order to analyze the tension and compression asymmetry of the alloys, TEM observation on deformation microstructure was performed on the specimen with 700 °C solution treatment. As shown in Figure 10, in the compressed sample, twinning was easier to be observed. In Figure 10a,b are bright field images of twinning in the α phase. It can be seen that they have different shapes, twinning in some regions that are parallel to each other and in some regions are staggered. Figure 10c,d are HRTEM (High Resolution Transmission Electron Microscopy) and corresponding FFT (Fast Fourier Transform) images inside the twinning respectively, and it can be seen that there are many stacking faults inside the twinning. However, in tension samples, the twinning is much less. It is generally accepted that the critical shear stress for the triggering of twinning is greater than that of the sliding; therefore, the formation of twinning requires greater external stress. Now, the density of twinning generated by compression deformation is higher than that in tension deformation was confirmed, so the external load required by compression deformation is greater than that of tension deformation, which makes the flow stress of compression higher than that of tension. For sample solutions treated at temperatures higher than 700 °C, there is an obvious double yield phenomenon in the compression curve, and acicular martensite also appears in the microstructure near the fracture, indicating that stress-induced martensite phase transformation occurs in the process of compression deformation. This also strengthens the mechanical properties of the alloy during compression deformation. However, there is no stress-induced martensite phase transformation in the tensile deformation behavior, which makes the flow stress of the alloy during tensile deformation lower than that of the compression deformation.
Fundenberger et al. used a Taylor model to simulate the yield trajectory of TC4 and Ti60 alloys; the simulation results show that in TC4 alloy, the CRSS of conical surface <c + a> slip during compression is twice as much the CRSS during tension, and in Ti60 alloy, the CRSS during compression is 1.25 times the CRSS during tension [18]. Lecomte et al. also found tension and compression asymmetry in the high temperature tensile and compression tests of Ti-6A1-4V alloy with a strong texture; the analysis also shows that this tension and compression asymmetry of macro mechanical properties is caused by the asymmetry of conical surface <c + a> slip [19]. These studies confirmed that the CRSS of conical surface <c + a> slip in α titanium has tension and compression asymmetry, and its main mechanism is that the conical <c + a> slip of HCP metal has normal pressure sensitivity and directivity, and the slip of conical surface <c + a> in α titanium is affected by the normal stress of the slip surface, which leads to the tension and compression asymmetry of the <c + a> slip. The normal stress of the slip surface during uniaxial tension is tensile stress, so the conical surface <c + a> slip is more likely to occur. However, during the uniaxial compression, the normal stress of the slip surface is compressive stress, so the conical surface <c + a> slip is more difficult to occur.
To sum up, the difference in the number of twinnings between uniaxial tension and uniaxial compression, the presence or absence of stress-induced martensite phase transformation, and the asymmetry of CRSS of conical surface <c + a> slip may be the reasons for the asymmetry of mechanical properties of these alloys.

4. Conclusions

In order to better promote the application of titanium alloys in the biomedical field and reveal the different mechanical property responses of titanium alloys under tensile and compressive loads, the tension compression asymmetry of three kinds of dual phase titanium alloys is studied in this paper. The main conclusions are as follows:
(1)
The microstructures of Ti-10V-1Fe-3Al, Ti-10V-2Fe-3Al and Ti-10V-2Cr-3Al alloys changed significantly after 700 °C, 800 °C, 900 °C and 1000 °C, which had an important impact on the hardness of the alloys.
(2)
Different solution temperatures have a very significant impact on the compressive and tensile properties of the three alloys. During compression deformation, the samples with solid solution at 800 °C and above produced obvious stress-induced martensitic transformation, while no transformation occurs during tensile deformation.
(3)
There are obvious asymmetries in yield strength, strain hardening rate and final strength of the three alloys during compression deformation and tensile deformation.
(4)
The difference in the number of twins between uniaxial tension and uniaxial compression, the presence or absence of stress-induced martensitic transformation, and the asymmetry of CRSS of cone <c + a> slip may be the reasons for the asymmetry of mechanical properties of these alloys.
(5)
Different elements have a great impact on the deformation mode of the alloys, but the fundamental mechanism is complex and still unclear, so for the further investigation, this needs further research.

Author Contributions

Conceptualization, Y.W.; methodology, J.W.; writing—original draft preparation, S.D.; writing—review and editing, C.L. All authors have read and agreed to the published version of the manuscript.

Funding

This research was funded by the Foundation of Hunan Science and Technology Department-Clinical Medical Technology Demonstration Base For Neurosurgery In Hunan Province (2018SK4003), the National Natural Science Foundation of China (51801157), and the Scientific Research Foundation of Hunan Provincial Education Department of China (21B0796).

Institutional Review Board Statement

Not applicable.

Informed Consent Statement

Not applicable.

Data Availability Statement

The data used to support the findings of this study were included within the article. Should further data or information be required, these are available from the corresponding author upon request.

Conflicts of Interest

The authors declare that there are no conflict of interest.

References

  1. Xiao, H.; Liu, X.Y.; Lu, Q.H.; Hu, T.; Hong, Y.; Li, C.; Zhong, R.J.; Chen, W.L. Promoted low temperature plasma nitriding for improving wear performance of arc-deposited ceramic coatings on Ti6Al4V alloy via shot peening pretreatment. J. Mater. Res. Tecchnol. 2022, 19, 2981–2990. [Google Scholar] [CrossRef]
  2. Li, C.; Li, H.; Van der Zwaag, S. Unravelling the abrasion resistance of two novel meta-stable titanium alloys on the basis multi-pass-dual-indenter tests. Wear 2019, 440–441, 203094. [Google Scholar] [CrossRef]
  3. Hanawa, T. Titanium-tissue interface reaction and its control with surface treatment. Front. Bioeng. Biotech. 2019, 7, 170. [Google Scholar] [CrossRef]
  4. Li, C.; Qin, L.; Li, M.; Xiao, H.; Wang, Q.; Chen, J. Influence of deformation strain rate on the mechanical response in a metastable titanium alloy with various microstructures. J. Alloys Compd. 2020, 815, 152426. [Google Scholar] [CrossRef]
  5. Manshadi, A.D.; Dippenaar, R.J. Strain-induced phase transformation during thermo-mechanical processing of titanium alloys. Mater. Sci. Eng. A 2012, 552, 451–456. [Google Scholar] [CrossRef]
  6. Seshacharyulu, T.; Medeiros, S.; Frazier, W.; Prasad, Y. Microstructural mechanisms during hot working of commercial grade Ti-6Al-4V with lamellar starting structure. Mater. Sci. Eng. A 2002, 325, 112–125. [Google Scholar] [CrossRef]
  7. Clément, N.; Lenain, A.; Jacques, P.J. Mechanical property optimization via microstructural control of new metastable beta titanium alloys. JOM 2007, 59, 50–53. [Google Scholar] [CrossRef]
  8. Chamanfar, A.; Huang, M.F.; Pasang, T.; Tsukamoto, M.; Misiolek, W.Z. Microstructure and mechanical properties of laser welded Ti-10V-2Fe-3Al (Ti1023) titanium alloy. J. Mater. Sci. Tecchnol. 2020, 9, 7721–7731. [Google Scholar] [CrossRef]
  9. Chen, Y.; Du, Z.; Xiao, S.; Xu, L.; Tian, J. Effect of aging heat treatment on microstructure and tensile properties of a new β high strength titanium alloy. J. Alloys Compd. 2014, 586, 588–592. [Google Scholar] [CrossRef]
  10. Srinivasu, G.; Natraj, Y.; Bhattacharjee, A.; Nandy, T.K.; Rao, G.V.S.N. Tensile and fracture toughness of high strength β titanium alloy, Ti-10V-2Fe-3Al, as a function of rolling and solution treatment temperatures. Mater. Design. 2013, 47, 323–330. [Google Scholar] [CrossRef]
  11. Tuninetti, V.; Gilles, G.; Milis, O. Anisotropy and tension–compression asymmetry modeling of the room temperature plastic response of Ti-6Al-4V. Int. J. Plast. 2015, 67, 53–68. [Google Scholar] [CrossRef]
  12. Lin, P.; Hao, Y.; Zhang, B.; Zhang, S.; Chi, C.; Shen, J. Tension-compression asymmetry in yielding and strain hardening behavior of CP-Ti at room temperature. Mater. Sci. Eng. A 2017, 707, 172–180. [Google Scholar] [CrossRef]
  13. Zhang, Q.; Zhang, J.; Wang, Y. Effect of strain rate on the tension–compression asymmetric responses of Ti-6.6 Al-3.3 Mo-1.8 Zr-0.29 Si. Mater. Design. 2014, 61, 281–285. [Google Scholar] [CrossRef]
  14. Murasawa, G.; Morimoto, T.; Yoneyama, S. Nucleation and growth behavior of twin region around yield point of polycrystalline pure Ti. Exp. Mech. 2012, 52, 503–512. [Google Scholar] [CrossRef]
  15. Zhang, B.; Wang, J.; Wang, Y.; Li, Z.R. Strain-rate-dependent tensile response of Ti-5Al-2.5 Sn alloy. Materials 2019, 12, 659. [Google Scholar] [CrossRef]
  16. Li, C.; Huang, C.; Ding, Z.L.; Zhou, X. Research on High-Temperature Compressive Properties of Ti-10V-1Fe-3Al Alloy. Metals 2022, 12, 526. [Google Scholar] [CrossRef]
  17. Zhang, B.; Wang, J.; Wang, Y.; Li, Z.R.; Wang, Y. Dynamic strain-rate effect on uniaxial tension deformation of Ti5Al2.5Sn titanium alloy at various temperature. Mater. High. Temp. 2019, 36, 479–488. [Google Scholar] [CrossRef]
  18. Fundenberger, J.J.; Philippe, M.J.; Wagner, F.; Esling, C. Modelling and prediction of mechanical properties for materials with hexagonal symmetry (zinc, titanium and zirconium alloys). Acta Mater. 1997, 45, 4041–4055. [Google Scholar] [CrossRef]
  19. Lecomte, J.S.; Philippe, M.J.; Klimanek, P. Plastic deformation of a Ti-6%Al-4%V alloy with a strong transverse-type crystallographic a-texture at elevated temperature. Mater. Sci. Eng. A 1997, 234–236, 869–872. [Google Scholar] [CrossRef]
Figure 1. The dimensions (unit: mm) of different samples: (a) compression test, (b) tensile test.
Metals 12 01352 g001
Figure 2. Microstructure of examined alloys: (ac) Ti-10V-1Fe-3Al alloy for as-received, 800 °C and 1000 °C solution treatment conditions, respectively. (df) Ti-10V-2Fe-3Al alloy for as-received, 800 °C and 1000 °C solution treatment conditions, respectively. (gi) Ti-10V-2Cr-3Al alloy for as-received, 800 °C and 1000 °C solution treatment conditions, respectively.
Metals 12 01352 g002
Figure 3. The relationship between hardness and solid solution temperature.
Metals 12 01352 g003
Figure 4. Compression stress–strain curves: (a) Ti-10V-1Fe-3Al, (b) Ti-10V-2Fe-3Al, (c) Ti-10V-2Cr-3Al.
Metals 12 01352 g004aMetals 12 01352 g004b
Figure 5. Tensile stress–strain curves: (a) Ti-10V-1Fe-3Al, (b) Ti-10V-2Fe-3Al, (c) Ti-10V-2Cr-3Al.
Metals 12 01352 g005
Figure 6. Compression and tensile true stress–strain curves of Ti-10V-1Fe-3Al alloy at different solution temperatures.
Metals 12 01352 g006
Figure 7. Effect of solution temperature on yield stress asymmetry.
Metals 12 01352 g007
Figure 8. Effect of solution temperature on asymmetry of strain hardening rate.
Metals 12 01352 g008
Figure 9. Effect of solution temperature on asymmetry of tensile strength and compressive strength.
Metals 12 01352 g009
Figure 10. TEM image of deformation twins in the compressed titanium samples: (a,b) bright field images, (c) HRTEM image of deformation twinning, (d) the FFT of image c.
Metals 12 01352 g010
Table 1. The composition of three alloys (wt%).
AlloysElements
Ti-10V-2Fe-3AlVAlFeONC
9.831.90.110.010.07
Ti-10V-2Cr-3AlVAlCrONC
10.63.192.180.10.0130.05
Ti-10V-1Fe-3AlVAlFeONC
9.973.020.970.110.0140.051
Table 2. Uniaxial compressive yield strength of three alloys (MPa).
AlloysTi-10V-1Fe-3AlTi-10V-2Fe-3AlTi-10V-2Cr-3Al
Temperatures
700 °C121810681085
800 °C81010371366
900 °C109611001366
1000 °C122913641475
Table 3. Uniaxial tensile yield strength of three alloys (MPa).
AlloysTi-10V-1Fe-3AlTi-10V-2Fe-3AlTi-10V-2Cr-3Al
Temperatures
700 °C599634700
800 °C574518522
900 °C771684609
1000 °C974784634
Table 4. Tensile strain hardening parameters of three alloys.
AlloysTi-10V-1Fe-3AlTi-10V-2Fe-3AlTi-10V-2Cr-3Al
Temperatures
700 °C230019201280
800 °C396039603920
900 °C336034003240
1000 °C296036003480
Table 5. Compression strain hardening parameters of three alloys.
AlloysTi-10V-1Fe-3AlTi-10V-2Fe-3AlTi-10V-2Cr-3Al
Temperatures
700 °C804478528584
800 °C996810,5009272
900 °C9504924510,036
1000 °C954482159016
Table 6. Compressive strengths of three alloys (MPa).
AlloysTi-10V-1Fe-3AlTi-10V-2Fe-3AlTi-10V-2Cr-3Al
Temperatures
700 °C153715201550
800 °C156218691871
900 °C174218581879
1000 °C181419021905
Table 7. Tensile strengths of three alloys (MPa).
AlloysTi-10V-1Fe-3AlTi-10V-2Fe-3AlTi-10V-2Cr-3Al
Temperatures
700 °C102110621060
800 °C101910301050
900 °C121412201137
1000 °C118411901094
Publisher’s Note: MDPI stays neutral with regard to jurisdictional claims in published maps and institutional affiliations.

