Article

Effects of Corner Constraint on the Microstructure and Mechanical Properties of Aluminum Alloy Using the CMT+P Deposition Process

1
School of Materials Science and Engineering, Tianjin University, Tianjin 300350, China
2
Welding Workshop, Tianjin Long March Launch Vehicle Manufacturing Co., Ltd., Tianjin 300462, China
*
Author to whom correspondence should be addressed.
Metals 2022, 12(9), 1423; https://doi.org/10.3390/met12091423
Submission received: 27 July 2022 / Revised: 16 August 2022 / Accepted: 24 August 2022 / Published: 28 August 2022

Abstract

:
Wire arc additive manufacturing technology with cold metal transfer and pulse welding (CMT+P) is a promising technology for fabricating complex metal structures. In this paper, a lot of basic research was conducted on the corner-constrained and unconstrained zones of 4043 aluminum alloy made using CMT+P. In particular, the microstructure morphology and mechanical properties of the corner-constrained and unconstrained zones of 4043 aluminum alloy made by CMT+P were studied by using a thermal field emission scanning electron microscope, a microhardness tester, etc. The results showed that there were cellular crystals at the top, columnar dendritic crystals in the middle and bottom, and smaller equiaxed crystals in the bottom center. The grain size in the corner-constrained zone was larger than that in the unconstrained zone, and the grain size increased by about 88.34%. Moreover, the microhardness of the unconstrained zone was 50 HV, while the microhardness of the corner-constrained zone was 45 HV. Furthermore, the tensile strength of this material was 148 MPa, the elongation was 31%, the fracture behavior in the middle and top areas was typical of a ductile fracture, and the fracture in the bottom area was a mixed ductile–brittle fracture dominated by the ductile fracture.

1. Introduction

Aluminum alloy, known for its low density, high strength, and recyclability, is widely used in modern industry [1]. However, with the rapid development of aerospace, petrochemical, and other industries, the demand for complex structural molded parts is increasing, but it is difficult to meet the requirements with traditional casting, forging, and machining methods. Therefore, metal additive manufacturing (AM) technology has been widely used in the production of complex parts made of aluminum alloys. It is a new technology for manufacturing parts by continuous deposition of materials on a substrate, which can shorten the lead time and save the project cost [2].
Based on different heat sources, metal additive manufacturing technology can be divided into wire arc additive manufacturing (WAAM), electron beam additive manufacturing (EBAM), and laser additive manufacturing. Based on powder feeding, laser additive manufacturing can be divided into selective laser melting (SLM) and laser metal deposition (LMD), which are widely used for high-value-added materials due to their high processing accuracy. Electron beam freedom fabrication (EBF) is the main technology for EBAM, which has the advantage that it can manufacture titanium alloy and other metals under vacuum conditions. However, aluminum alloy is not suitable for laser additive manufacturing and EBAM due to its low laser absorption rate and the evaporation of aluminum element under EBF. In addition, compared to the deposition rates of up to 50 g/h for SLM [3] and 480–900 g/h for LMD [4], WAAM stands out for its high deposition rates of 3–10 kg/h [4,5] and its ability to manufacture large parts.
Furthermore, based on the standard (ISO/ASTM 52900:2021), WAAM is a direct energy deposition technology, which can be specifically divided into gas metal arc welding (GMAW) additive manufacturing, gas tungsten arc welding (GTAW) additive manufacturing, and cold metal transition welding (CMTW) additive manufacturing. However, GMAW [6] technology has serious droplet spatter and its arc stability is highly dependent on the wire-feeding system. Although GTAW [7] has solved this problem to some extent, it is difficult to match the wire-feeding mechanism and heat source because they are independent from each other, which limits the application of this technology in manufacturing complex parts. Due to the principle of alternating hot and cold and low welding heat input to avoid the aforementioned problems, CMTW is more suitable for the manufacturing of complex parts of aluminum alloy.
The transition mode of metals has an important impact on additive manufacturing. Aldalur et al. [8] studied three working modes suitable for the transition of aluminum alloys by comparing the pulsed-GMAW mode, cold arc mode, and pulsed- alternating current (AC) mode. The pulsed-AC mode greatly reduced the porosity level and obtained values that were 6 times lower than those obtained by the cold arc mode and 10 times lower than those obtained by the pulse-GMAW mode. The arc mode in cold metal transition has a direct influence on the generation of porosity in the additive manufacturing process of aluminum alloy. Cong et al. [9] analyzed the mechanism of porosity generation in conventional CMT, CMT pulse (CMT-P), CMT advanced (CMT-ADV), and CMT pulse advanced (CMT-P ADV), providing a basis for the selection of the cold metal transition arc mode in this study. The cold metal transfer pulse (CMT+P) is a new CMT welding technology developed by Fronius, which further facilitates the regulation and control of heat input [10] and can also refine the grain size and reduce material brittleness. Zhang et al. [11] manufactured Al–6Mg alloy by using variable-polarity cold metal transfer (VP-CMT) and found that the top zone had a fine cellular crystal structure and the middle zone had a columnar crystal structure and that using the VP-CMT process helped refine the grains and improve the strength of the material. Xie et al. [12] used a double-wire, double-arc CMT+P process to deposit and form 30-layer stainless steel parts. The study found that the tensile strength and elongation were good when the wire-feeding speed was 5 m/min and the deposition rate was up to 5.4 kg/h. However, this was only a study of formation when unconstrained and lacked fundamental data to elucidate the geometrical limitations, microstructure, and mechanical performance criteria of WAAM. Researchers have used the finite element method (FEM) to conduct extensive studies on path planning and model optimization of aluminum alloy wire arc additive manufacturing technology and have achieved certain results [8,13,14,15]. Chakraborty et al. [16] proposed curved layer fused deposition modeling (CLFDM) for extruder path generation, which can improve part strength, while reducing step effects, the number of layers, and machining cycles. However, these studies are based on theoretical model simulations, which are difficult to be truly applied to actual production. Geng et al. [17] prepared formed parts of 5A06 using GTAW, studying the geometric constraints on them and their tensile properties. They concluded that the minimum corner angle of the formed parts made by WAAM is 20° and the minimum radius of curvature is 10 mm. However, there is a lack of comparative studies of the corner-constrained zone (CCZ) and unconstrained zone (UZ) of aluminum alloy.
The research on corner constraint has a significant impact on the development of additive manufacturing technology in the die and mold industry. During deposition, the different attitude of the torch in space in the UZ and CCZ causes different heat accumulation per unit time, which affects the microstructure and mechanical properties of the workpiece.
Therefore, in this paper, the formed parts of 4043 aluminum alloy in the UZ and CCZ were manufactured using the CMT+P process by using commercial ER4043 welding wire (Shandong Luwang Welding Materials Co., Ltd. Jinan, China) and a 6061-T6 state substrate (Shanghai Moju Special Steel Co., Ltd. Shanghai, China). Moreover, the macroscopic morphology, microstructure, and mechanical properties of the formed parts of aluminum alloy in the UZ and CCZ were systematically compared. The differences in the grain size, defects, grain growth direction, and microhardness were investigated in detail, and the effects of reheating times on the microstructure, strength, and fracture behavior of the UZ and CCZ were studied, in addition to elucidating the mechanism of formation of the second phase.

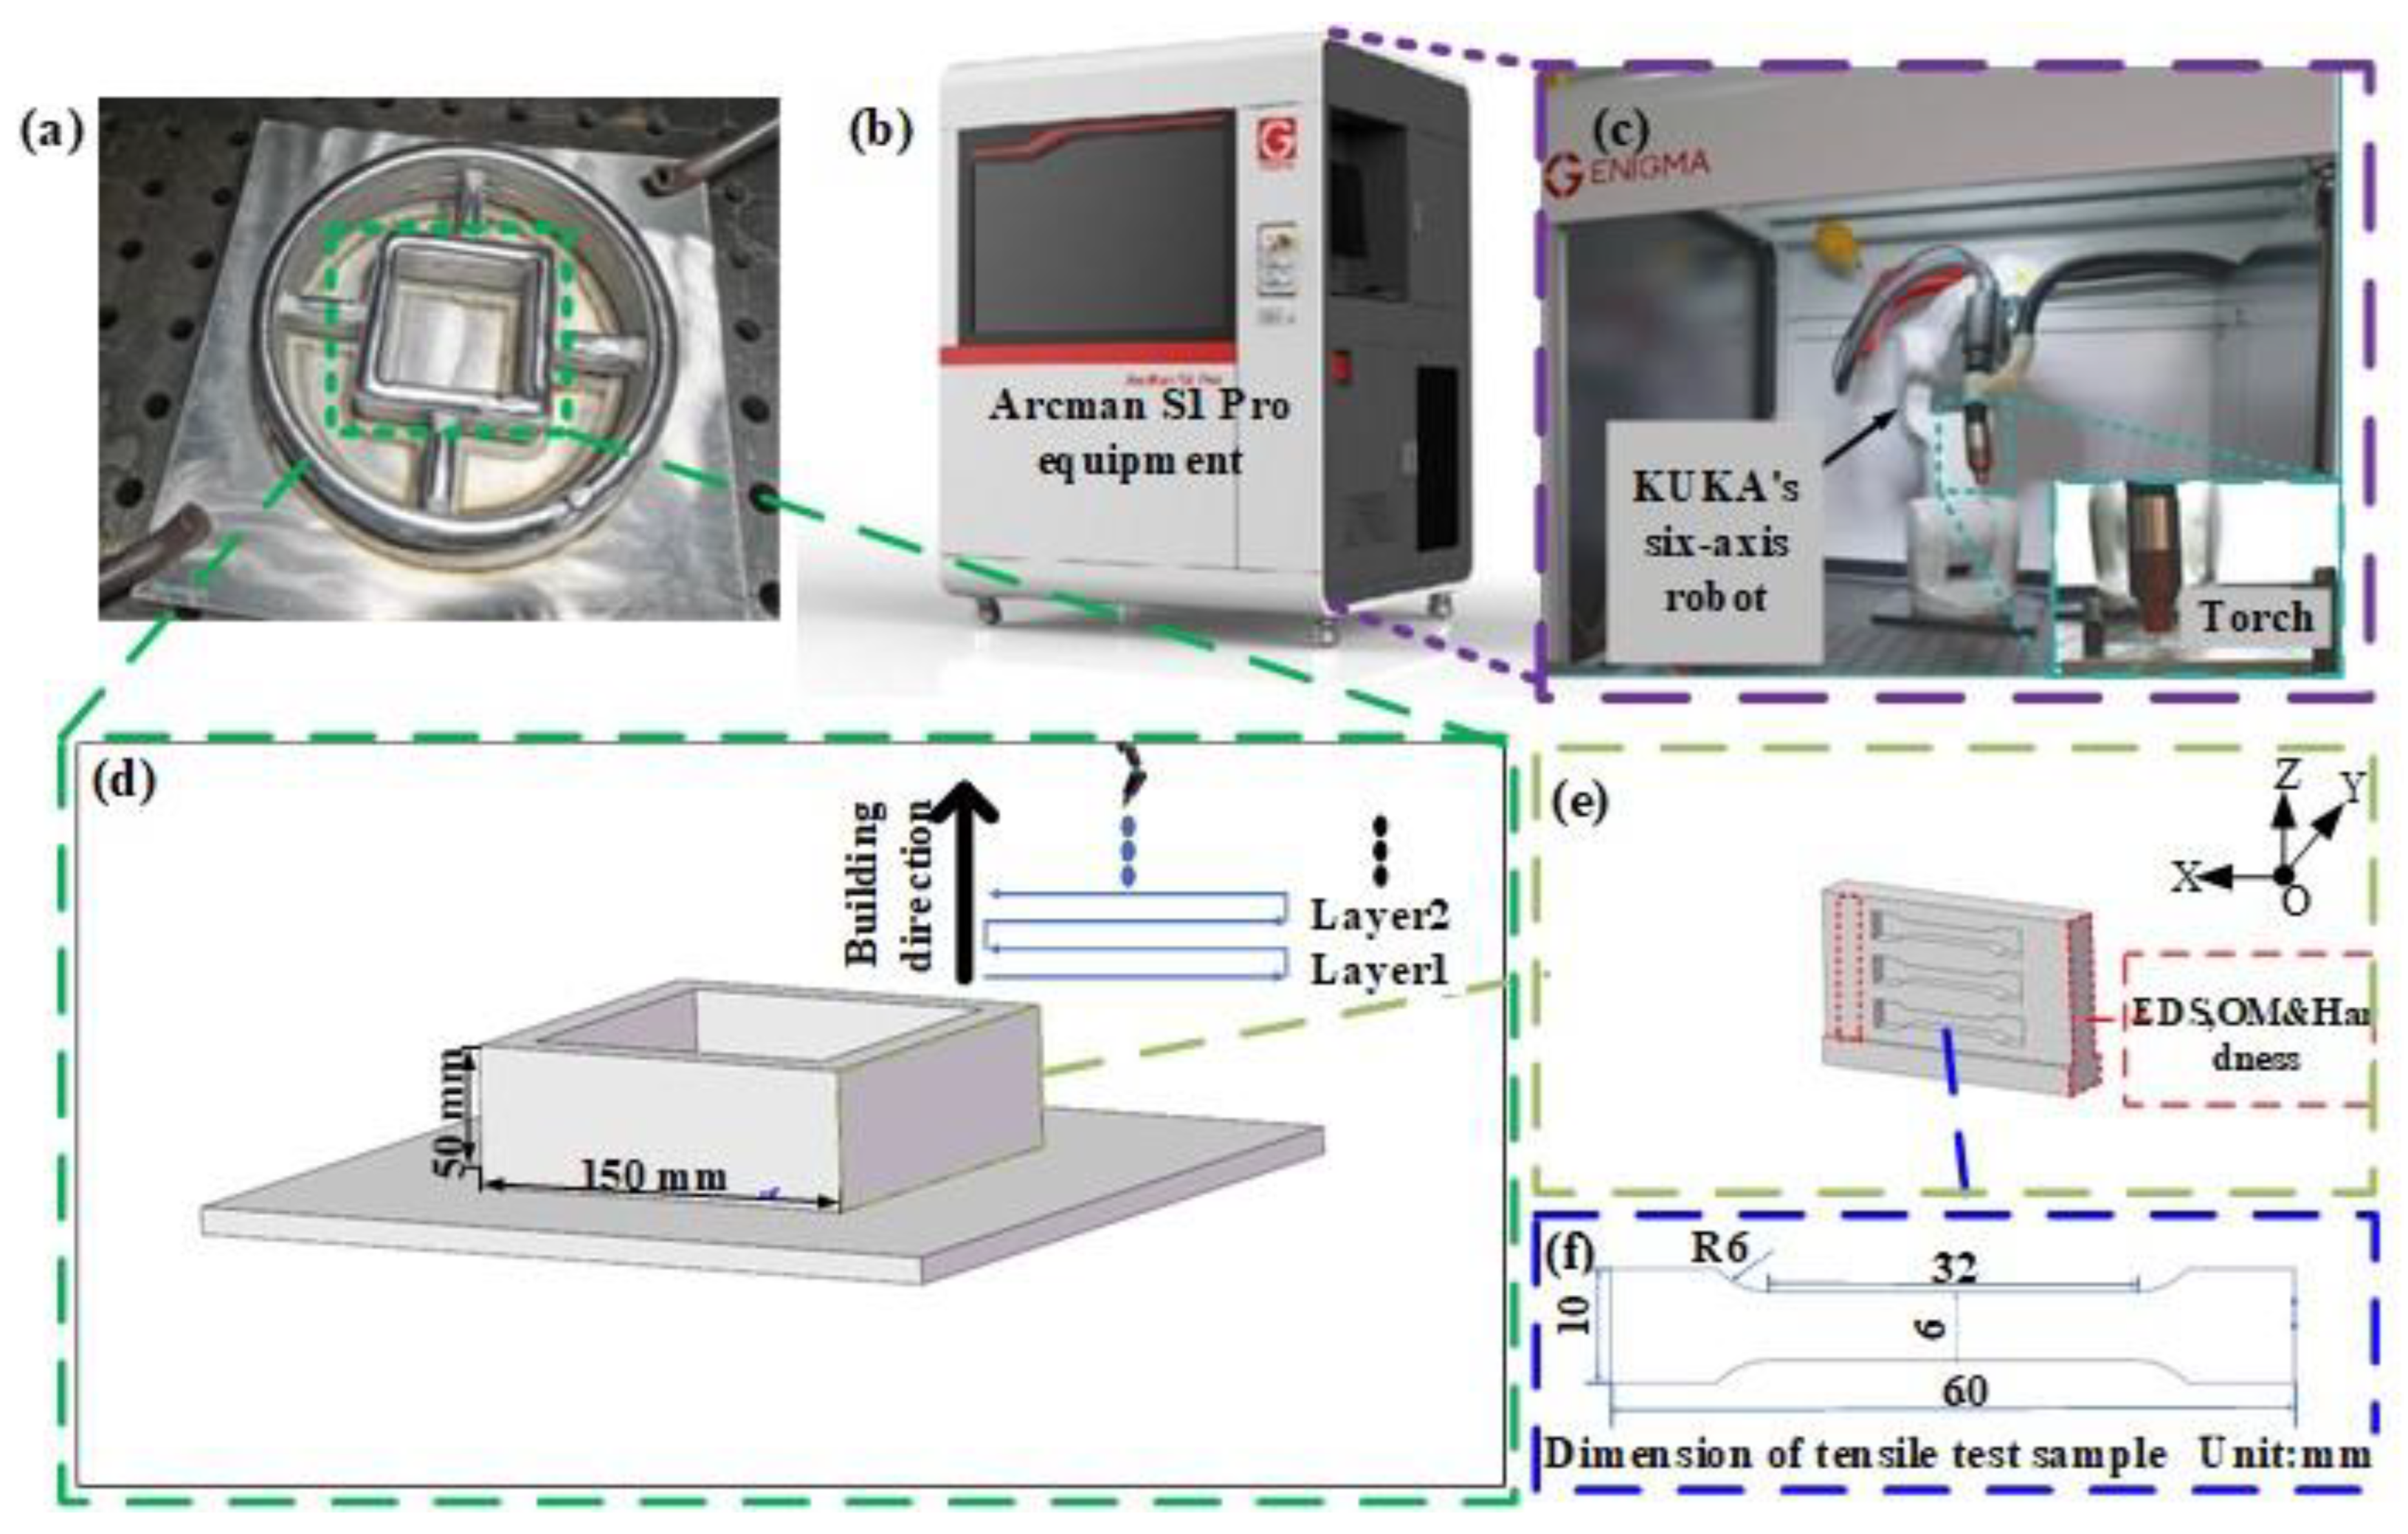
2. Experimental Materials and Methods

Arcman S1 Pro additive equipment (Nanjing Enigma Automation Co., Ltd. Nanjing, China) and its specific physical diagram can be seen in Figure 1, which consists of an integrated workbench, a control computer, a welding machine, and a wire-feeding mechanism. The ABB IRB 1200 demonstrator (ABB Asea Brown Boveri Ltd., Switzerland, Zurich) and KUKA’s six-axis robot (Suzhou Yushengde Intelligent Vision Equipment Co., Ltd., Suzhou, China) were used for welding, and the fused wire power source used for welding was Fronius TPS 5000 CMT (Fronius Welding (Yuhai China), Zhuhai, China). First, the geometric model was constructed by using Solidworks software (Solidworks2020, system, Tianjin, China) and then putting 300 mm × 300 mm × 20 mm of 6061-T6 aluminum alloy substrate on the WAAM, which specific chemical composition is shown in the first row of Table 1. More than 99.99% pure argon (The Linde Group. Tianjin China) and ER4043 wires with a diameter of 1.2 mm were used. The chemical composition of the latter is listed in the second row of Table 1. During the welding process, the workbench was not moved and the welding torch position was continuously changed so that the formed parts with the CCZ and UZ were printed.
The final optimization parameters, i.e., the welding current, welding speed, wire-feeding speed, wire elongation length, arc stopping time, and other experimental parameters, were used, as shown in Table 2, through extensive process pretesting. During the additive manufacturing process, the slicing analysis was first performed using Cura software (Ultimaker Cura S3, Dutch 3D printing company Ultimaker, Dutch) and the model was expected to add 33 layers in 150 minutes. The surface of the substrate was cleaned with an angular grinder to remove the oil and water stains on top of the substrate. The dwell time between layers was 1 minute to facilitate cooling of the specimen and observe the welding conditions during the additive manufacturing process. The additive manufacturing process was performed using the CMT+P welding process, where the bottom layer height was 3.975 mm, the layer height was 1.35 mm, the advance arc extinction distance was 0.5 mm, the minimum arc extinction distance was 5 mm, the melt speed was 9 mm, and the starting wire elongation length was 12 mm.
The size and macroscopic morphology of the actual additive manufacturing specimens are shown in Figure 1. The tensile samples and metallographic specimens were cut by using the EDM CNC wire-cutting machine DK7735 (Taizhou Weihai CNC Machine Tool Co., Ltd. Taizhou, China), and the size of the tensile samples was designed according to GB/T 16865-2013, in which the thickness was 6 mm. When cutting metallographic specimens, the specimens were divided into 7 specimens from top to bottom, according to every 5 layers, as shown in Figure 2b. The metallographic specimens were polished after rough grinding with sandpaper and corroded with Keller’s reagent (HF:HCl:HNO3:H2O = 2:3:5:190). The macroscopic morphology of the specimens was observed with a Smart Zoom 5 ultra-deep field microscope (Zeiss Group, Hongkong, China). An optical microscope (Zeiss Group, Hongkong, China) was used to observe the microstructure of the specimens. The EDS line scan, mapping, and fracture observation were carried out using the JSM-7800F thermal field emission scanning electron microscope (Zeiss Group, Hongkong, China). The tensile test was carried out using the UTM6104 10 kN high- and low-temperature electronic universal testing machine (Beijing Era United Technology Co., Ltd. Beijing, China) with a tensile rate of 2 mm/min. The HVS-1000 microhardness tester (Zhengyi Testing Machinery, Yangzhou, China) was used to test the microhardness of the specimens. Before the test, the specimens were polished with sandpaper to improve the accuracy of the results. During the test, the test load was 200 g and the loading time and holding time were 10 s each. The points were dotted every 1 mm, and the average value of 3 points was taken from the substrate along the axis to the top.

3. Results and Discussion

3.1. Comparison of Microstructure between Corner-Constrained and Unconstrained Zones

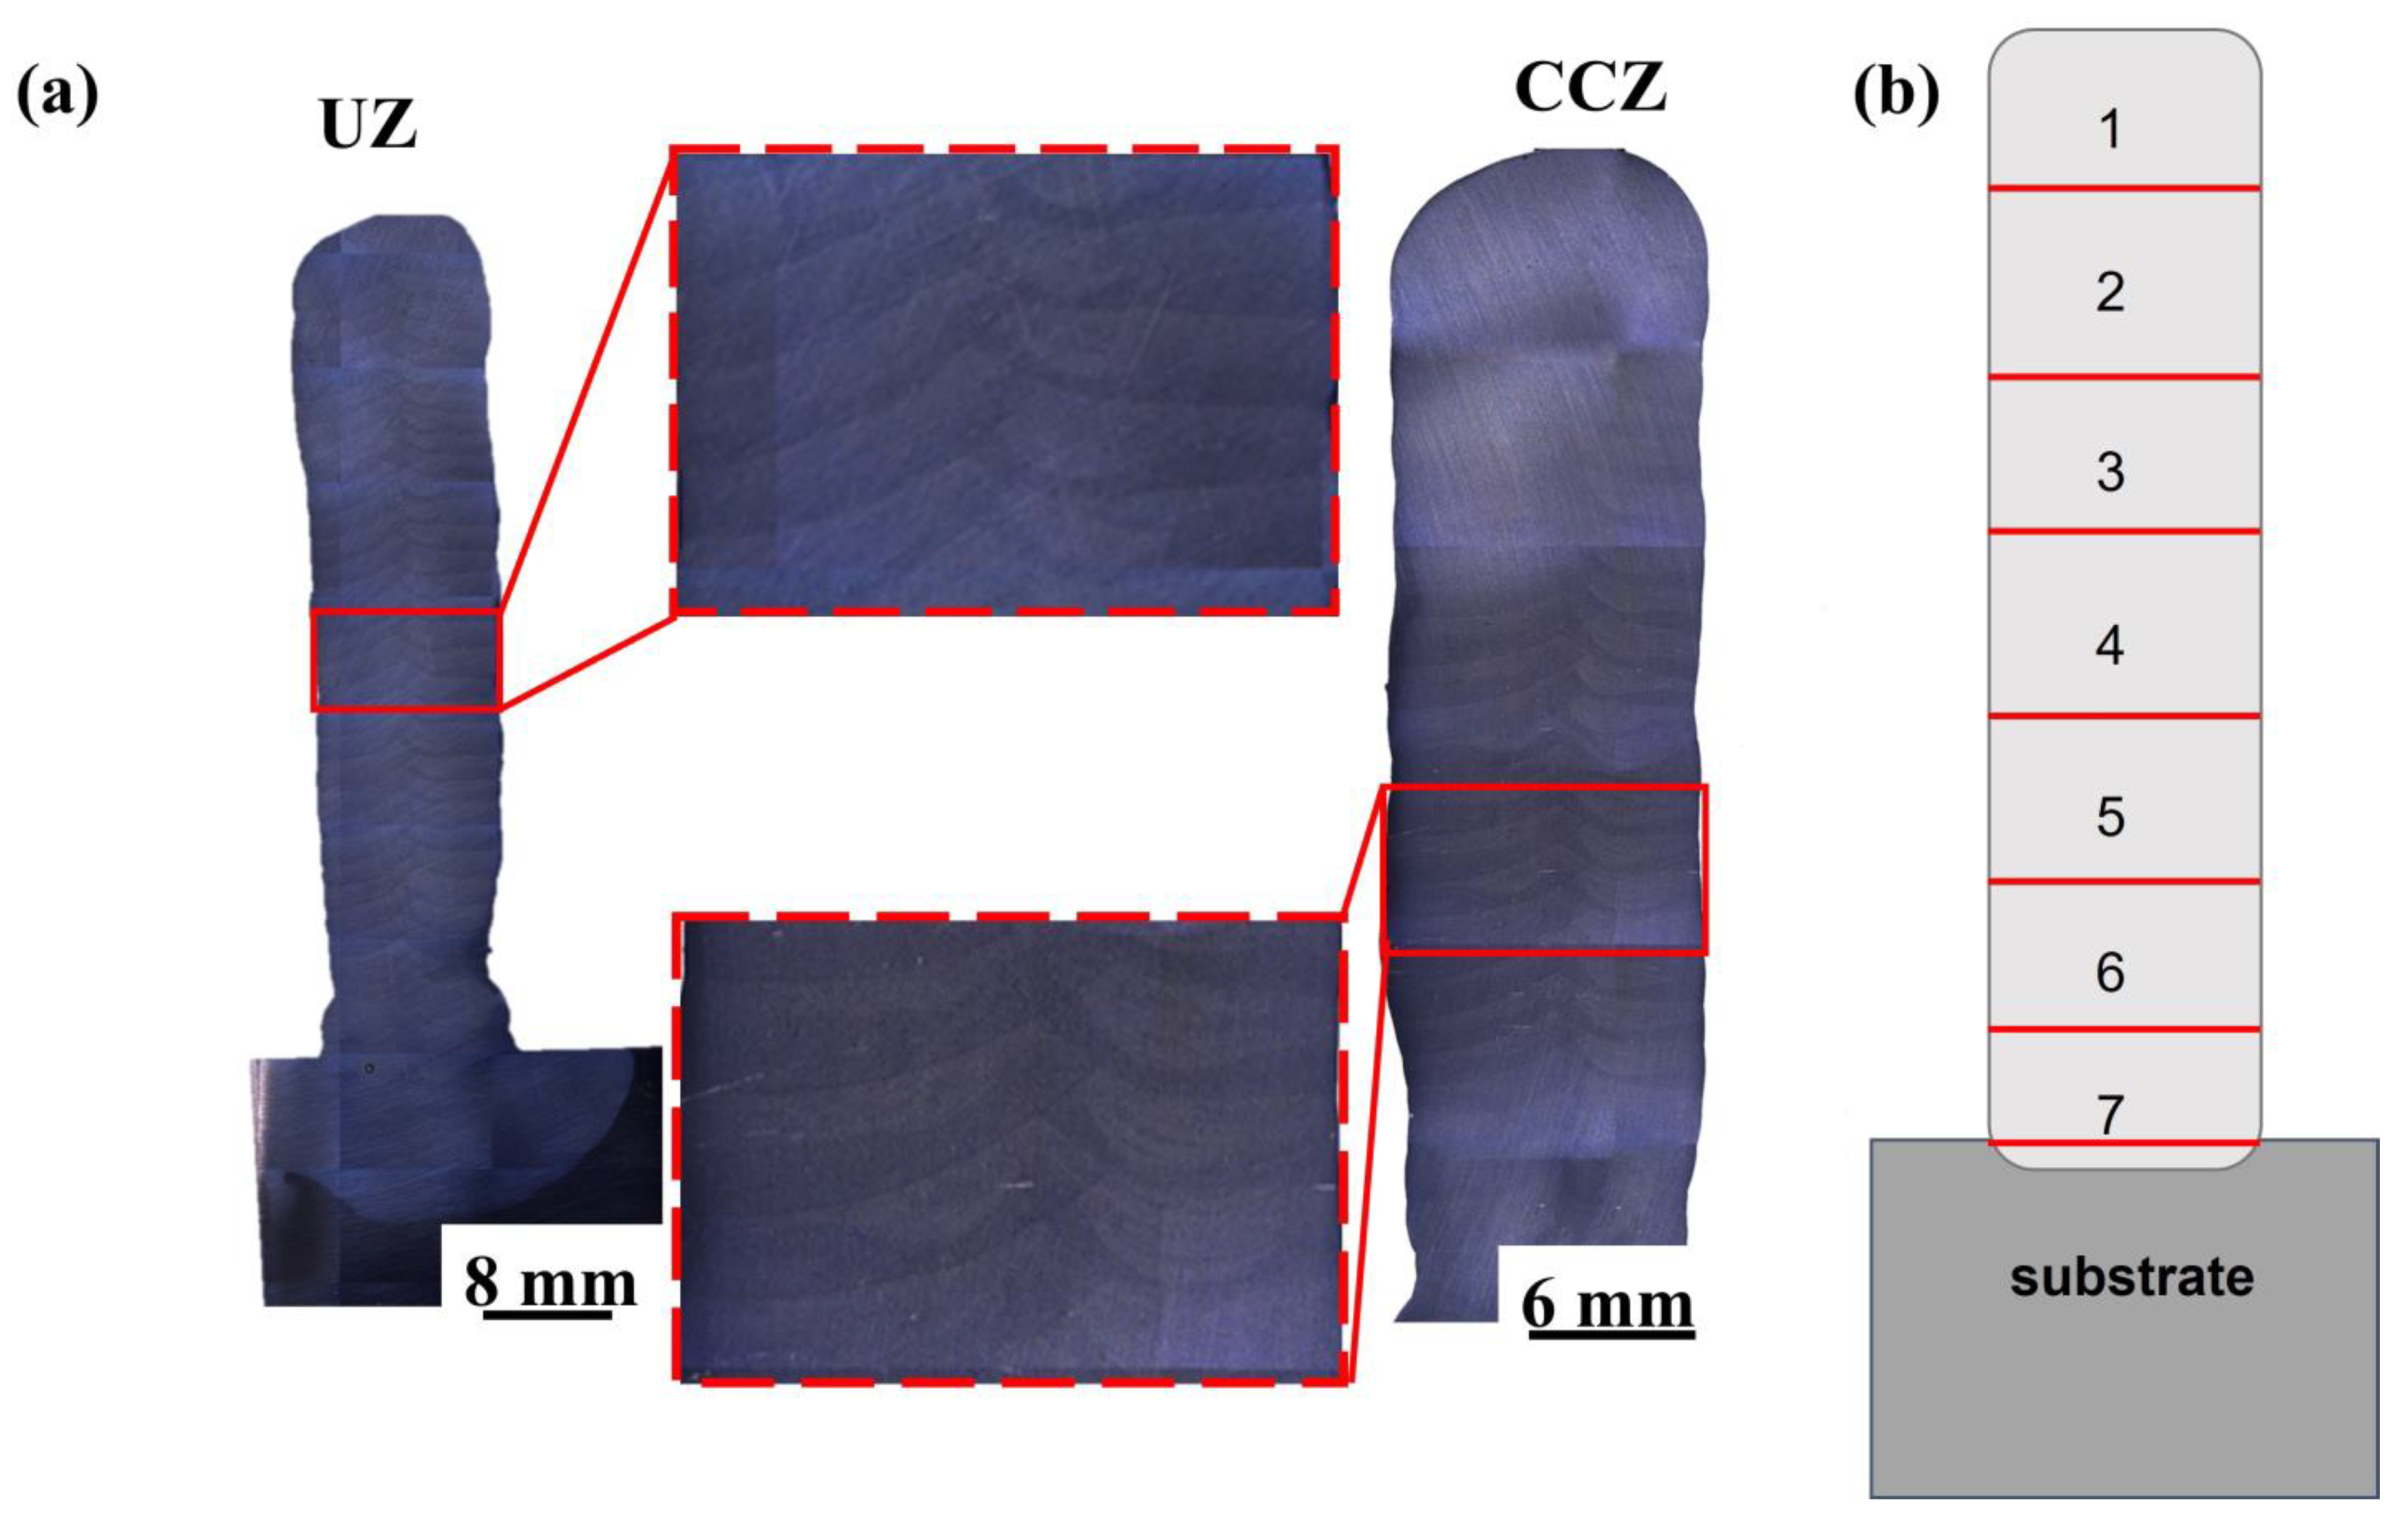
3.1.1. Macro Morphology

As shown in Figure 2a, there were no obvious welding defects, molten pool collapse, flow, and cracking on the whole of the forming parts. We found that the melting effect between layers was good. The phenomenon of middle depression and fluctuation between layers in the deposited layer was caused by the reheating and remelting of each layer in the WAAM process.

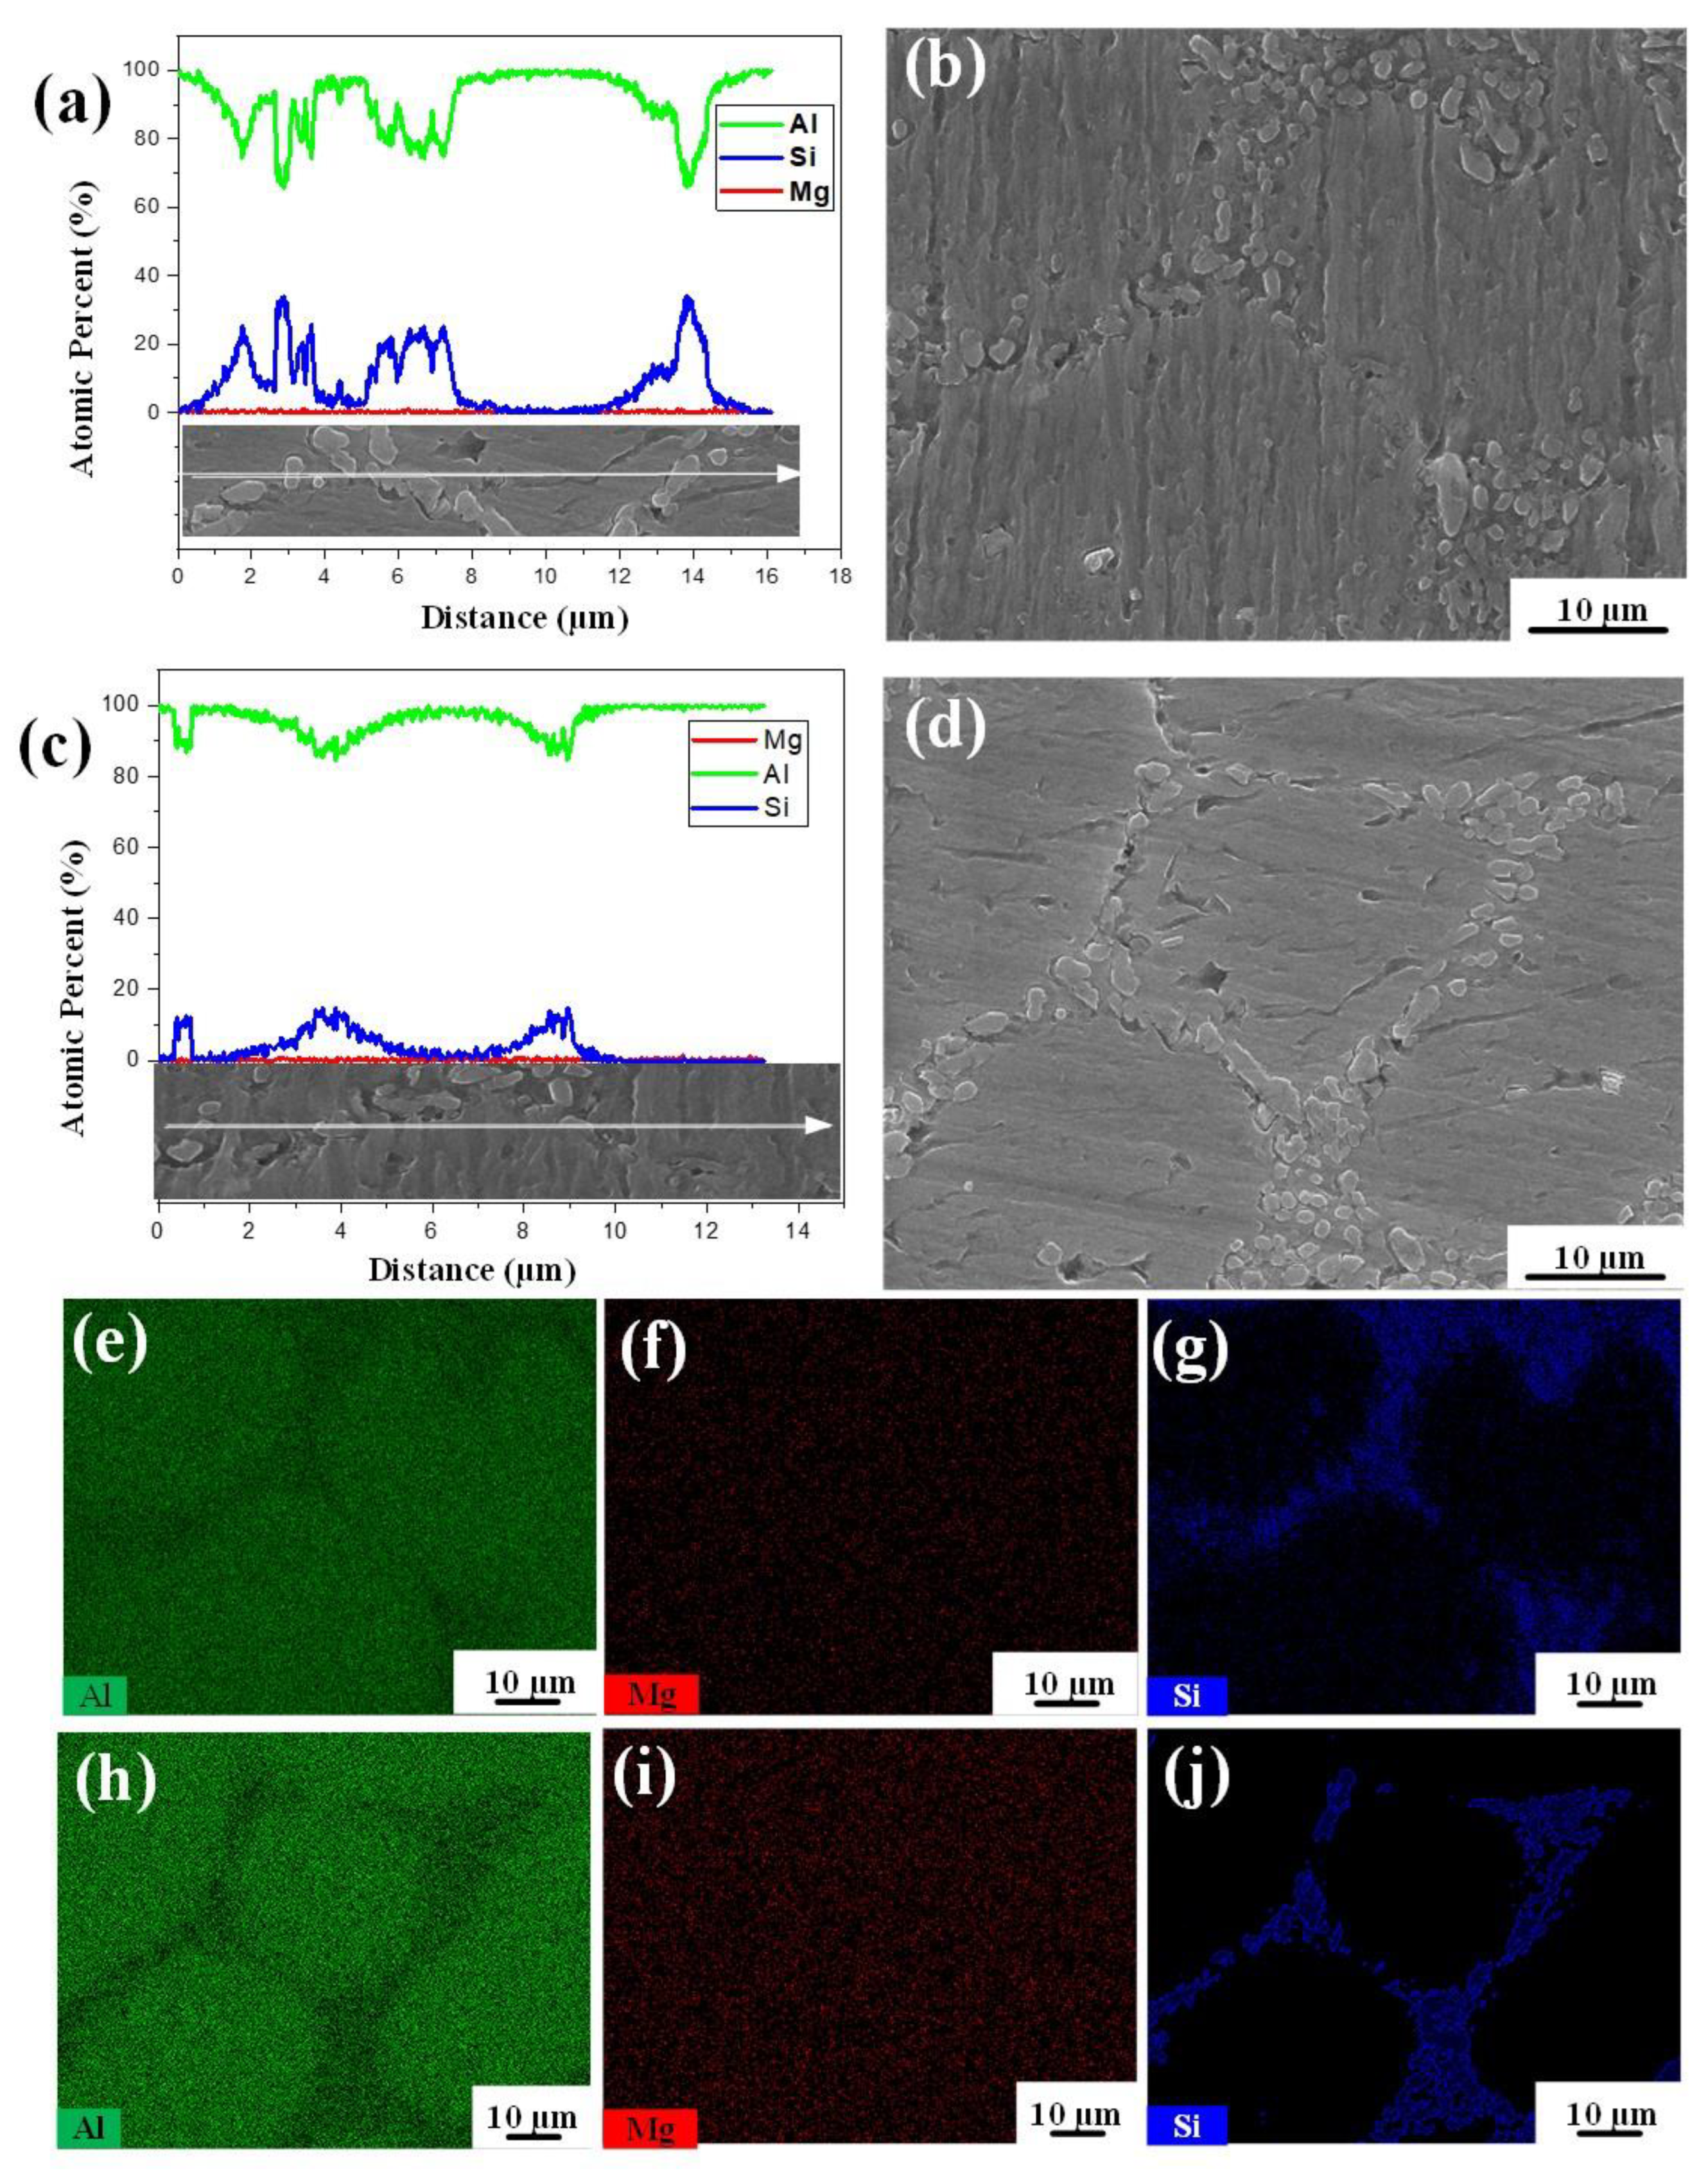
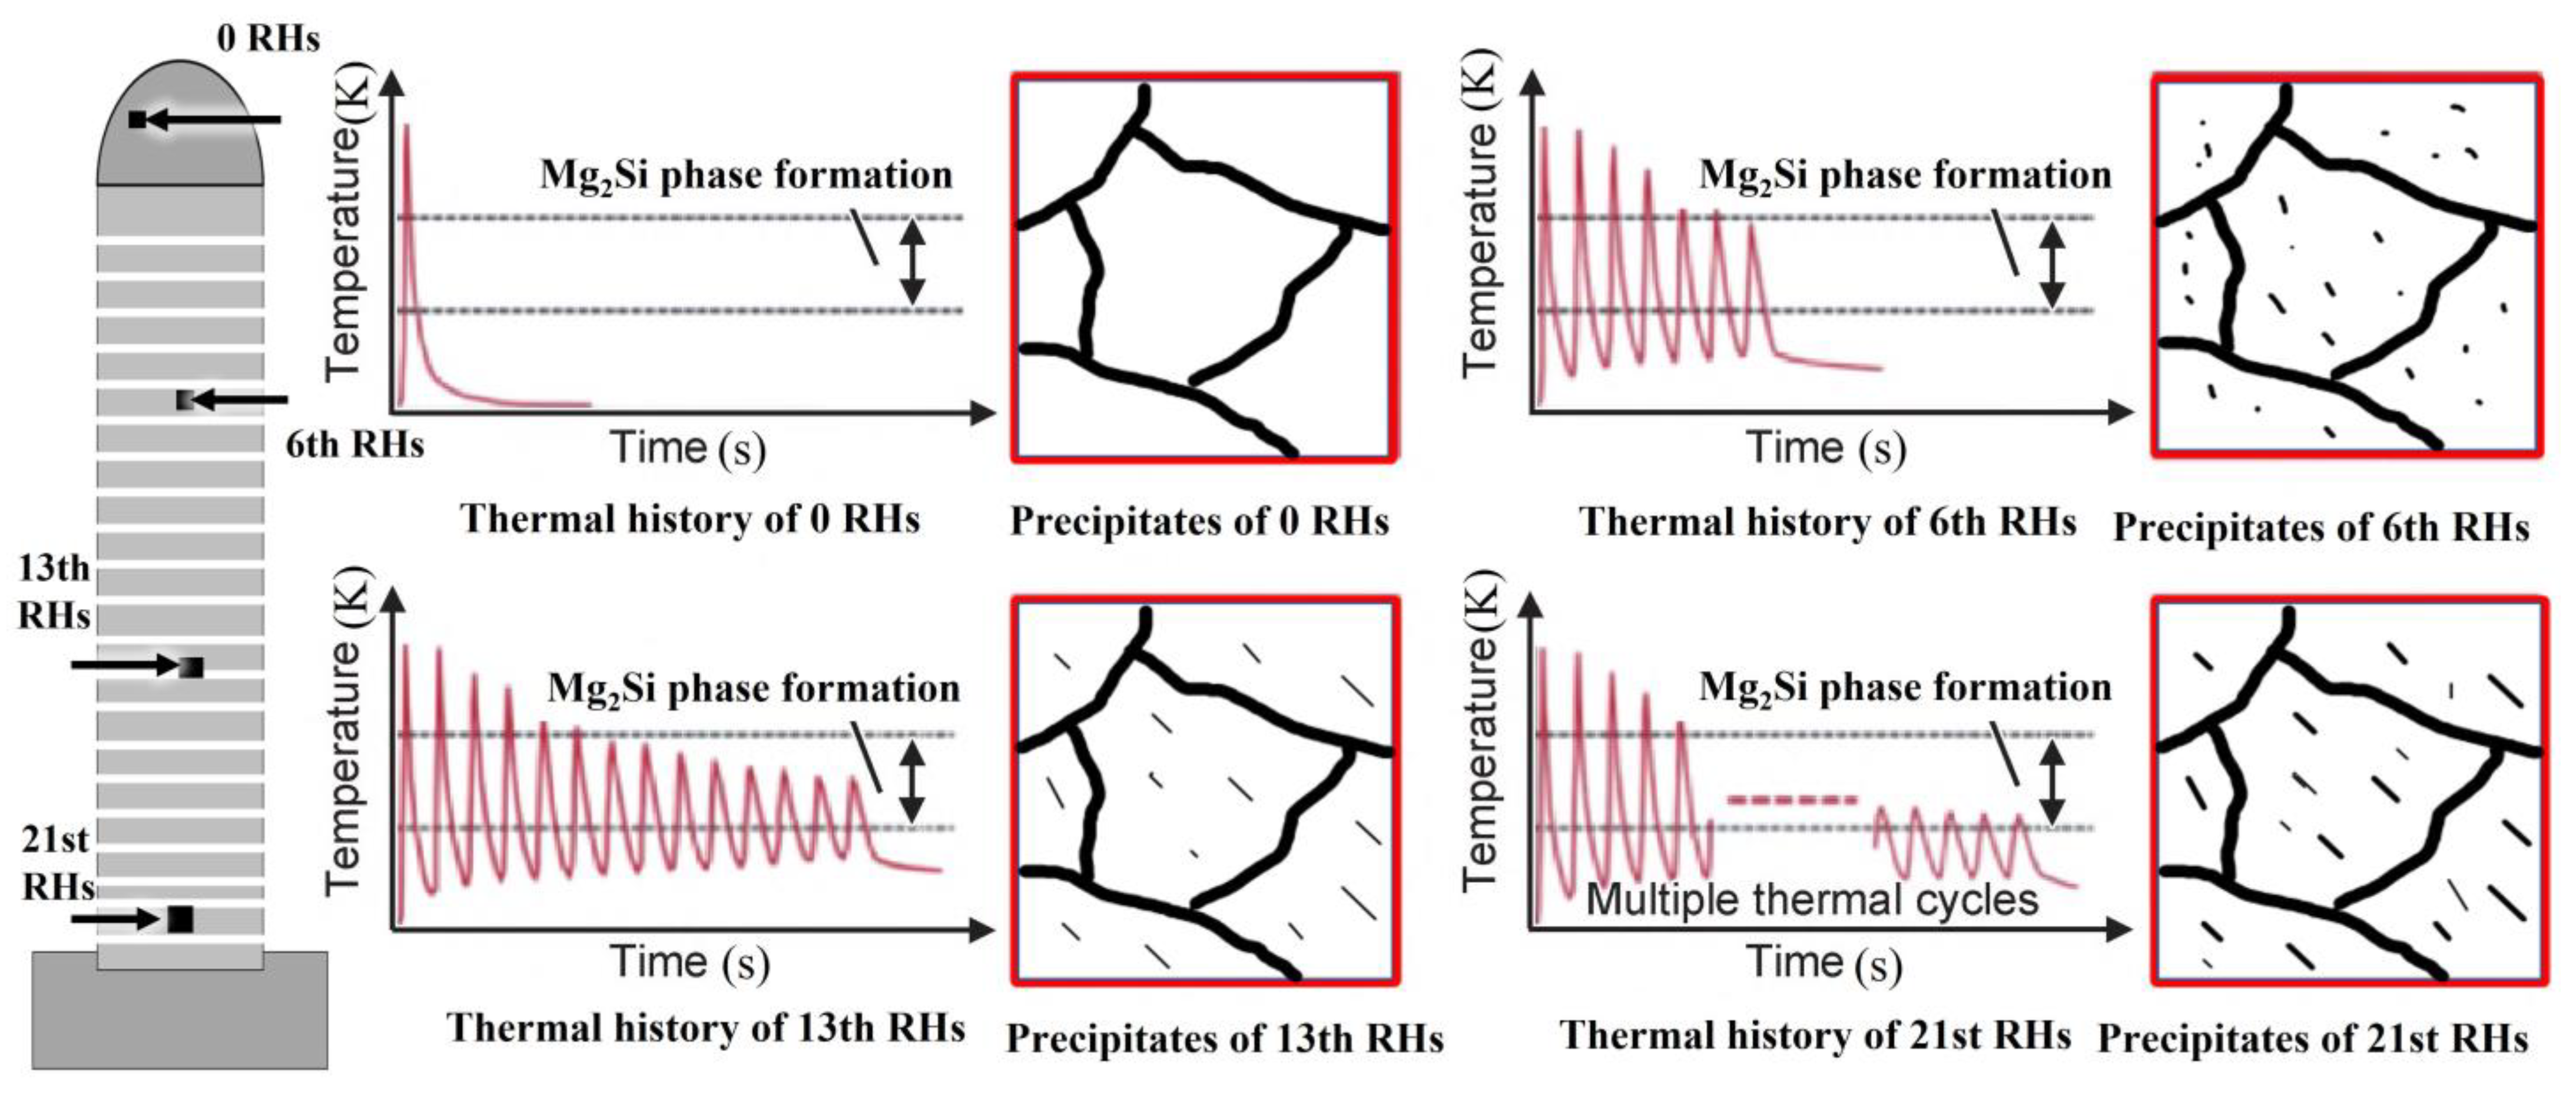
3.1.2. Microstructure

The results showed that there were mostly fine cellular crystals at the top, coarse columnar dendritic crystals in the middle and bottom, and smaller equiaxed crystals in the bottom center. As shown in Figure 3, based on the number of reheating times (RHs), the topmost layer was defined as no RH, (i.e., 0 RH), the second layer meant 1 RH, …, and the 33rd layer had 32 RHs. In the top area of #1, the demarcation line between layers in the additive manufacturing process can be clearly seen. As shown in Figure 3b, the crystals were lentil-like crystals with uniform staggered distribution. This is because the top weld is not affected by other welding thermal cycles. The heat transfer changes from solid-to-solid conduction to solid-to-air conduction, thus increasing the crystallization rate. At the 5th–9th RHs, the crystals were mainly α-Al and Al-Si eutectic structures. During crystallization, the crystals’ growth tends toward lowering the interface energy. Si can reduce the interface energy of Al [18], so Si is enriched at the crystal boundaries during crystallization. The detailed results are shown in Figure 4. Based on the phase diagram of Al–Si binary alloy, the composition moves toward the non-metallic side and tends toward the formation of Al–Si eutectic and sub-eutectic structures, and these low-melting-point eutectic structures are prone to liquefied crystal boundaries during high-temperature welding [19].
At the 10th–14th RHs, the crystal size was large. The crystal growth direction was disordered and at an angle to the additive direction. Meanwhile, the maximum temperature gradient was also the direction of additive manufacturing, which is in line with the crystal growth direction along the temperature gradient and the interface temperature theory [20]. Due to the movement of the welding heat source in this region, the internal thermal range changes and the maximum temperature gradient is inconsistent with the crystal growth direction. In addition, the coarse-grain and fine-grain zones were clearly observed in the CCZ, which is due to more heat accumulated in the unit volume and less heat dissipation in the CCZ during the welding process. The continuous accumulation of heat makes the crystals continue to grow and slows down the crystallization speed. As the heat source of the CCZ is more concentrated, the crystals in this region continue to remelt and engulf each other, making the crystal size larger. The heat dissipation rate of the side-wall region is faster than that of the central region, and the segregation of Si leads to the nucleation of high-concentration Al first, which leads to an increase in nucleation particles and the acceleration of crystallization [21]. Therefore, fine cellular structures and fine crystal regions are generated in the side wall.
At the 20nd–32nd RHs, the crystal morphology was mainly columnar dendrite and columnar crystal, which is because when the bottom of the molten pool comes in contact with the substrate, the heat flow is lost to the substrate direction, that is, the direction of the largest temperature gradient. Smaller equiaxed crystals appeared in the central region at the bottom of the UZ due to the high welding current in this region, which increased the fluidity of the molten pool.
The average grain size of the metallographic specimen is shown in Figure 3. With the increase in the number of RHs, the grain size of α-Al increased—the average grain size increased by about 10% for every 5-time increase in RHs. The reason is that the increase in RHs leads to an increase in the welding heat input, which results in continuous growth of the grain and thus a continuous increase in the grain size. The average grain size in the CCZ was larger than that in the UZ; the average grain size increased by about 88.34%. The reason is that the cooling and solidification speed of the CCZ is slow, and the heat is easy to accumulate here, thus making the grain size larger.
In contrast to the UZ, the CCZ had more liquefied grain boundaries, which can easily induce liquefaction cracks. The grain size in the CCZ was large and coarse, and fine grain zones were clearly distinguished. In addition, the overall crystal growth direction was chaotic and disorderly, which formed a significant contrast with the crystal in-growth along the additive manufacturing direction at the bottom of the UZ. There were no equiaxed crystals in the bottom center of the CCZ, and most of them were columnar crystals.

3.1.3. Distribution of Alloying Elements

The EDS line scan results for different regions are shown in Figure 4. The main elements, Al, Si, and Mg, were scanned, and we found that the distribution of elements in the UZ was different from that in the CCZ, where the distribution of each element was slightly different. The Mg content did not change much, because the content of this element was too small and mostly attached to the Al element. The Si content in the CCZ was between 5% and 10%, and the Si content in the UZ region changed more, between 5% and 30%. The Al content did not vary much inside the grain—the content was above 90%, while it decreased significantly at the grain boundaries—and the element Si was exactly the opposite. Mapping of the CCZ region using SEM and EDS and observation of its comparative chemical composition are shown in Figure 4. The grain was irregular in shape and about 25 µm in size. The interior of the grain was Al; Mg was attached to Al, and a small amount existed at the grain boundary. The second phase of Mg2Si appeared inside the grain boundary, and Si was mainly biased toward the grain boundary, forming an Al–Si eutectic structure. The reason for formation is given in the microstructure analysis in Section 3.1.2 of this study. Compared to the CCZ, the UZ had mainly equiaxed grains with a smaller size and the chemical composition did not change significantly, which is not further discussed here.
Multiple in situ heat treatments occurred at both the CCZ and the UZ [22], that is, in the additive manufacturing process, the underlying aluminum alloy was constantly affected by cyclic heating, cooling, solidification, and remelting. Due to the low phase transition temperature of 4043 aluminum alloy, it easily underwent solid-phase transition at high temperature, which had a great influence on its microstructure. The mechanism diagram of 4043 aluminum alloy forming the second-phase organization is shown in Figure 5, which is mainly the precipitation of Mg2Si, a strengthening phase. There was no RH at the top, and no precipitated phase was produced. However, with the increase in RHs, Mg2Si was easier to nucleate and grow because Mg2Si was more soluble in the matrix. With the decrease in temperature, the solubility happened to decrease significantly. With the rising of the heat source, the peak temperature of subsequent RHs lowered, caused by the high thermal conductivity of aluminum alloy and the increase in the forming height. This resulted in the peak temperature being lower than the precipitation temperature of Mg2Si, which made Mg2Si stop growing and reach a stable size.

3.2. Comparison of Mechanical Properties between Corner-Constrained and Unconstrained Zones

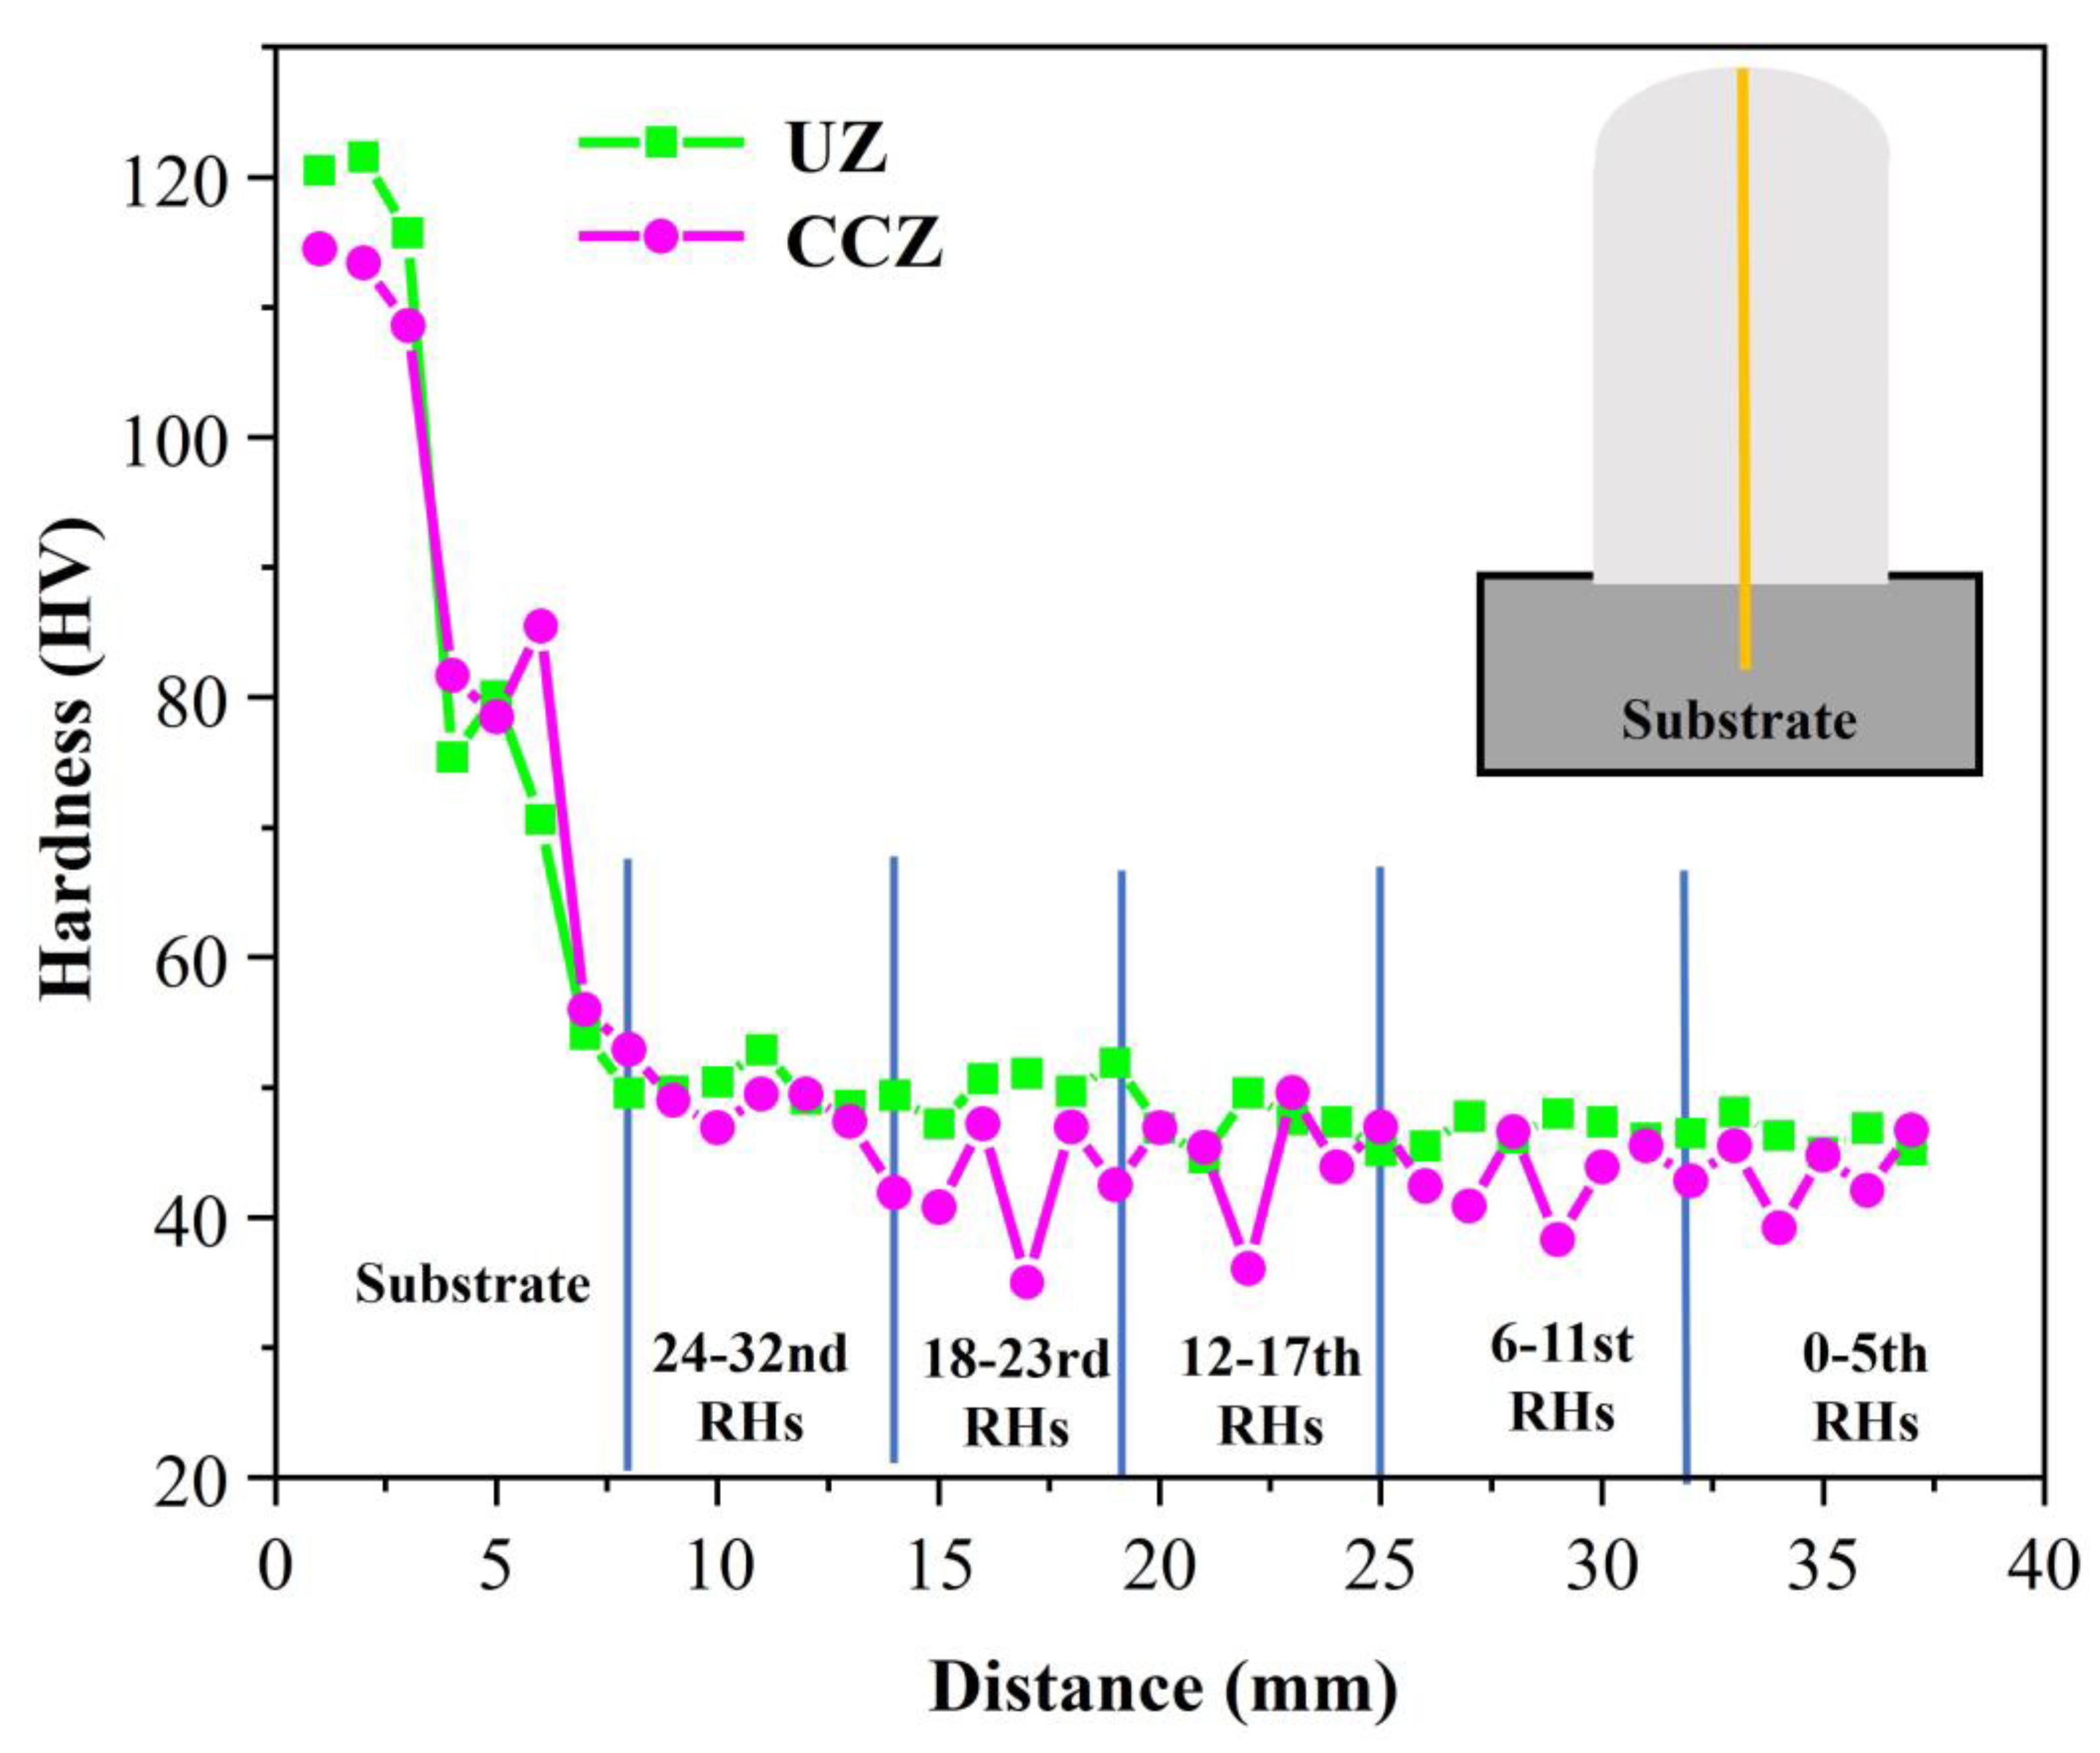
3.2.1. Microhardness
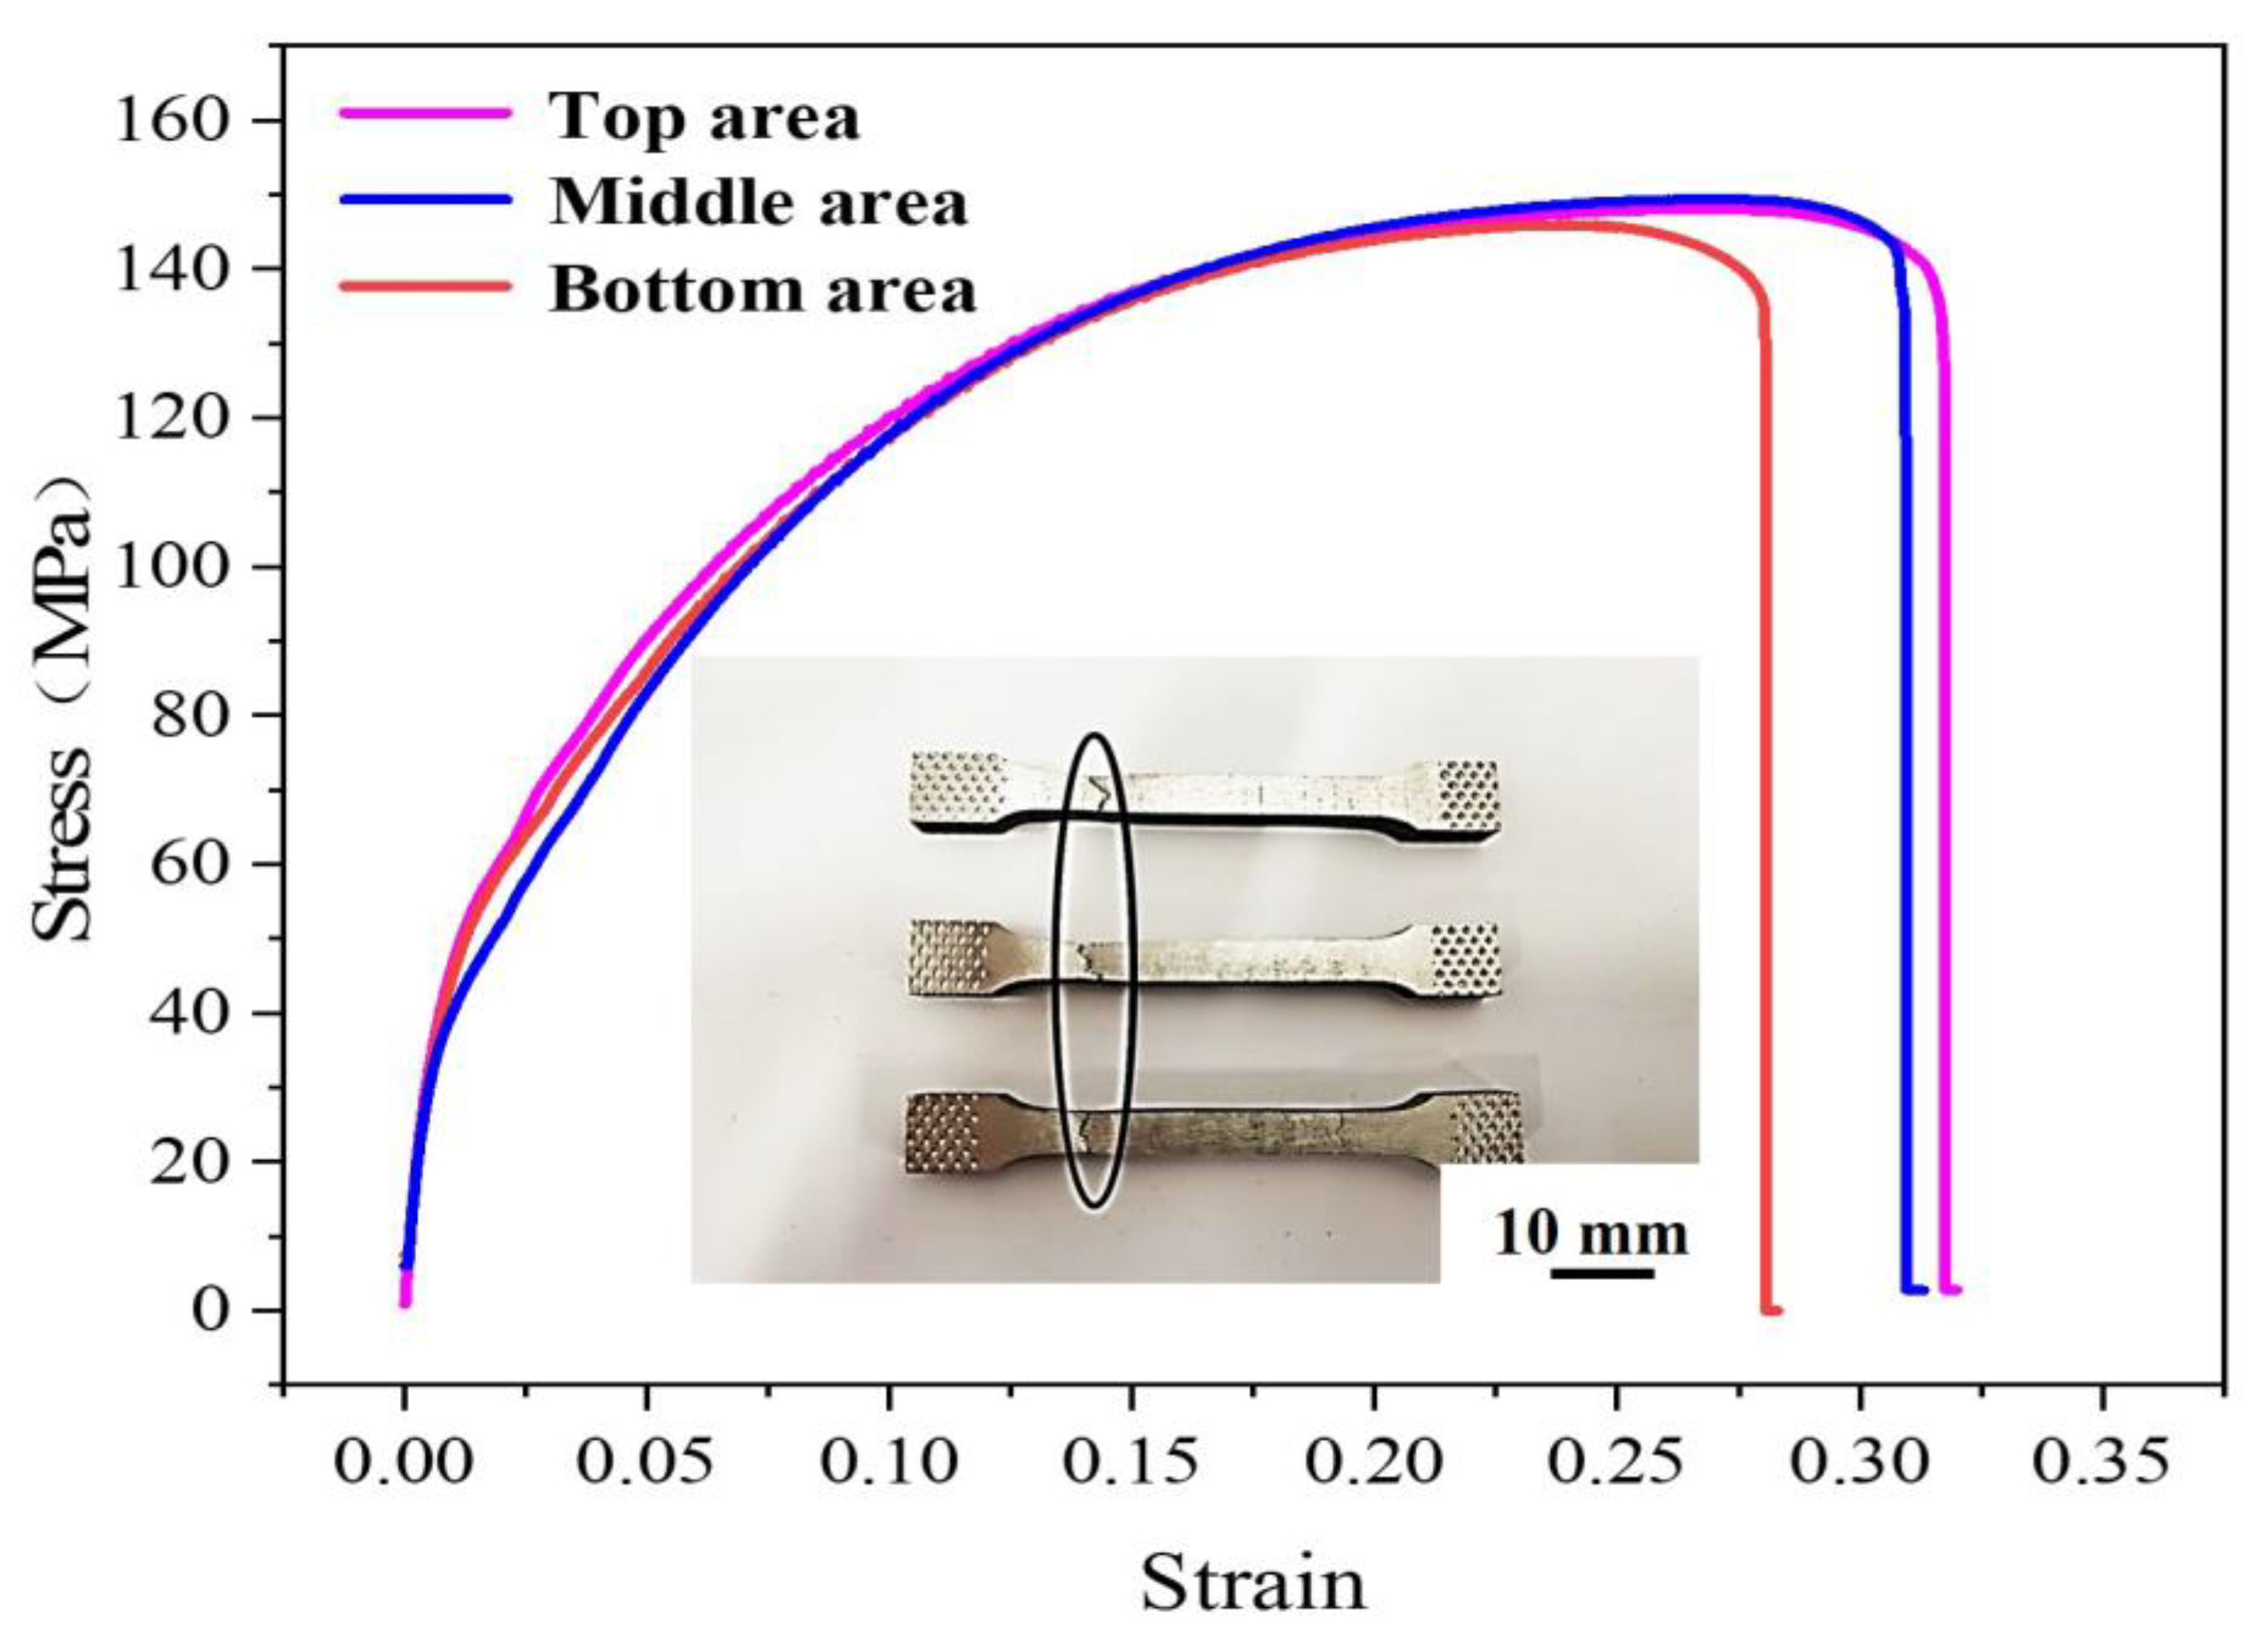
As shown in Figure 6, the test results showed that the hardness of the substrate area was larger, about 120 HV, while the hardness of the UZ was 50 HV and the hardness of the CCZ was 45 HV. In the production process of the 6061-T6 substrate, after solution-strengthening and artificial aging treatment, 4043 aluminum alloy was mainly an α-Al matrix, while the Si element was enriched, and it was easy to form an Al–Si eutectic structure; the hardness of this area was about 50 HV.
Compared with the hardness of UZ, we found that the hardness of the CCZ was about 5 HV lower than the hardness of the UZ. However, the effect was not conspicuous because the heat accumulation in the CCZ was too high, resulting in a certain brittle phase and the existence of a small number of defects. In addition, the hardness curve of the CCZ greatly fluctuated and the microhardness in a specific area was low, which was related to the defects in this area. Combined with the microstructure, it can be concluded that both the appearance of the liquefied grain boundary in this area and the uneven microstructure reduce the hardness.
The overall hardness curve of the UZ did not fluctuate much and showed almost a constant hardness profile, which supports the isotropic hardness of the specimens fabricated by the CMT+P process in a direction parallel to the deposition. The hardness of the UZ was about 50 HV, which is similar to the actual hardness of 4043 aluminum alloy [23] and higher than that of 4043 aluminum alloy fabricated using variable polarity gas tungsten arc welding (VP-GTAW) [24], indicating that the hardness of the formed parts produced by an additive under this process condition can meet the requirements of normal cast aluminum alloy formed parts.

3.2.2. Tensile Test

The engineering stress–strain curve of the tensile samples is shown in Figure 7. The fracture locations of the tensile parts in different areas were the same. The tensile results are shown in Table 3. The tensile strength and elongation after break were different for different sampling areas, with an overall tensile strength of about 148 MPa and elongation of about 31%. The tensile strength and elongation were the highest in the top area, followed by the middle area, and the worst in the bottom area.
As shown in Figure 3, the grain size decreased in the direction of additive manufacturing, so the tensile strength and elongation increased successively. As the welding process parameters of the middle and top areas were the same, the tensile strength and elongation after the fracture were similar, while the mechanical properties of the bottom area decreased due to the large heat input. However, the maximum difference in tensile strength was 3 MPa and the maximum difference in elongation was 4%, so the formed part can be considered isotropic.

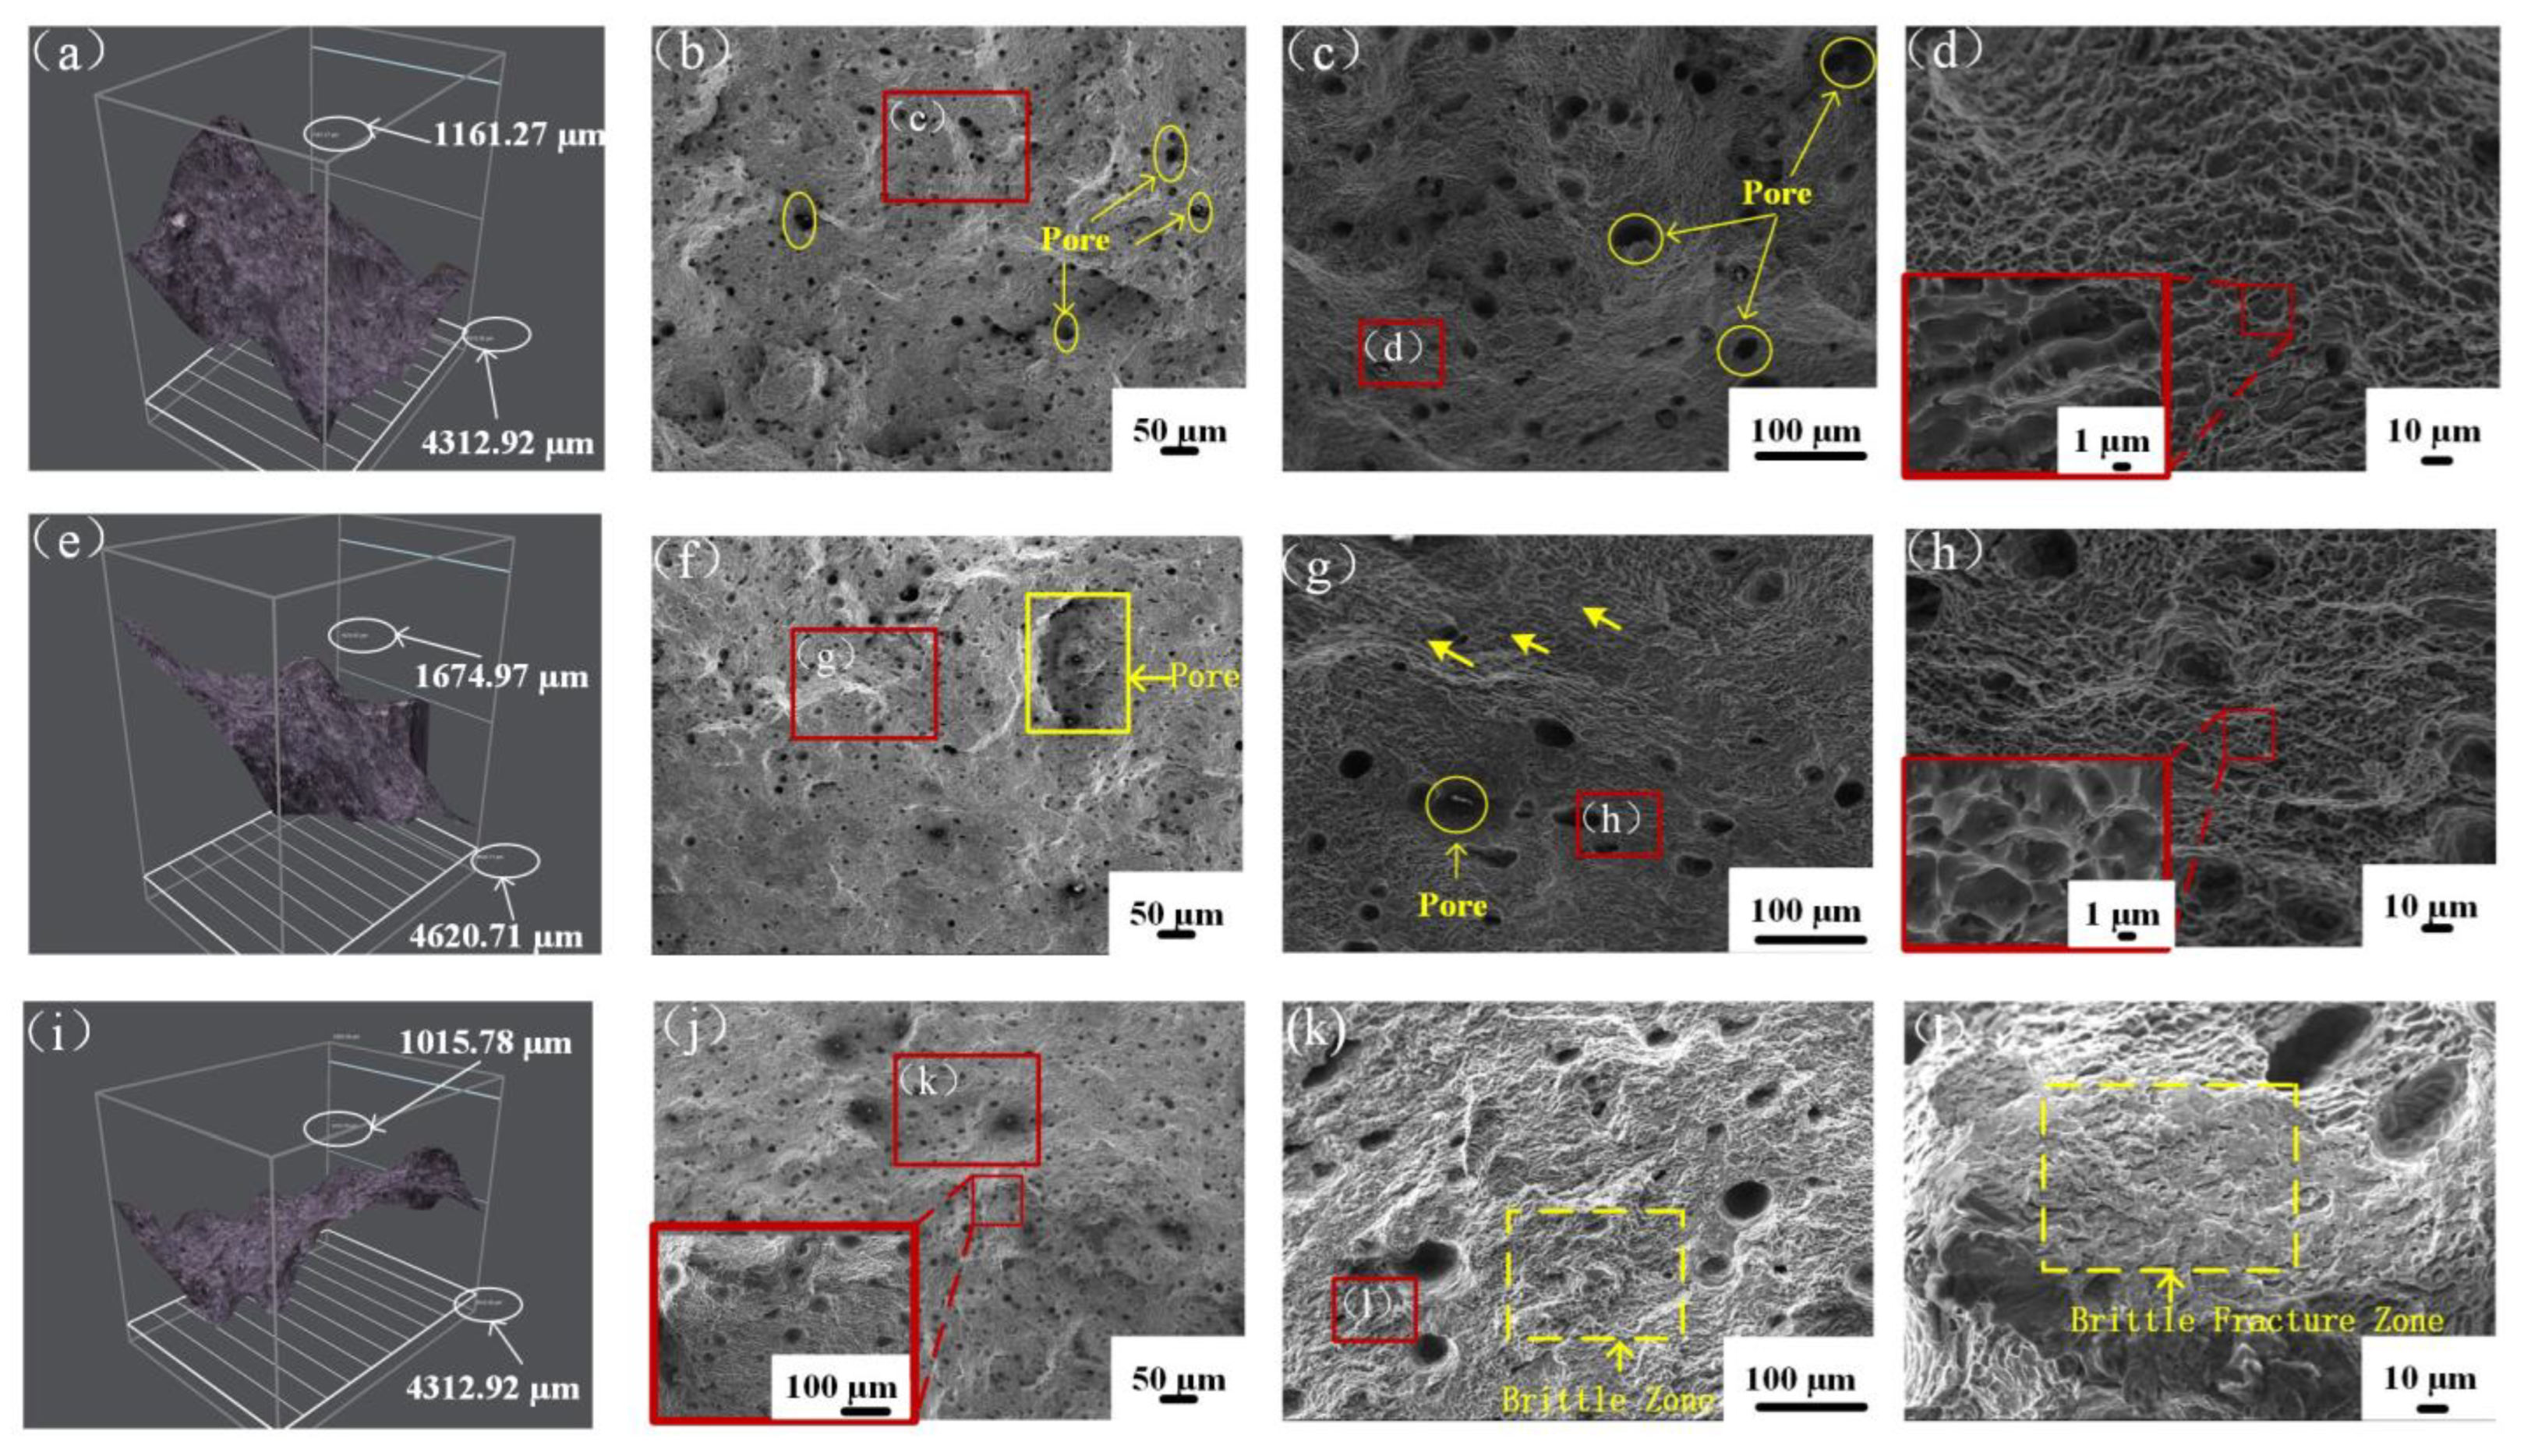
3.2.3. Fracture Analysis

Figure 8 shows the typical 3D and SEM fracture morphology of 4043 aluminum alloy deposited by the CMT+P WAAM process. Among them, the fracture shapes of the top and middle areas were cup and cone shaped, respectively, and the shear area was 45° to the applied tensile stress, while the bottom area was not obvious. Poles were present in all fractures, but there were fewer and smaller-diameter poles in the top area, followed by the middle area, and large and deep poles in the bottom area. As shown in Figure 8c,d, there were many deep dimples, which were typical ductile fractures, consistent with tensile behavior. As shown in Figure 8f, holes existed in the middle area, and interlaminar fracture occurred, as shown by the yellow arrow in Figure 8g. At the same time, there exist dimples in Figure 8h, but they are shallow compared to those in the top area, also typical of a ductile fracture. The presence of a brittle second phase in the bottom area and the large number of dimples and some “river patterns” discovered after magnification indicated that the fracture in the bottom area is a mixed ductile–brittle fracture, consistent with tensile behavior. This is due to the higher number of reheating times in the bottom area and the longer residence time at high temperature, which leads to the precipitation and aggregation of harmful elements and the formation of a large amount of brittle second-phase morphology, resulting in a local brittle fracture. In contrast, the fracture morphology of the upper part of the molded part was more uniform without a local brittle fracture.

4. Conclusions

In this research, the effects of the corner-constrained and unconstrained zones on the microstructure and mechanical properties of 4043 aluminum alloy after CMT+P were compared and analyzed for the first time, and the specific conclusions drawn are listed below. In future work, the effect of the rounded corner transition constraint on WAAM will be studied and the right-angle transition constraint will be extended to other geometric constraints.
  • Using the CMT+P process in this study, we could wire arc additive preparation of 4043 aluminum alloy. The UZ and CCZ do not appear to have melt pool flow, cracking, porosity, inclusions, and other welding defects, resulting in good bonding between the deposited layers.
  • There are fine and uniform α-Al and Al–Si eutectic structures inside the 4043 aluminum alloy, and the Si is biased and concentrated mainly in the grain boundary region. The Si content of the CCZ is between 5% and 10%, and the Si content of the UZ is between 5% and 30%. There are equiaxed crystals in the UZ, while there are no equiaxed crystals in the CCZ. The grain size of α-Al increases with the increase in reheating times (RHs), and the grain size increases by about 10% with each increase of 5 RHs. The grain size in the CCZ is larger than that in the UZ, with an increase of 88.34%.
  • The microhardness of the UZ is 50 HV and that of the CCZ is 45 HV. From the top to the bottom of the formed part, the tensile strength does not change much and the elongation decreases sequentially, with an overall tensile strength of 148 MPa and elongation of 31%. The fracture behavior in the middle and top areas is typical of a ductile fracture, and the fracture in the bottom area is a mixed ductile–brittle fracture dominated by the ductile fracture.

Author Contributions

Conceptualization, Z.L. and J.S.; data curation, J.S., Y.Y. and Y.B.; formal analysis, J.S.; funding acquisition, Z.L. and J.B.; investigation, J.S.; methodology, Y.Z.; project administration, Z.L.; resources, J.B.; software, J.S.; supervision, Z.L.; validation, Y.Z.; visualization, J.S.; writing—original draft, J.S.; writing—review and editing, Y.Y. and Y.B. All authors have read and agreed to the published version of the manuscript.

Funding

This work was supported by the National Natural Science Foundation of China (Nos. 52075378 and U21B2079) and the Natural Science Foundation of Tianjin City (No. 19JCZDJC039000).

Institutional Review Board Statement

Not applicable.

Informed Consent Statement

Not applicable.

Data Availability Statement

Data are contained within the article.

Conflicts of Interest

The authors declare no conflict of interest.

References

  1. Feng, J.; Zhang, H.; He, P. The CMT short-circuiting metal transfer process and its use in thin aluminium sheets welding. Mater. Des. 2009, 30, 1850–1852. [Google Scholar] [CrossRef]
  2. Fayazfar, H.; Salarian, M.; Rogalsky, A.; Sarker, D.; Russo, P.; Paserin, V.; Toyserkani, E. A critical review of powder-based additive manufacturing of ferrous alloys: Process parameters, microstructure and mechanical properties. Mater. Des. 2018, 144, 98–128. [Google Scholar] [CrossRef]
  3. Gebhardt, A.; Hötter, J.-S. Additive Manufacturing: 3D Printing for Prototyping and Manufacturing; Hanser Publications: Cincinnati, OH, USA, 2016. [Google Scholar]
  4. Ding, D.; Pan, Z.; Cuiuri, D.; Li, H. Wire-feed additive manufacturing of metal components: Technologies, developments and future interests. Int. J. Adv. Manuf. Technol. 2015, 81, 465–481. [Google Scholar] [CrossRef]
  5. Rafieazad, M.; Ghaffari, M.; Vahedi Nemani, A.; Nasiri, A. Microstructural evolution and mechanical properties of a low-carbon low-alloy steel produced by wire arc additive manufacturing. Int. J. Adv. Manuf. Technol. 2019, 105, 2121–2134. [Google Scholar] [CrossRef]
  6. Xiong, J.; Yin, Z.; Zhang, W. Forming appearance control of arc striking and extinguishing area in multi-layer single-pass GMAW-based additive manufacturing. Int. J. Adv. Manuf. Technol. 2016, 87, 579–586. [Google Scholar] [CrossRef]
  7. Chen, C.; Fan, C.; Cai, X.; Liu, Z.; Lin, S.; Yang, C. Arc characteristics and weld appearance in pulsed ultrasonic assisted GTAW process. Results Phys. 2019, 15, 102692. [Google Scholar] [CrossRef]
  8. Aldalur, E.; Suárez, A.; Veiga, F. Metal transfer modes for Wire Arc Additive Manufacturing Al-Mg alloys: Influence of heat input in microstructure and porosity. J. Mater. Process. Technol. 2021, 297, 117271. [Google Scholar] [CrossRef]
  9. Cong, B.; Ding, J.; Williams, S. Effect of arc mode in cold metal transfer process on porosity of additively manufactured Al-6.3%Cu alloy. Int. J. Adv. Manuf. Technol. 2014, 76, 1593–1606. [Google Scholar] [CrossRef]
  10. Shu, F.-Y.; Lü, Y.-H.; Liu, Y.-X.; Xu, F.-J.; Sun, Z.; He, P.; Xu, B.-S. FEM modeling of softened base metal in narrow-gap joint by CMT+P MIX welding procedure. Trans. Nonferrous Met. Soc. China 2014, 24, 1830–1835. [Google Scholar] [CrossRef]
  11. Zhang, C.; Li, Y.; Gao, M.; Zeng, X. Wire arc additive manufacturing of Al-6Mg alloy using variable polarity cold metal transfer arc as power source. Mater. Sci. Eng. A 2018, 711, 415–423. [Google Scholar] [CrossRef]
  12. Wu, W.; Xue, J.; Zhang, Z.; Ren, X.; Xie, B. Process Optimization on Multilayer Morphology During 316L Double-wire CMT+P Deposition Process. Metals 2019, 9, 1334. [Google Scholar] [CrossRef]
  13. Ogino, Y.; Asai, S.; Hirata, Y. Numerical simulation of WAAM process by a GMAW weld pool model. Weld. World 2018, 62, 393–401. [Google Scholar] [CrossRef]
  14. Srivastava, S.; Garg, R.K.; Sharma, V.S.; Sachdeva, A. Measurement and Mitigation of Residual Stress in Wire-Arc Additive Manufacturing: A Review of Macro-Scale Continuum Modelling Approach. Arch. Comput. Methods Eng. 2020, 28, 3491–3515. [Google Scholar] [CrossRef]
  15. Sun, J.; Hensel, J.; Köhler, M.; Dilger, K. Residual stress in wire and arc additively manufactured aluminum components. J. Manuf. Process. 2021, 65, 97–111. [Google Scholar] [CrossRef]
  16. Chakraborty, D.; Reddy, B.A.; Choudhury, A.R. Extruder path generation for Curved Layer Fused Deposition Modeling. Comput. Des. 2008, 40, 235–243. [Google Scholar] [CrossRef]
  17. Geng, H.; Li, J.; Xiong, J.; Lin, X.; Zhang, F. Geometric Limitation and Tensile Properties of Wire and Arc Additive Manufacturing 5A06 Aluminum Alloy Parts. J. Mater. Eng. Perform. 2016, 26, 621–629. [Google Scholar] [CrossRef]
  18. Shen, P.; Fujii, H.; Nogi, K. Wettability of R(0112) single crystalline and polycrystalline alpha-Al2O3 substrates by Al-Si alloys over wide composition and temperature ranges. J. Mater. Sci. 2006, 41, 7159–7164. [Google Scholar] [CrossRef]
  19. Huang, C.; Cao, G.; Kou, S. Liquation cracking in partial penetration aluminium welds: Assessing tendencies to liquate, crack and backfill. Sci. Technol. Weld. Join. 2004, 9, 149–157. [Google Scholar] [CrossRef]
  20. Heiberg, G.; Nogita, K.; Dahle, A.; Arnberg, L. Columnar to equiaxed transition of eutectic in hypoeutectic aluminium–silicon alloys. Acta Mater. 2002, 50, 2537–2546. [Google Scholar] [CrossRef]
  21. Liu, Y.; Jin, P.; Wang, J.; Li, J.; Li, C.; Li, Z.; Sun, Q. Microstructure characteristics of 4043 Aluminum alloy with arc additive cold confinement. Aeronautical Manuf. Technol. 2019, 62, 58–62. (In Chinese) [Google Scholar]
  22. Dong, B.; Cai, X.; Lin, S.; Li, X.; Fan, C.; Yang, C.; Sun, H. Wire arc additive manufacturing of Al-Zn-Mg-Cu alloy: Microstructures and mechanical properties. Addit. Manuf. 2020, 36, 101447. [Google Scholar] [CrossRef]
  23. Liu, Z.-Q.; Zhang, P.-L.; Li, S.-W.; Wu, D.; Yu, Z.-S. Wire and arc additive manufacturing of 4043 Al alloy using a cold metal transfer method. Int. J. Miner. Met. Mater. 2020, 27, 783–791. [Google Scholar] [CrossRef]
  24. Wang, H.; Jiang, W.; Ouyang, J.-H.; Kovacevic, R. Rapid prototyping of 4043 Al-alloy parts by VP-GTAW. J. Mater. Process. Technol. 2004, 148, 93–102. [Google Scholar] [CrossRef]
  25. Liu, M.; Ma, G.; Liu, D.; Yu, J.; Niu, F.; Wu, D. Microstructure and mechanical properties of aluminum alloy prepared by laser-arc hybrid additive manufacturing. J. Laser Appl. 2020, 32, 022052. [Google Scholar] [CrossRef]
Figure 1. WAAM process schematic: (a) physical diagram of the formed part; (b) additive manufacturing equipment; (c) picture of the inside of (b); (d,e) EDS, OM, and microhardness sampling diagrams; and (f) dimensions of the tensile test sample.
Metals 12 01423 g001
Figure 2. (a) Sectional view of the forming part and (b) schematic diagram of metallographic sampling.
Metals 12 01423 g002
Figure 3. Microstructure of different regions of the metallographic pattern: (a) CCZ, (b) number 1 region of UZ, (c) average grain size of different regions, (d) number 7 region of UZ, and (e) UZ.
Metals 12 01423 g003
Figure 4. EDS results for different regions: (a) UZ line scan results; (b) UZ SEM image; (c) CCZ line scan results; (d) CCZ SEM image; (eg) Al, Mg, and Si distribution of UZ; and (hj) Al, Mg, and Si distribution of CCZ.
Metals 12 01423 g004
Figure 5. Formation mechanism of the second phase of wire arc additive manufacturing of the 4043-aluminum alloy at different positions.
Metals 12 01423 g005
Figure 6. Microhardness distribution in different regions of a metallographic pattern.
Metals 12 01423 g006
Figure 7. Stress-strain curves of 4043 aluminum alloy formed parts at different heights in the horizontal direction.
Metals 12 01423 g007
Figure 8. Fracture morphology of 4043 aluminum alloy: (ad) top area, (eh) middle area, and (il) bottom area.
Metals 12 01423 g008
Table 1. Chemical composition of 6061-T6 and ER4043 (wt.%).
MaterialsCuSiFeMnMgZnCrTiAl
6061-T60.15–0.40.4–0.8≤0.7≤0.150.8–1.20.25–0.500.04–0.35≤0.15Bal.
ER4043≤0.055≤0.04≤0.05≤0.10≤0.10-≤0.20Bal.
Table 2. Specific process parameters in additive manufacturing.
LayersWire-Feeding Speed
(m/min)
Traveling Speed
(mm/s)
Arc Starting/
Welding
current
Arc Stopping/
Welding
Current
Arc Stopping Time
(s)
Fade Time
(s)
Wire Elongation Length
(mm)
Actual Weld Width
(mm)
189105%70%0.20.31212.5
269105%36%0.40.61212.29
3–84.69105%27%0.20.41211.80
9–124.79105%27%0.20.41212.54
13–334.69105%27%00.41212.46
Table 3. Tensile results of 4043 aluminum alloy formed parts at different heights in the horizontal direction.
Sample LocationTensile Strength (MPa)Elongation (%)
Top area149.4 ± 3.433.0 ± 1.9
Middle area148.1 ± 3.032.0 ± 2.1
Bottom area146.0 ± 4.928.3 ± 3.4
GTAM [25]143.6 ± 2.919.6 ± 1.1
Laser-arc hybrid AM [25]164.4 ± 4.820.8 ± 0.8
Publisher’s Note: MDPI stays neutral with regard to jurisdictional claims in published maps and institutional affiliations.

