Article

Wear and Corrosion Resistance of FeCoCrxNiAl High-Entropy Alloy Coatings Fabricated by Laser Cladding on Q345 Welded Joint

1
College of Materials Science and Technology, Nanjing University of Aeronautics and Astronautics, Nanjing 211106, China
2
Shenzhen Research Institute, Nanjing University of Aeronautics and Astronautics, Shenzhen 51800, China
*
Authors to whom correspondence should be addressed.
Metals 2022, 12(9), 1428; https://doi.org/10.3390/met12091428
Submission received: 17 July 2022 / Revised: 20 August 2022 / Accepted: 23 August 2022 / Published: 29 August 2022

Abstract

:
High-entropy alloy (HEA) coatings on the surface of low-alloy steel by laser cladding can improve the corrosion and wear resistance, and the performance can be further improved by adding the Cr element. However, the effect of Cr content on the microstructure, hardness, wear and corrosion resistance of the coatings on the welded joint has not been completely understood in the literature. This paper aims at revealing the influence of Cr content on the microstructure and properties of laser-cladded FeCoCrxNiAl HEA on different regions of Q345 welded structure. The results indicate that FeCoCrxNiAl HEA coating has good metallurgical bonding with the Q345 welded surface. The increase of Cr element content in the powder plays an important role in energy absorption of powder and substrate, affecting the dilution rate and diffusion of Fe from the substrate to HEA coating. The HEA coating is mainly composed of the face-centered cubic phase (FCC) and body-centered cubic phase (BCC). When x = 1.5, the actual Cr element content of coating is the highest, which promotes the formation of hard brittle phase BCC, and subsequently affects the hardness and wear resistance of the sample. Meanwhile, the corrosion resistance increases and then decreases, and reaches the highest when x = 1.5. Due to the existence of Cr and other elements with good corrosion resistance in the HEA coating, a dense oxide film can be formed in 3.5 wt.% NaCl solution and neutral salt spray environment to prevent the corrosion from continuing, which can effectively improve the corrosion resistance of each region of the welded joint, and the protective efficiencies on the weld bead (WB), heat-affected zone (HAZ) and base metal (BM) are 99.1, 98.4 and 96.6%, respectively.

1. Introduction

Q345 low-alloy steel is widely used in marine field because of its good mechanical properties, weldability and low price. However, corrosion failure in harsh and complex marine environment is a problem that cannot be ignored. Meanwhile, the steel usually needs to be welded to meet the structural requirements. However, due to the uneven microstructure and composition of each region of the welded joint [1], the material is prone to chemical corrosion, resulting in corrosion failure and even equipment scrap. Therefore, it is necessary to study not only the corrosion behavior of the base metal, but also each region of the welded joint in the process of considering the corrosion resistance of the overall structure [2].
High-entropy alloy (HEA), as a promising multi-component alloy, is composed of many main elements and has a high-entropy value, which can promote the formation of simple face-centered cubic, body-centered cubic and nanostructure with high thermal stability. The HEA exhibits superior properties, such as excellent wear resistance, corrosion resistance, thermal stability, strength and hardness, which are attributed to its high-entropy effect, hysteresis diffusion effect and lattice distortion effect [3,4,5]. HEA rapidly attracts massive attention in material science since it was first reported [6,7,8].
Preparation of HEA coating on a steel welded structure is a feasible method to improve surface hardness, wear and corrosion resistance of the steel weld. At present, the technologies to prepare HEA coating including thermal spraying [9,10], laser/plasma cladding [11,12,13,14] and physical vapor deposition [15]. Among the above HEA coatings methods, the laser cladding technique adopts a high-energy density laser beam to heat powder and substrate at the same time, which has the characteristics of environmental protection, high efficiency, reliable metallurgical bonding, high material utilization ratio and excellent performance [16,17,18,19,20], so it is widely used for repairing and strengthening the steel structure [21,22,23]. Exploring the process, microstructure and properties of HEA coating prepared by laser cladding is of practical significance to promote the in-depth study and broaden its application fields.
At present, many scholars have carried out a lot of research on the corrosion behavior of every region of a steel welded joint in different corrosion environments. Chaves et al. [24] compared the corrosion resistance of X56 pipeline steel longitudinal welded joints in a seawater environment, founding that the corrosion resistance of HAZ is the worst. Fan et al. [25] researched the corrosion behavior of low-alloy welded joints in the environment of simulated seawater and revealed the higher cracking susceptibility on the welded joint than the original base material. Han et al. [26] systematically evaluated the corrosion resistance of low-alloy steel weld metal with three different microstructures using electrochemical techniques with the simulated produced water containing CO2 at 90 °C, finding that the corrosion resistance of weld metal with polygonal ferrite microstructure was the best, and the microstructure with acicular ferrite and polygonal ferrite showed the worst corrosion resistance. Above all, serious corrosion occurs in steel welded joint in various environments and the research mainly focuses on the influence of microstructure and welding process on the corrosion resistance of welded joint. Exploring the corrosion behavior and mechanism of a Q345 low-alloy steel welded joint in different regions under marine atmospheric environment is particularly important to carry out the subsequent research on the strengthening and protection of HEA cladding layer in various regions of welded joint.
Many scholars have carried out a lot of research on the corrosion resistance of HEA layer by laser cladding technique. Qiu et al. [27] prepared AlCrFeCuCo coatings by changing scanning speed of laser cladding and investigated the effect on corrosion resistance of layer. Wu et al. [28] prepared FeCoCrAlCuX0.5 coating on the surface of Cu by laser cladding and studied the influence of the addition of Si, Mo and Ti on the corrosion resistance of the coating. Qiu [29] studied the corrosion resistance of Al2CrFeCoxCuNiTi cladding layer in acid solution. Bao et al. [30] prepared FeCrNiCoCuAlx (x = 0, 1, 2, 3) on the surface of Q345 low-alloy steel by laser cladding and studied the effect of Al content on the corrosion resistance. Gu et al. [31] prepared MgMoNbFeTi2Yx (x = 0, 0.4, 0.8, 1.2%) coating on the surface of Q235 low-alloy steel substrate, studying the effect of Y element content on the corrosion resistance and finding that the corrosion resistance was the best when the Y element content was 1.2%.
At present, there have been a lot of research studies on the influence of process parameters and additional elements on the corrosion resistance of HEA cladding layer on the untreated steel substrates. In addition to the complete substrate surface, there are also many weld connection positions in the structural parts, and the as-welded structure has a greater difference than the cast or rolled structure. The corrosion condition in the weld area is weld bead, especially the microstructure near the heat affected zone (HAZ) [32,33], is more serious than that in the substrate. The weld area can also be protected by fabricating protecting coating via the laser cladding process. This requires some research on laser cladding of the as-welded microstructure surface to provide some technical support for this process. Unfortunately, there is little research on the preparation of HEA on the surface of low-alloy steel welding structures. Therefore, it is necessary to study the performance improvement effect of coating on the different regions of the welded joint.
In this paper, MIG plate butt and laser cladding experiments are carried out on the Q345 low-alloy steel welding joint. In other words, the research object is transformed from the traditional as-cast or rolled microstructure of the substrate to the non-uniform microstructure of the welding joint. The hard high entropy phase formed on the weld surface by laser cladding is used to improve the wear resistance of the weld surface. At the same time, by adjusting the powder composition and changing the Cr content in the powder, the corrosion resistance of the substrate and coating in the weld bead area is adjusted. The influence of different Cr content on the microstructure, corrosion resistance and mechanical properties of the cladding layer will be explored systematically, and the effect mechanism of corrosion resistance on the various regions of the welded joint will also be revealed. The research extends the application potential of Q345 steel and high-entropy alloy and lays a foundation for the application of HEA coating to strengthen the welding joint in the marine field.

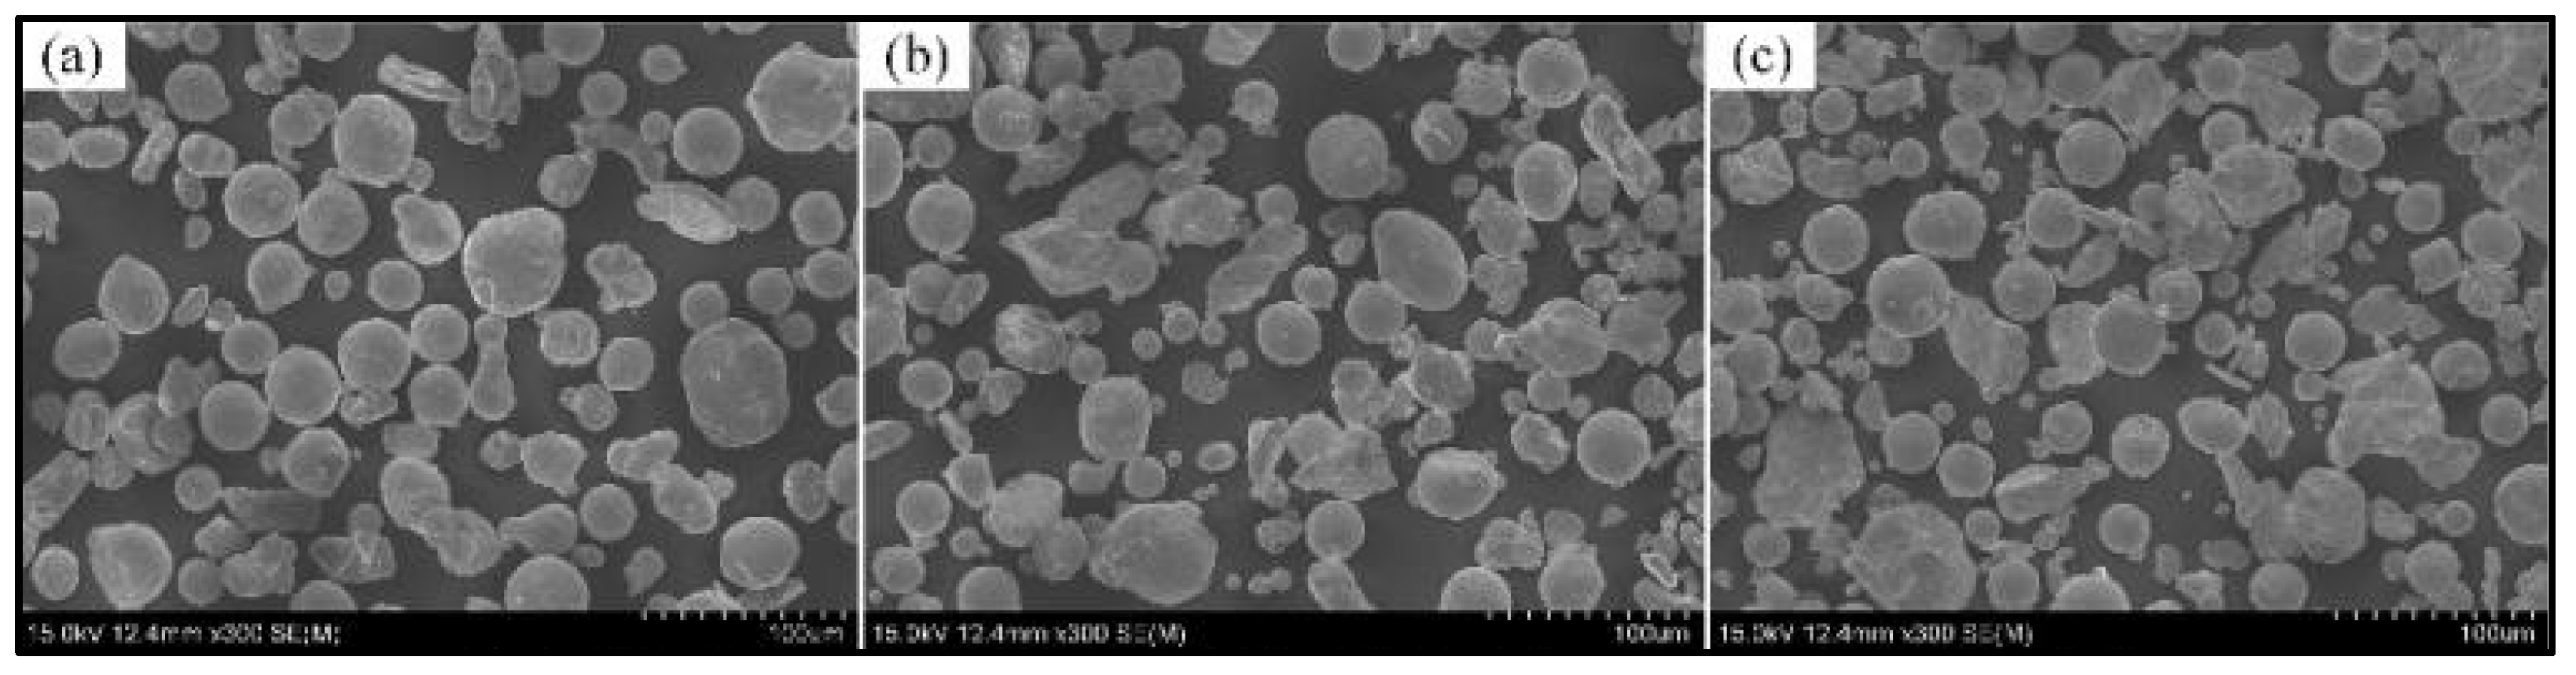
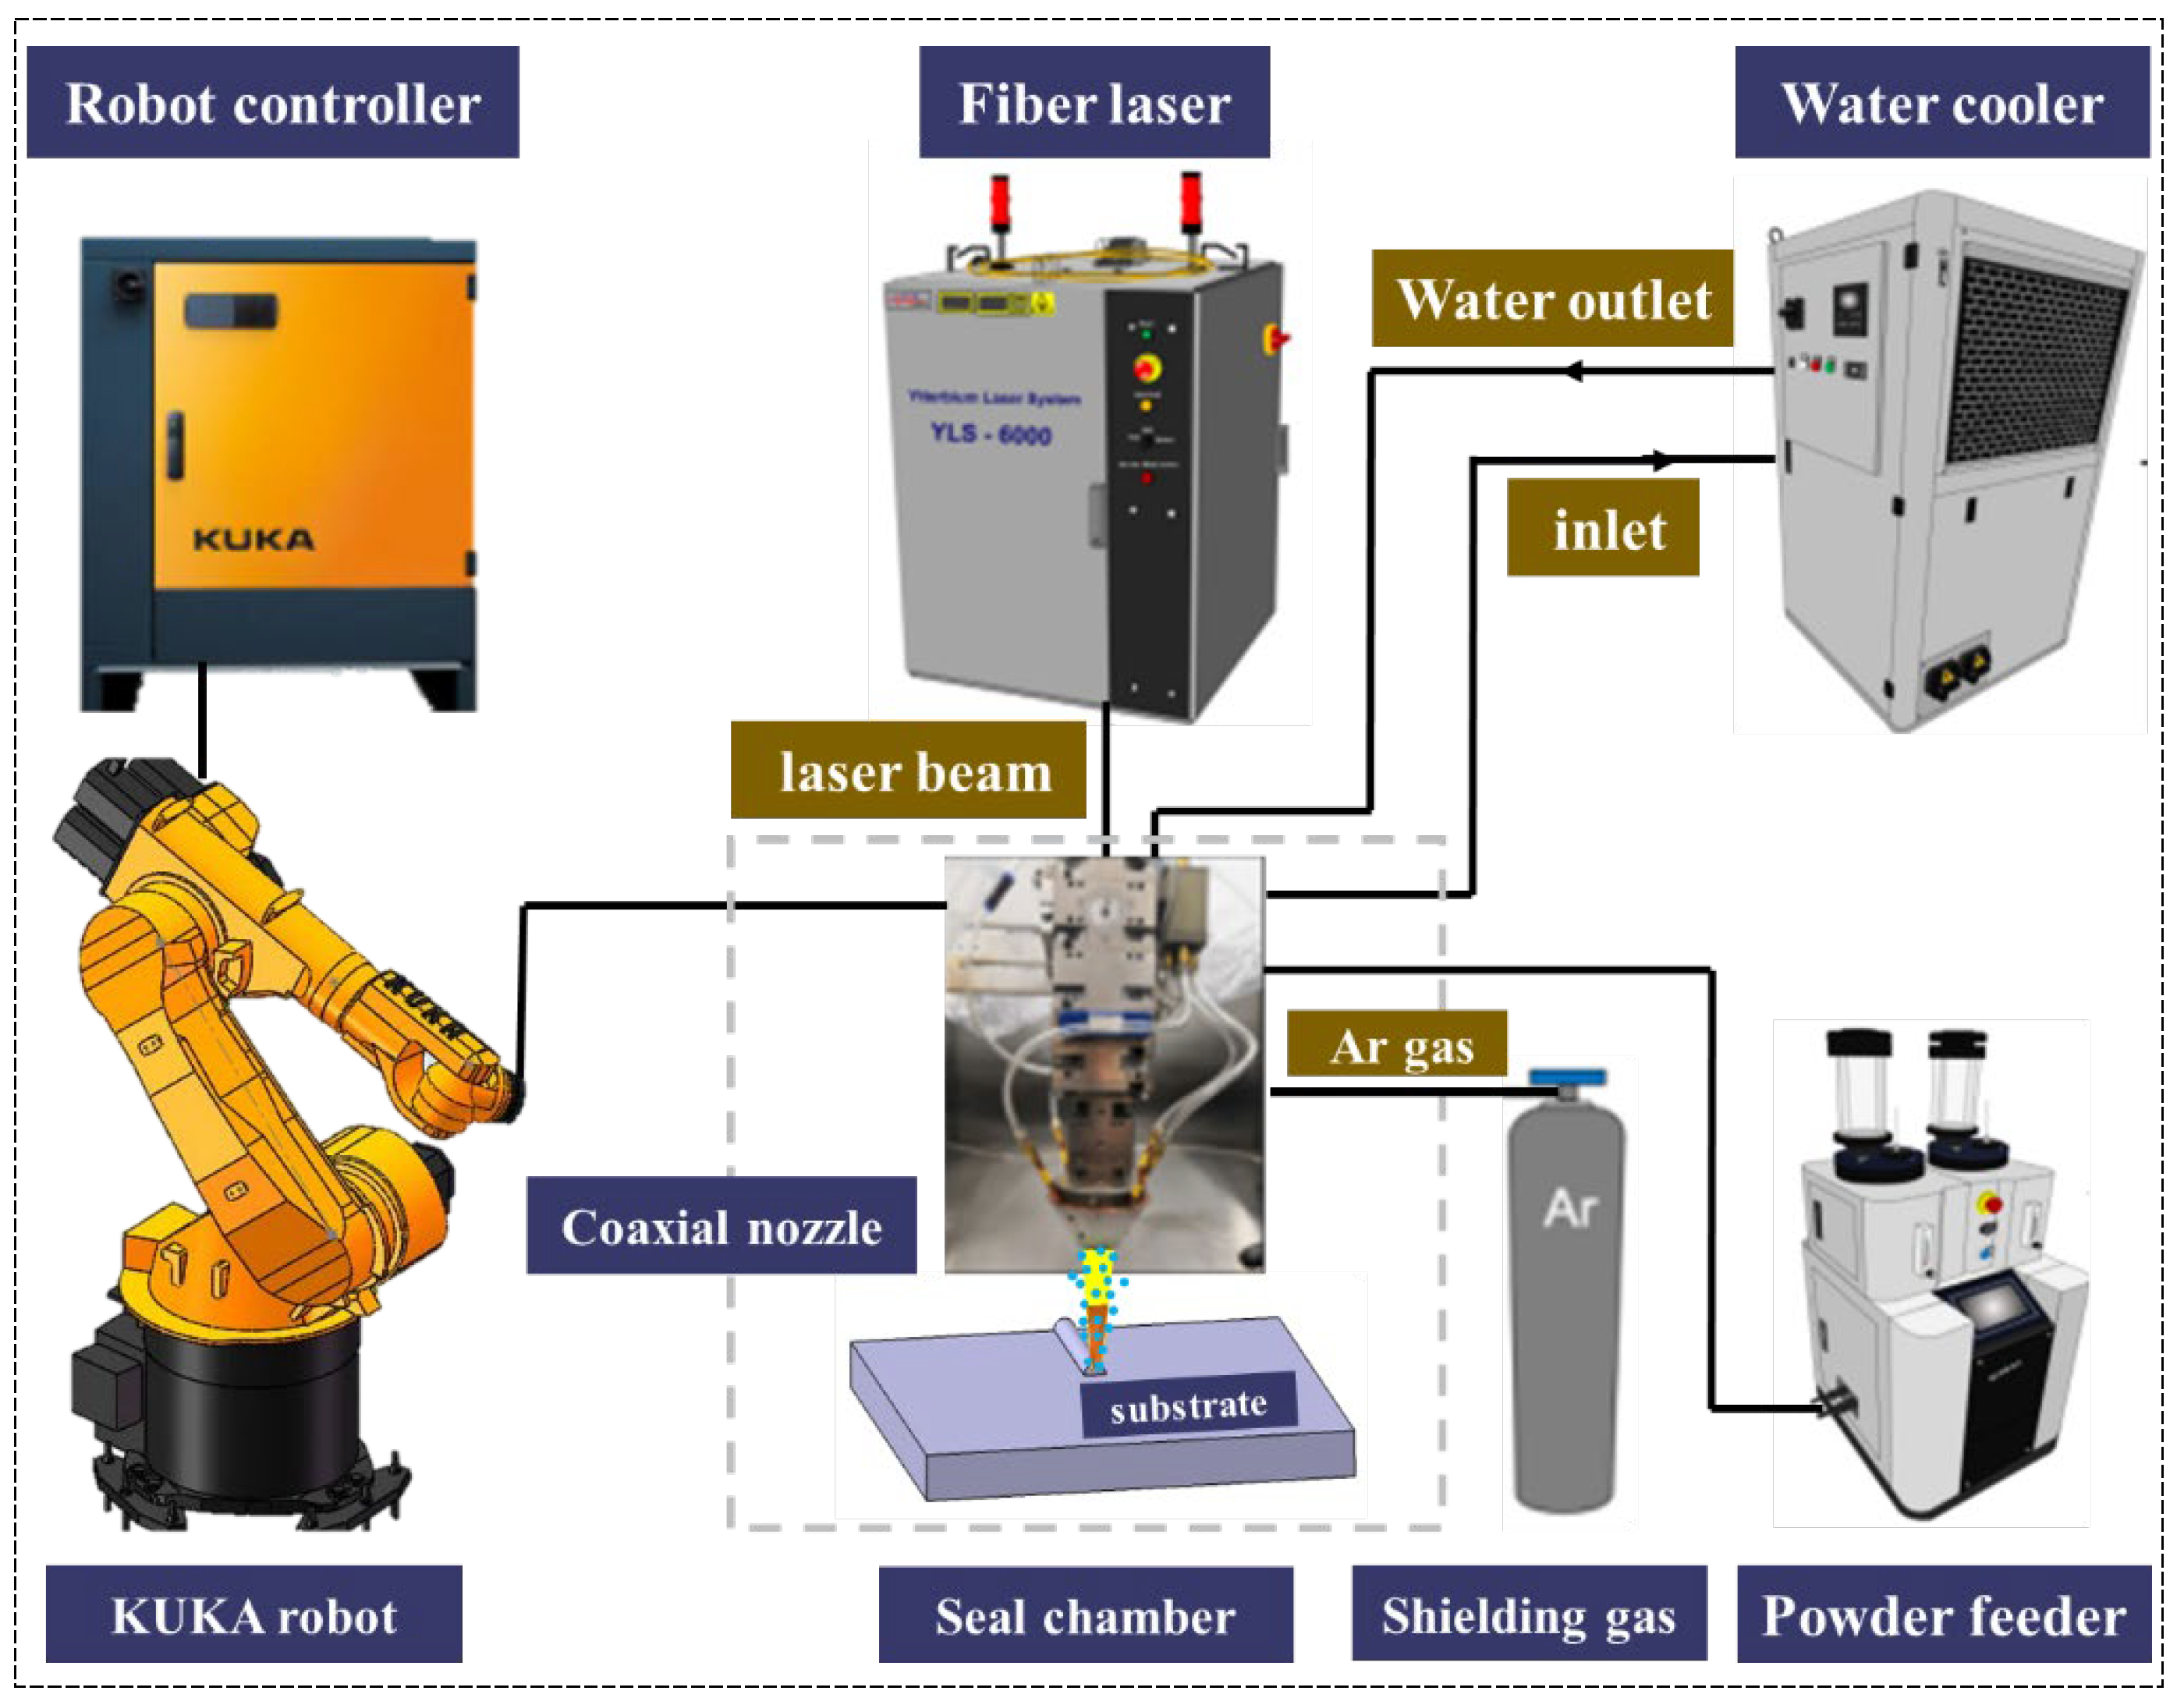
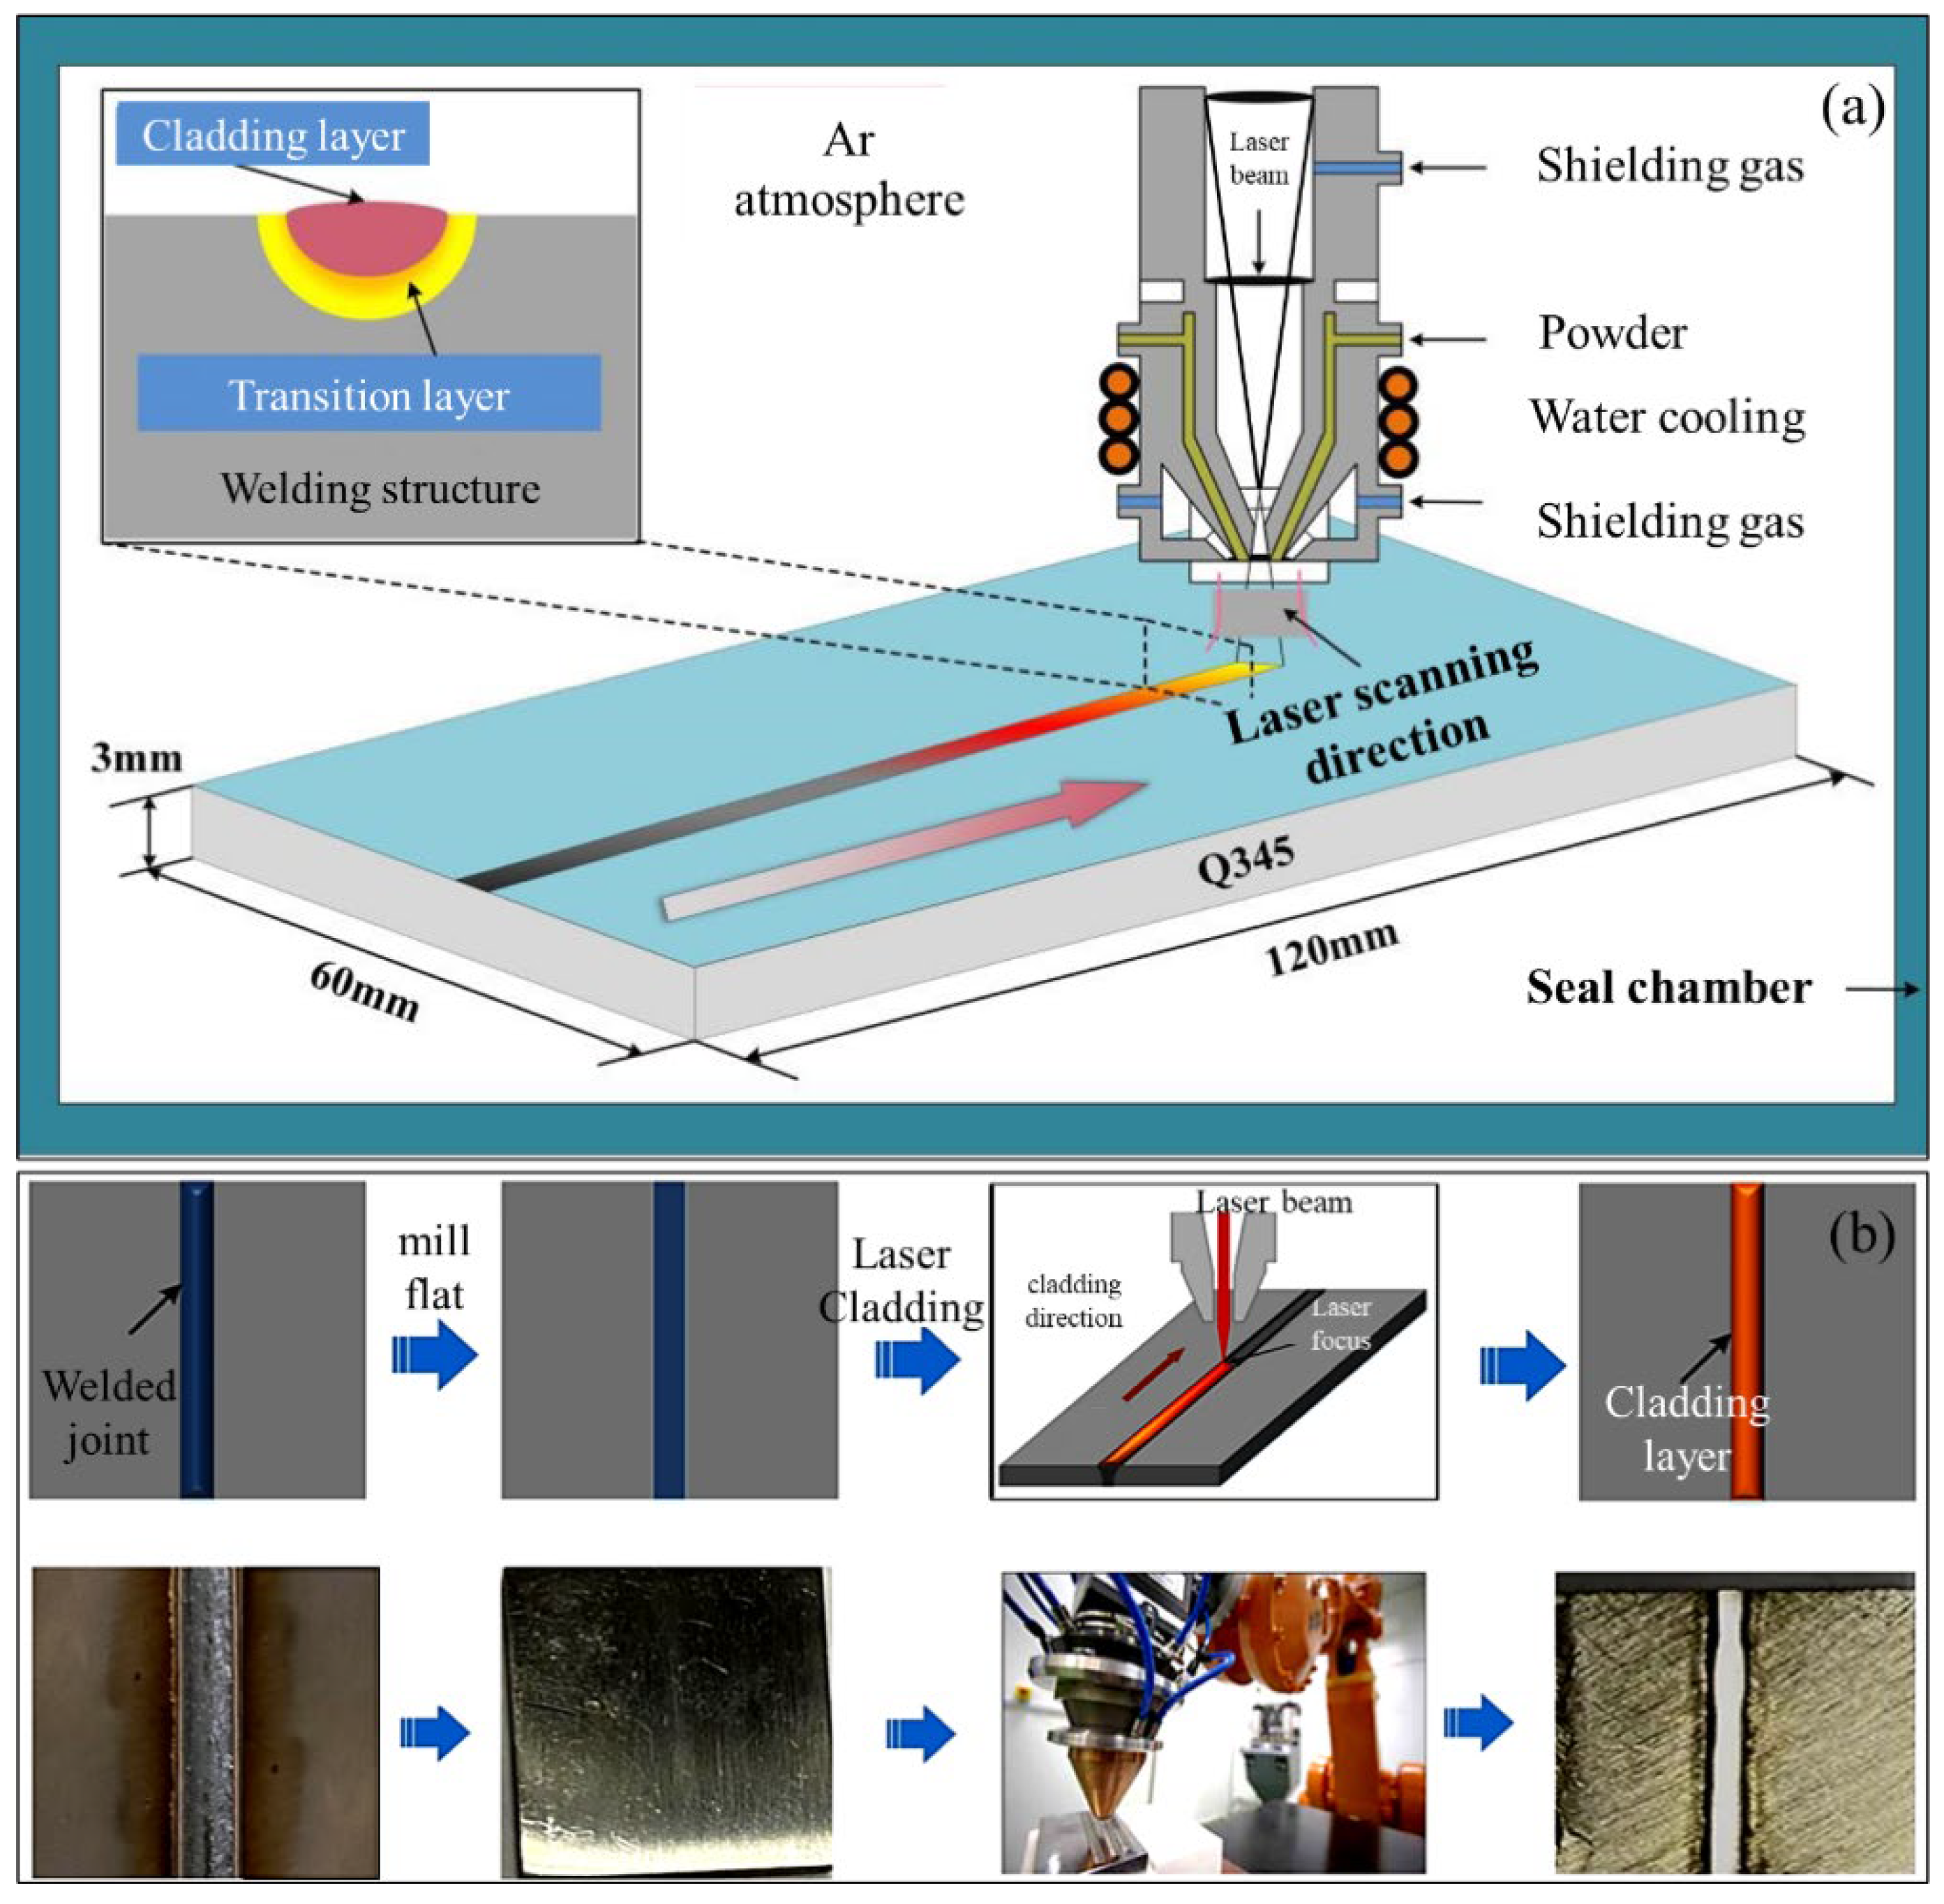
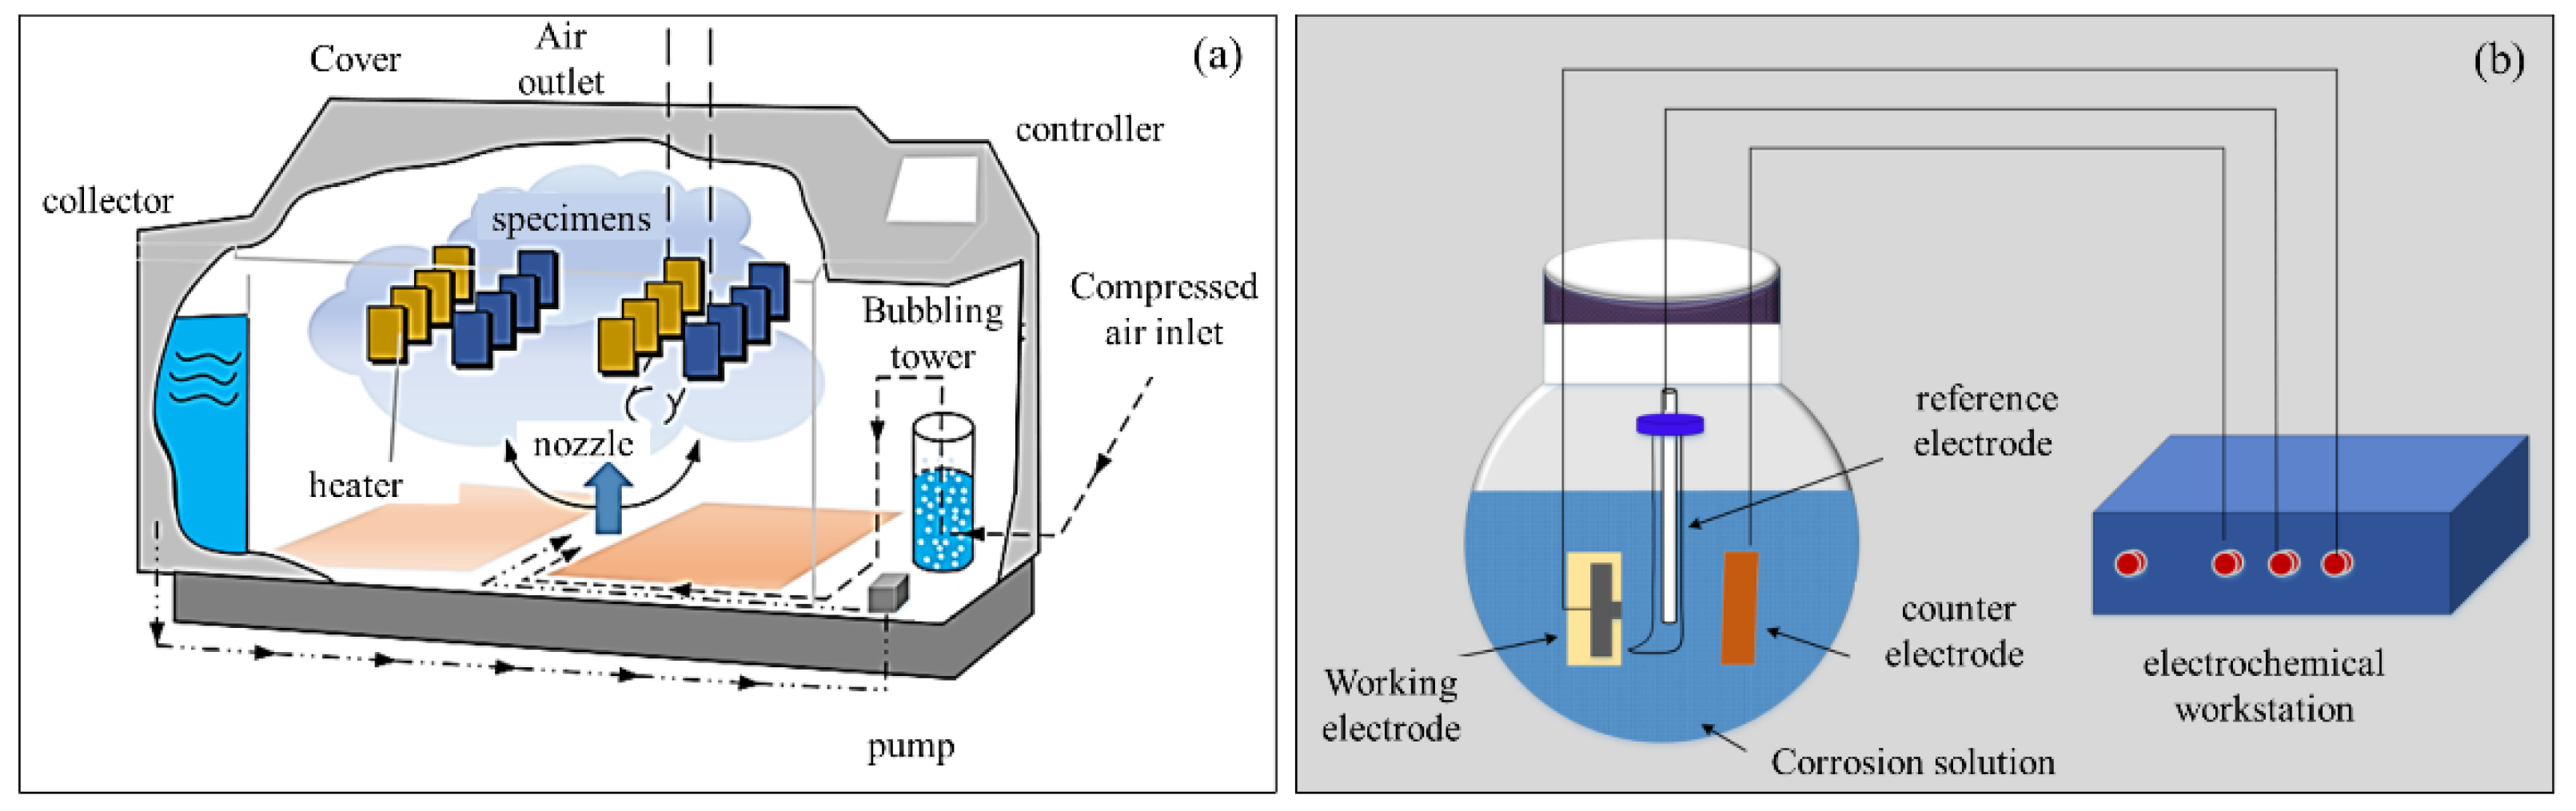
2. Materials and Methods

Two Q345 low-alloy steel plates (size,120 mm × 60 mm × 3 mm) are butt welded by metal inert-gas (MIG) welding methods, and Q345 filler wire with a diameter of 1.2 mm is used. At the beginning, the Q345 plates are fixed on the workbench. During the welding process, the substrate and the metal wire form positive and negative potentials, respectively, and the electric arc is generated between them. A molten pool is formed on the surface in the welding area due to the high temperature generated by the arc. At the same time, the wire is melted at elevated temperature after passing through the wire feeding nozzle and finally sent to the molten pool. With the movement of the welding gun and the metal arc, the liquid metal at the rear side of the molten pool is rapidly cooled down and solidifies on the substrate, and then the moving arc continuously creates a new molten pool on the surface of the area to be welded in front of the molten pool. The formation of the molten pool and the solidification of the bead keeps on until the weld formation is completed. The welding equipment involved in the experiment includes KUKA six-axis linkage robot (KUKA Deutschland GmbH, Augsburg, Germany) with the maximum working range of 10 m, Panasonic YW-50DNW wire feeder (Panasonic Welding Systems (Tangshan) Co., Ltd., Tangshan, China), Panasonic YG-500GP5 gas shielded welding machine (Panasonic Welding Systems (Tangshan) Co., Ltd., Tangshan, China) with the rated input voltage of AC380V, welding platform and protective gas. The pure Argon with purity of 99.999% is used as protective gas. Through the reference to the existing literature [34] and simple experimental parameters explorations, the obtained welding parameters are listed in Table 1.
Before the laser cladding process, three kinds of HEA powder with different chemical composition ratios are designed in order to study the corrosion resistance of coatings with different element contents. The specific element contents and the micromorphology are shown in Table 2 and Figure 1. Fe, Co, Cr, Ni and Al powder feedstock are prepared by the vacuum atomization method, and FeCoCrxNiAl HEA powder is prepared in the ball mill tank according to the molar ratio. The welded plate is milled evenly and cleaned, and the plate and powder are placed in a vacuum dry closet for fully drying. After that, the plate is placed in the seal chamber, and 99.999% argon is continuously injected to exclude the air.
During the laser cladding process, FeCoCrxNiAl HEA with different Cr element contents are laser melted on the base metal, heat-affected zone and weld bead of Q345 low-alloy steel welded joints, respectively, by a set of unchanged process parameters. The irradiation of the laser beam causes the material at the center of the beam to be subjected to high temperature and the molten pool is generated. At the same time, the HEA powder is sent to the molten region through the powder feeding nozzle under the restriction of the powder carrier gas. As the laser beam moves, the cooling metal at the rear side of the molten pool solidifies rapidly, and then a new molten pool is formed at the horizontal center of the laser beam in front of the molten pool. The formation and solidification of the molten pool continue until a complete cladding coating is formed. The laser cladding equipment is illustrated in Figure 2, including YLS-6000 fiber laser (Han’s Laser Technology Industry Group Co., Ltd., Shenzhen, China) capable of achieving a power of 6 kW, KUKA six-axis linkage robot, CCT-3300 water cooler, powder feeder, controller, shielding gas and seal chamber. In order to prevent oxidation during the experiment, a Rapid ox 1100 oxygen analyzer (Cambridge Sensotec, Cambridge, UK) is used to monitor the oxygen content in the seal chamber in real time. The specific process parameters are illustrated in Table 3, which are obtained from the reference to the parameters in other literature [35] and simple multiple pre-tests.
The powder transported from the coaxial powder feeder to the molten pool interacts with the laser beam transmitted to the surface of the substrate, and the powder and substrate surface are melted and form a molten pool, which quickly diffuses mutually and the elements solidify to form a cladding layer with good metallurgical bonding with each other. The detailed schematic diagram of laser cladding and the specific experimental processes are illustrated in Figure 3a,b.
After laser cladding, the metallographic analysis specimens (size, 5 mm × 20 mm × 3 mm) are cut in the cross-section of welded joints by wire cutting method. The samples are successively subjected to cold casting inlay by epoxy resin, sandpaper grinding, mechanical polishing and reagent etching. Q345 low-alloy steel areas are etched by nitric acid alcohol solution, and the HEA areas are etched by aqua regia. Microstructure, corrosion and wear morphology of welded joints and coatings are observed by MR-5000 optical microscope (OM, Ningbo Yongxin Optics Co., Ltd., Ningbo, China) and Hitachi S-4800 scanning electron microscope (SEM, Hitachi High-Tech (Shanghai) Co., Ltd., Shanghai, China). The content and distribution of major alloy elements of the welded joints and coatings after corrosion and wear are measured via an energy dispersive spectrometer (EDS, AMETEK, Inc., Berwyn, IL, USA) equipped with SEM, and the phases on the surface of coatings are determined by XRD. The diffraction patterns are calibrated, analyzed and processed by professional software, and the maps are plotted to analyze the influence of different element contents on the phase structure of the coatings.
The microhardness of welded joints and HEA coatings is measured by HVS50 hardness tester (Deka Precision Measuring Instrument (Shenzhen) Co., LTD., Shenzhen, China), with a load of 1000 G and 15 s holding time. After wire cutting, polishing and cleaning, friction and wear samples (size, 15 mm × 15 mm × 3 mm) are proceeded by friction and wear experiment. The friction mode is linear reciprocating motion at room temperature with a friction speed of 10 cm/s, a normal load of 13 N and a friction stroke of 10 mm. Besides, Si3N4 ceramic balls with a radius of 3 mm were used as the friction pair. In order to obtain the wear amount, the weight of the sample is measured by electronic balance before and after the experiment, which can be used as an index to evaluate the wear resistance of the sample. The second index is friction coefficient fluctuation diagram measured by the friction and wear test machine. The wear morphology is observed by SEM, which can be used as the third index.
The corrosion resistance of Q345 low-alloy steel welded joints and HEA coatings with different element contents under neutral salt spray condition is measured by a salt spray test chamber, and its working principle is illustrated in Figure 4a. The 3.5 wt.% NaCl solution is configured and poured into the salt spray chamber. The test samples are dispersed on the test piece rack, and the chamber cover is closed. The air compressor valve is opened to press the air into the saturator, making the foggy neutral solution spray into the chamber, which simulates the marine atmospheric environment. According to the national standard GBT10125-1997, the temperature in the chamber is maintained at 35 °C ± 2 °C, and the PH value is 6.5–7.2. The corrosion process of the samples is observed and recorded. Figure 4b shows the schematic diagram of electrochemical test. The electrochemical performance is carried out in the electrochemical workstation of three-electrode system. The working electrode is the specimen, and the counter electrode is platinum sheet. The saturated calomel electrode is selected as the reference electrode according to the 3.5 wt.% NaCl corrosion solution. The upper surface of the different regions of welding joints and HEA coatings on them is used as the test surface with an area of 3 mm × 10 mm. Before the test, the test surface is ground and polished, and the other surfaces are wrapped with epoxy resin to prevent contact with the corrosion solution from affecting the test results. In order to make the whole system in a relatively stable state and ensure the accuracy, the tests are repeated and use the samples soaked in NaCl solution for 30 min before test. The corrosion testing statistics of the sample under a steady state are selected as the analysis object.

3. Results

3.1. Effect of Cr Contents on the Corrosion Resistance of FeCoCrxNiAl HEA Coatings

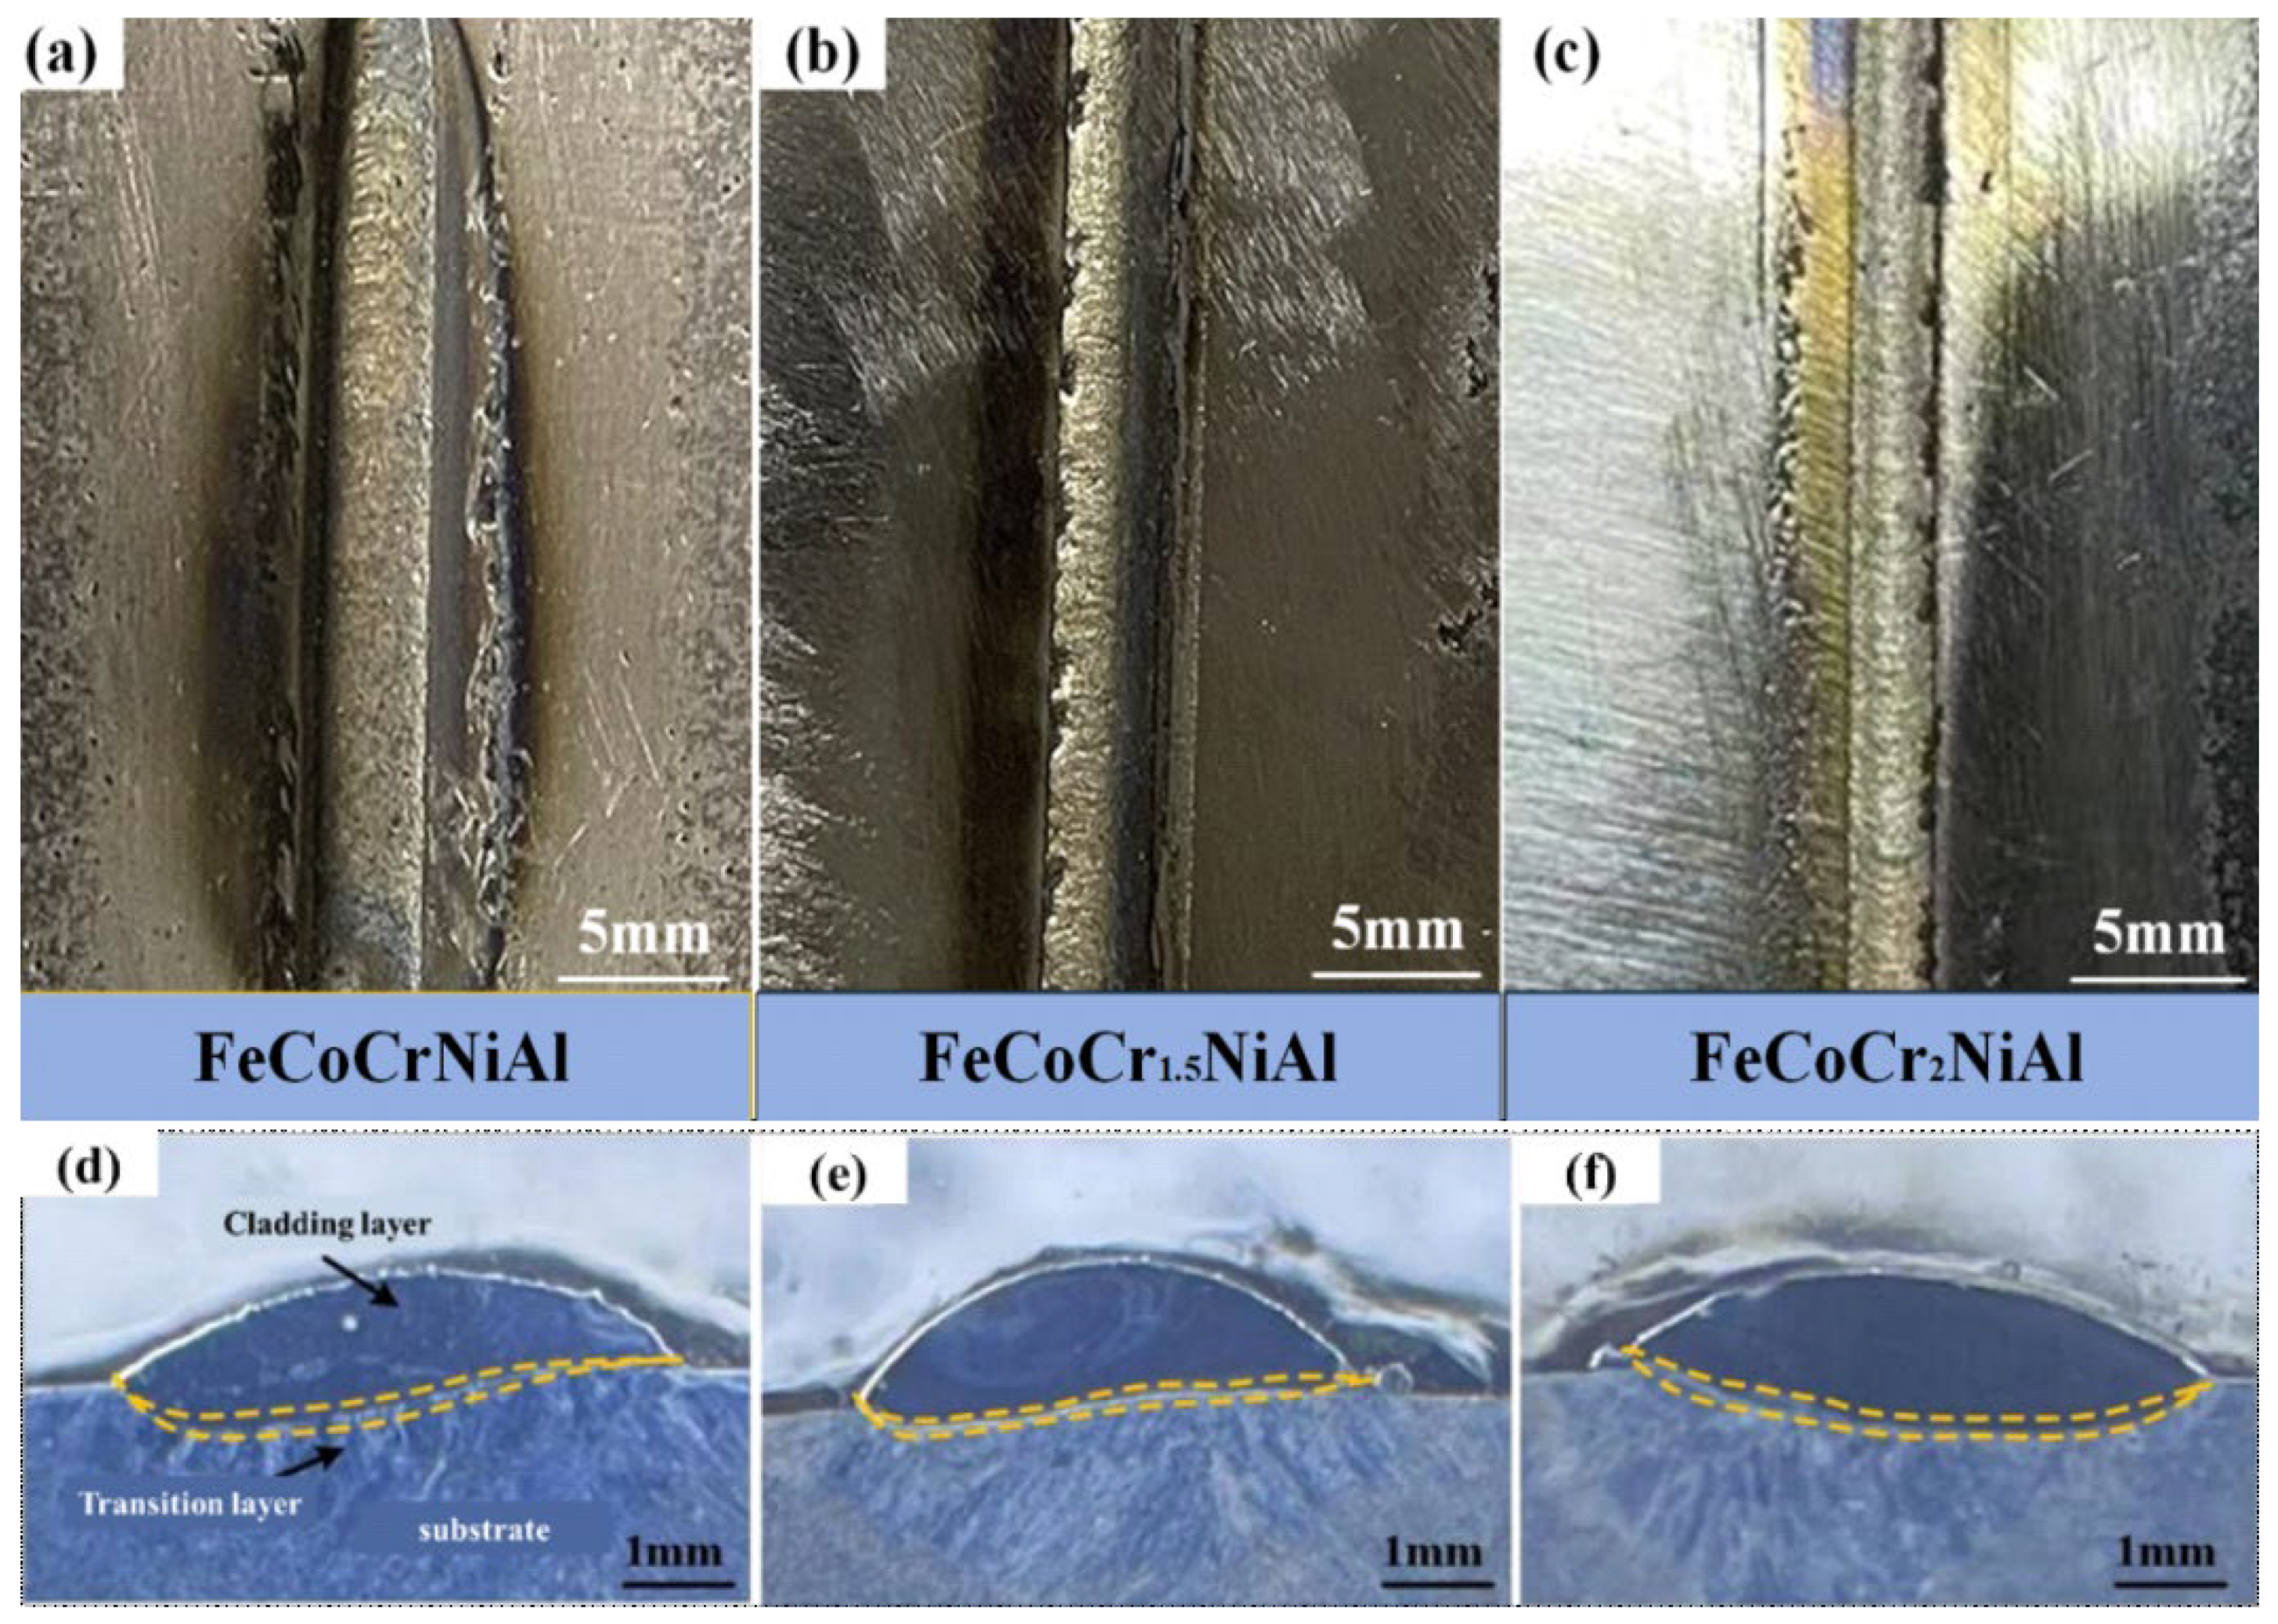
3.1.1. Macro Morphology

Figure 5 shows the macro morphologies of the FeCoCrxNiAl cladding layers, and the molar coefficients of Cr are x = 1, 1.5 and 2, respectively. It can be seen from that the surfaces with different Cr content are well formed smoothly and continuously and have obvious metal luster.
The macroscopic morphologies of the cross sections are shown in Figure 5, including the fusion zone, the bonding zone and the matrix from top to bottom. There is a white narrow band at the interface between the substrate and cladding layer without obvious defects, which is the transition layer formed by the diffusion of HEA powder and Q345 welded joint during laser cladding, indicating that the FeCoCrxNiAl HEA has a good metallurgical bonding with the matrix.
The main element (Fe) in the plate inevitably mixes into the molten pool, resulting in the change of the element content of the coating, which affect its performance directly. The proportion of powder is the only variate that affect the total energy absorption in this experiment, and closely related to the dilution rate. As is shown in Figure 6a, the transverse sectional shape can be regarded as a combination of two ideal arc lines with different radii. The calculation formula of dilution rate is as follows:
η = S 1 S 1 + S 2 × 100 %  
S1 represents the surface area of the cladding layer above the plate, and S2 represents the area of the melting of the substrate.
In other literatures, the influence of process parameters on the dilution rate has been discussed [36]. In addition to the process parameters, the coating composition ratio also has a very important impact on the dilution ratio. Figure 6b shows the dilution rate histogram of different Cr element content, showing that the dilution first decrease and then increase with the increase of Cr content in the powder and the dilution rates are 30.43, 21.30 and 36.20%, respectively. The increase of Cr contributes to the energy absorption of powder, promoting the matrix to melt. At the same time, the powder melting needed to absorb increases, and the energy required for matrix melting cannot be satisfied. When x = 1.5, the energy absorbed by the powder turns large, but the absorbed energy cannot compensate for the need of more powder melting energy, resulting in the decrease of the dilution rate. When x = 2, the higher content of Cr in the powder makes the absorbed energy larger relatively, which can make up for the energy required for powder melting, resulting in the increase of dilution rate.

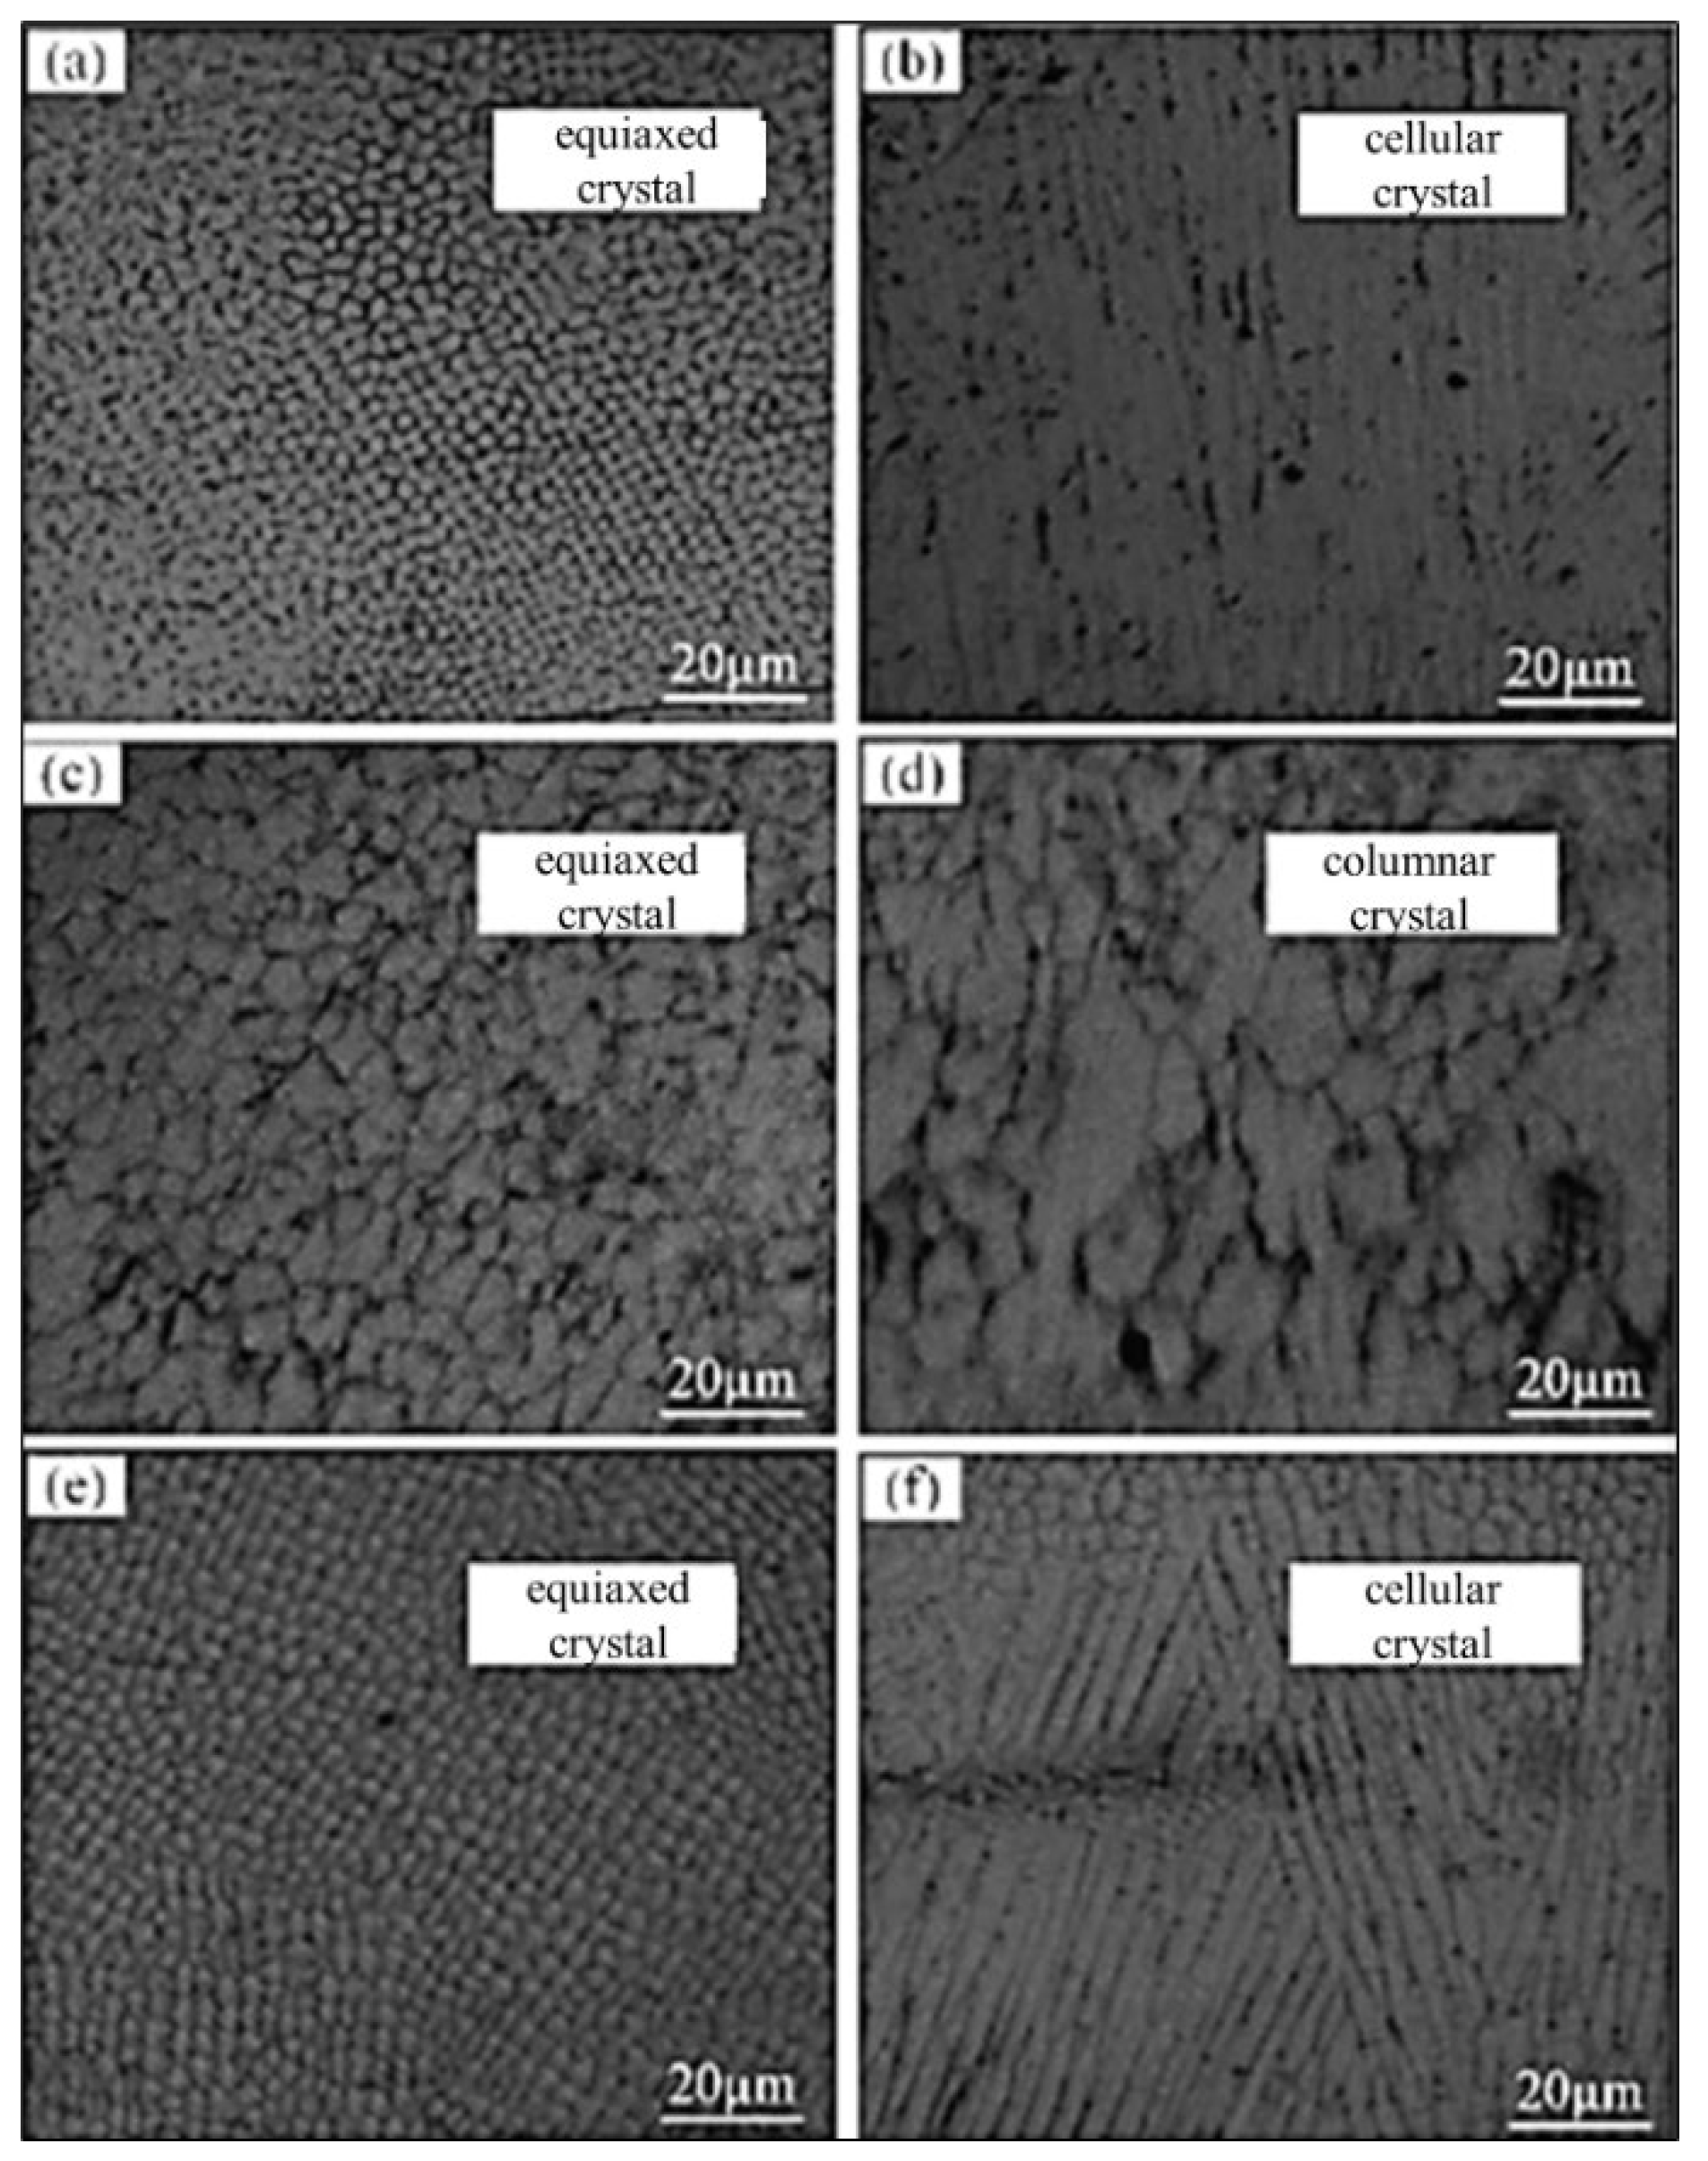
3.1.2. Microstructure

The effect of Cr content on the microstructure in different regions of cladding coatings is figured out in this research. Figure 7 shows the SEM morphology of the coatings with different Cr content. The upper and middle parts are equiaxed crystal mostly, while the position near the substrate is columnar or cellular crystal with directionality. The columnar crystal grows along the specific thermal diffusion direction, which is perpendicular to the interface from the substrate to the coating in the laser cladding process. As the cooling goes on, the temperature gradient becomes small and the preferential orientation of dendrite growth is not obvious, so it is more inclined to form equiaxed grains in the upper and middle regions.
As is shown in Table 4, the actual element content of the coatings is determined by EDS. When x = 1 or 2, the actual Fe element content is higher than the theoretical value, and the contents of Co, Cr, Ni and Al are less. When x = 1.5, the content of Fe is still high, but significantly lower than the above. It is because that when welded joint is laser cladded with HEA cladding, Fe diffused from the matrix to the layer is relatively small, which corresponds to the low dilution rate phenomenon. At meanwhile, Al content decreases compared with the theoretical value among the three coatings, which may contribute to the low melting point and serious ablation. It is also possible that Al reacts with oxygen to form Al2O3 and is discharged from the surface of the molten pool in the form of Al2O3 dross. Meanwhile, the corrosion resistance of Al element in aqua regia is worse than that of other elements. It is worth noting that the content of Cr is the highest when x = 1.5, which is closely related to the low dilution rate.

3.1.3. Phase Transformation

The XRD patterns of the coatings are illustrated in Figure 8, which shows that there are only simple FCC and BCC phase in the HEA coatings due to the high-entropy effect. When x = 1, there exist the diffraction peaks of both FCC and BCC phase. When x = 1.5 or 2, there are only two diffraction peaks of BCC phase, while FCC diffraction peak disappears. The intensity of BCC diffraction peak firstly increases and then decreases with the increase of Cr content in the powder, which is the same as the trend of actual Cr content in the coatings determined by XRD. It can be concluded that the existence of Cr promotes the formation of BCC phase. The BCC phase has low density and loose structure, which can change the lattice distortion and reduce the free energy of the high-entropy alloy system.

3.2. Effect of Cr Content on Mechanical Properties of HEA Coatings

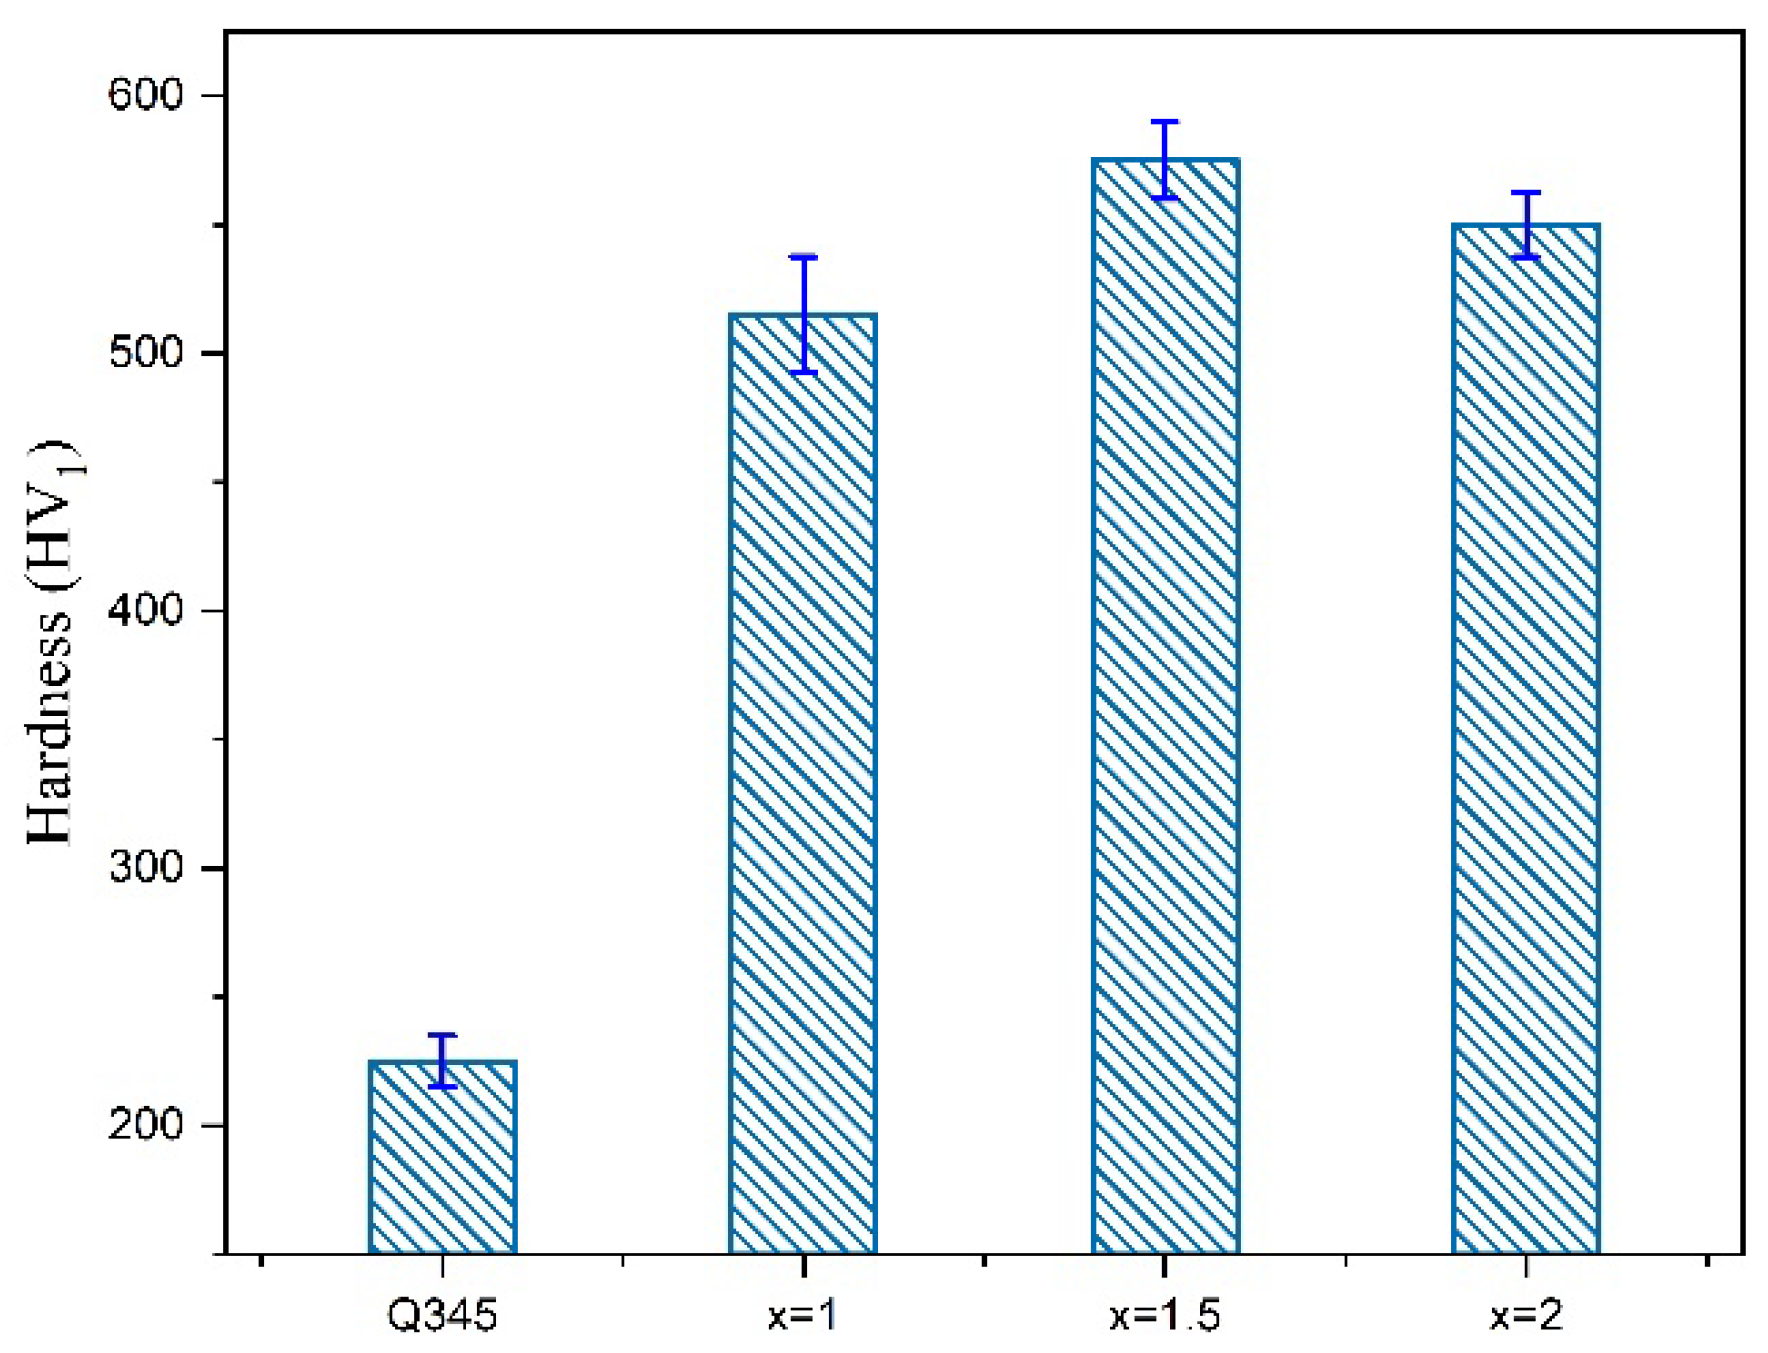
3.2.1. Microhardness

The hardness diagram of Q345 welded joint and HEA coatings with different Cr content are illustrated in Figure 9, and the hardness of the HEA layers is higher than that of the Q345 welded joint obviously. Due to the interaction between the multi-principal elements that will promote the internal fine-grain strengthening, dispersion strengthening and solid solution strengthening of the alloy during the solidification process, the hardness of the HEA coatings is much higher than that of the Q345 substrate. With the increase of Cr content in the powder, the hardness of the layer increases first and then decreases. Combined with the XRD results, there exist both FCC and BCC phase when x = 1. As the Cr content continues to increase, there exist only a single BCC phase. FCC structure has many slip systems, which is easy to deform when subjected to external force, so the hardness of BCC phase is higher than that of FCC phase. When x = 1.5, the actual Cr content is the largest, so the microhardness is the highest. However, the actual Cr content is not much different, so the hardness changes little.

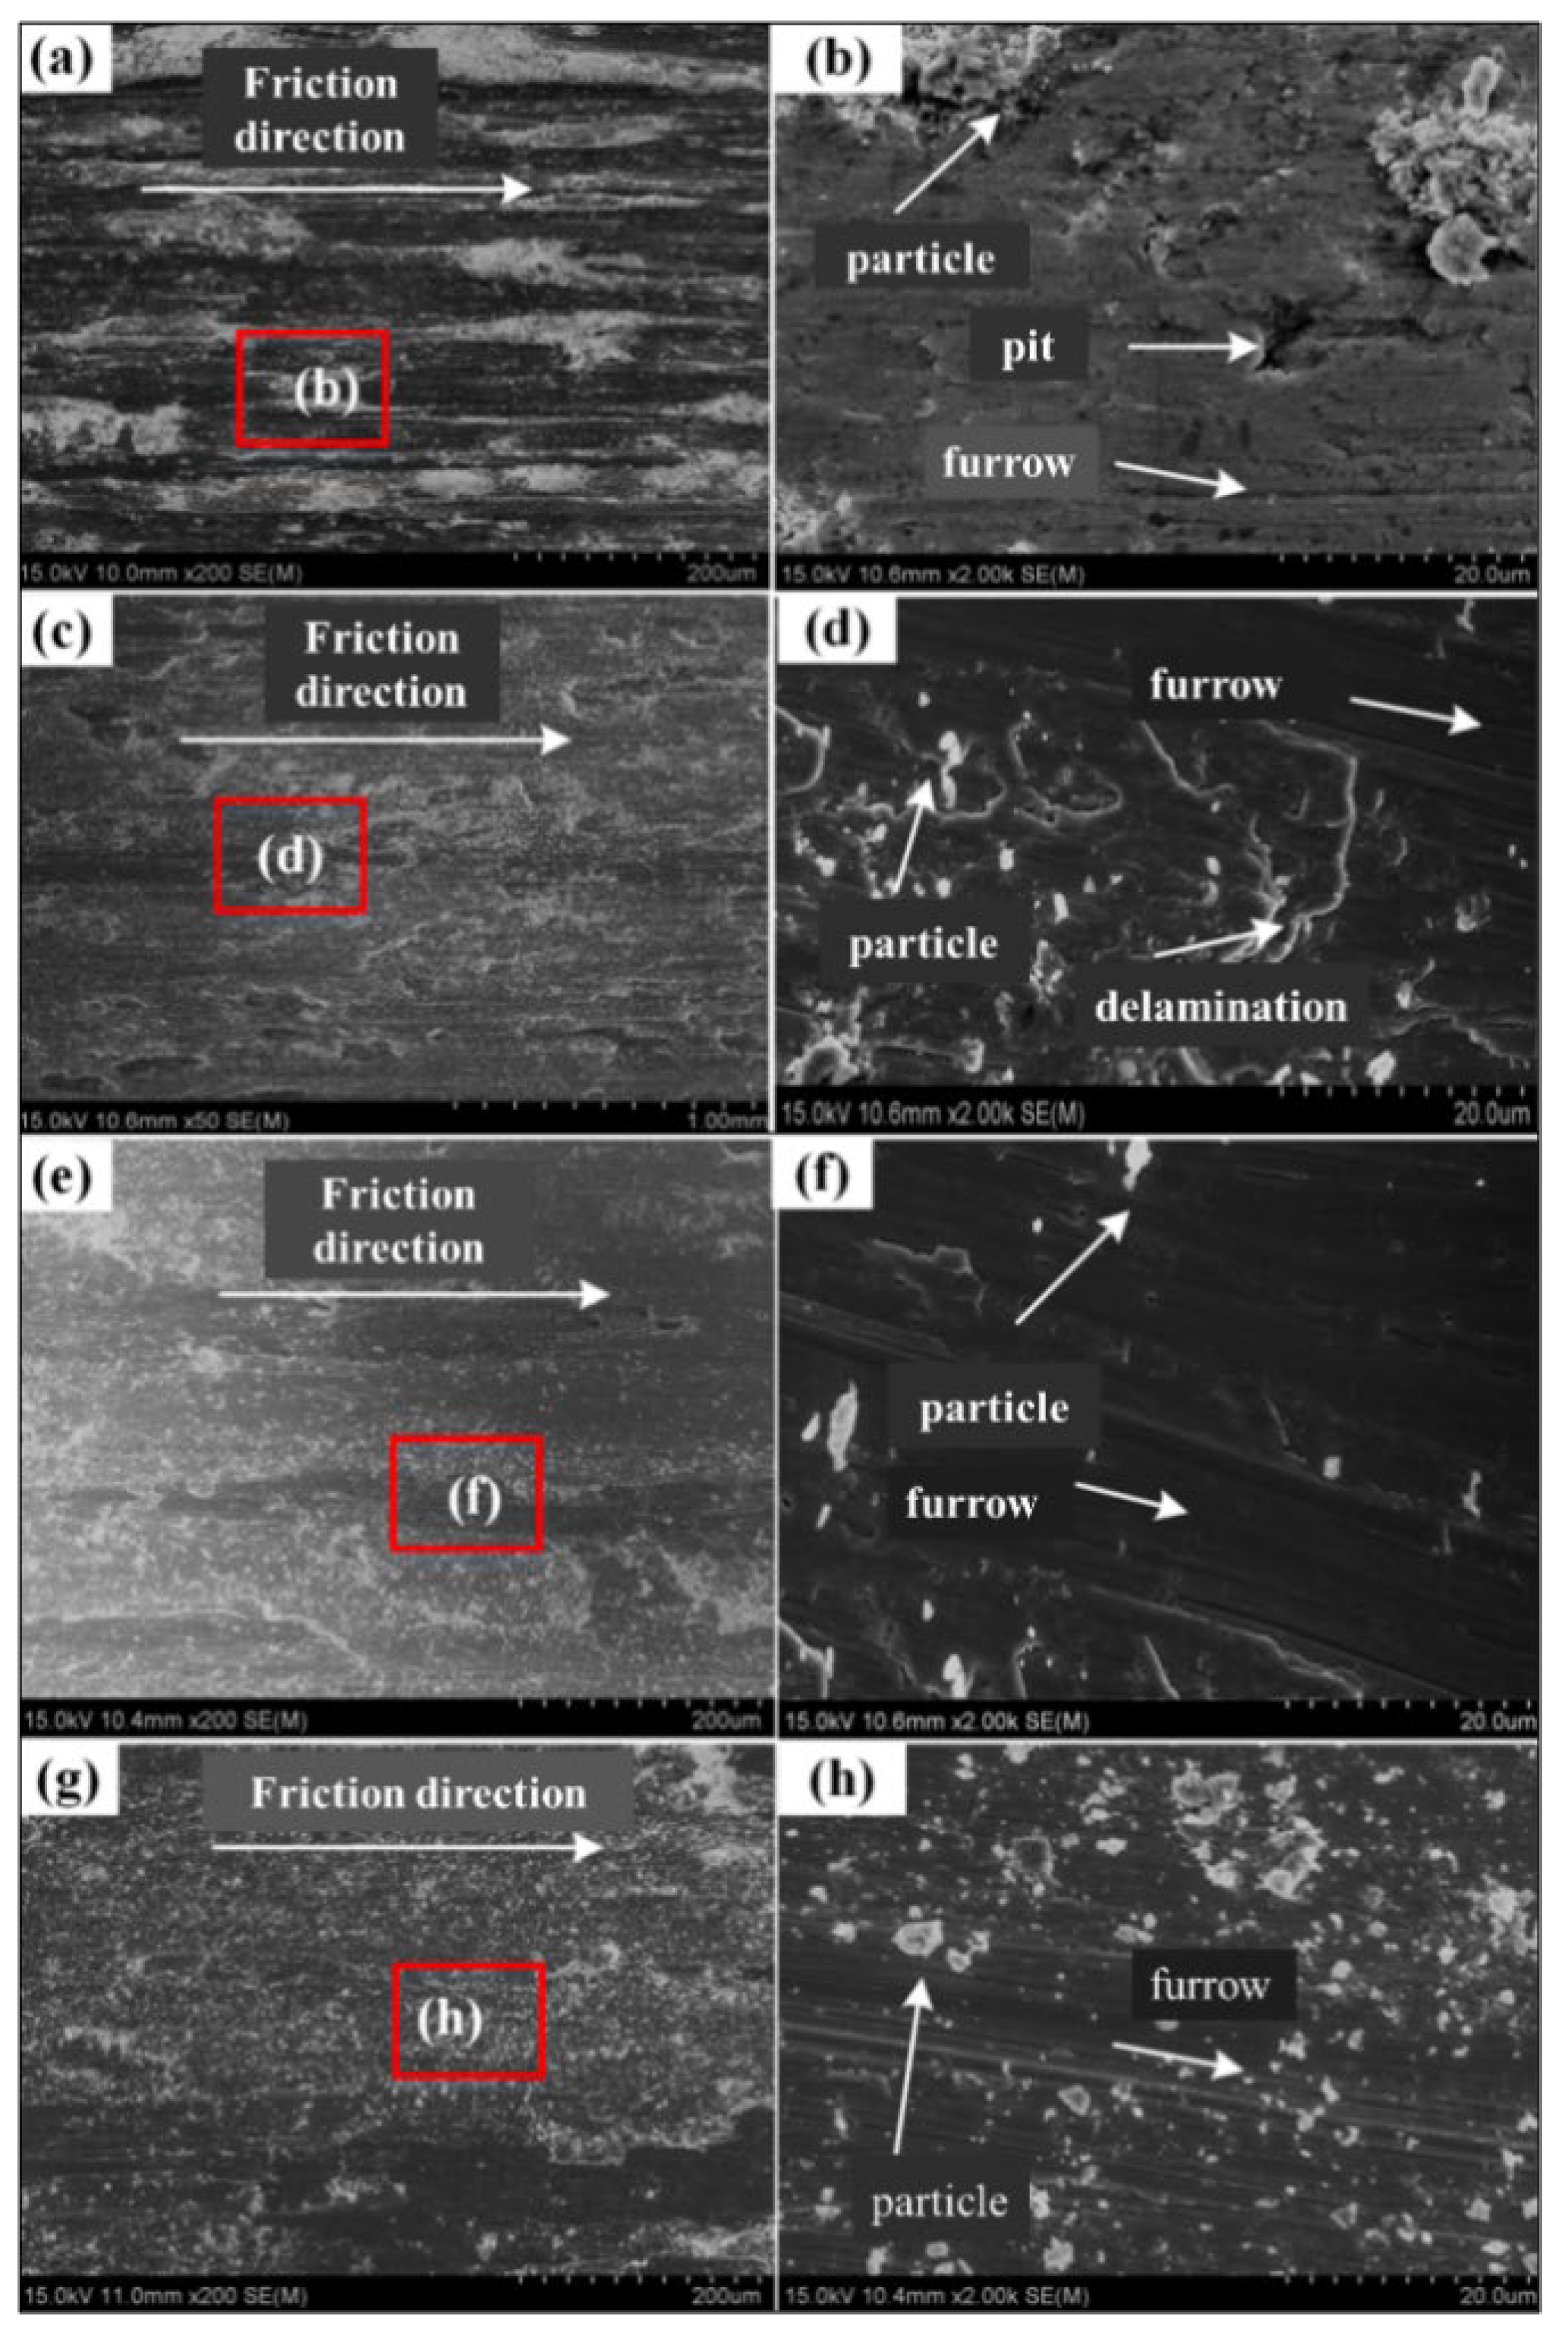
3.2.2. Wear Resistance

The wear resistance is determined by friction and wear test, and the friction coefficient, wear amount and wear morphology are compared and analyzed. Figure 10a is the curves of the relationship between friction coefficient and reciprocating motion time. Because the surface of the samples is ground and polished smoothly before test, the friction coefficients start from a small value and increase rapidly. Then the friction coefficients become stable with small fluctuations. However, the time entering the stable stage is slightly different, affected by the characteristics of the samples and the surface treatment before the experiment. When x = 1.5, the friction coefficient curve is located at the bottom with the smallest friction coefficient, showing that the hardness and wear resistance are proportional.
The histogram of the wear amount of the welded joint and coatings is shown in Figure 10b. The wear amount of welded joint is twice as much as that of cladding layers, and the wear loss of coating decreases firstly and then increases with the increase of Cr in the powder, indicating that the best wear resistance is the FeCoCr1.5NiAl cladding layer.
The wear morphologies of welded joint and cladding layers are illustrated in Figure 11. It can be seen from the figure that the surface wear of welded joint is serious. As is shown in Figure 11a,b, the surface is subjected to stress so that the surface metal is stripped, and pits are left in the process of friction and wear. At the same time, small metal particles will be produced and grind the surface in the process of reciprocating motion of the friction pair, leaving furrows on the welded surface. The wear mechanism of welded surface is composite wear composed of adhesive and abrasive wear. The wear surfaces of the cladding layers with different Cr content are smoother without obvious pits by contrast in Figure 11 from c to h, indicating that the wear resistance of the HEA cladding layer is better. When the Cr content is small, the furrows and metal particles on the worn surface are accompanied by delamination fracture, proving that the wear mechanism is abrasive and delamination wear. When x = 1.5, the furrow depth becomes shallow with small amount of the shedding metal particles. However, the wear surface is distributed with furrows and more shedding metal particles when x = 2, indicating the wear mechanism belongs to abrasive wear. With the increase of Cr content, the wear scar roughness decreases firstly and then increases, owning to the changing of actual Cr element content and microhardness. The increasing hardness improves the cutting resistance and then enhances the wear resistance of the cladding layer.

3.3. Effect of Cr Content on Corrosion Resistance of HEA Coatings

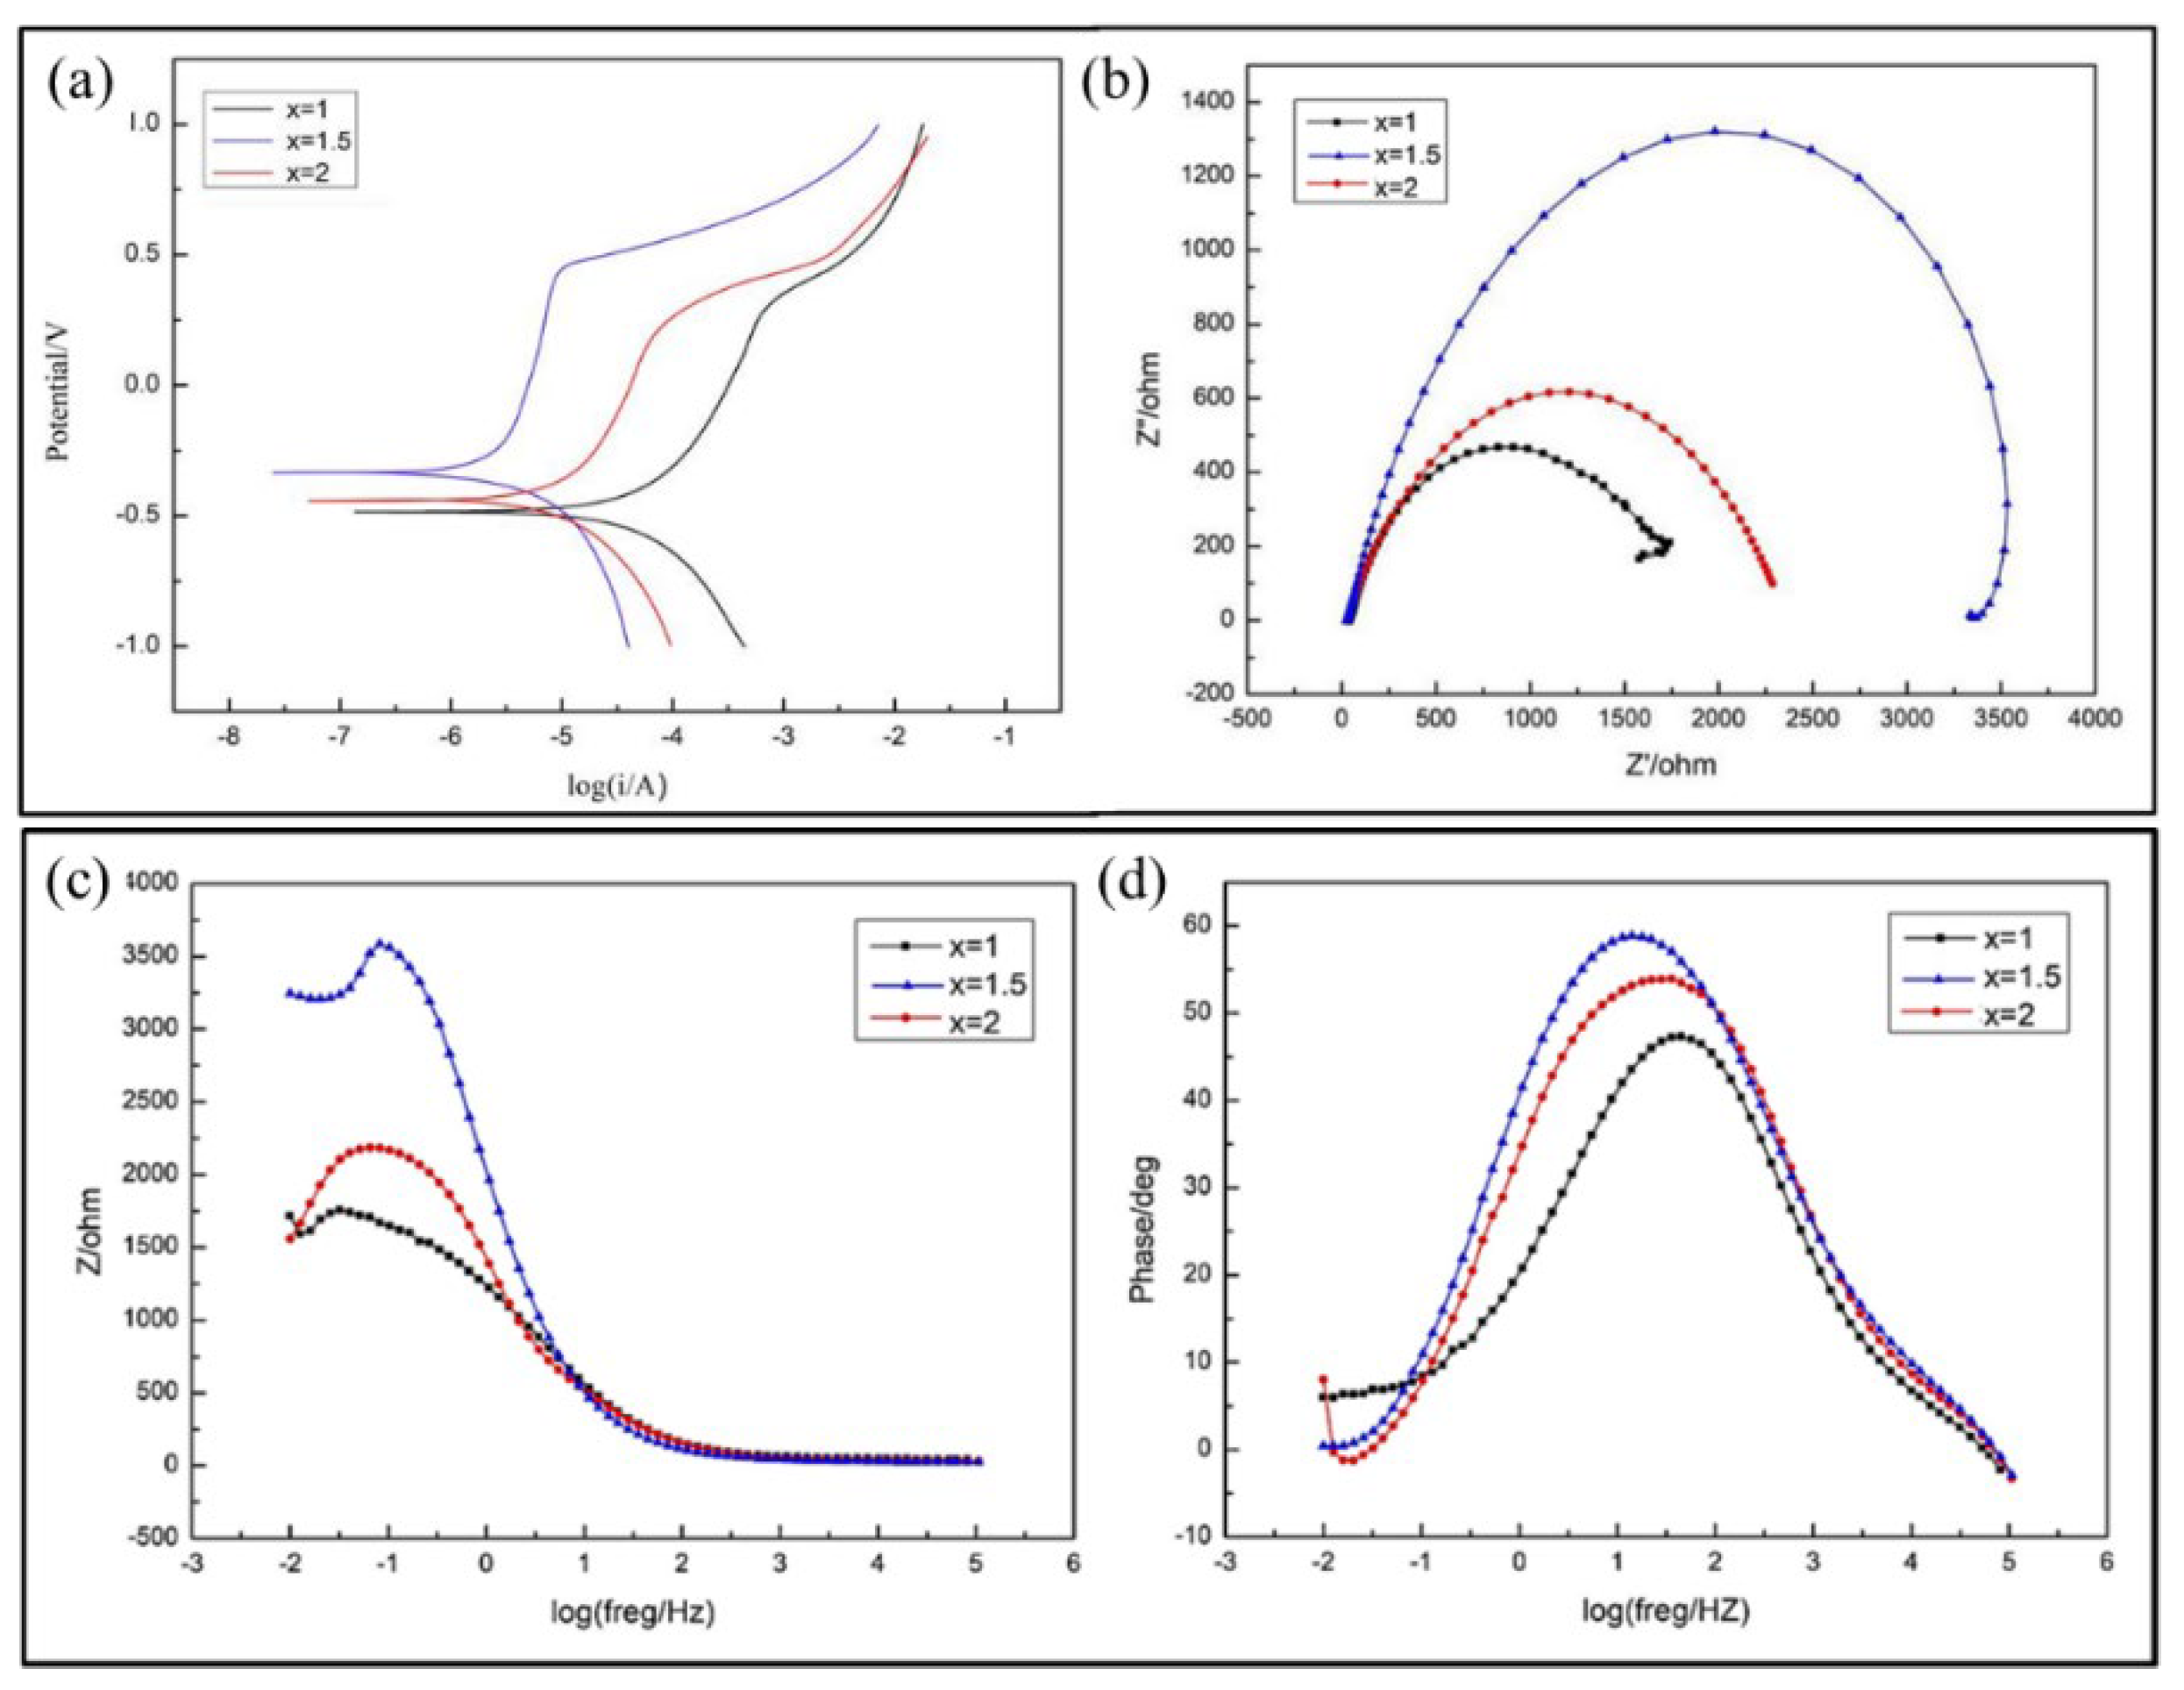
3.3.1. Electrochemical Corrosion Resistance

As shown in Figure 12, the electrochemical tests of HEA cladding layers with different Cr content on welded joint are carried out to investigate their corrosion resistance and obtain a set of curves. It can be seen from the polarization curves in Figure 12a that in the anodic polarization zone, the activation stage occurs at first and then enter the passivation stage. The cladding layer produces passivation film to protect itself from further corroding, and then the passivation film is destroyed and entered the trans passive stage. As shown in Table 5, the electrochemical dynamic parameters can be obtained according to the polarization curves. With the increase of Cr element content in the powder, self-corrosion potential increases firstly and then decrease, while self-corrosion current density shows the opposite trend. When x = 1.5, the self-corrosion current density is 2.567 × 10⁻⁶ A/cm2, which is smaller than that of the cladding layers with x = 1 or x= 2, indicating that the corrosion resistance of the HEA layer can be effectively improved by properly increasing the content of Cr element in the powder.
The Nyquist plots of layers are presented in Figure 12b, presenting capacitive arc characteristics, but the amplitude of different layers is different, that is, the size of the arc radius. When x = 1, the amplitude is the smallest. With the increase of Cr content, it increases firstly and then decreases, showing that when the corrosion reaction occurs, the electrode reaction resistance of the cladding layer with x = 1.5 is the largest making the corrosion reaction difficult. The results are consistent with the results of the polarization curves. Figure 12c,d is the Bode diagram of the cladding layers. Figure 12c shows that the impedance values appear the same trend as Nyquist plots. As is shown in Figure 12d, the phase angle is the largest when x = 1.5. Therefore, with the increase of actual Cr content, the corrosion resistance increases.

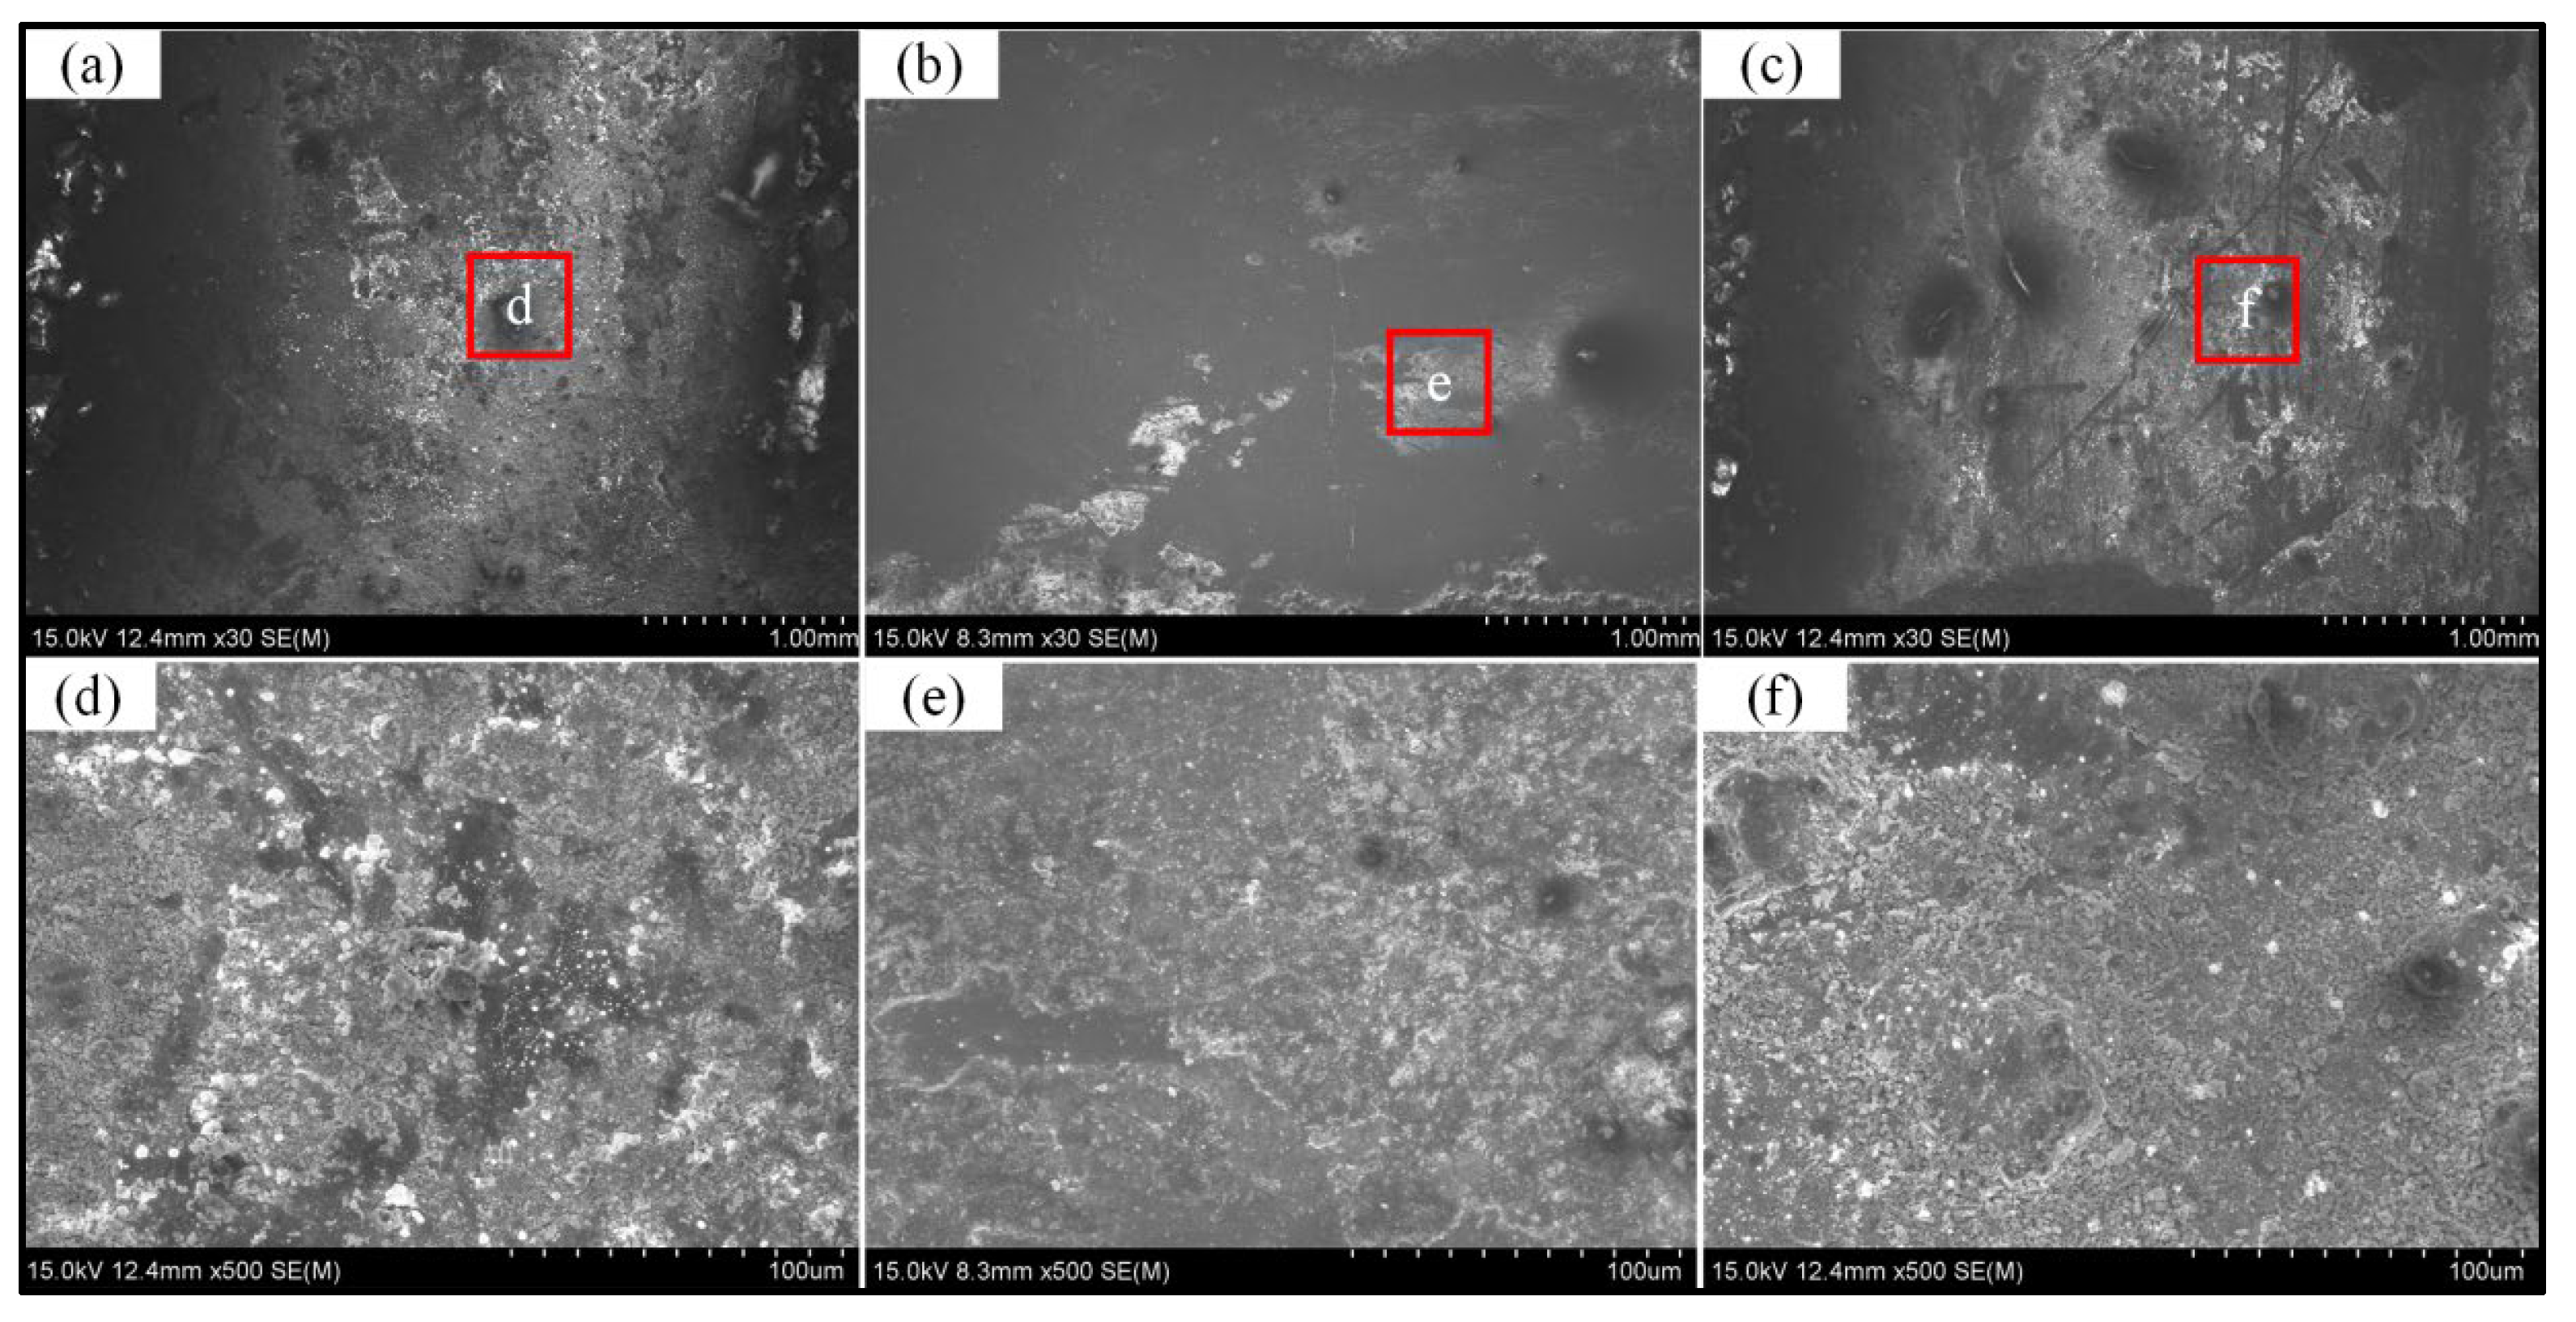
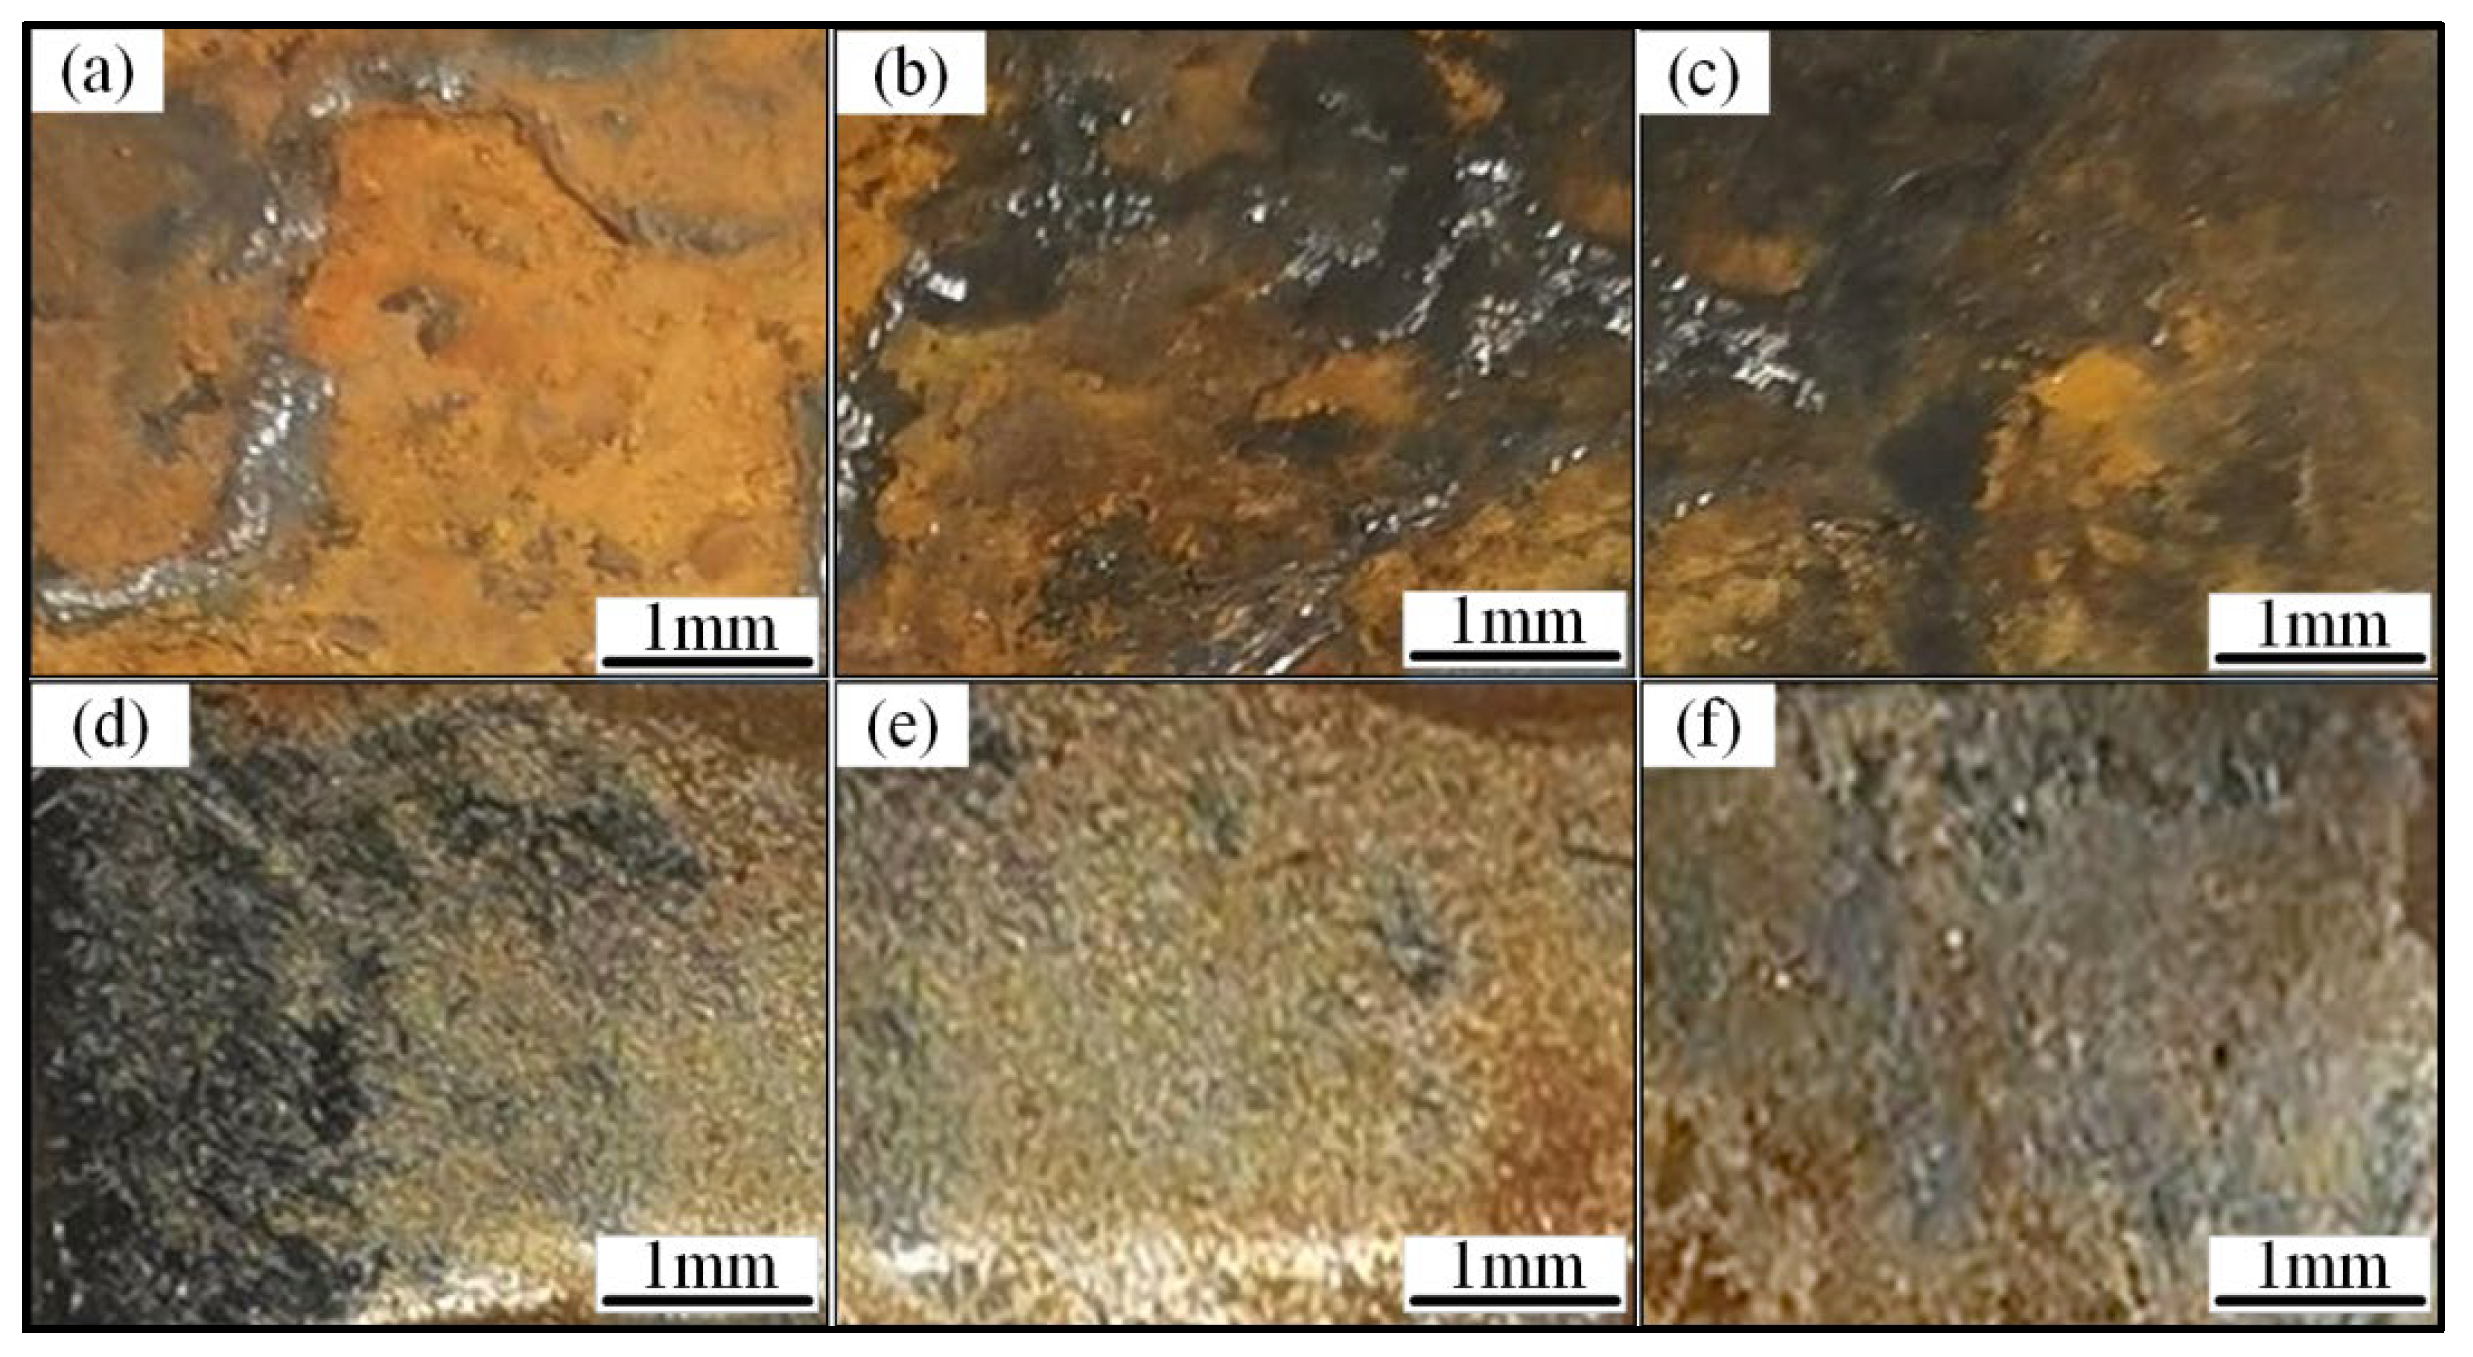
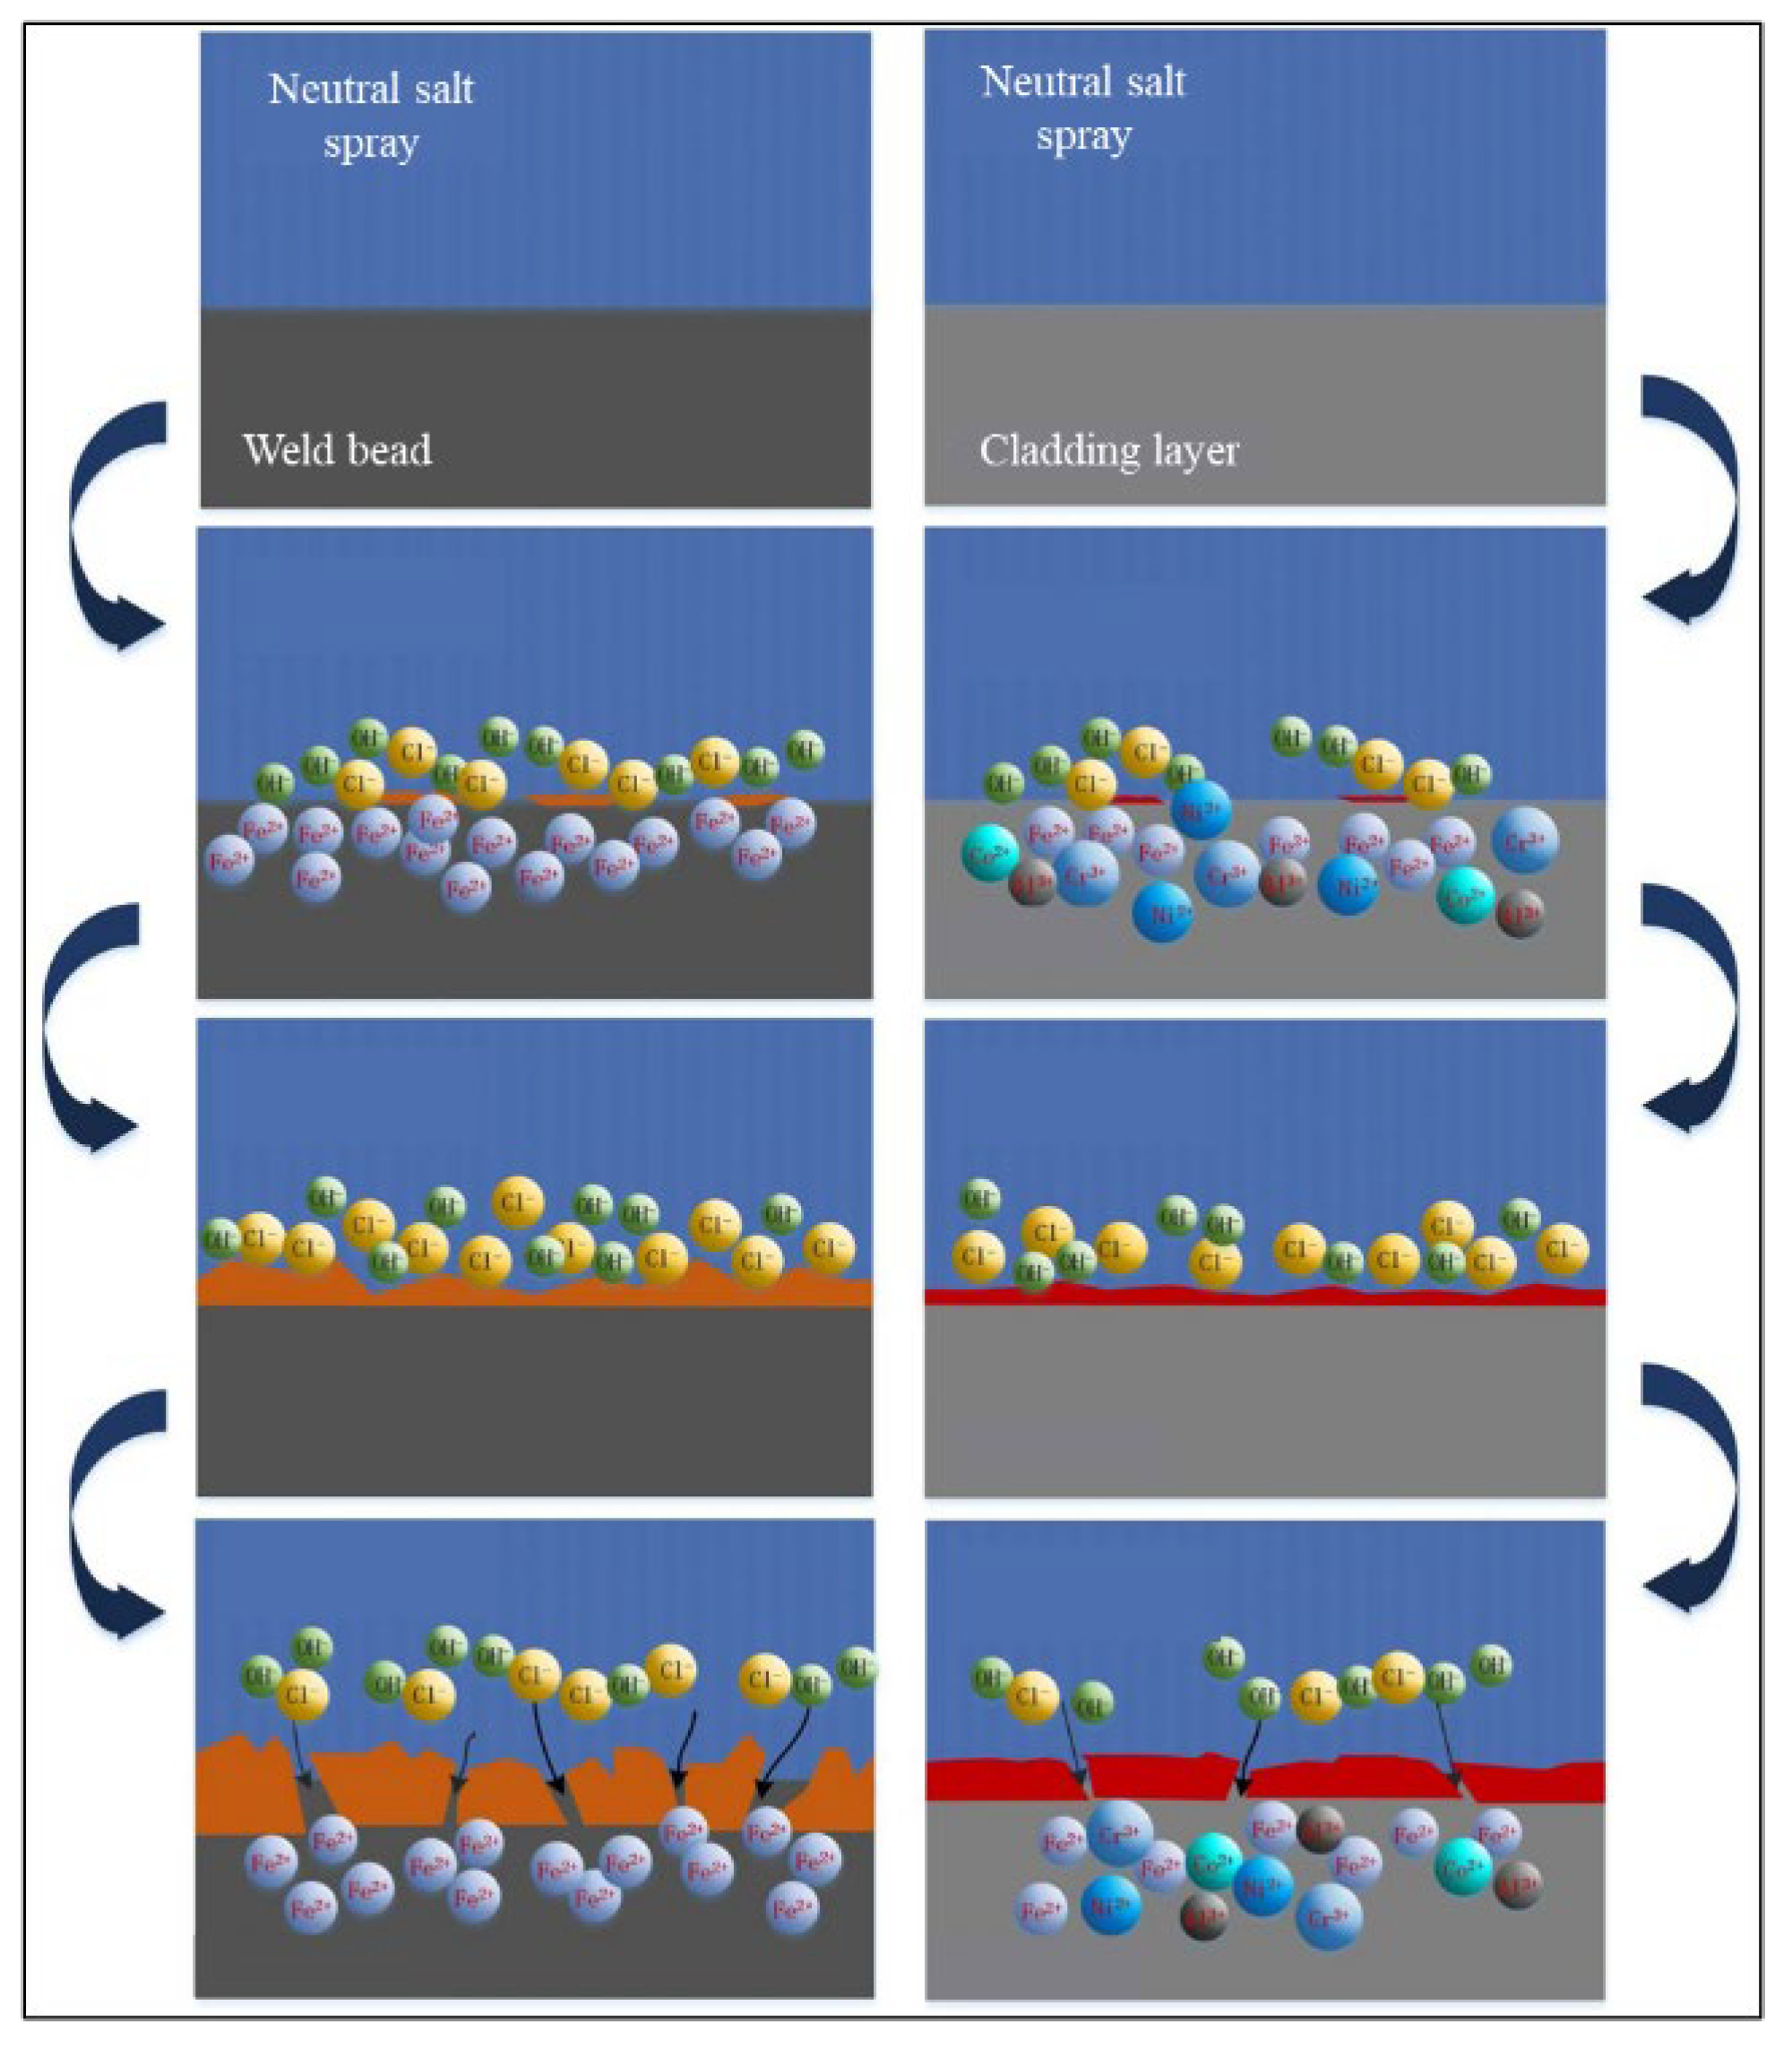
3.3.2. Corrosion Resistance of HEA Layers in Simulated Marine Atmospheric Environment

Figure 13 shows the superficial macro appearance of the cladding layers with different Cr content after 168 and 600 h in the corrosive environment. When the corrosion time is 168 h, the layers still show metallic luster with no obvious corrosion products on the surface. When the corrosion time is prolonged to 600 h, the red-brown corrosion products could be observed. When x = 1, the corrosion degree is the most serious, and the surface is covered by uniform corrosion products with a coverage rate of 96%, while the products are less with a coverage of 40% when x = 1. The corrosion resistance of the layers increases firstly and then decreases with the increase of Cr content in the powder, which is consistent with the results obtained by electrochemical corrosion tests.
Figure 14 illustrates the corrosion superficial micro morphologies of layers. When x = 1 and x = 2, the surfaces are covered by more loose corrosion products, making the surfaces uneven with granular protrusions, so the protection effect is weak. However, there exists only a small area covered by the corrosion products when x = 1.5, which are relatively flat and light. Table 6 shows the composition of corrosion products by EDS. It can be seen from Table 6 that the presence of Na and Cl indicates that the corrosion surfaces are contaminated by salt particles. Besides, the contents of Fe and O are high, and Co, Cr, Ni and Al are all about 3%, with less content. This is because in the neutral salt spray environment, compared with other metal elements, the corrosion resistance of Fe is very poor and prone to corrosion so that the corrosion products on the surface of the layer are large amounts of iron oxides and few other metal oxides. When x = 1.5, the content of Fe decreases and other metals with good corrosion resistance, especially Cr, increases significantly, which generate dense and stable passivation film to hinder the corrosion reaction and reduce the reaction rate, effectively protecting the cladding layer inside. According to the measurement results of the actual elements of different layers above, when x = 1.5, the actual Cr element content is the highest, which can improve its corrosion resistance accordingly.

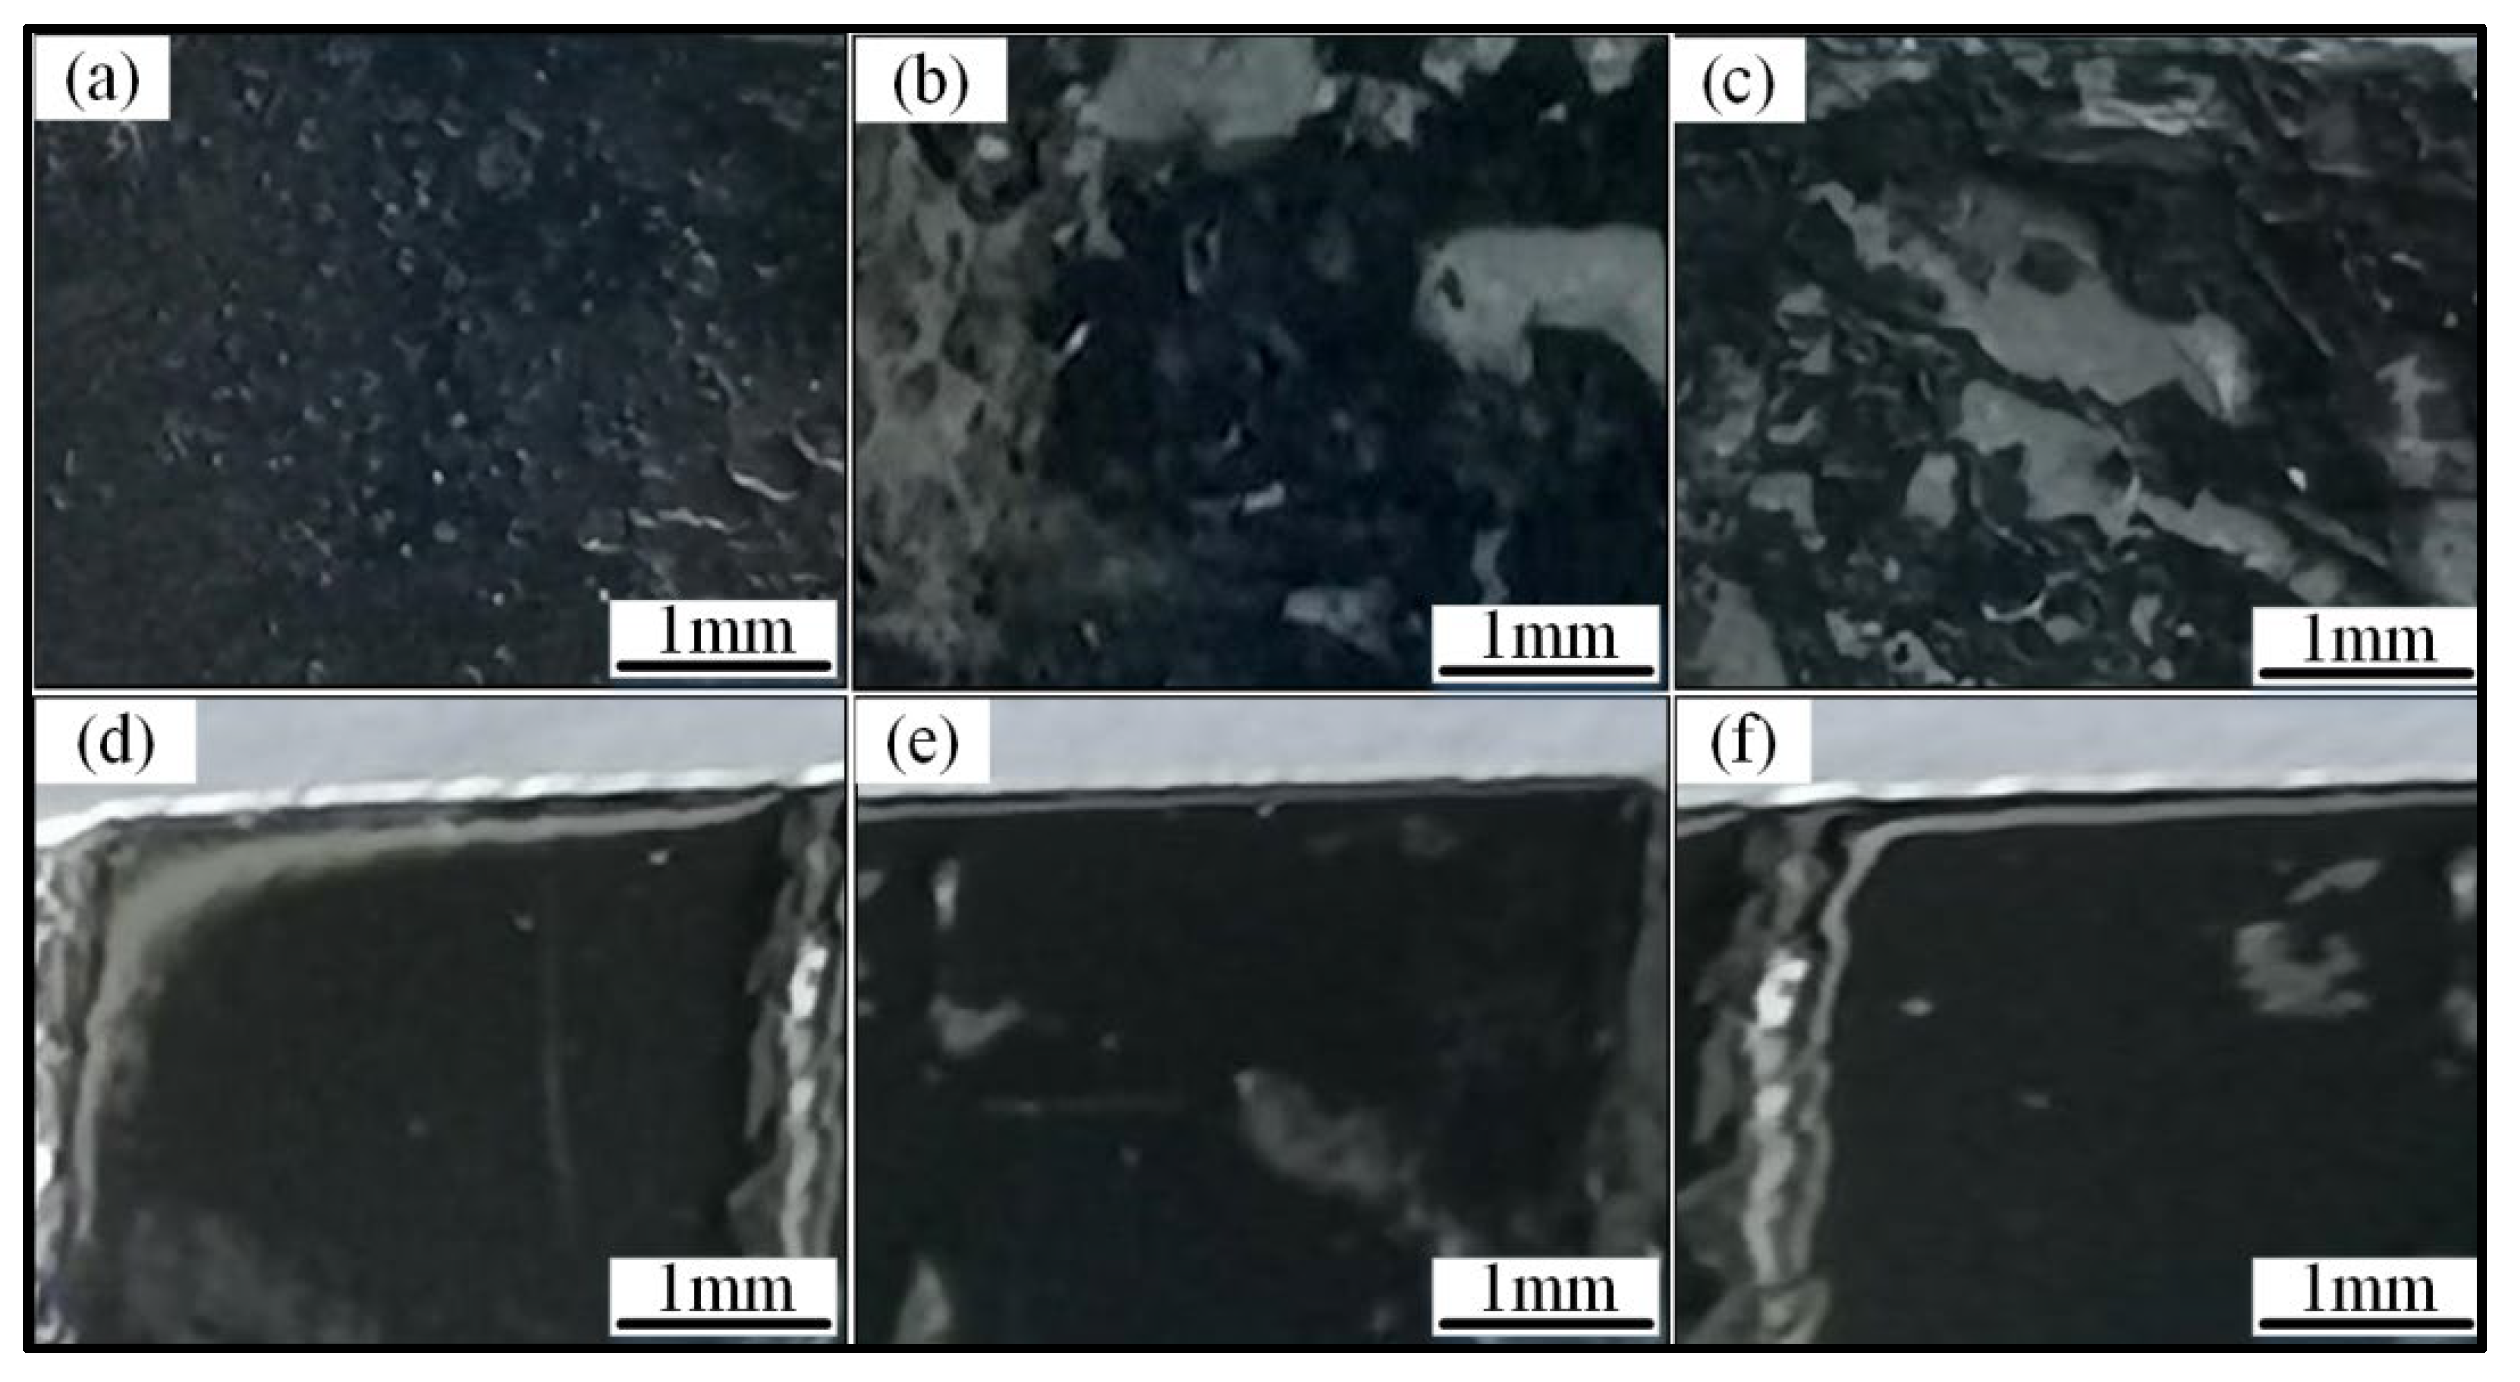
3.4. Comparative Study on Corrosion Resistance Improvement in Different Areas of Welded Joint

The electrochemical corrosion experiments of different regions of welded joint and coatings on them are carried out to investigate the protection efficiencies of the cladding layers on the WB, HAZ and BM. The calculation formula of protection efficiencies (PE) is as follows:
P E = [ 1 i corr ( coated ) / i corr ( uncoated ) ] × 100 %
where i corr ( coated ) represents the self-corrosion current density of the welded joint with coatings on it, and i corr ( uncoated ) represents the self-corrosion current density of the welded joint without protection.
The protection efficiencies are 99.1, 98.4 and 96.6% respectively, as shown in Figure 15. The protection efficiencies are more than 95%, indicating that the cladding layers effectively protect the various regions of the welded joint, especially the WB region. Figure 16 and Figure 17 show the superficial morphologies after 168 and 600 h corrosion. When serious corrosion occurs in each area of the welded joint with a large number of black-brown products after 168 h corrosion, the HEA layers still show metallic luster. The coverage area of corrosion products on the HAZ and BM is only about 5%. After 600 h corrosion, each region of the welded joint is covered with thicker corrosion products, while the corrosion products are less with a smaller thickness on the surfaces of the HEA layers.
The corrosion mechanism of the welded joint and its cladding layers in the neutral salt spray environment is illustrated in Figure 18. The Fe element in the welded joint reacts quickly and generate the passivation film that is unstable and easy to be destroyed. The cracks occur and provide the channel for the corrosion medium. By contrast, the cladding layer is relatively stable making the corrosion reaction occur slowly, and the passivation film formed by Fe, Cr, Ni, Co and Al elements in the corrosion environment is smooth and compact, which is not easy to crack, effectively hindering the corrosion reaction. Therefore, compared with the welded joint, the corrosion resistance of the cladding layers is better.

4. Conclusions

The laser cladding technique is used to melt the high-entropy alloy in each region of the welded joint. The corrosion resistance and mechanism of welded joint and laser cladding HEA layers with different Cr content are investigated, and the effects of Cr content on the microstructure and mechanical properties are also explored. The conclusions are as follows:
(1)
The layer has the good metallurgical bonding with plate, with no obvious defects in the cross section of the cladding layer. The increase of Cr element can promote the formation of BCC phase in the HEA layer contributing to the improvement of hardness and wear resistance.
(2)
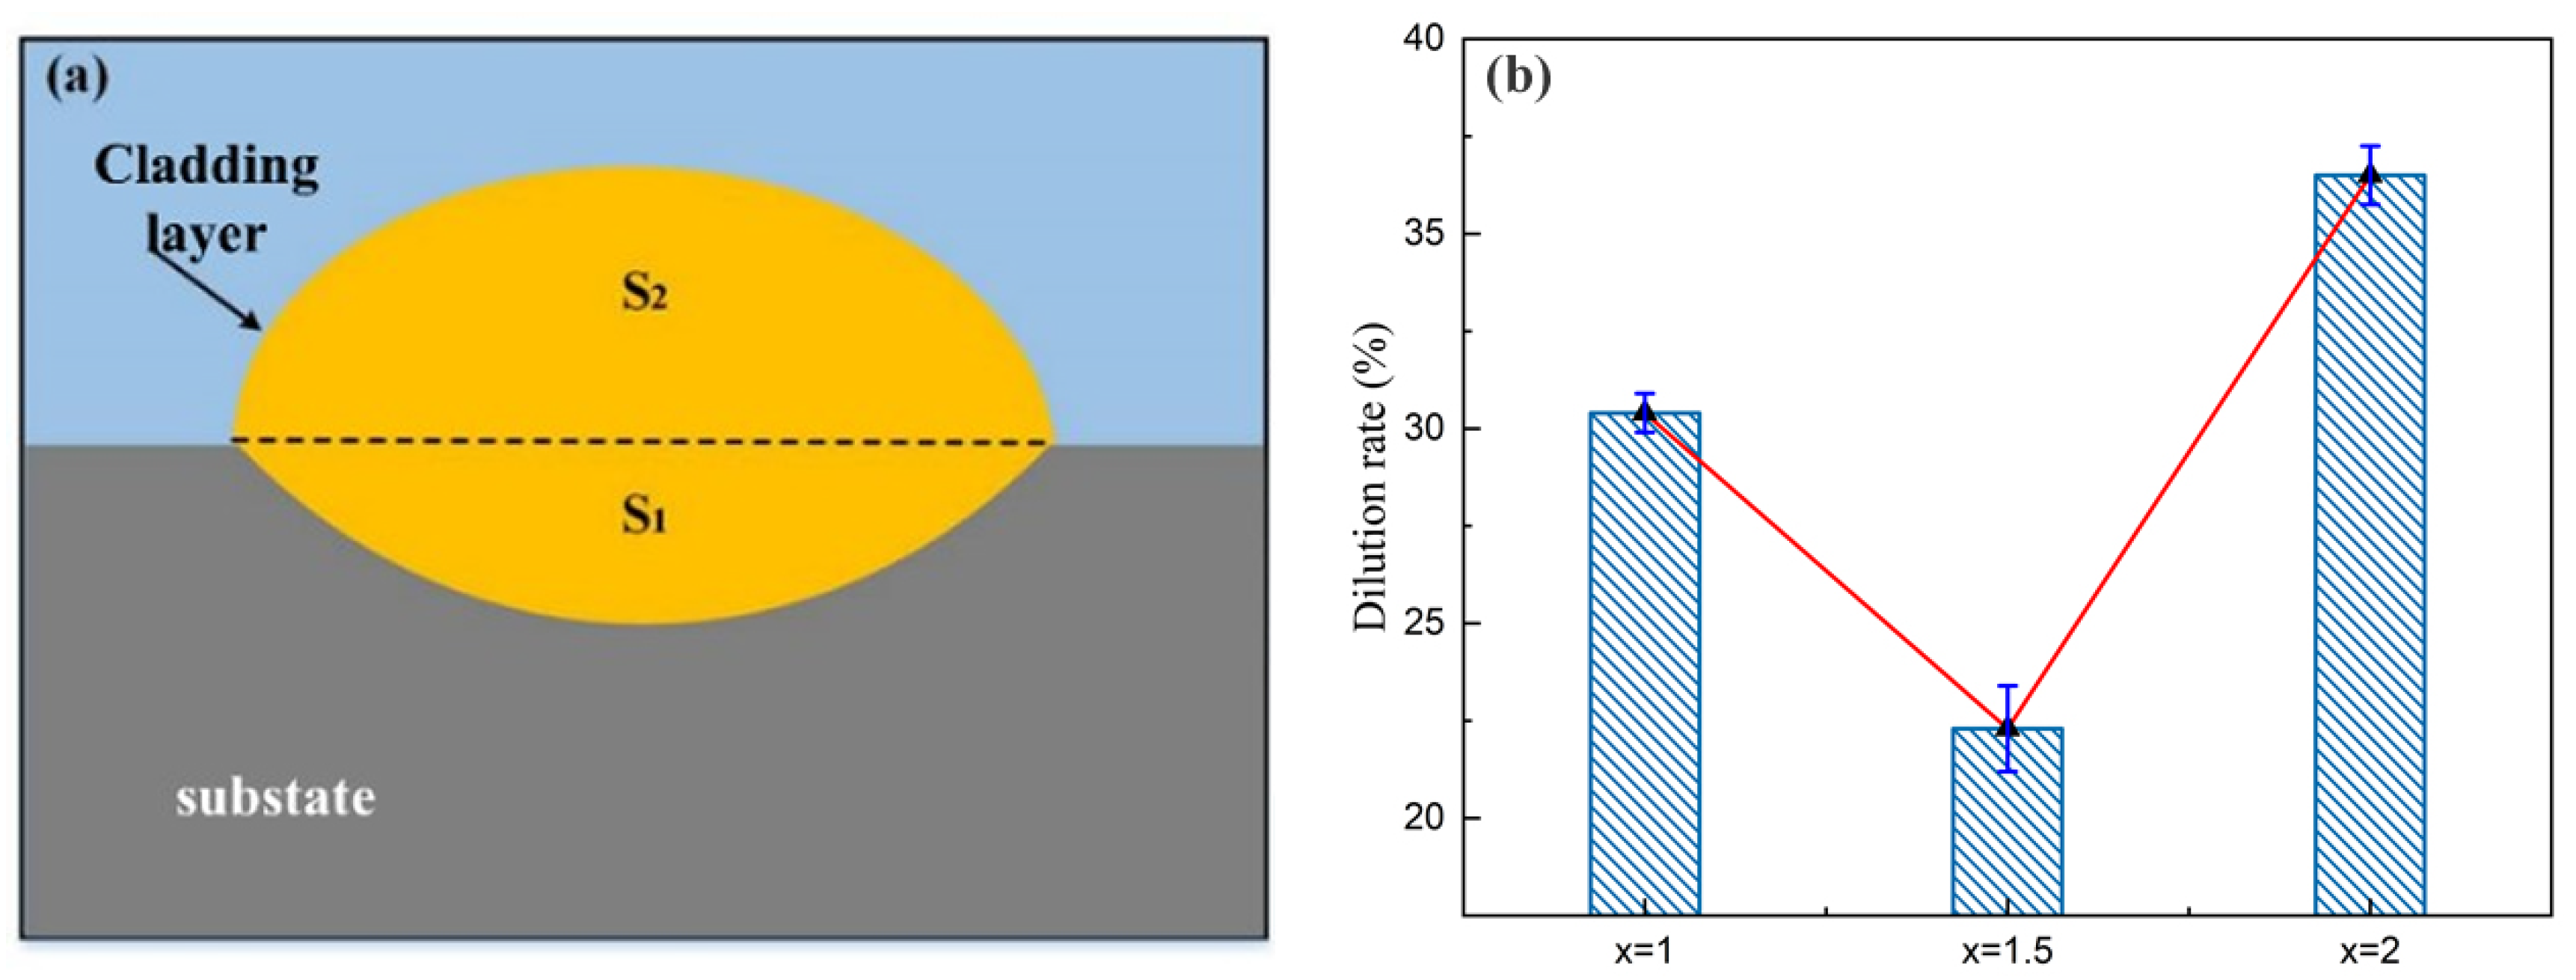
In the electrochemical corrosion test, the corrosion potential of the cladding layers increases at first and then decreases with the increase of Cr content in the powder, while the self-corrosion current displays the opposite trend. According to the results of neutral salt spray experiment, the corrosion resistance shows the same tendency as the above-mentioned with the increase of Cr content, and the corrosion degree is the lightest when x = 1.5. Due to the different dilution rate, the actual Cr content in the layers is different from the theoretical value. With the increase of the actual Cr content, the corrosion resistance is enhanced.
(3)
Laser cladding of FeCoCrxNiAl HEA on the surfaces of welded joint and the electrochemical corrosion test are carried out to explore the enhancing effect of cladding layers on different regions of welded joint. The protective efficiencies on the WB, HAZ and BM are 99.1, 98.4 and 96.6%, respectively. In the neutral salt spray test, compared with the layers, the corrosion degree of welded joint is more serious, and the corrosion products are basically iron oxides. While the corrosion products of the cladding layers are iron oxides and a small amount of Co, Cr, Ni and Al oxides.
Due to the limited time, there are still some shortcomings, mainly including the following points:
(1)
In order to further study the corrosion resistance of high entropy alloy repair layer, the corrosion behavior in corrosive environment at different time can be considered in the future study.
(2)
In this paper, the composition ratio of high-entropy alloy powder is designed to study the corrosion resistance of the repair layer. Subsequently, the effects of different laser power, scanning speed and different powder feeding amount on the corrosion resistance of the repair layer can be considered.
(3)
This paper mainly uses experimental methods to study the corrosion resistance of high-entropy alloy repair layer. The following work can be focused on the software used to simulate the corrosion behavior of repair layer.

Author Contributions

Conceptualization, Q.B. and Y.W.; Methodology, L.S. and Y.Z.; Formal Analysis, Q.B.; Investigation, Q.B. and Y.W.; Writing—Original Draft Preparation, Q.B.; Writing—Review snf Editing, L.W.; Project Administration, X.Z.; Funding Acquisition, L.W. All authors have read and agreed to the published version of the manuscript.

Funding

This research was funded by Natural Science Foundation of Jiangsu Province (grant number BK20200431), Foundation of National Key Laboratory of Science and Technology on Helicopter Transmission (grant number HTL-A-22G08), Central Government Guides Local Science and Technology Development Funds to Freely Explore Basic Research Projects (grant number 2021Szvup059) and the Foundation of Doctor of Entrepreneurship and Innovation in Jiangsu Province (grant number JSSCBS20210177).

Data Availability Statement

Not applicable.

Conflicts of Interest

The authors declare no conflict of interest.

References

  1. Wang, W.R.; Wang, W.L.; Wang, S.C.; Tsai, Y.C.; Lai, C.H.; Yeh, J.W. Effects of Al addition on the microstructure and mechanical property of AlxCoCrFeNi high-entropy alloys. Intermetallics 2012, 26, 44–51. [Google Scholar] [CrossRef]
  2. Fu, Z.Q.; Chen, W.P.; Fang, S.C.; Zhang, D.Y.; Xiao, H.Q.; Zhu, D.Z. Alloying behavior and deformation twinning in a CoNiFeCrAl0.6Ti0.4 high entropy alloy processed by spark plasma sintering. J. Alloy. Compd. 2013, 553, 316–323. [Google Scholar] [CrossRef]
  3. Shi, Y.Z.; Yang, B.; Xie, X.; Brechtl, J.; Dahmen, K.A.; Liaw, P.K. Corrosion of AlxCoCrFeNi high-entropy alloys: Al-content and potential scan-rate dependent pitting behavior. Corros. Sci. 2017, 119, 33–45. [Google Scholar] [CrossRef]
  4. Ye, Q.; Feng, K.; Li, Z.; Lu, F.; Li, R.; Huang, J.; Wu, Y. Microstructure and corrosion properties of CrMnFeCoNi high entropy alloy coating. Appl. Surf. Sci. 2017, 396, 1420–1426. [Google Scholar] [CrossRef]
  5. Dobbelstein, H.; Gurevich, E.L.; George, E.P.; Ostendorf, A.; Laplanche, G. Laser metal deposition of a refractory TiZrNbHfTa high-entropy alloy. Addit. Manuf. 2018, 24, 386–390. [Google Scholar] [CrossRef]
  6. Yeh, J.W.; Chen, S.K.; Lin, S.J.; Gan, J.Y.; Chin, T.S.; Shun, T.T.; Tsau, C.H.; Chang, S.Y. Nanostructured High-Entropy Alloys with Multiple Principal Elements: Novel Alloy Design Concepts and Outcomes. Adv. Eng. Mater. 2004, 6, 299–303. [Google Scholar] [CrossRef]
  7. Liu, J.; Liu, H.; Chen, P.; Hao, J. Microstructural characterization and corrosion behaviour of AlCoCrFeNiTix high-entropy alloy coatings fabricated by laser cladding. Surf. Coat. Technol. 2019, 361, 63–74. [Google Scholar] [CrossRef]
  8. Liu, H.; Liu, J.; Chen, P.J.; Yang, H.F.; Hao, J.B.; Tian, X.H. Microstructure and Properties of AlCoCrFeNiTi High-Entropy Alloy Coating on AISI1045 Steel Fabricated by Laser Cladding. J. Mater. Eng. Perform. 2019, 28, 1544–1552. [Google Scholar] [CrossRef]
  9. Anupam, A.; Kottada, R.S.; Kashyap, S.; Meghwal, A.; Murty, B.S.; Berndt, C.C.; Ang, A.S.M. Understanding the microstructural evolution of high entropy alloy coatings manufactured by atmospheric plasma spray processing. Appl. Surf. Sci. 2020, 505, 144117. [Google Scholar] [CrossRef]
  10. Wang, W.R.; Qi, W.; Xie, L.; Yang, X.; Li, J.T.; Zhang, Y. Microstructure and Corrosion Behavior of (CoCrFeNi)(95)Nb-5 High-Entropy Alloy Coating Fabricated by Plasma Spraying. Materials 2019, 12, 694. [Google Scholar] [CrossRef] [Green Version]
  11. Dou, B.; Zhang, H.; Zhu, J.H.; Xu, B.Q.; Zhou, Z.Y.; Wu, J.L. Uniformly Dispersed Carbide Reinforcements in the Medium-Entropy High-Speed Steel Coatings by Wide-Band Laser Cladding. Acta Metall. Sin.-Engl. Lett. 2020, 33, 1145–1150. [Google Scholar] [CrossRef]
  12. Gao, J.L.; Wu, C.Z.; Hao, Y.B.; Xu, X.C.; Guo, L.J. Numerical simulation and experimental investigation on three-dimensional modelling of single-track geometry and temperature evolution by laser cladding. Opt. Laser Technol. 2020, 129, 106287. [Google Scholar] [CrossRef]
  13. Savrai, R.A.; Soboleva, N.N.; Malygina, I.Y.; Osintseva, A.L. The structural characteristics and contact loading behavior of gas powder laser clad CoNiCrW coating. Opt. Laser Technol. 2020, 126, 106079. [Google Scholar] [CrossRef]
  14. Deng, X.K.; Zhang, G.J.; Wang, T.; Ren, S.; Bai, Z.L.; Cao, Q. Investigations on microstructure and wear resistance of Fe-Mo alloy coating fabricated by plasma transferred arc cladding. Surf. Coat. Technol. 2018, 350, 480–487. [Google Scholar] [CrossRef]
  15. Gao, L.B.; Song, J.; Jiao, Z.B.; Liao, W.B.; Luan, J.H.; Surjadi, J.U.; Li, J.Y.; Zhang, H.T.; Sun, D.; Liu, C.T.; et al. High-Entropy Alloy (HEA)-Coated Nanolattice Structures and Their Mechanical Properties. Adv. Eng. Mater. 2018, 20, 1700625. [Google Scholar] [CrossRef]
  16. Senkov, O.N.; Wilks, G.B.; Miracle, D.B.; Chuang, C.P.; Liaw, P.K. Refractory high-entropy alloys. Intermetallics 2010, 18, 1758–1765. [Google Scholar] [CrossRef]
  17. Fujieda, T.; Shiratori, H.; Kuwabara, K.; Hirota, M.; Kato, T.; Yamanaka, K.; Koizumi, Y.; Chiba, A.; Watanabe, S. CoCrFeNiTi-based high-entropy alloy with superior tensile strength and corrosion resistance achieved by a combination of additive manufacturing using selective electron beam melting and solution treatment. Mater. Lett. 2017, 189, 148–151. [Google Scholar] [CrossRef]
  18. Varallyay, Z.; Szabo, A.; Rosales, A.; Gonzales, E.; Tobioka, H.; Headley, C. Accurate modeling of cladding pumped, star-shaped, Yb-doped fiber amplifiers. Opt. Fiber Technol. 2015, 21, 180–186. [Google Scholar] [CrossRef]
  19. Pinkerton, A.J. Advances in the modeling of laser direct metal deposition. J. Laser Appl. 2015, 27, S15001. [Google Scholar] [CrossRef]
  20. Sanecki, P.T.; Gibala, K.; Skital, P.M. The Application of Metal Deposition in Optical Sensor Technique. The Microscale Cu Deposition as “Electrochemical Welding”. IEEE Sens. J. 2015, 15, 1275–1279. [Google Scholar] [CrossRef]
  21. Jheng, D.Y.; Hsu, K.Y.; Liang, Y.C.; Huang, S.L. Broadly Tunable and Low-Threshold Cr4+:YAG Crystal Fiber Laser. IEEE J. Sel. Top. Quantum Electron. 2015, 21, 16–23. [Google Scholar] [CrossRef]
  22. Wang, B.A.; Zhang, W.G.; Bai, Z.Y.; Wang, L.; Zhang, L.Y.; Zhou, Q.; Chen, L.; Yan, T.Y. CO2-Laser-Induced Long Period Fiber Gratings in Few Mode Fibers. IEEE Photonics Technol. Lett. 2015, 27, 145–148. [Google Scholar] [CrossRef]
  23. Zhang, H.; Zou, Y.; Zou, Z.D.; Zhao, W. Comparative study on continuous and pulsed wave fiber laser cladding in-situ titanium-vanadium carbides reinforced Fe-based composite layer. Mater. Lett. 2015, 139, 255–257. [Google Scholar] [CrossRef]
  24. Chaves, I.A.; Melchers, R.E. Pitting corrosion in pipeline steel weld zones. Corros. Sci. 2011, 53, 4026–4032. [Google Scholar] [CrossRef]
  25. Fan, E.; Zhao, Q.; Wang, S.; Liu, B.; Yang, Y.; Huang, Y.; Luo, H.; Li, X. Investigation of the Hydrogen-Induced Cracking of E690 Steel Welded Joint in Simulated Seawater. Mater. Sci. Eng. A 2022, 143802. [Google Scholar] [CrossRef]
  26. Lu, Y.X.; Jing, H.Y.; Han, Y.D.; Xu, L.Y. Effect of Welding Heat Input on the Corrosion Resistance of Carbon Steel Weld Metal. J. Mater. Eng. Perform. 2016, 25, 565–576. [Google Scholar] [CrossRef]
  27. Qiu, X.-W.; Zhang, Y.-P.; He, L.; Liu, C.-g. Microstructure and corrosion resistance of AlCrFeCuCo high entropy alloy. J. Alloy. Compd. 2013, 549, 195–199. [Google Scholar] [CrossRef]
  28. Wu, C.L.; Zhang, S.; Zhang, C.H.; Chen, J.; Dong, S.Y. Phase evolution characteristics and corrosion behavior of FeCoCrAlCu-X0.5 coatings on cp Cu by laser high-entropy alloying. Opt. Laser Technol. 2017, 94, 68–71. [Google Scholar] [CrossRef]
  29. Qiu, X.-w.; Wu, M.-j.; Liu, C.-g.; Zhang, Y.-p.; Huang, C.-x. Corrosion performance of Al2CrFeCoxCuNiTi high-entropy alloy coatings in acid liquids. J. Alloy. Compd. 2017, 708, 353–357. [Google Scholar] [CrossRef]
  30. Bao, Y.; Ji, X.; Ji, C.; Zhao, J.; Cheng, J.; Xu, L. Corrosion and slurry erosion properties of FeCrNiCoCuAl_x high-entropy alloy coatings prepared by laser cladding. J. Mater. Eng. 2019, 47, 141–147. [Google Scholar]
  31. Gu, Z.; Mao, P.; Gou, Y.; Chao, Y.; Xi, S. Microstructure and properties of MgMoNbFeTi2Yx high entropy alloy coatings by laser cladding. Surf. Coat. Technol. 2020, 402, 126303. [Google Scholar] [CrossRef]
  32. Wang, Q.; Zhou, X.; Ma, Q.; Wu, T.; Liu, M.; Zhang, M.; Li, Z.; Yin, F. Selected Corrosion of X80 Pipeline Steel Welded Joints Induced by Desulfovibrio Desulfuricans. Corros. Sci. 2022, 202, 110313. [Google Scholar] [CrossRef]
  33. Shen, K.; Jiang, W.; Sun, C.; Zhao, W.; Sun, J. Unlocking the Influence of Microstructural Evolution on Hardness and Pitting Corrosion in Duplex Stainless Welded Joints. Corros. Sci. 2022, 206, 110532. [Google Scholar] [CrossRef]
  34. Zong, L.; Shi, G.; Wang, Y. Experimental Investigation on Fatigue Crack Behavior of Bridge Steel Q345qD Base Metal and Butt Weld. Mater. Des. 2015, 66, 196–208. [Google Scholar] [CrossRef]
  35. Zhang, M.; Wang, D.; He, L.; Ye, X.; Ouyang, W.; Xu, Z.; Zhang, W.; Zhou, X. Microstructure and Elevated Temperature Wear Behavior of Laser-Cladded AlCrFeMnNi High-Entropy Alloy Coating. Opt. Laser Technol. 2022, 149, 107845. [Google Scholar] [CrossRef]
  36. Kołodziejczak, P.; Golanski, D.; Chmielewski, T.; Chmielewski, M. Microstructure of Rhenium Doped Ni-Cr Deposits Produced by Laser Cladding. Materials 2021, 14, 2745. [Google Scholar] [CrossRef]
Figure 1. SEM images of HEA powder with different element contents. (a) FeCoCrNiAl; (b) FeCoCr1.5NiAl; (c) FeCoCr2NiAl.
Metals 12 01428 g001
Figure 2. Laser cladding equipment.
Metals 12 01428 g002
Figure 3. Schematic diagram and experiment processes. (a) Schematic diagram of laser cladding; (b) specific experimental processes.
Metals 12 01428 g003
Figure 4. The working principle of corrosion resistance tests. (a) Working principle of salt spray test chamber; (b) schematic diagram of electrochemical test.
Metals 12 01428 g004
Figure 5. Macroscopic morphology of cladding layers with different Cr content. (a,d) x = 1; (b,e) x = 1.5; (c,f) x = 2.
Metals 12 01428 g005
Figure 6. Dilution rate of cladding layer with different Cr content. (a) Simplified schematic diagram of cross-sectional profile; (b) column diagram of dilution rate.
Metals 12 01428 g006
Figure 7. Microstructures in different regions of layers with different Cr content. (a,b) x = 1; (c,d) x = 1.5; (e,f) x = 2.
Metals 12 01428 g007
Figure 8. XRD patterns of HEA coatings with different Cr content.
Metals 12 01428 g008
Figure 9. Average microhardness of welded joint and cladding layers with different Cr content.
Metals 12 01428 g009
Figure 10. Wear resistance of welded joint and cladding layers with different Cr content. (a) Relationship between friction coefficient and time; (b) wear amount.
Metals 12 01428 g010
Figure 11. Wear morphologies of Q345 welded joint and cladding layers with different Cr content. (a,b) Q345 weld; (c,d) x = 1; (e,f) x = 1.5; (g,h) x = 2.
Metals 12 01428 g011
Figure 12. The curves of cladding layers with different Cr content in 3.5 wt.% NaCl solution obtained from electrochemical corrosion experiment. (a) Polarization curves; (b) the Nyquist plots; (c) Bode diagrams (d) Bode phase diagrams.
Metals 12 01428 g012
Figure 13. Macro morphologies of cladding layers with different Cr content in different corrosion time. In the figure, x = 1, x = 1.5 and x = 2 respectively represent the molar coefficients of Cr in the HEA coating. Additionally, 168 and 600 h respectively represent the time length of the corrosion experiment.
Metals 12 01428 g013
Figure 14. Corrosion micro morphologies of cladding layers with different Cr content after salt spray test in different corrosion time. (a) x = 1, t = 168 h; (b) x = 1.5, t = 600 h; (c) x = 2, t = 600 h; (d) x = 1, t = 600 h; (e) x = 1.5, t = 600 h; (f) x = 2, t = 600 h.
Metals 12 01428 g014
Figure 15. Protection efficiencies of HEA layers on various regions of welded joint.
Metals 12 01428 g015
Figure 16. Surface morphologies of welded joint and HEA layers after 168 h corrosion: (a) weld bead; (b) heat-affected zone; (c) base metal; (d) cladding layer on WB; (e) cladding layer on HAZ; (f) cladding layer on BM.
Metals 12 01428 g016
Figure 17. Surface morphologies of welded joint and HEA layers after 600 h corrosion: (a) welded bead; (b) heat-affected zone; (c) base metal; (d) cladding layer on WB; (e) cladding layer on HAZ; (f) cladding layer on BM.
Metals 12 01428 g017
Figure 18. Corrosion schematic diagram of welded joint and cladding layers in neutral salt spray environment.
Metals 12 01428 g018
Table 1. The welding parameters of MIG welding experiment.
Heat SourceCurrent
(a)
Voltage
(V)
Welding Gap (mm)Wire Extension (mm)Protective Gas Flow Rate (L/min)
MIG2052311220
Table 2. Chemical composition of FeCoCrxNiAl powder (Mole%).
No.CompositionFeCoCrNiAl
1FeCoCrNiAl2020202020
2FeCoCr1.5NiAl18.218.227.218.218.2
3FeCoCr2NiAl16.716.733.216.716.7
Table 3. Experimental parameters of laser cladding.
Heat SourceLaser Power
(KW)
Scanning Speed (mm/s)Powder Feeding (r/min)Protective Gas Flow Rate (L/min)
Laser100040.420
Table 4. Actual element content of cladding layers with different Cr contents determined by EDS (wt.%).
Cr ContentFeCoCrNiAl
x = 144.3413.6817.6715.149.17
x = 1.528.4917.9024.2417.5411.83
x = 252.9410.1820.839.356.70
Table 5. The electrochemical parameters of the cladding layers with different Cr content in 3.5 wt % NaCl solution.
Cr ContentEcorr (V)Icorr (A/cm2)
x = 1−0.4851.297 × 10−5
x = 1.5−0.2972.567 × 10−6
x = 2−0.4236.983 × 10−6
Table 6. Corrosion products of cladding layers by EDS (wt.%).
Cr ContentFeCoCrNiAlONaCl
x = 143.783.584.93.592.7538.671.591.14
x = 1.533.033.658.913.813.9237.484.514.69
x = 240.932.815.052.832.7738.543.763.31
Publisher’s Note: MDPI stays neutral with regard to jurisdictional claims in published maps and institutional affiliations.

