Article

Numerical Simulation of Temperature Field and Melt Pool Characteristics of CP-Ti Manufactured by Laser Powder Bed Fusion

1
School of Material and Metallurgy, Inner Mongolia University of Science and Technology, Baotou 014010, China
2
Inner Mongolia Autonomous Region Key Laboratory of Advanced Metal Materials, Baotou 014010, China
3
Collaborative Innovation Center of Integrated Exploitation of Bayan Obo Multi-Metal Resources, Inner Mongolia University of Science and Technology, Baotou 014010, China
*
Authors to whom correspondence should be addressed.
Metals 2023, 13(1), 11; https://doi.org/10.3390/met13010011
Submission received: 22 November 2022 / Revised: 15 December 2022 / Accepted: 16 December 2022 / Published: 20 December 2022
(This article belongs to the Special Issue Hot Forming/Processing of Metallic Materials)

Abstract

:
A coupled heat source model that combined a Gauss surface heat source with a Gauss cylindrical volumetric heat source was introduced to simulate temperature field distribution and melt pool characteristics using a finite element simulation (FEM) method for the deep and narrow melt pools formed in laser powder bed fusion (L-PBF) aiming at commercial pure titanium (CP-Ti). For comparison, the same simulations using the Gauss surface heat source model and the double ellipsoid heat source model were also performed. The simulated melt pool geometries using the coupled heat source model match well with the measurements, with an average error of 1% for the melt pool depth and 7% for the width. Based on the single-track experimental results, it was found by comparing the simulated results from the three heat source models that the coupled heat source model had better accuracy than the other two. Then, the temperature field and the melt pool geometries of CP-Ti fabricated at different laser power levels from 300 W to 500 W and scanning speeds from 600 mm/s to 4000 mm/s were simulated. According to the simulated maximum temperature and geometries of the melt pool, a suitable process parameters map for CP-Ti was obtained. The reported experimental results agree well with the simulated map. The coupled heat source model is more accurate and applicable for the deep and narrow melt pools formed during L-PBF.

1. Introduction

Laser powder bed fusion (L-PBF) is a powder bed fusion-based laser additive manufacturing (AM) technology, which can directly fabricate dense parts with an almost arbitrary shape, good metallurgical bonding, high precision, and good surface quality [1,2]. The L-PBF process is subjected to a fast-changing high-temperature environment, where many types of defects such as porosities and cracks are prone to form [3]. It has been well-accepted that the formability and microstructure of parts fabricated by L-PBF are closely related to the temperature field and the characteristics of the melt pools, which can be controlled by the process parameters. Therefore, understanding the relationship of the process parameters with the temperature field and the characteristics of the melt pools is significant for improving the formability of the parts [4]. However, the dynamic evolution of the melt pools in the L-PBF process is difficult to study via experiments due to the rapid heating and cooling in the manufacturing process and its micron-scale size, which is usually less than 100 μm [5]. Alternatively, numerical simulation is an effective way to investigate the dynamic evolution of the melt pools and has been widely used to tailor L-PBF manufacturing process parameters [6,7]. The finite element method (FEM) numerical simulation is widely used to study the temperature field and characteristics of the melt pools in the L-PBF process.
The heat source model imitating the laser irradiation is most critical for the simulated accuracy of L-PBF. In the actual manufacturing process, the geometry of the melt pool changes from shallow to deep and narrow depending on the process parameters [8]. This is dominated by different types of heat transfer, including surface heat absorption, Marangoni flow convection, and depression-zone heat absorption in the melt pool. In the surface heat absorption stage, the heat transfers from the laser through the upper surface into the interior of the melt pool with lower laser irradiation. Meanwhile, Marangoni flow is formed inside the melt pool, driven by the temperature gradient difference, which greatly improves heat transfer efficiency [9]. As the laser energy density increases, the recoil pressure causes the formation of a depression zone. A part of the laser irradiation enters the depressed zone and continuously reflects, resulting in a large amount of heat transferring to the melt pool from the depressed zone [6,10]. Therefore, a heat source model that fits the actual heat transfer of the melt pool as much as possible will enhance the simulated accuracy.
Based on the heat transfer characteristics of the melt pool, there are currently two main types of heat source models, which are the surface heat source and the volumetric heat source. The most prevalent surface heat source model is the Gaussian surface heat source model proposed by Pavelic in 1969 [11]. The Gaussian model is preferable for melt pools with a shallow shape [12,13,14]. However, the surface heat source has a low accuracy for deeper melt pools due to the heat flux of the Gaussian model; the surface heat source only transfers from the surface into the interior. Tran et al. [15] found that the simulated depths of melt pools are lower than the experimental measurements when using a surface heat source. Surface heat flux cannot penetrate the melt pool due to overlooking the Marangoni flow during surface heat source simulation. Alaa et al. [16] also found that the simulated melt pool depths of Ti-6Al-4V fabricated by L-PBF were lower than the actual measurements when using a surface heat source. Tseng et al. [7] reported that the widths of a Ti-6Al-4V fabricated by L-PBF melt pool simulated using a surface heat source were in good agreement with the experiments, but the simulated depths were obviously lower than the experimental measurements.
The most prevalent volumetric heat source model is the double ellipsoid heat source model proposed by Goldak [17] in 1984. To compensate for the absence of Marangoni flow, Goldak assigned the heat flux in the hemisphere below that of the surface. For L-PBF, the dual ellipsoid heat source model obtained good simulated results for melt pools with a shallow shape [18,19,20]. As the laser energy density increases, the simulation accuracy will decrease, because the drastic change of the melt pool shape makes it difficult for the ellipsoidal heat source to match [21]. More importantly, the simulated temperature distribution of deep and narrow melt pools will be abnormal. This is attributed to the fact that energy density always retains the Gaussian distribution in the build direction (BD). Therefore, the deeper the melt pool is the higher the temperature of the melt pool center will be. For deep and narrow melt pools, the double ellipsoid heat source imposed excessive heat in the center of the melt pool, leading to excessively simulated temperature [22]. To solve this problem, adding the recoil pressure to the heat source model has been applied in some studies [23,24]. Tan et al. [23] added a surface heat source and a recoil pressure source to accurately simulate the temperature field of the melt pool. The results showed that the recoil pressure made the melt pool deeper, achieving better simulation results. However, the limitation of this model is the complexity of modeling and the high computational cost. Alternatively, a few studies have employed a high-fidelity multiphysics model based on a ray-traced heat source that considered the refraction and absorption of laser light in the depression zone [6,25,26]. This approach is very useful for understanding the physical process and possible mechanisms involved. However, the huge computational costs limit its application for processing parameter optimization.
Numerical simulations of the temperature field and the characteristics of the melt pools in welding have been developed earlier than in L-PBF, and more detailed efforts have been put forth. The common heat source models cannot accommodate this situation. Coupled heat sources, a combination of two or multiple basic heat source models, have been successfully used to simulate a deep and narrow melt pool in laser welding [27,28,29]. Wang et al. [30] used a coupled heat source model that combined a Gaussian surface heat source, a cylindrical volumetric heat source, and a double ellipsoid heat source to simulate the inert-gas melt welding process of 6061-T6 aluminum alloy sheets. The Gaussian surface heat source of the coupled heat source model was used to characterize the arc heat flow on the surface. The cylindrical volumetric heat source and the double ellipsoid volumetric heat source were used to identify the filler metal droplet heat content. In addition, the coupled heat source models can be easily tailored for different types of melt pools with more flexibility. Thus, coupled heat source models have greater accuracy for almost all welding melt pools. The selection of the abovementioned coupled heat source models for welding provides a general idea of temperature-field simulation of deep and narrow melt pools in L-PBF.
In order to investigate the better applicability and higher accuracy of different heat source models for the deep and narrow melt pools in L-PBF, for simulation of the temperature field and the melt pool geometries using FEM, a coupled heat source was introduced in this work using the Gaussian surface heat source model and the double ellipsoid heat source model. Because deep and narrow melt pools are relatively common in titanium alloys fabricated by L-PBF [31], CP-Ti was selected as the research object.

2. Experimental Procedures

2.1. Feedstock Powder and L-PBF Process

Gas-atomized CP-Ti powder with particle size ranging from 15 μm to 53 μm provided by Vilory Advanced Materials Technology (Jiangsu, China) was used in the study. The chemical composition of the CP-Ti powder is listed in Table 1.
Single-track scanning experiments were performed using a Solution SLM280HL system (SLM Solutions Group AG, Lubeck, Germany), which was equipped with a 700 W fiber laser with a laser wavelength of 1070 ± 10 nm and a spot diameter of 80 μm. High-purity argon (99.99%) was used as the protection gas. Single-track experiments were prepared on a pure titanium substrate with a powder layer thickness of 50 μm. Laser power of 400 W and scanning speeds of 800, 1000, 1200, 1400, 1600, 1800, 2000, and 2200 mm/s were applied.

2.2. Microstructural Characterization

The single-track experimental samples were cut from the substrate along a direction parallel/vertical to the build direction (BD) for observation of the melt pools. SiC sandpapers with grit of 120, 240, 400, 600, 800, and 1000 were used for rough grinding of the samples. Then, the samples were polished using 0.05 μm SiO2 and etched for about 10–30 s using a Keller solution of HNO3:HF:H2O = 2:1:97 (volume fraction). The melt pool morphologies were observed using an Olympus OLS 4000 laser confocal microscope (Olympus, Tokyo, Japan).

3. Numerical Simulations
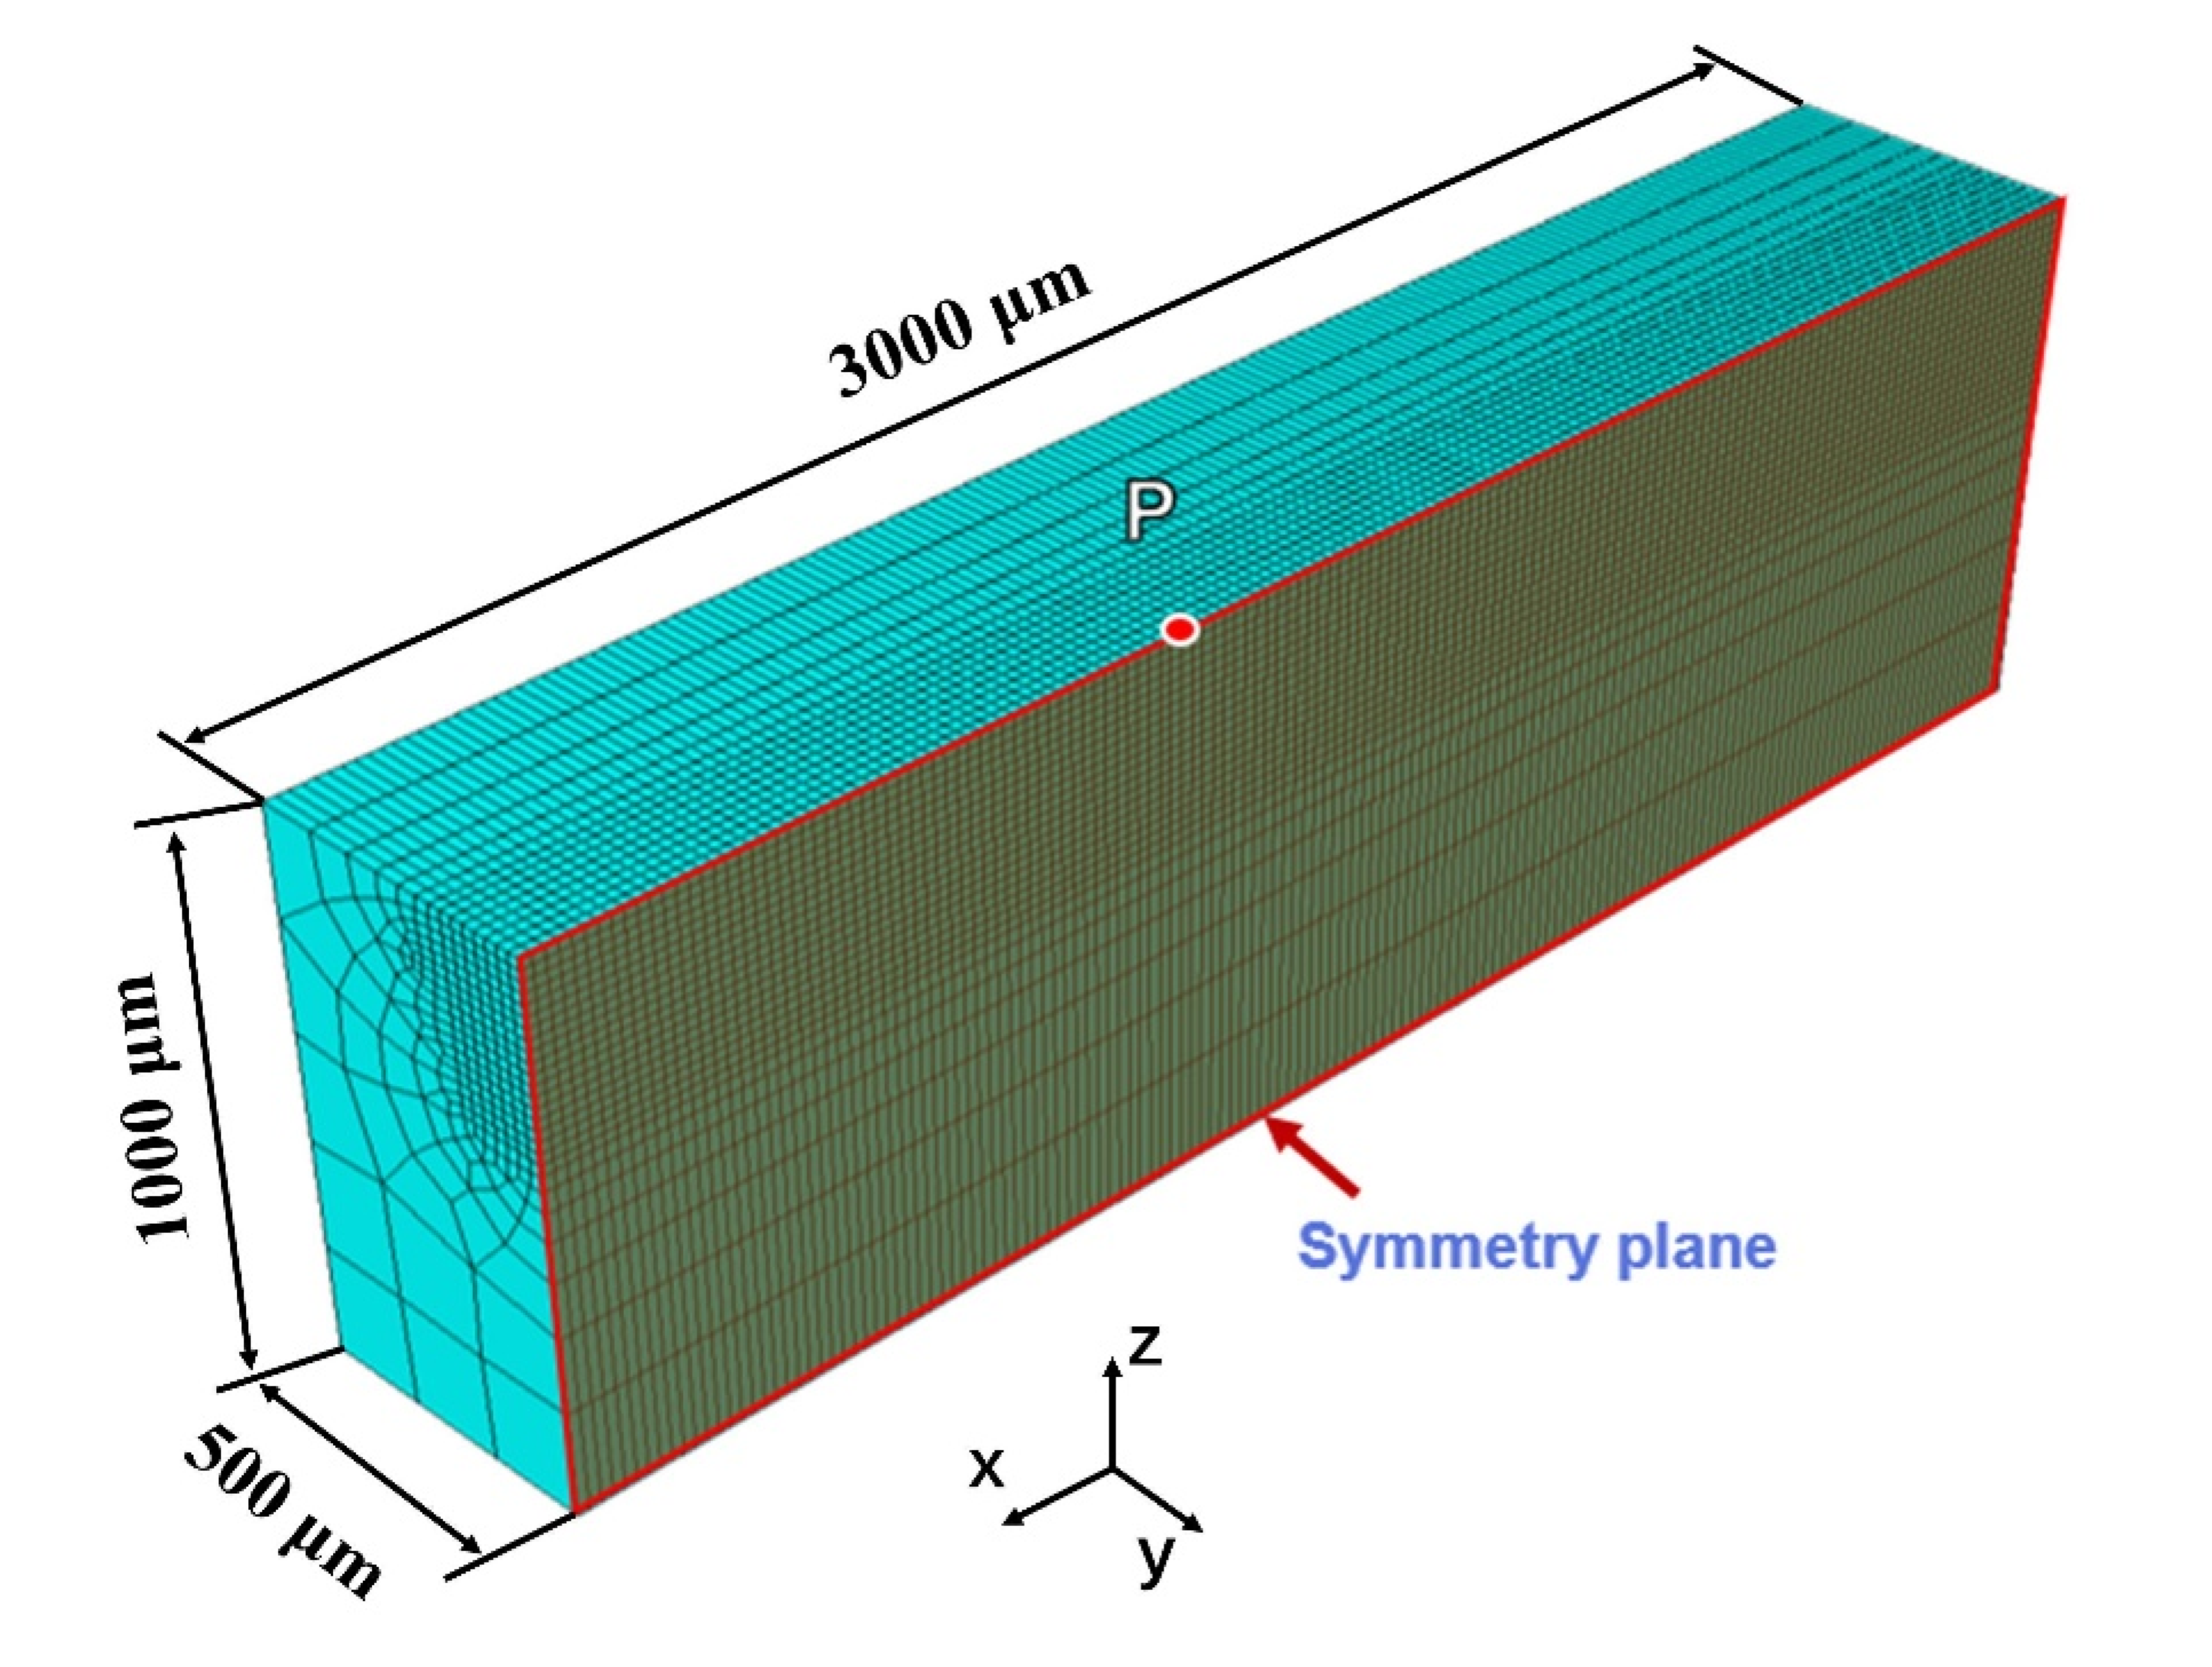
3.1. Model Creation

A single-track transient temperature field FEM model was established. To ensure adequate heat dissipation, the model length and width were built based on three times the maximum experimental measurements of the melt pool. The model and the corresponding mesh are shown in Figure 1. The model sizes were set to 500 × 1000 × 3000 μm with 34,200 elements, and a symmetrical design was used to reduce the amount of computation. The P point in Figure 1 was set up to output instantaneous temperatures to determine the temperature curves. The following assumptions were made when modeling: (1) the material’s physical parameters are isotropic; (2) the effect of metal flow on the temperature field was not considered; (3) the laser-induced recoil pressure was not considered; (4) the powder bed and the substrate were simplified as a homogeneous medium; (5) the effect of solid-state phase transformations of the materials was not considered. The process parameters used for the single-track simulation were a laser power of 300, 350, 400, 450, and 500 W and scanning speeds of 600, 800, 1000, 1200, 1400, 1600, 1800, 2000, 2200, 2400, 2600, 2800, 3000, 3200, 3400, 3600, 3800, and 4000 mm/s.

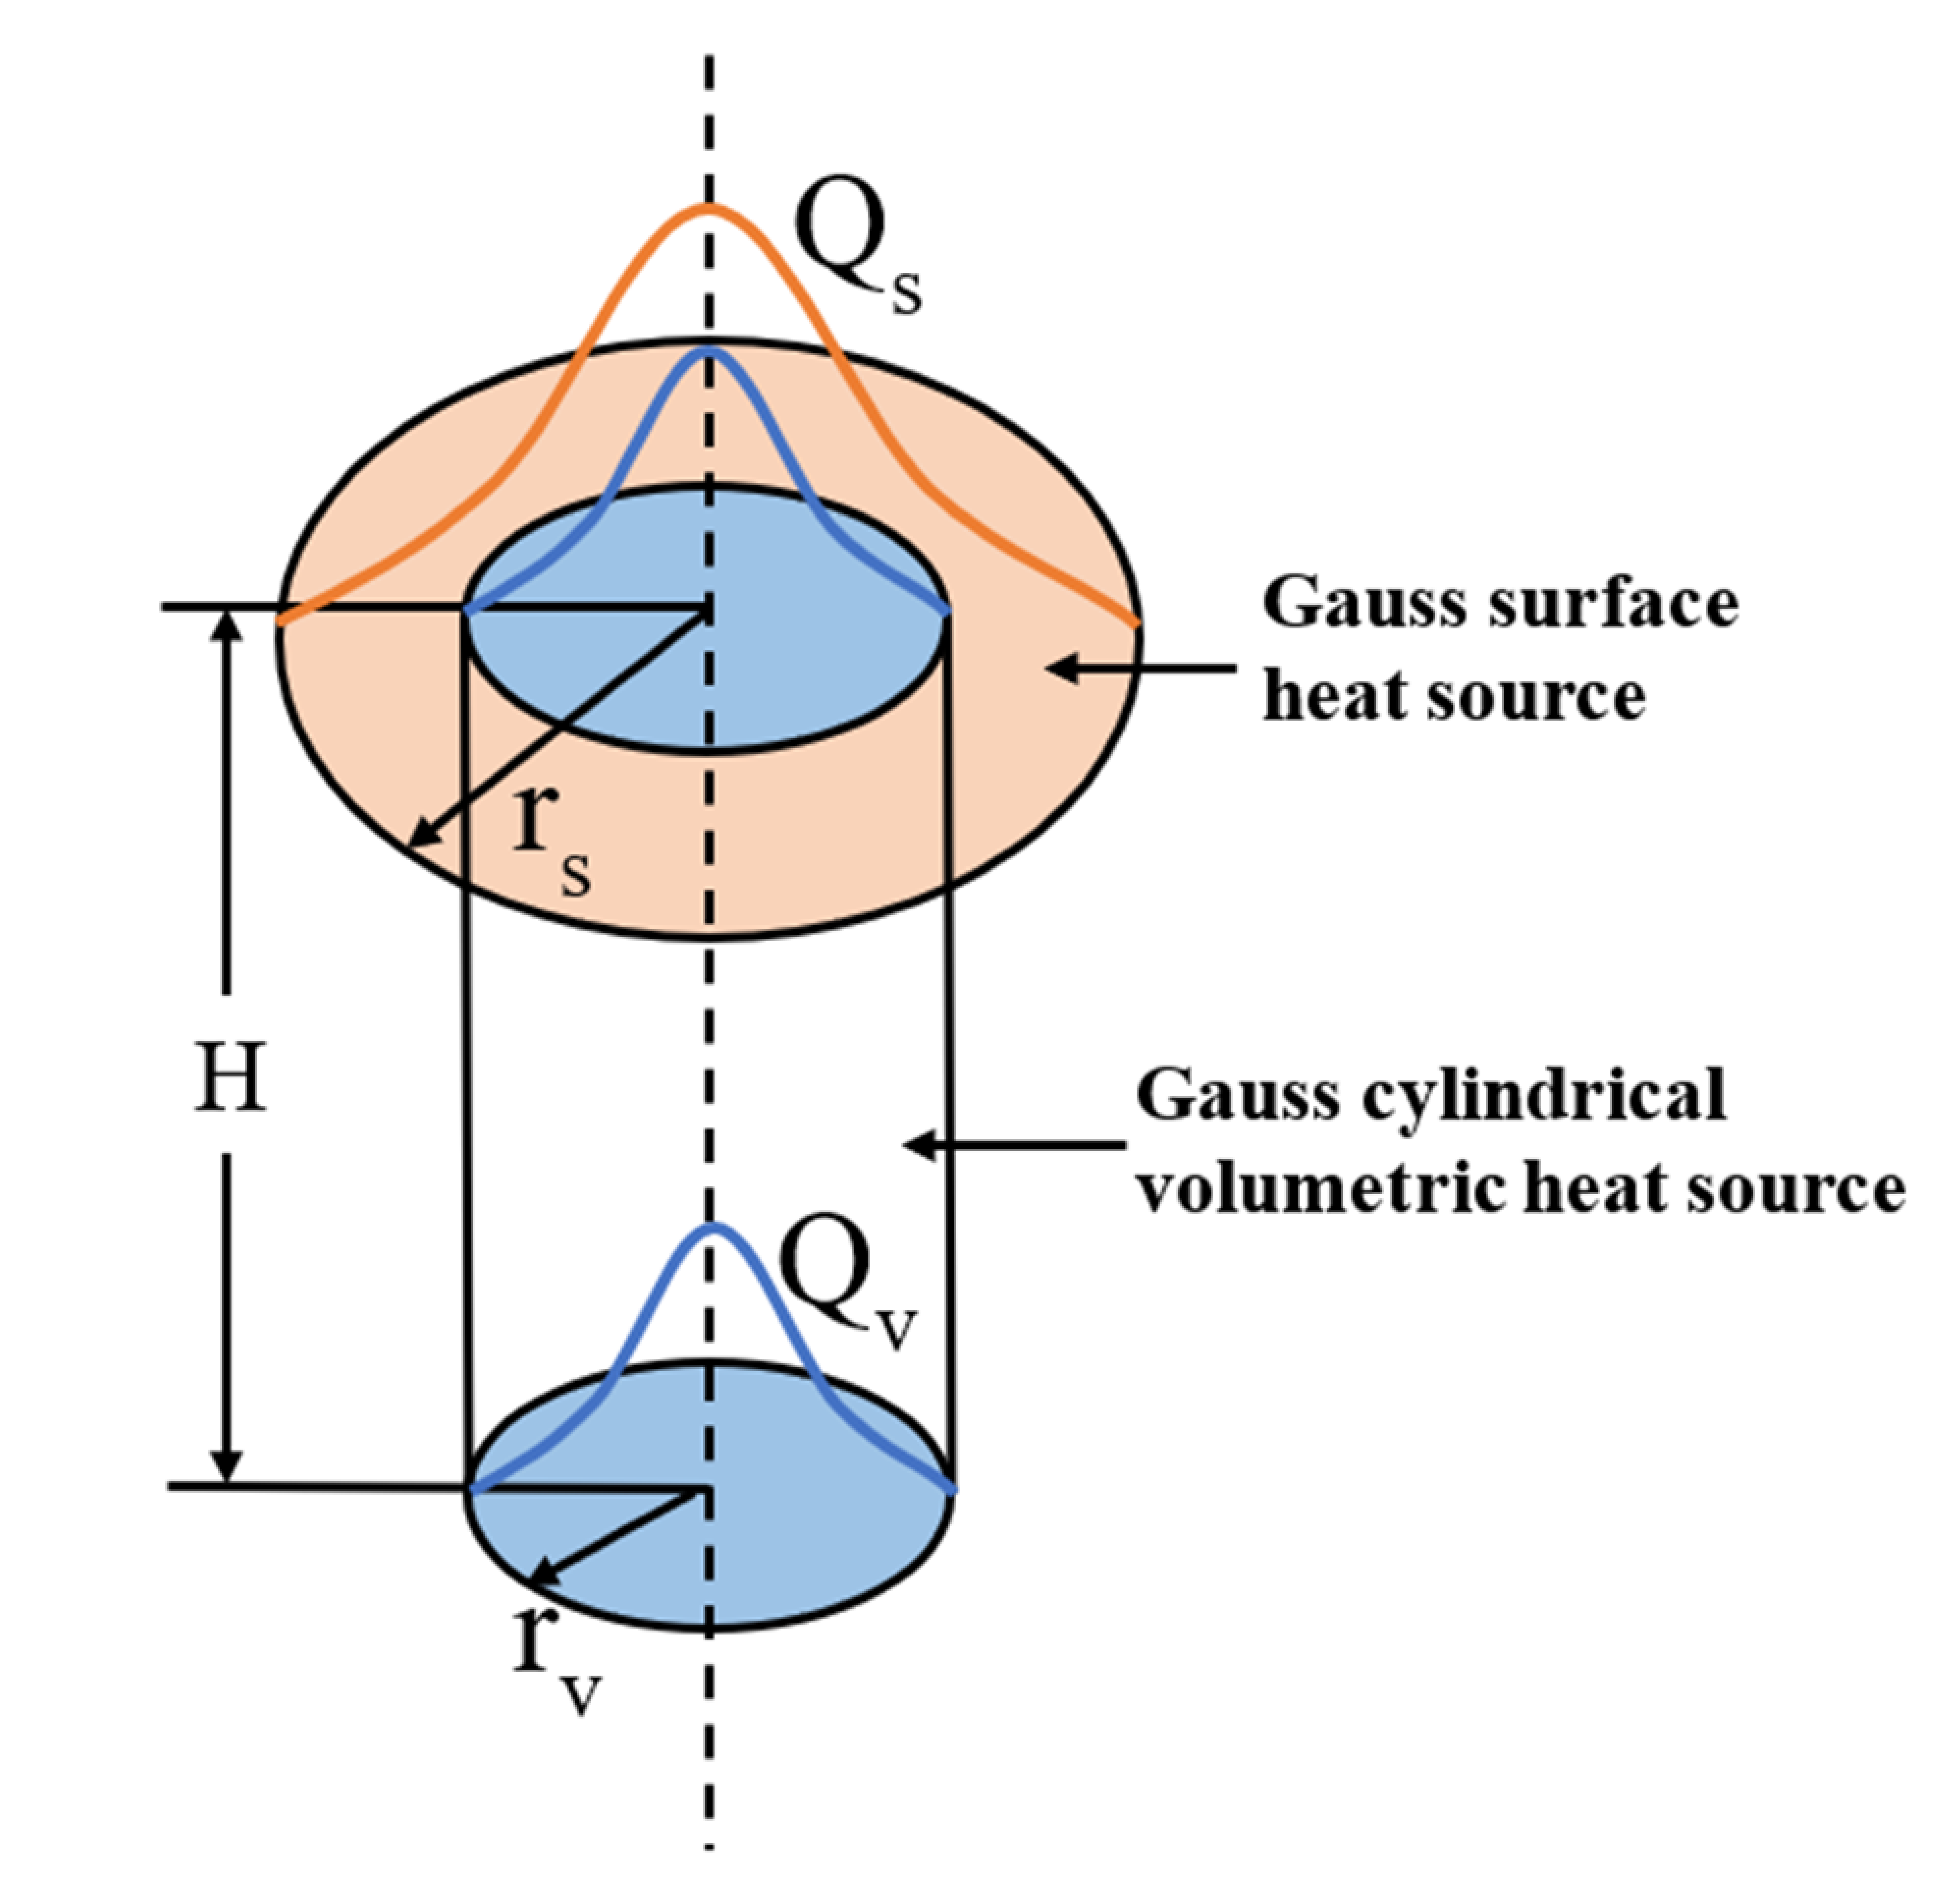
3.2. Heat Source Model

A coupled heat source model was used for the simulations of the temperature field and the melt pool geometries in this work, as shown in Figure 2. A Gaussian surface heat source was used in the coupled heat source model to characterize the heat flux input from the melt pool surface, and a Gaussian cylindrical volumetric heat source was used to compensate for Marangoni flow and depression-zone heat transfer inside the melt pool. For comparison, the simulations using a Gaussian surface heat source model [11] and a double ellipsoid volumetric heat source model [17] were also conducted based on the same single-track scanning transient temperature field model.
The total power q of the coupled heat source is
q = η   ( q s + q v )
where η is the laser absorption rate (0.77 [32]). q s is the power of the Gaussian surface heat source and q v is the power of the Gaussian cylindrical volumetric heat source.
The Gaussian surface heat source of the combined heat source model is given by [32]:
Q s ( x , y ) = 3 q s π r s 2 exp [ - 3 ( x 2 + y 2 ) r s 2 ]
where r s is the radius of the surface heat source. r s was set to 130 μm according to the average width of the melt pool in the single-track scanning experiments.
The Gaussian cylindrical volumetric heat source of the combined heat source model is given by the following equation [30]:
Q v ( x , y ) = 3 q v π H r v 2 exp [ 3 ( x 2 + y 2 ) r v 2 ]
where r v is the radius of the volumetric heat source and H is the depth of the heat source. The heat flux of each cross-section of the heat source is equal. Cunningham et al. [33] observed the depression-zone depths of Ti-6Al-4V fabricated by L-PBF under different process parameters using ultra high-speed X-ray imaging technology, which provided a reference for the value selection of r v and H. Based on ref. [33], r v was set to 100 μm dependent on the depression-zone width, and the H of different process parameters was set according to the depression-zone depth of the corresponding process parameters.

3.3. Governing Equations

The FEM model consists of a balance of thermal energy, associated with the boundary and the initial conditions. The transient temperature distribution T   x ,   y ,   z ,   t can be defined as [32]:
ρ c T t = x k T x + y k T y + z k T z + Q
where ρ is the density of the substance, c is the specific heat capacity, T is the temperature of the substrate, t is the interaction time, k is the thermal conductivity, and Q is the heat generated per unit volume of the model.
The preheating temperature was set as the initial condition, which can be defined as:
T   x ,   y ,   z ,   t | t = 0 = T 0 = 200 ° C
The boundary condition during the L-PBF process is expressed as:
k T n Q + h c T T 0 + σ b ε m T 4 T 0 4 = 0 , x , y , z S n
where k is the thermal conductivity, T is the model surface temperature, T 0 is the ambient temperature, h c is the convection coefficient which is 20 W/m2·K [34], n is the normal of the model surface, Q is the heat generated by the heat source, σ b is the Stefan–Boltzmann constant, which is 5.67 × 10⁻⁸ W/m2 K4, and ε m is the radiation emissivity, which is 0.285 [35]; S n is the model surface.

3.4. Thermophysical Properties of CP-Ti

The thermal properties of metals vary greatly with temperature. High-temperature thermal properties are extremely important for simulation accuracy. However, it is difficult to measure thermal property parameters above the melting point [35]. To ensure the accuracy of simulations, the relation curves between the thermophysical parameters and temperature of CP-Ti were calculated using JMatPro software 12.0 and compared with the available experimental data [32], as shown in Figure 3. It can be seen that the calculated and experimental values exhibit the same trend under the melting point, indicating simulation accuracy.

4. Results and Discussion

4.1. Comparison of Simulated Results Using Three Kinds of Heat Source Models

To verify the accuracy and validity of the coupled heat source model, the simulated and experimental melt pool geometries at 400 W power under different scanning speeds were compared. The morphologies and the detailed dimensions of the melt pools observed and simulated using the coupled heat source model are shown in Figure 4 and Figure 5. It can be seen that the simulated melt pool depths and widths match well with the measurements, with an average error of 1% for the melt pool depth and 7% for the width.
The simulated results using the three heat source models and the experimental results of the melt pool geometries are shown in Figure 6. Comparing the melt pool morphologies from the experiments at different scan speeds shown in Figure 6, it can be seen that with an increase in the scanning speed, the shapes of the experimental melt pools change from deep and narrow to shallow. It can be also seen that a significant difference in terms of melt pool shapes and sizes was exhibited by the three heat source models. For the shallow melt pools formed at a scanning speed of 2000 mm/s, the melt pool shape can be accurately simulated by all three heat source models. For melt pools formed at a scanning speed of 1400 mm/s, better simulated results in the morphologies and sizes of the melt pools were achieved using the coupled and double ellipsoid heat source models than using the Gaussian heat source model; furthermore, the coupled heat source model matches better with the experimental results. For the melt pool depth, the depth of the surface heat source model was significantly lower than the experimental values, as shown in Figure 6b. This phenomenon was also observed in 316L [15], Ti-6Al-4V [16], and 7075 aluminum [36] fabricated by L-PBF. For the deep and narrow melt pools formed at a scanning speed of 1000 mm/s, the melt pool depths from the Gaussian surface and double ellipsoid heat source models were both lower than the experimental values, as shown in Figure 6a,d,j; however, Figure 6g,j shows that the simulated results from the coupled heat source model fit well with the experimental results. In summary, the coupled heat source was considered to have better accuracy for simulation of the melt pool geometries, especially for deep and narrow melt pools.

4.2. Simulation of Melt Pool Temperature Field at Different L-PBF Process Parameters

The temperature fields of the melt pools were simulated using coupled heat sources at 90 different process parameters with 5 laser powers and 18 scanning speeds; the temperature contours were obtained to reflect the shape and temperature distribution in the melt pool. A typical example of the temperature contour (400 W, 1400 mm/s) is shown in Figure 7. The heat-affected zone ranged from 50–100 μm, and the melt pool edge temperature is the melting point of CP-Ti. The maximum temperature was located at the center of the melt pool, owing to the Gaussian distribution of the laser energy density. In the process of L-PBF, the moving speeds of the heat sources are high, leading to elongation of the melt pool into a comet shape.
The maximum temperature of the melt pool is the most important prerequisite for the formability of parts fabricated by L-PBF. The CP-Ti powder cannot be melted below the melting point, which is 1668 °C, while recoil pressure resulting from the vaporization of the melted metal will be generated above the boiling point (3287 °C), which will lead to instability of the melt pools and the formation of defects such as keyhole porosity [6]. Therefore, the maximum temperature of the melt pool for the formable process parameters should be located between the melting point and boiling point. Furthermore, in the formable temperature intervals, the lower melt pool temperature could result in low-density parts due to the balling effect and the lack-of-fusion pores. Figure 8 shows the temperature–time curves of the melt pools at point P as marked in Figure 1 for different process parameters. As shown in Figure 8a, at the same scanning speeds, the temperature of the melt pool increased as the laser power increased, which is attributed to the absorption of more heat. Figure 8b shows that, for the same laser power, the maximum temperature of the melt pool decreased with an increase in the scanning speed, and the moment when the P point reaches the maximum temperature was different. This result is ascribed to the faster scanning speed causing a shorter laser exposure time. The maximum temperatures of different parameters were extracted from temperature–time curves as shown in Table 2, which offers an initial screening of the process parameters. The maximum temperatures below the melting point are displayed in blue and those above the boiling point are displayed in red.
The cooling rate C r can be extracted from the temperature-time curves as follows:
C r = T t
where T is the temperature and t is the time. As displayed in Figure 9a, for different curves, the slopes of the curves at the melting point (1668 °C) increase as the scanning speed increases. This means that the cooling rate increases as the scanning speed increases. To study the instantaneous cooling rate Cr in the solidification process, the cooling rate of the formable process parameters at 1668 °C was extracted as shown in Figure 9b, which was between 1.5 × 10⁶ and 1.1 × 10⁷ K/s and included in the reported cooling rate range (103–108 K/s) of titanium alloy fabricated by L-PBF [37]. This can also demonstrate the accuracy of the coupled heat source model in simulating deep and narrow melt pools during the L-PBF process. In addition, it was observed that an increase in scanning speed or a decrease in laser power resulted in an increased cooling rate, ascribed to lower laser energy input.

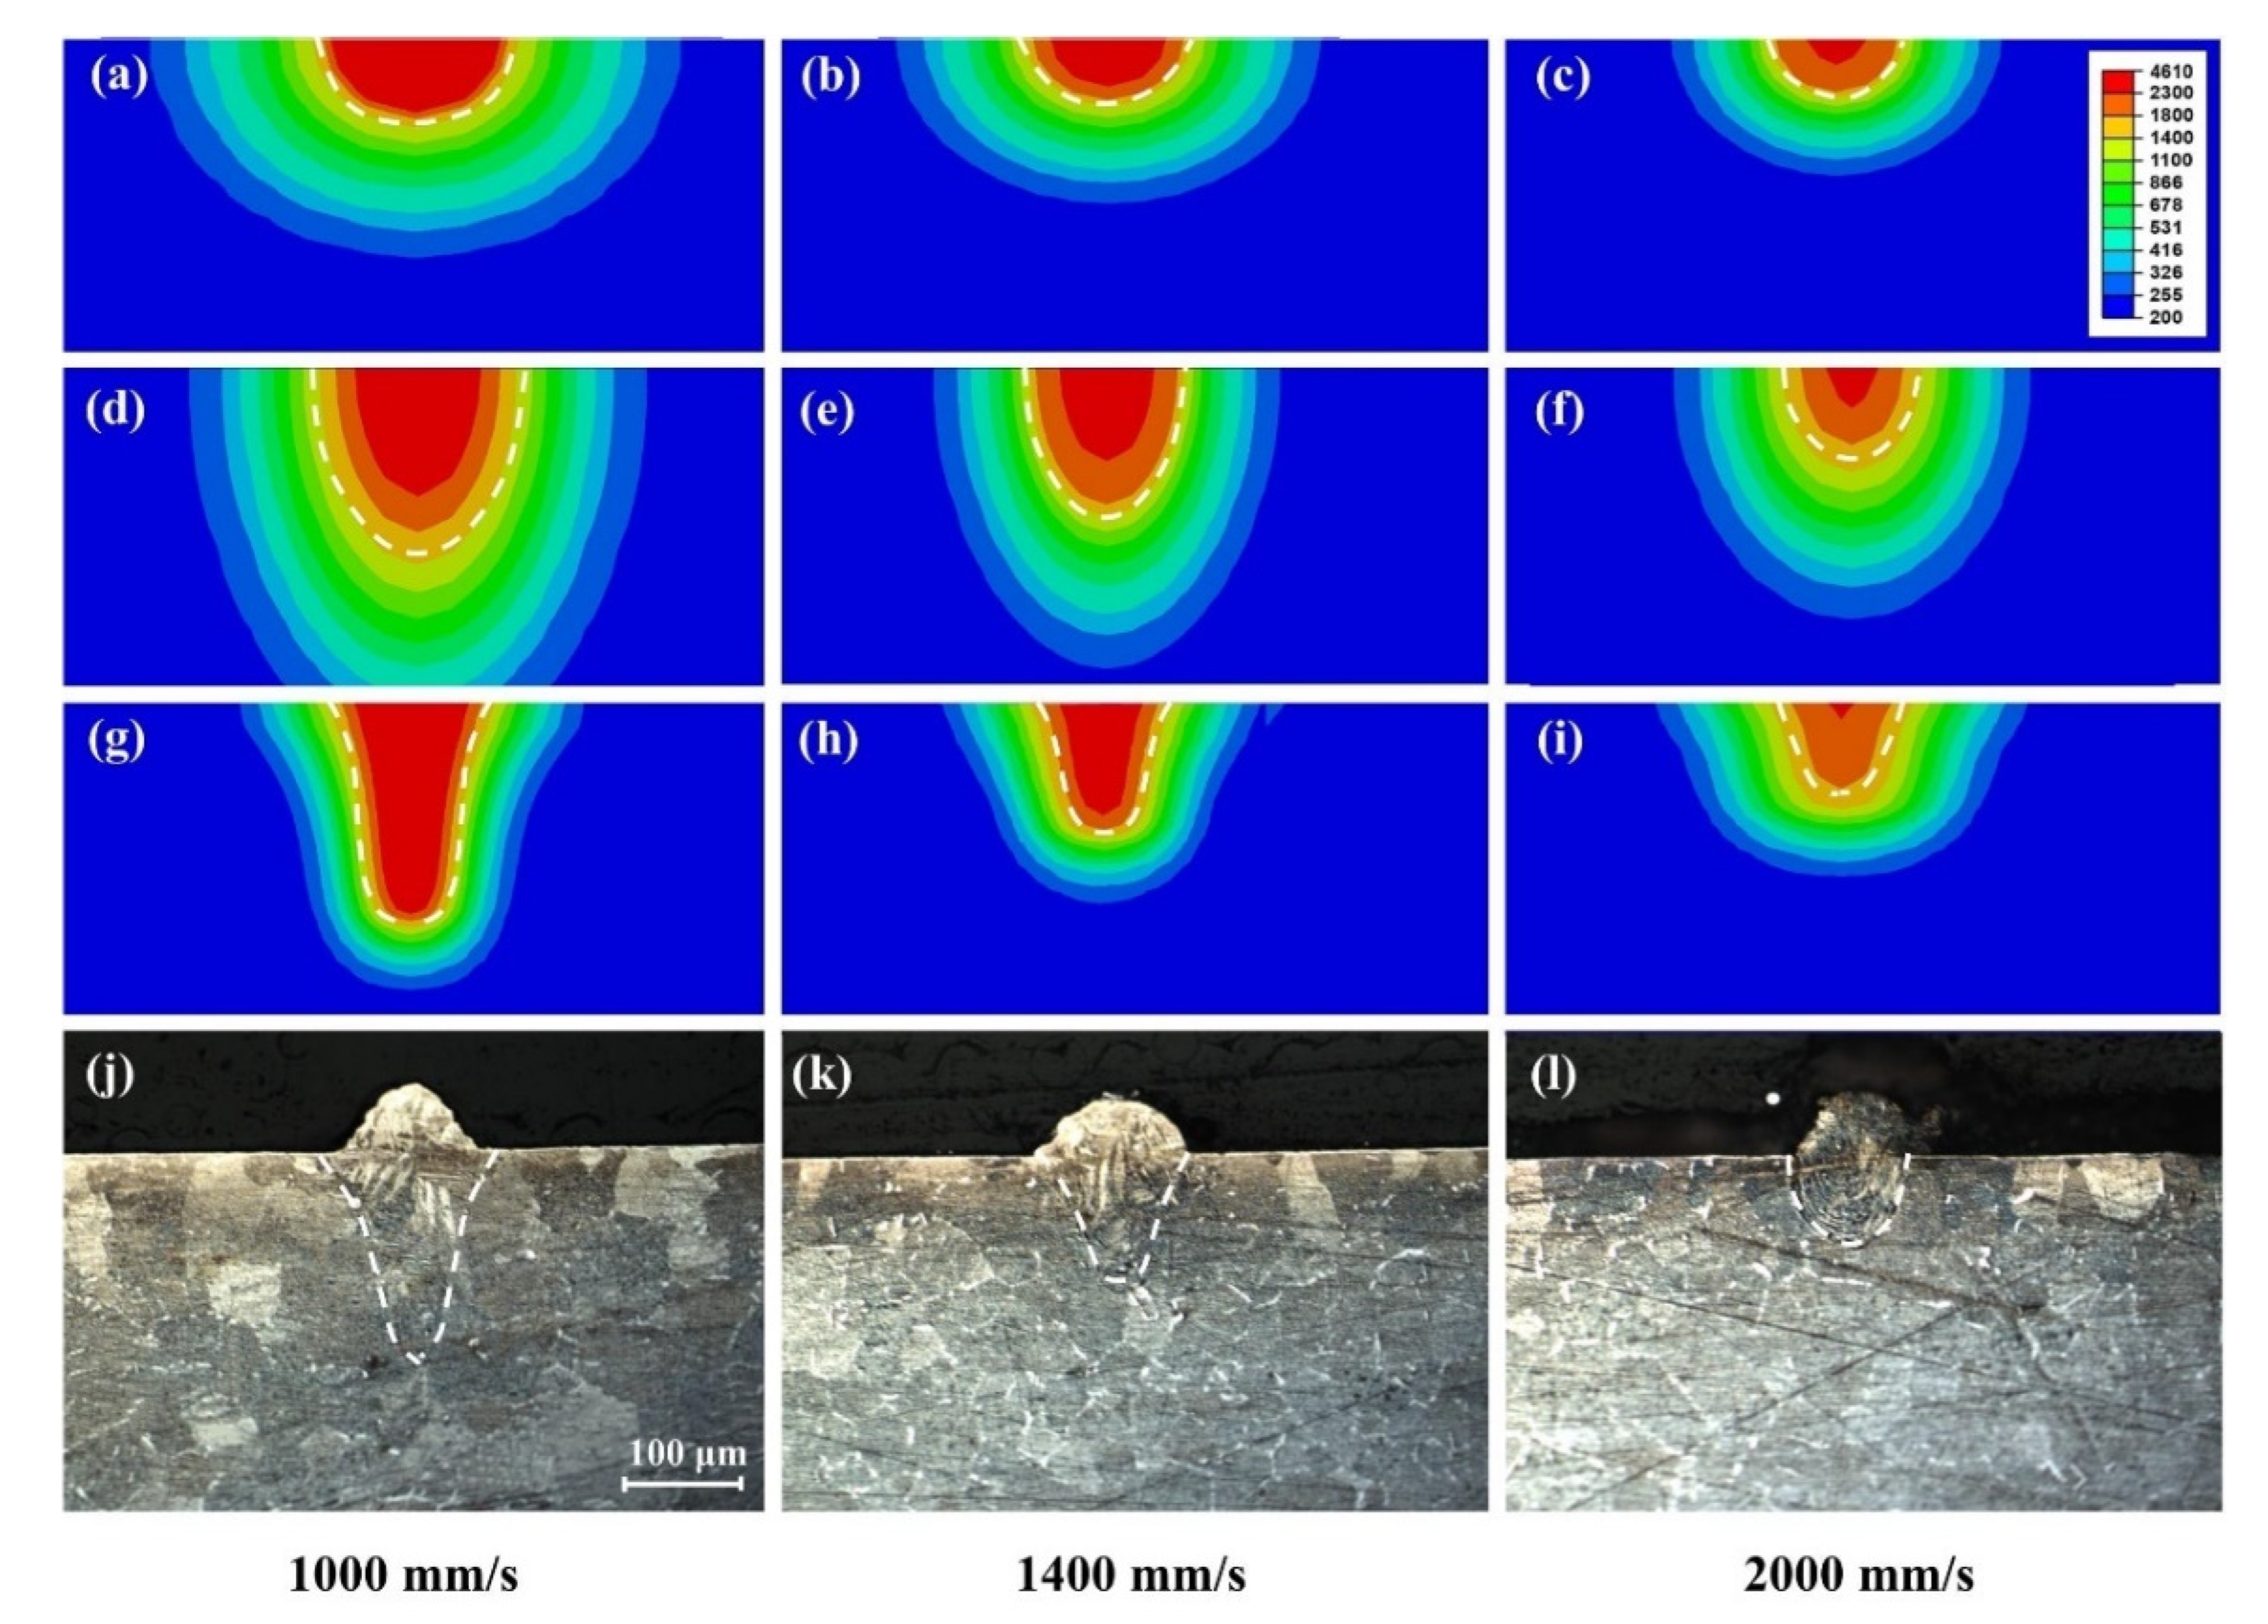
4.3. Simulation of Melt Pool Geometries at Different L-PBF Process Parameters

The melt pool geometries, including depth, width, and length are crucial to formability. The compatibility of the melt pool depth and width with the layer thickness and the hatch spacing directly determines the densities of the parts fabricated by L-PBF. The length-to-width ratio of the melt pool has an effect on its stability [38], however, the length of the melt pool cannot be obtained experimentally. In addition, the length has a more limited effect on the forming quality compared to the depth and width. Therefore, most reports [39,40,41,42] have focused on the effect of the depth-to-width ratio on densities and defects. In this project, the melt pool geometries at different process parameters were mainly concerned with the depth, width, and depth-to-width ratio of the melt pools.
As is shown in Figure 10a, the melt pool depths decreased as the scanning speeds increased within the range of 600–4000 mm/s or the laser power decreased within the range of 300–500 W. When the melt pool depth was less than the layer thickness, lack-of-fusion pores were formed. When the melt pool depth was significantly greater than the layer thickness, it was difficult for the pores inside the melt pool to escape in time, forming pore defects. Good compatibility of the melt pool depths and the layer thickness leads to high-density parts. Figure 10b shows that the melt pool widths decreased as the scanning speeds increased or the laser power decreased, and the variation of the melt pool widths were smaller than those of the melt pool depths due to the constant laser spot diameter. When the melt pool width was smaller, there was unmelted powder between adjacent melt tracks, leading to poor surface roughness and lower density. When the width of the melt pool was too large, the overlapping rate between the adjacent melt tracks was higher, resulting in a larger increase in the melt pool height than the layer thickness. This will make the deposited metal collide with the recoater and cause forming failure. When the melt pool width matches the hatch spacing well, a smoother surface will be formed between the adjacent melt tracks and a higher-density sample will be obtained.
The depth-to-width ratio of the melt pool is widely used to evaluate the transition of the melt pool mode; the depth-to-width ratios are shown in Figure 10c. Within a laser power range of 300–500 W, it can be seen that the depth-to-width ratio decreased as the laser power decreased. Within a scanning speed range between 600 mm/s and 4000 mm/s, as the scanning speed increased, the curves of the depth-to-width ratios versus the scanning speeds showed roughly three-stage trends, as shown in Figure 10c. According to references [8,9], the slope of the depth-to-width ratio curve can be used to distinguish the melt pool mode change. For the first stage of the depth-to-width ratio curve with a slope above 1.05, the depth-to-width ratio of the melt pool decreased rapidly due to the melt pool being boiling and unstable; therefore, the melt pool was in the keyhole mode, which is prone to form keyhole defects. For the second stage with the slope between 0.8 and 1.05, the depth-to-width ratio presented a slowly decreasing trend and the melt pool transformed to a stable conduction mode. The same phenomenon was found by Tan et al. [9] in aluminum alloys. It was speculated that, as the scanning speeds decreased, the melt pool temperature decreased gradually until the boiling ceased and the depression zone of the melt pool disappeared [33]. Therefore, melt pool sizes become relatively stable due to the slower heat transfer caused by the lack of heat transfer in the depression zone. For the last stage with a slope below 0.8, due to the scanning speed being too fast, the melt pool loses heat fast enough to cause rapid decreases in the melt pool sizes. It is therefore prone to result in lack-of-fusion pores. Rashid et al. [43] reports that too-fast scanning speeds lead to a large number of pores. Furthermore, a too-low melt pool temperature easily causes the balling phenomenon [44]. It is widely accepted that the conduction mode is more favorable in L-PBF [9]. The effect of the depth-to-width ratio of the melt pool on print quality is sketched in Figure 11. When the depth-to-width ratio is large enough, as shown in Figure 11a, it is difficult for the pores to escape from the melt pool, resulting in low density. When the depth-to-width ratio is small enough, as shown in Figure 11c, the adjacent melt tracks lack fusion, leading to the formation of unfused pores. Dense parts can be fabricated only when the depth-to-width ratio is moderate, as shown in Figure 11b. Therefore, the process parameters corresponding to the abovementioned second stage should be selected as the feasible parameters.

4.4. Prediction of Suitable Process Parameter Ranges for CP-Ti Fabricated by L-PBF

Generally, a method can be provided for the prediction and optimization of L-PBF process parameters as follows: Firstly, the parameters causing the maximum temperatures of melt pools above the boiling point and below the melting point were eliminated. Subsequently, according to the simulated geometries of melt pools and their effects on the formation of defects, the parameters resulting in smaller depth-to-width ratios were excluded to increase the density of the parts. The parameters contributing to the conduction mode of the melt pool are recommended based on the depth-to-width ratios corresponding to the abovementioned second stage of the depth-to-width ratio curves. Finally, the hatch spacing and layer thickness are determined by the width and depth of the melt pool, respectively. Comprehensively considering the melt pool temperature and geometries, the predicted process parameter range for CP-Ti is given in Figure 12. The background is the maximum temperature zone of the melt pool predicted by the simulations in this work, which is divided into the maximum temperature above the boiling point zone, maximum temperature between boiling and melting points zone, and maximum temperature below the melting point zone. With regard to the maximum temperature between boiling and melting points zone, according to the slope of the depth-to-width ratio curve (Figure 10c), a slope less than 0.8 was roughly considered a lack-of-energy mode. Therefore, the best zone for L-PBF forming is predicted, which is marked as red dashed lines.
In order to evaluate the validity of the above prediction, previously reported experimental studies of titanium alloys fabricated by L-PBF were investigated and compared, as shown in Figure 12. Ran et al. [45] and Liu et al. [41] reported that keyholes formed at lower scanning speeds, in which the laser power and the scanning speeds were just located in the maximum temperature above the boiling point zone predicted by the simulation in this paper. In this zone, the maximum temperature of the melt pool is higher than the boiling point and therefore prone to large recoil pressure, leading to keyhole defects. The process parameters of dense CP-Ti reported by Barriobero et al. [46] and Zhang et al. [47] are consistent with the predicted “good zone” in this paper. The dense process parameters of other refs. [48,49,50,51] are also consistent with the predictions. Panwisawas et al. [52] studied the densification at higher scanning speeds ranging from 2000 mm/s to 4200 mm/s; the density and porosity parameters were consistent with those predicted in this paper. Salem et al. [53] investigated the process parameters for preparation of lattice structures with Ti-6Al-4V by L-PBF, and the results are in agreement with the porosity zone predicted in this paper. The experimental results from literature reports proved that the prediction in this work is reasonable for titanium alloys, not only CP-Ti. Currently, the experimental data above 400 W are lacking. The future development of L-PBF technology lies in higher-powered lasers [54,55,56]. Our laboratory has a Solution SLM280HL system (SLM Solutions Group AG, Lubeck, Germany) equipped with a maximum of 700 W laser, and the relevant experimental studies will be reported in subsequent work.

5. Conclusions

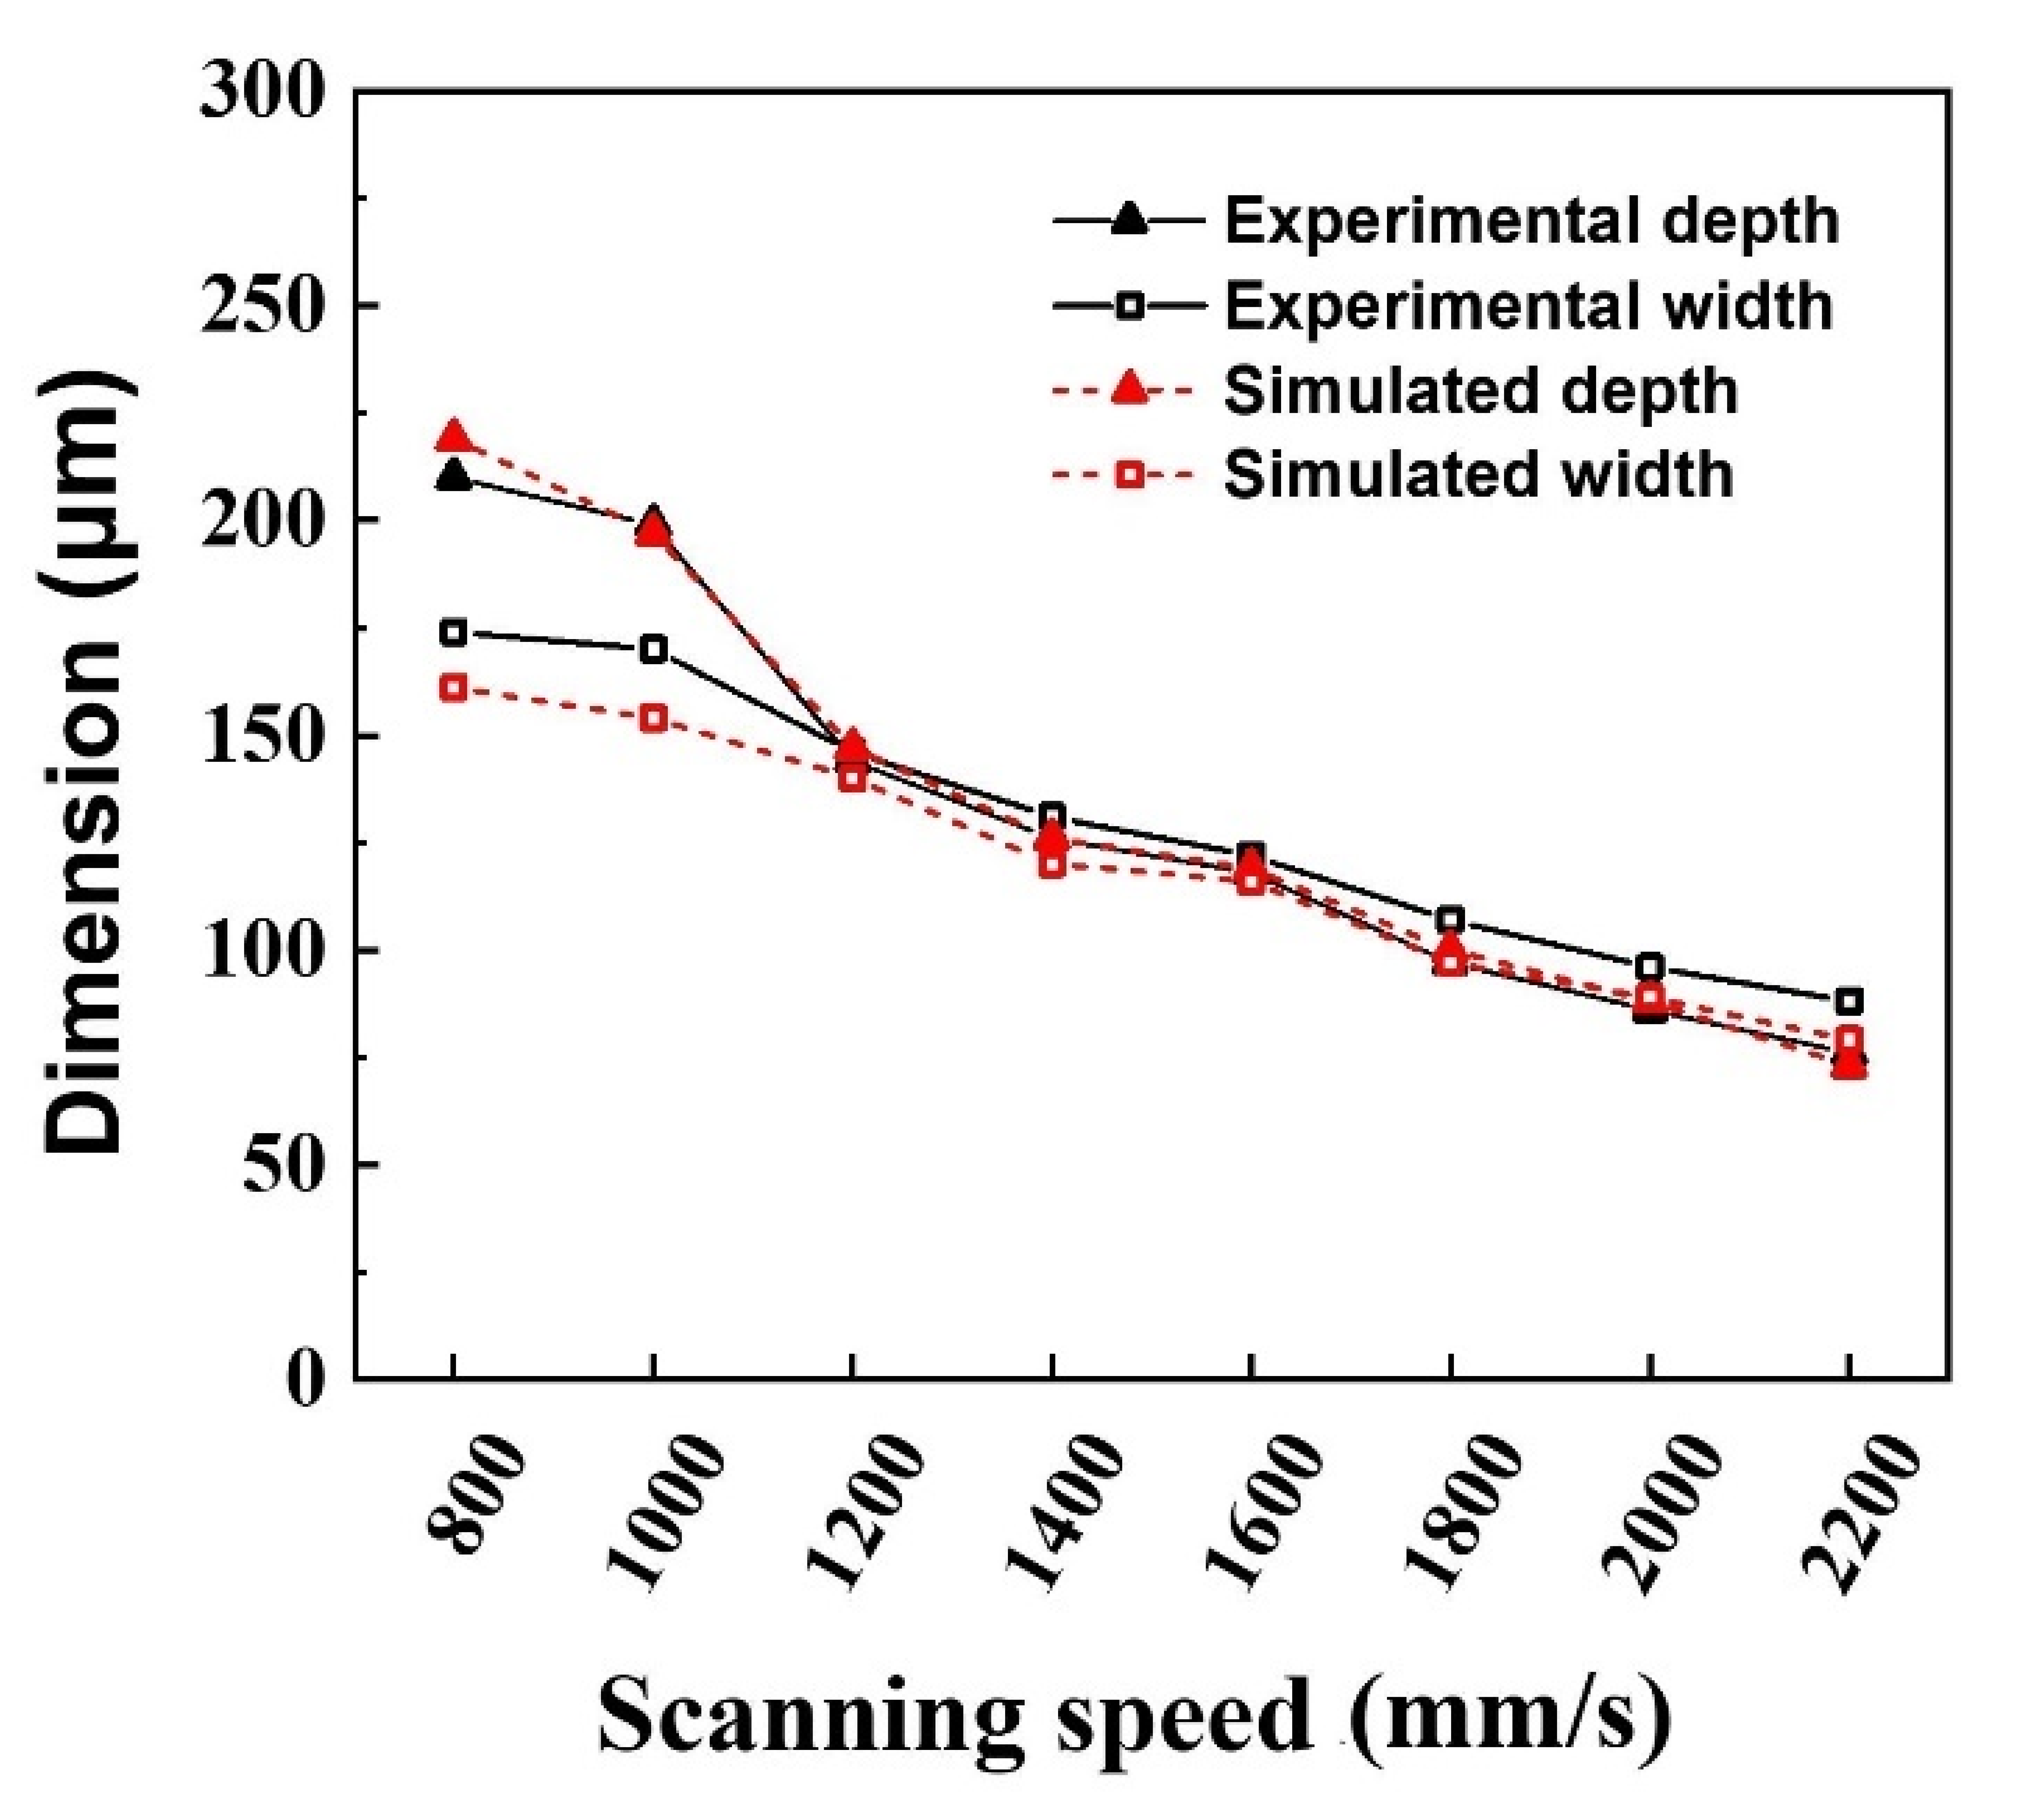
  • For the deep and narrow melt pools formed during L-PBF, a coupled heat source model was introduced to compare the accuracy of the finite element simulation to the temperature field distribution and melt pool characteristics using a Gaussian surface heat source model and a double ellipsoid heat source model. Based on single-track experiments on CP-Ti powders using an L-PBF Solution SLM280HL system, the simulated geometries of melt pools using the coupled heat source model best fit the single-track experimental results, with an average error of 1% for the melt depth and 7% for the width.
  • The temperature field distribution and the melt pool geometries of CP-Ti at different laser power and scanning speeds were simulated by FEM using a coupled heat source model. The simulated maximum temperature of the melt pool increased with an increase in laser power when the scanning speed was the same, and the temperature decreased with an increase in the scanning speed when the laser power was the same. By analyzing the depth-to-width ratios of the melt pools, it was found that the melt pool was relatively stable when the value was between 0.8–1.05. On the basis of the simulated results of the maximum temperature and the geometries of melt pools with different key process parameters, the suitable process parameter range of CP-Ti was predicted. Previously reported experimental results agree well with the simulated process parameter map. Therefore, the coupled heat source model is more accurate and applicable for finite element simulation of the temperature field and melt pool characteristics of the deep and narrow melt pools in L-PBF.

Author Contributions

Conceptualization, K.G. and Y.J.; methodology, K.G., Y.J. and X.K.; investigation, K.G., H.B. and Y.J.; resources, Y.J., H.R. and Y.L.; data curation, K.G. and Y.J.; writing—original draft preparation, K.G.; writing—review and editing, K.G., Y.J., X.K., Y.L. and H.R.; visualization, K.G. and Y.J.; supervision, Y.J. and H.R.; project administration, Y.J., Y.L. and H.R. All authors have read and agreed to the published version of the manuscript.

Funding

This research was supported by the Natural Science Foundation of Inner Mongolia in China (Grant No. 2021MS05010).

Institutional Review Board Statement

Not applicable.

Informed Consent Statement

Not applicable.

Data Availability Statement

The data presented in this study are available on request from the corresponding author.

Conflicts of Interest

The authors declare no conflict of interest.

References

  1. Liu, G.; Zhang, X.; Chen, X.; He, Y.; Cheng, L.; Huo, M.; Yin, J.; Hao, F.; Chen, S.; Wang, P.; et al. Additive Manufacturing of Structural Materials. Mater. Sci. Eng. R Rep. 2021, 145, 100596. [Google Scholar] [CrossRef]
  2. Gu, D.; Shi, X.; Poprawe, R.; Bourell, D.L.; Setchi, R.; Zhu, J. Material-Structure-Performance Integrated Laser-Metal Additive Manufacturing. Science 2021, 372, 6545. [Google Scholar] [CrossRef] [PubMed]
  3. Fu, J.; Li, H.; Song, X.; Fu, M.W. Multi-Scale Defects in Powder-Based Additively Manufactured Metals and Alloys. J. Mater. Sci. Technol. 2022, 122, 165–199. [Google Scholar] [CrossRef]
  4. Kumar, P.; Farah, J.; Akram, J.; Teng, C.; Ginn, J.; Misra, M. Influence of Laser Processing Parameters on Porosity in Inconel 718 during Additive Manufacturing. Int. J. Adv. Manuf. Technol. 2019, 103, 1497–1507. [Google Scholar] [CrossRef]
  5. Zu, L.R.; Wu, D.L.; Zhou, J.F.; Liu, Z.W.; Xie, H.M.; Liu, S. Advances in Online Detection Technology for Laser Additive Manufacturing: A Review. 3D Print. Addit. Manuf. 2021, 1–23. [Google Scholar] [CrossRef]
  6. Khairallah, S.A.; Martin, A.A.; Lee, J.R.I.; Guss, G.; Calta, N.P.; Hammons, J.A.; Nielsen, M.H.; Chaput, K.; Schwalbach, E.; Shah, M.N.; et al. Controlling Interdependent Meso-Nanosecond Dynamics and Defect Generation in Metal 3D Printing. Science 2020, 368, 660–665. [Google Scholar] [CrossRef]
  7. Tseng, C.C.; Li, C.J. Numerical Investigation of Interfacial Dynamics for the Melt Pool of Ti-6Al-4V Powders under a Selective Laser. Int. J. Heat Mass Transf. 2019, 134, 906–919. [Google Scholar] [CrossRef]
  8. Qi, T.; Zhu, H.; Zhang, H.; Yin, J.; Ke, L.; Zeng, X. Selective Laser Melting of Al7050 Powder: Melting Mode Transition and Comparison of the Characteristics between the Keyhole and Conduction Mode. Mater. Des. 2017, 135, 257–266. [Google Scholar] [CrossRef]
  9. Tan, Q.; Liu, Y.; Fan, Z.; Zhang, J.; Yin, Y.; Zhang, M.-X. Effect of Processing Parameters on the Densification of an Additively Manufactured 2024 Al Alloy. J. Mater. Sci. Technol. 2020, 58, 34–45. [Google Scholar] [CrossRef]
  10. Qu, M.; Guo, Q.; Escano, L.I.; Nabaa, A.; Hojjatzadeh, S.M.H.; Young, Z.A.; Chen, L. Controlling Process Instability for Defect Lean Metal Additive Manufacturing. Nat. Commun. 2022, 13, 1079. [Google Scholar] [CrossRef]
  11. Pavelic, V.; Tanbakuchi, R.; Uyehara, O.A.; Myers, P.S. Experimental and Computed Temperature Histories in Gas Tungsten-Arc Welding of Thin Plates. Weld. J. Res. Suppl. 1969, 48, 296–305. [Google Scholar]
  12. Kang, X.; Dong, S.; Wang, H.; Yan, S.; Liu, X.; Xu, B. Effects of Y Content on Laser Melting-Deposited 24CrNiMo Steel: Formability, Microstructural Evolution, and Mechanical Properties. Mater. Des. 2020, 188, 108434. [Google Scholar] [CrossRef]
  13. Zuo, P.; Chen, S.; Wei, M.; Liang, J.; Liu, C.; Wang, M. Thermal Behavior and Grain Evolution of 24CrNiMoY Alloy Steel Prepared by Pre-Laid Laser Cladding Technology. Opt. Laser Technol. 2019, 119, 105613. [Google Scholar] [CrossRef]
  14. Ansari, M.J.; Nguyen, D.S.; Park, H.S. Investigation of SLM Process in Terms of Temperature Distribution and Melting Pool Size: Modeling and Experimental Approaches. Materials 2019, 12, 1272. [Google Scholar] [CrossRef] [PubMed] [Green Version]
  15. Tran, H.C.; Lo, Y.L. Heat Transfer Simulations of Selective Laser Melting Process Based on Volumetric Heat Source with Powder Size Consideration. J. Mater. Process. Technol. 2018, 255, 411–425. [Google Scholar] [CrossRef]
  16. Olleak, A.; Xi, Z. Finite Element Modeling of the Selective Laser Melting Process for Ti-6Al-4V. In Proceedings of the 2018 International Solid Freeform Fabrication Symposium, Austin, TX, USA, 13–15 August 2018; pp. 1710–1720. [Google Scholar]
  17. Goldak, J.; Chakravarti, A.; Bibby, M. A New Finite Element Model for Welding Heat Sources. Metall. Trans. B 1984, 15, 299–305. [Google Scholar] [CrossRef]
  18. Li, H.; Huang, Y.; Jiang, S.; Lu, Y.; Gao, X.; Lu, X.; Ning, Z.; Sun, J. Columnar to Equiaxed Transition in Additively Manufactured CoCrFeMnNi High Entropy Alloy. Mater. Des. 2021, 197, 109262. [Google Scholar] [CrossRef]
  19. Waqar, S.; Guo, K.; Sun, J. Evolution of Residual Stress Behavior in Selective Laser Melting (SLM) of 316L Stainless Steel through Preheating and in-Situ Re-Scanning Techniques. Opt. Laser Technol. 2022, 149, 107806. [Google Scholar] [CrossRef]
  20. Waqar, S.; Guo, K.; Sun, J. FEM Analysis of Thermal and Residual Stress Profile in Selective Laser Melting of 316L Stainless Steel. J. Manuf. Process. 2021, 66, 81–100. [Google Scholar] [CrossRef]
  21. Farias, R.M.; Teixeira, P.R.F.; Vilarinho, L.O. Variable Profile Heat Source Models for Numerical Simulations of Arc Welding Processes. Int. J. Therm. Sci. 2022, 179, 107593. [Google Scholar] [CrossRef]
  22. DebRoy, T.; Wei, H.L.; Zuback, J.S.; Mukherjee, T.; Elmer, J.W.; Milewski, J.O.; Beese, A.M.; Wilson-Heid, A.; De, A.; Zhang, W. Additive Manufacturing of Metallic Components—Process, Structure and Properties. Prog. Mater. Sci. 2018, 92, 112–224. [Google Scholar] [CrossRef]
  23. Tan, J.L.; Tang, C.; Wong, C.H. A Computational Study on Porosity Evolution in Parts Produced by Selective Laser Melting. Metall. Mater. Trans. A 2018, 49, 3663–3673. [Google Scholar] [CrossRef]
  24. Kamath, C.; El-Dasher, B.; Gallegos, G.F.; King, W.E.; Sisto, A. Density of Additively-Manufactured, 316L SS Parts Using Laser Powder-Bed Dfusion at Powers up to 400 W. Int. J. Adv. Manuf. Technol. 2014, 74, 65–78. [Google Scholar] [CrossRef] [Green Version]
  25. Liu, B.; Fang, G.; Lei, L.; Liu, W. A New Ray Tracing Heat Source Model for Mesoscale CFD Simulation of Selective Laser Melting (SLM). Appl. Math. Model. 2020, 79, 506–520. [Google Scholar] [CrossRef]
  26. Tang, C.; Le, K.Q.; Wong, C.H. Physics of Humping Formation in Laser Powder Bed Fusion. Int. J. Heat Mass Transf. 2020, 149, 119172. [Google Scholar] [CrossRef]
  27. Flint, T.F.; Francis, J.A.; Smith, M.C.; Balakrishnan, J. Extension of the Double-Ellipsoidal Heat Source Model to Narrow-Groove and Keyhole Weld Configurations. J. Mater. Process. Technol. 2017, 246, 123–135. [Google Scholar] [CrossRef]
  28. Chukkan, J.R.; Vasudevan, M.; Muthukumaran, S.; Kumar, R.R.; Chandrasekhar, N. Simulation of Laser Butt Welding of AISI 316L Stainless Steel Sheet Using Various Heat Sources and Experimental Validation. J. Mater. Process. Technol. 2015, 219, 48–59. [Google Scholar] [CrossRef]
  29. Liu, Y.; Jiang, P.; Ai, Y.W.; Yue, C. Prediction of Weld Shape for Fiber Laser Welding Based on Hybrid Heat Source Model. In Proceedings of the 3rd International Conference on Material, Mechanical and Manufacturing Engineering (IC3ME 2015), Guangzhou, China, 27–28 June 2015; pp. 1868–1873. [Google Scholar]
  30. Wang, J.; Chen, X.; Yang, L.; Zhang, G. Sequentially Combined Thermo-Mechanical and Mechanical Simulation of Double-Pulse MIG Welding of 6061-T6 Aluminum Alloy Sheets. J. Manuf. Process. 2022, 77, 616–631. [Google Scholar] [CrossRef]
  31. Gong, H.; Gu, H.; Zeng, K.; Dilip, J.J.S.; Pal, D.; Stucker, B.; Christiansen, D.; Beuth, J.; Lewandowski, J.J. Melt Pool Characterization for Selective Laser Melting of Ti-6Al-4V Pre-Alloyed Powder. In Proceedings of the 25th Annual International Solid Freeform Fabrication Symposium, Austin, TX, USA, 4–6 August 2014; pp. 256–267. [Google Scholar]
  32. Li, Y.; Gu, D. Thermal Behavior during Selective Laser Melting of Commercially Pure Titanium Powder: Numerical Simulation and Experimental Study. Addit. Manuf. 2014, 1, 99–109. [Google Scholar] [CrossRef]
  33. Cunningham, R.; Zhao, C.; Parab, N.; Kantzos, C.; Pauza, J.; Fezzaa, K.; Sun, T.; Rollett, A.D. Keyhole Threshold and Morphology in Laser Melting Revealed by Ultrahigh-Speed x-Ray Imaging. Science 2019, 363, 849–852. [Google Scholar] [CrossRef]
  34. Deng, M.C.; Sui, S.; Yao, B.; Ma, L.; Lin, X.; Chen, J. Microstructure and Room-Temperature Tensile Property of Ti-5.7Al-4.0Sn-3.5Zr-0.4Mo-0.4Si-0.4Nb-1.0Ta-0.05C with near Equiaxed β Grain Fabricated by Laser Directed Energy Deposition Technique. J. Mater. Sci. Technol. 2022, 101, 308–320. [Google Scholar] [CrossRef]
  35. Lu, X.; Lin, X.; Chiumenti, M.; Cervera, M.; Hu, Y.; Ji, X.; Ma, L.; Yang, H.; Huang, W. Residual Stress and Distortion of Rectangular and S-Shaped Ti-6Al-4V Parts by Directed Energy Deposition: Modelling and Experimental Calibration. Addit. Manuf. 2019, 26, 166–179. [Google Scholar] [CrossRef]
  36. Li, G.; Li, X.; Guo, C.; Zhou, Y.; Tan, Q.; Qu, W.; Li, X.; Hu, X.; Zhang, M.-X.; Zhu, Q. Investigation into the Effect of Energy Density on Densification, Surface Roughness and Loss of Alloying Elements of 7075 Aluminium Alloy Processed by Laser Powder Bed Fusion. Opt. Laser Technol. 2022, 147, 107621. [Google Scholar] [CrossRef]
  37. Gu, D.; Hagedorn, Y.-C.; Meiners, W.; Meng, G.; Batista, R.J.S.; Wissenbach, K.; Poprawe, R. Densification Behavior, Microstructure Evolution, and Wear Performance of Selective Laser Melting Processed Commercially Pure Titanium. Acta Mater. 2012, 60, 3849–3860. [Google Scholar] [CrossRef]
  38. Yadroitsev, I.; Gusarov, A.; Yadroitsava, I.; Smurov, I. Single Track Formation in Selective Laser Melting of Metal Powders. J. Mater. Process. Technol. 2010, 210, 1624–1631. [Google Scholar] [CrossRef]
  39. Fabbro, R. Scaling Laws for the Laser Welding Process in Keyhole Mode. J. Mater. Process. Technol. 2019, 264, 346–351. [Google Scholar] [CrossRef] [Green Version]
  40. Oliveira, J.P.; LaLonde, A.D.; Ma, J. Processing Parameters in Laser Powder Bed Fusion Metal Additive Manufacturing. Mater. Des. 2020, 193, 108762. [Google Scholar] [CrossRef]
  41. Liu, B.; Fang, G.; Lei, L.; Yan, X. Predicting the Porosity Defects in Selective Laser Melting (SLM) by Molten Pool. Int. J. Mech. Sci. 2022, 228, 107478. [Google Scholar] [CrossRef]
  42. Sabzi, H.E.; Rivera-Díaz-del-Castillo, P.E.J. Defect Prevention in Selective Laser Melting Components: Compositional and Process Effects. Materials 2019, 12, 3791. [Google Scholar] [CrossRef] [Green Version]
  43. Rashid, R.; Masood, S.H.; Ruan, D.; Palanisamy, S.; Rahman Rashid, R.A.; Elambasseril, J.; Brandt, M. Effect of Energy per Layer on the Anisotropy of Selective Laser Melted AlSi12 Aluminium Alloy. Addit. Manuf. 2018, 22, 426–439. [Google Scholar] [CrossRef]
  44. Nguyen, Q.B.; Luu, D.N.; Nai, S.M.L.; Zhu, Z.; Chen, Z.; Wei, J. The Role of Powder Layer Thickness on the Quality of SLM Printed Parts. Arch. Civ. Mech. Eng. 2018, 18, 948–955. [Google Scholar] [CrossRef]
  45. Ran, Q.; Yang, W.; Hu, Y.; Shen, X.; Yu, Y.; Xiang, Y.; Cai, K. Osteogenesis of 3D Printed Porous Ti6Al4V Implants with Different Pore Sizes. J. Mech. Behav. Biomed. Mater. 2018, 84, 1–11. [Google Scholar] [CrossRef] [PubMed]
  46. Barriobero-Vila, P.; Gussone, J.; Stark, A.; Requena, G.; Schell, N.; Haubrich, J. Peritectic Titanium Alloys for 3D Printing. Nat. Commun. 2018, 9, 3426. [Google Scholar] [CrossRef] [PubMed] [Green Version]
  47. Zhang, J.; Liu, Y.; Bayat, M.; Tan, Q.; Yin, Y.; Fan, Z.; Liu, S.; Hattel, J.H.; Dargusch, M.; Zhang, M.X. Achieving High Ductility in a Selectively Laser Melted Commercial Pure-Titanium via in-Situ Grain Refinement. Scr. Mater. 2021, 191, 155–160. [Google Scholar] [CrossRef]
  48. Wits, W.W.; Carmignato, S.; Zanini, F.; Vaneker, T.H.J. Porosity Testing Methods for the Quality Assessment of Selective Laser Melted Parts. CIRP Ann. 2016, 65, 201–204. [Google Scholar] [CrossRef]
  49. Vrancken, B.; Thijs, L.; Kruth, J.P.; Van Humbeeck, J. Heat Treatment of Ti6Al4V Produced by Selective Laser Melting: Microstructure and Mechanical Properties. J. Alloys Compd. 2012, 541, 177–185. [Google Scholar] [CrossRef] [Green Version]
  50. Funch, C.V.; Palmas, A.; Somlo, K.; Valente, E.H.; Cheng, X.; Poulios, K.; Villa, M.; Somers, M.A.J.; Christiansen, T.L. Targeted Heat Treatment of Additively Manufactured Ti-6Al-4V for Controlled Formation of Bi-Lamellar Microstructures. J. Mater. Sci. Technol. 2020, 81, 67–76. [Google Scholar] [CrossRef]
  51. Takase, A.; Ishimoto, T.; Suganuma, R.; Nakano, T. Lattice Distortion in Selective Laser Melting (SLM)-Manufactured Unstable β-Type Ti-15Mo-5Zr-3Al Alloy Analyzed by High-Precision X-Ray Diffractometry. Scr. Mater. 2021, 201, 113953. [Google Scholar] [CrossRef]
  52. Panwisawas, C.; Qiu, C.L.; Sovani, Y.; Brooks, J.W.; Attallah, M.M.; Basoalto, H.C. On the Role of Thermal Fluid Dynamics into the Evolution of Porosity during Selective Laser Melting. Scr. Mater. 2015, 105, 14–17. [Google Scholar] [CrossRef]
  53. Salem, H.; Carter, L.N.; Attallah, M.M.; Salem, H.G. Influence of Processing Parameters on Internal Porosity and Types of Defects Formed in Ti6Al4V Lattice Structure Fabricated by Selective Laser Melting. Mater. Sci. Eng. A 2019, 767, 138387. [Google Scholar] [CrossRef]
  54. Yonehara, M.; Ikeshoji, T.-T.; Nagahama, T.; Mizoguchi, T.; Tano, M.; Yoshimi, T.; Kyogoku, H. Parameter Optimization of the High-Power Laser Powder Bed Fusion Process for H13 Tool Steel. Int. J. Adv. Manuf. Technol. 2020, 110, 427–437. [Google Scholar] [CrossRef]
  55. Montero-Sistiaga, M.L.; Pourbabak, S.; Van Humbeeck, J.; Schryvers, D.; Vanmeensel, K. Microstructure and Mechanical Properties of Hastelloy X Produced by HP-SLM (High Power Selective Laser Melting). Mater. Des. 2019, 165, 107598. [Google Scholar] [CrossRef]
  56. Tumkur, T.U.; Voisin, T.; Shi, R.; Depond, P.J.; Roehling, T.T.; Wu, S.; Crumb, M.F.; Roehling, J.D.; Guss, G.; Khairallah, S.A.; et al. Nondiffractive Beam Shaping for Enhanced Optothermal Control in Metal Additive Manufacturing. Sci. Adv. 2021, 7, 1–12. [Google Scholar] [CrossRef] [PubMed]
Figure 1. FEM model description.
Metals 13 00011 g001
Figure 2. Schematic diagram of coupled heat source.
Metals 13 00011 g002
Figure 3. Thermophysical parameters of CP-Ti: (a) thermal conductivity; (b) specific heat.
Metals 13 00011 g003
Figure 4. Melt pool morphology of different scanning speeds at a laser power of 400 W: (ad,il) simulated; (eh,mp) experimental.
Metals 13 00011 g004
Figure 5. Simulated and experimental melt pool width and depth values.
Metals 13 00011 g005
Figure 6. Melt pool geometries with a laser power of 400 W: (ac) Gaussian surface heat source; (df) double ellipsoid volumetric heat source; (gi) surface–volumetric coupled heat source; (jl) experimental.
Metals 13 00011 g006
Figure 7. Melt pool temperature contours simulated with a laser power of 400 W and scanning speed of 1400 mm/s: (a) horizontal cross-section; (b) longitudinal cross-section.
Metals 13 00011 g007
Figure 8. Temperature–time curves for: (a) different laser powers at a scanning speed of 1400 mm/s; (b) different scanning speeds at a laser power of 400 W.
Metals 13 00011 g008
Figure 9. (a) Illustration of the extraction of solidification cooling rates from temperature–time curves; (b) Effect of different process parameters on cooling rate.
Metals 13 00011 g009
Figure 10. Effects of different process parameters on melt pool geometry: (a) depth; (b) width; (c) depth-to-width ratio.
Metals 13 00011 g010
Figure 11. Diagrammatic sketch of the formation mechanism of defects on the: (a) high depth-to-width ratio; (b) medium depth-to-width ratio; (c) low depth-to-width ratio.
Metals 13 00011 g011
Figure 12. Comparison of predicted process parameter map with experiments from literature reports [41,45,46,47,48,49,50,51,52,53].
Metals 13 00011 g012
Table 1. Chemical composition of the test CP-Ti powder.
ElementFeCHONTi
wt %0.017≤0.010.00150.0850.005Bal.
Table 2. Maximum temperature (°C) of melt pool with different process parameters.
Power (W)Scanning Speed (mm/s)
6008001000120014001600180020002200240026002800300032003400360038004000
300417434672978262723442095193217321625150213931266120011631124110110671017
350487840423458304027252459223520971930175516621582144313311284124511911142
400556246183991349031332826258423932214207819651823164215321471136613191235
450624751874463391734953173290226752488231321552014191217881652155314691394
500682357654921431338543497320929532756257124212274217220161901176716711600
* Temperature lower than the melting point in blue, and higher than the boiling point in red.
Disclaimer/Publisher’s Note: The statements, opinions and data contained in all publications are solely those of the individual author(s) and contributor(s) and not of MDPI and/or the editor(s). MDPI and/or the editor(s) disclaim responsibility for any injury to people or property resulting from any ideas, methods, instructions or products referred to in the content.

