Article

Hall-Petch Strengthening by Grain Boundaries and Annealing Twin Boundaries in Non-Equiatomic Ni2FeCr Medium-Entropy Alloy

1
National Key Laboratory for Precision Hot Processing of Metals, School of Materials Science and Engineering, Harbin Institute of Technology, Harbin 150001, China
2
Laboratory for Space Environment and Physical Sciences, Harbin Institute of Technology, Harbin 150001, China
3
No. 703 Research Institute of China State Shipbuilding Company Limited, Harbin 150036, China
*
Author to whom correspondence should be addressed.
Metals 2023, 13(1), 134; https://doi.org/10.3390/met13010134
Submission received: 29 November 2022 / Revised: 20 December 2022 / Accepted: 26 December 2022 / Published: 9 January 2023
(This article belongs to the Special Issue Hot Forming/Processing of Metallic Materials)

Abstract

:
A novel Co-free non-equiatomic Ni2FeCr medium-entropy alloy (MEA) was designed, and the Hall–Petch strengthening by grain boundaries and annealing twin boundaries was investigated. For this purpose, the alloy was prepared by cold rolling and recrystallization at 873–1323 K for 40 min–6 h. Annealing at different temperatures revealed that Ni2CrFe alloy forms a stable face-centered cubic (FCC) solid solution. Mean grain sizes (excluding annealing twin boundaries) and mean crystallite sizes (including both grain and annealing twin boundaries) were determined using the linear intercept method and the equivalent circle diameter in electron back-scattered diffraction (EBSD) soft. Tensile tests at 293 K indicated that the Hall-Petch slopes of grain sizes and crystallite sizes are 673 and 544 MPa μm1/2, respectively, and this contribution was then subtracted from the overall strength to calculate the intrinsic uniaxial lattice strength (90 MPa). Additionally, tensile tests, performed between 293 K and 873 K, revealed that the Ni2CrFe MEA has a stronger resistance to softening at high temperatures. Transmission electron microscopy of deformed specimens revealed the formation of dislocation pile-ups at annealing twin boundaries, indicating that it is also an obstacle to dislocation slip. Furthermore, the thickening of the annealing twin boundary after deformation was observed and illustrated by the interaction between different dislocations and annealing twin boundaries.

1. Introduction

High-entropy alloys (HEAs)/medium-entropy alloys (MEAs) represent a new class of metallic materials, which are synthesized based on the novel alloy design strategy, i.e., mixing multiple elemental compositions (three or more) in equimolar or near-equimolar ratios [1,2,3,4,5,6,7]. According to the Boltzmann formula, the alloys have a higher configuration entropy compared to traditional alloys and prefer to form disordered solid solutions with simple crystallographic structures, e.g., face-centered cubic (FCC) [3,4] and body-centered cubic (BCC) [5,6,7]. Among them, FCC system HEAs/MEAs, especially the CrMnFeCoNi HEA and its equiatomic subsystems, have been systematically investigated due to their excellent mechanical properties. These solid solutions were reported to exhibit a good combination of ductility and ultimate tensile strength [8,9,10], high work-hardening rate [11], outstanding fracture toughness [12,13], and good low temperature performance [14,15]. However, not all equiatomic HEAs/MEAs can have optimal mechanical properties. In many cases, the properties can be optimized by adjusting the ratio of elemental compositions. Recently, some attention has been shifted to the study of non-equiatomic HEAs/MEAs [16,17,18,19,20,21], which provides a new idea for the design of alloys. For example, Zhou et al. [19] designed a series of Fex(CrNiAl)100−x (at.%, 25 ≤ x ≤ 65) MEAs based on FeNiCrCoAl HEA and achieved the modulation of microstructures. Li et al. [21] used high-throughput MD simulations combined with machine learning to predict the optimum elemental composition of CrxCoyNi100−x−y MEAs. Despite the reduced configuration entropy, these non-equiatomic alloys may possess excellent microstructure and properties, which can be compared with or even better than those of equiatomic HEAs/MEAs.
Wu et al. [22] investigated the phase stability of the Cantor alloy and its equiatomic subsystems after casting and thermomechanical processing. This study demonstrated that in the ternary subsystem, all of these alloys exhibited only an FCC phase, except for the CrFeNi alloy, which manifested additional peaks belonging to the BCC phase. Additionally, Schneider et al. [23] experimentally determined that the CrFeNi MEA is single-phase FCC after annealing at 1273 K and higher temperatures, while it has a BCC + FCC two-phase microstructure after annealing at lower temperatures. Therefore, a new non-equiatomic Ni2FeCr MEA, which is developed from CoCrFeNi HEA and CrFeNi MEA, was prepared in this study. The design of this alloy is based on the following reasons: (1) the addition of a high concentration of nickel (50%) can stabilize the FCC matrix and improve the plasticity of the alloy; (2) removing the high-price element Co can reduce the cost of the alloy. The first objective of the present paper is to investigate the phase stability of the Ni2FeCr alloy and analyze it in combination with phase prediction theory.
To date, there have been many studies on the Hall-Petch relationship in HEAs/MEAs [23,24,25,26,27,28,29]. However, most of these studies only considered the contribution of grain boundaries and ignored any possible effects of annealing twin boundaries on strength [8,29], while others directly treated twin boundaries and grain boundaries as equivalents in the analysis of the Hall-Petch relationship [24]. In recent studies, Schneider et al. [23,27,28] proposed two statistical methods for grain size, i.e., mean grain sizes (excluding annealing twin boundaries) and mean crystallite sizes (including both grain and annealing twin boundaries). Therefore, the second objective of the present study is to investigate the Hall-Petch strengthening by grain boundaries and annealing twin boundaries in Ni2FeCr MEA and clarify the effect of temperature on strength.
Interaction between dislocations and twin boundaries can either result in blockage of the incoming slip or result in a “dislocation reaction” [29,30]. Such interaction effectively impedes dislocation movement, which is manifested as enhancements in strength and strain hardening. Therefore, the last objective of this study is to analyze the twinning morphology of the Ni2FeCr alloy after deformation and explain the interaction between dislocations and twinning boundaries through dislocation reactions.

2. Materials and Methods

2.1. Processing

Non-equiatomic Ni2CrFe MEAs were prepared using non-consumable vacuum melting technology. High-purity (≥99.99 wt.%) elemental metals Ni, Cr, and Fe were melted in water-cooled crucibles. The furnace chamber was evacuated to 3 × 10⁻³ Pa and then filled with high-purity Ar (99.998 vol%) to a pressure of 500 Pa. This process was repeated 3 times to ensure that the alloy is not oxidized during the melting process. The weight of each fabricated ingot was approximately 200 g, and each ingot was remelted six times to ensure chemical homogeneity. The as-cast Ni2CrFe MEA ingots were homogenized at 1473 K for 2 h. These specimens were cut into cubes with a size of 30 mm (length) × 25 mm (width) × 11 mm (thickness) by electrical discharge machining (EDM), as exhibited in Figure 1a, and then cold-rolled to 3.3 mm in thickness reduction of 70% by multipass rolling (each pass reduction is 0.5 mm). To establish different grain sizes, the cold-rolled sheets were treated at temperatures ranging between 873 K and 1323 K for times between 40 min and 6 h. After the heat treatments, the sheets were air-cooled and designated as CR-873/1, CR-1023/0, CR-1023/1, CR-1023/2, CR-1023/4, CR-1023/6, CR-1173/1, and CR-1323/1, respectively, as shown in Table 1.

2.2. Characterization and Testing

Specimens for characterization were extracted from the cold-rolled sheets after heat treatment using EDM, as shown in Figure 1b. If not otherwise specified, all experiments in the current work tested four samples to verify the stability and reproducibility of the available data. The crystal structure of the Ni2CrFe samples was evaluated using X-ray diffraction at room temperature (XRD, Cu Kα radiation and a 2θ scattering from 20° to 100° at a speed of 8°/min, The Netherlands). Scanning electron microscopy (SEM, ZEISS, GER) equipped with energy-dispersive spectroscopy (EDS) and an electron back-scattered diffraction (EBSD) detector was used to characterize the microstructure and crystallographic features. Samples for SEM and EBSD were first polished mechanically and then electrolytically polished in 90% CH3OH + 10% HClO4 solution at a working voltage of 20 V and current of 0.5 A for 40–50 s at 263 K. Meanwhile, the EBSD working acceleration voltage was set at 20 kV with a tilt angle of 70 °. The step size used for data collection was 0.5 μm or 1.5 μm depending on the state of the specimen. EBSD characterizations were carried out on the RD (rolling direction)-TD (transverse direction) section. The microstructure was also characterized by transmission electron microscopy (TEM). Slices for TEM were cut from tensile specimens deformed to fractured. These slices were parallel to the tensile axis and ground to a thickness of 30–50 μm using SiC paper, and then further thinned using argon ion milling (GATAN685) to their final thickness.
Uniaxial tensile tests were performed with an Instron 5569 materials testing machine at a fixed strain rate of 1 × 10⁻³ s−1 over a temperature range of 293 K to 873 K. Tensile specimens in a dog-bone shape with a gauge dimension of 15 mm × 2 mm × 2 mm were machined from each sheet by EDM, as illustrated in Figure 1b. Before starting the high temperature test (473–873 K), the specimens were held at the specified temperature for 20 min to reach thermal equilibrium and performed in a temperature-controlled chamber.

2.3. Grain Boundary and Grain Size Analysis

Grain boundaries and texture characteristics in EBSD data were conducted using the Aztec Crystal software. For grain boundary analysis, an effort was made to distinguish the ∑3 {111} boundary (annealing twin boundaries, defined by a misorientation of 60° with a tolerance of 5°).
As annealing twin boundaries can in principle act as barriers to dislocation ship, they are sometimes taken into account when assessing the strengthening caused by boundaries [11,13,30,31,32,33,34,35]. However, many studies have demonstrated that, compared to grain boundaries, the annealing twin boundaries in FCC alloys are weaker obstacles to dislocation slip [22,35]. Thus, the annealing twin boundaries are excluded from the count of grain sizes. Here, we defined two different length scales, i.e., the mean grain sizes (d, excluding annealing twin boundaries) and crystallite sizes (c, including both grain and twin boundaries). The grain and crystallite sizes were determined with the Heyn linear intercept method using four equidistant and parallel lines of identical length in the vertical and horizontal directions, respectively, per micrograph. Meanwhile, the size results obtained directly from EBSD measurements were compared with the line intercept method. To further analyze the information of annealing twin in Ni2FeCr alloy, the average number of twin boundaries per grain (n) was defined as n = (−1 + d/c) [23].

3. Results and Discussion

3.1. Phase Identification and Phase Stability

Figure 2a shows several representative XRD diffraction results of CR, CR-873/1, CR-1023/1, CR-1173/1, and CR-1323/1. The XRD patterns show all Ni2FeCr samples retained a single-phase FCC structure, indicating that no phase transformation occurred during annealing at different temperatures, i.e., the MEA has phase stability at 293–873 K. Figure 2b shows the zoom-in (111) diffraction peak, which maintains a stable 2θ values after annealing at different temperatures. However, as the annealing temperature increases, the intensity of the (111) peak gradually increases, while the intensity of the (200) and (311) peaks exhibits an opposite trend. Small cleavage peaks can be observed in the (111) diffraction peak, due to the generation of deformed subgrain in the cold-rolled sample. Moreover, the intensity of the cleavage peak decreases with increasing recrystallization temperature. Based on the (111) diffraction peaks, the lattice parameter of the FCC phase was calculated as 0.3571 ± 0.0004 nm.
Compared with HEAs, the configuration entropy of MEAs is lower, and the ability of the alloy to form single-phase solid solutions is reduced, i.e., new phases are easily generated in MEAs after thermomechanical processing. As shown in a previous study, Wu et al. [22] showed that the CrFeNi MEA is single-phase FCC after casting and homogenization at 1473 K for 24 h. However, after cold rolling followed by recrystallization at 1073 K for 1 h, a second phase, which has the BCC structure, was found on the grain boundaries. Later on, Laplanche et al. [36] found that the CrFeNi MEA has an FCC + BCC two-phase structure when the alloy is swaged and recrystallized for 1 h at 1173 K. According to the phase formation criterion of Guo et al. [37], when the effective VEC of an alloy is ≥8, it tends to form as a single-phase FCC; for values between 6.87 and 8, it tends to form as a two-phase FCC + BCC; and for values ≤ 6.87, it tends to form as a single-phase BCC. To determine whether this is true in CrFeNi MEA and our non-equiatomic MEA, we calculated their effective VECs, using the elemental VECs given in Ref. [37] as 8.00 and 8.50, respectively. We found that our alloys obey the VEC criterion of Guo, i.e., the addition of nickel (50%) can improve the effective VEC value and stabilize the FCC matrix.

3.2. Grain and Crystallite Sizes

Our heat treatments yielded six different fully recrystallized alloys. Their mean grain sizes (d) and mean crystallite sizes (c) are given in Table 2. Additionally, Table 2 lists the corresponding heat treatment processes and the number of annealing twin boundaries per grain (n). Despite some experimental scatter, n may be considered approximately constant and equal to 0.46 ± 0.1 for all grain sizes. This result is consistent with previous studies for FeMnNi MEA [28], as well as for the CrCoNi and CoCrFeMnNi alloy [8,23]. However, the latter study also revealed that for larger grain sizes, the n value appears to increase with grain size, and a reasonable explanation was provided using a theory proposed by Fullman and Fisher [38].
A comparison of the grain sizes obtained using the line intercept method (dLIM) and those determined using EBSD (dEBSD) is given in Figure 3. To better distinguish between grain boundaries and twin boundaries, the Heyn intercept method was performed in the EBSD image instead of the BSE image, i.e., the image in the upper left corner in Figure 3. Each EBSD image contained at least 100 grains in the measured field. Meanwhile, grain sizes excluding annealing twin boundaries were obtained using the Aztec Crystal software (see the image at the bottom right of Figure 3 in which the grain sizes are detected by an equivalent circle diameter, i.e., d = (4A / π)1/2, where A is the area of the grains). The plot of dLIM versus dEBSD has an excellent linear correlation (the line with slope 1 passes through the origin), which indicates that these grains are equiaxed. A previous study, published by Schneider et al. [23], reported that the crystallite size plot similar to Figure 3 does not yield the same linear correlation since annealing twins have an elongated geometry. However, the crystallite sizes obtained using the line intercept method (cLIM) and those determined using EBSD (cEBSD) also exhibit a linear correlation. This confirms the validity of the crystallite size measurement using the equivalent circle diameter in Aztec Crystal software.

3.3. Microstructure and Texture

The EBSD diagram of the cold-rolled Ni2CrFe alloy along the rolling direction is presented in Figure 4. Figure 4a and b show the EBSD crystallite orientation map and band contrast map. It reveals that the grain of cold-rolled alloy was elongated along the rolling direction, and deformed subgrains were formed in it. Additionally, wave-shaped adiabatic shear bands (ASBs) are formed between the two elongated grains, which is influenced by thermal conductivity and local deformation. A similar phenomenon was observed in high-strength and high-toughness nickel steels, in which adiabatic shear bands formed under dynamic loading conditions due to shear localization [39]. Figure 4c further analyzes the crystallographic texture of cold-rolled alloy. It shows a significant grain selection orientation formation with a maximum pole density that is 22.94 times random. Combined with the standard pole figure (PF) of the { 3 ¯ 3 ¯ 4 } <313> textures in cubic crystals, it can be found that the mainly crystallographic orientation of the cold-rolled Ni2CrFe alloy was a { 3 ¯ 3 ¯ 4 } <313> texture.
Figure 5 shows representative color-coded grain orientation maps and corresponding inverse pole figures (IPFs) showing the texture of recrystallized Ni2CrFe alloys with different grain and crystallite sizes. The color of the grain orientation map is determined according to their crystallographic orientation relative to the longitudinal axis of the cold-rolling direction (the coordinate axis of the sample was defined as rolling direction (RD), transverse direction (TD), and normal direction (ND), as depicted in Figure 5a). As can be seen, there is no strong texture. Only slight < 111 > and < 001 > textures are detected along the cold-rolling direction, which is typical of FCC metals with low to medium stacking fault energies [23,27,28,40,41,42]. However, the CR-1023/1 sample (d = 24 μm, c = 17 μm) has a more pronounced texture with a maximum pole density that is 6.1 times random, as shown in Figure 5d. Therefore, it can be assumed that the CR-1023/1 alloy forms a grain-optimized orientation after annealing at 1023 K for 6 h, which may have an impact on the mechanical properties.
To analyze the effect of texture on the mechanical properties, we calculated Taylor factors for all alloys using the EBSD results. This demonstrates that the Taylor factor for most alloys is close to the value of isotropic FCC polycrystals (3.06). Except for the CR-1023/1 sample, which has a pronounced texture, the Taylor factor increases by about 7% relative to that of an isotropic polycrystal. Therefore, when considering the potential effect of texture on strength, we normalized the yield strength of the alloy by the corresponding Taylor factor (M), i.e., the yield stress multiplied by a factor of 3.06/M.

3.4. Effect of Grain Size and Temperature on Mechanical Properties

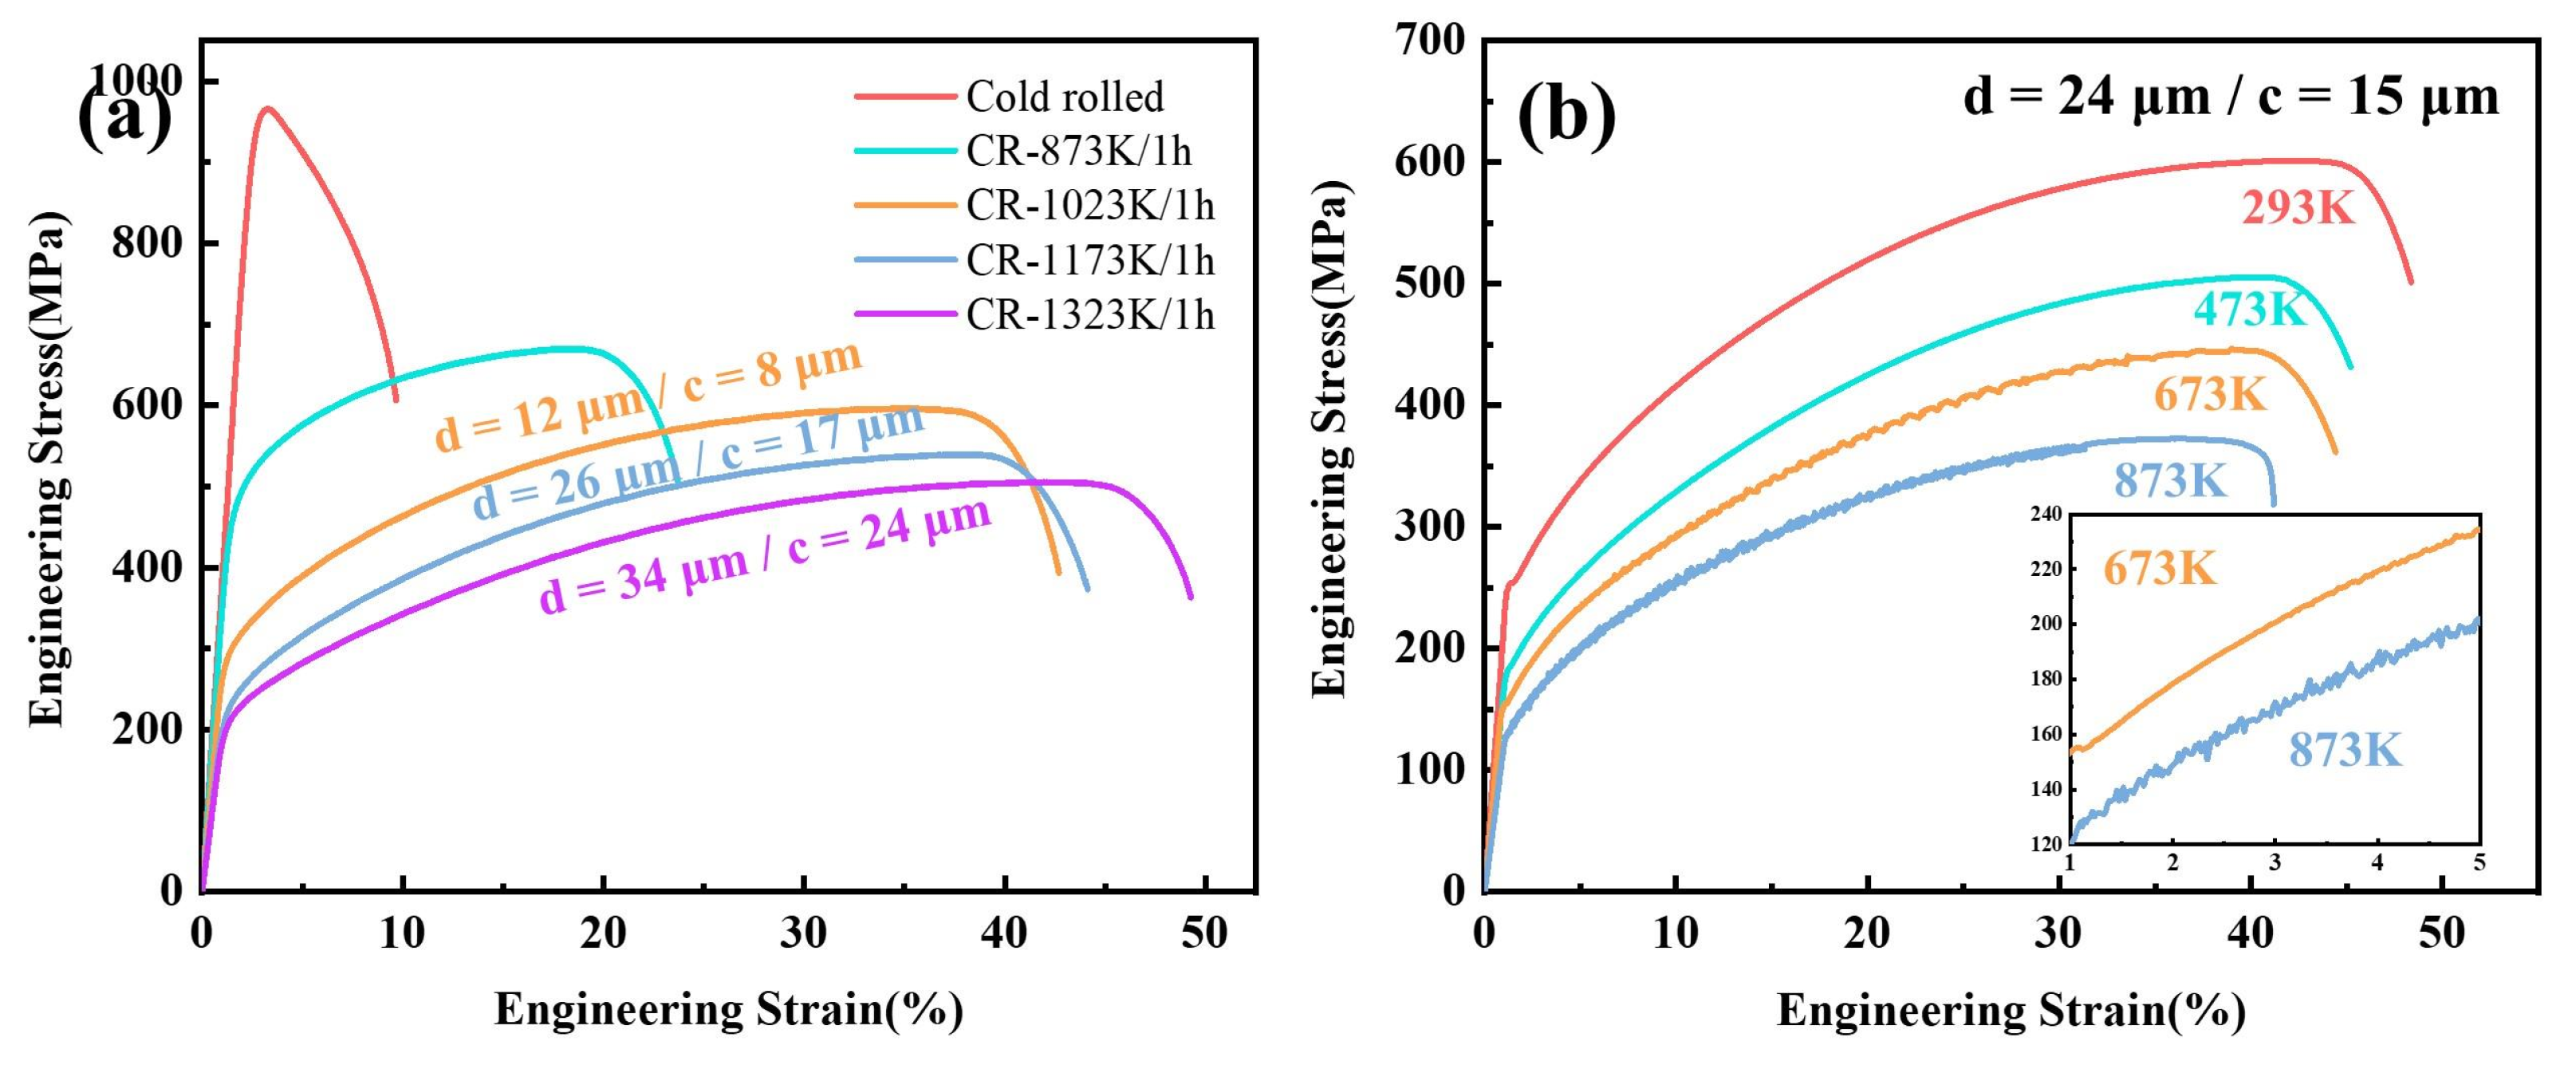
Figure 6a shows representative tensile engineering stress–strain curves at room temperature of the Ni2CrFe alloys after cold rolling and annealing at different temperatures for 1 h. This indicates that the strength of Ni2CrFe alloys gradually decreases as the annealing temperature increases after cold rolling. This is mainly attributed to the recrystallized grains’ growth and dislocation annihilation. More importantly, the yield stress as well as the flow stress are increasing with decreasing grain/crystallite size, as shown in the tensile curves of CR-1023/1, CR-1173/1 and CR-1323/1 alloys in Figure 6a. The effect of temperature (293–873 K) on the tensile stress–strain behavior of the Ni2CrFe MEA with a grain size of 24 μm (crystallite size, c = 15 μm) is shown in Figure 6b. It can be seen that the yield strength, ultimate tensile strength, and ductility decrease significantly with increasing temperature between 293 K and 873 K. However, the stress–strain curves are similar at 673 and 873 K, i.e., the serrations appear in the curves, which indicates the beginning of an athermal plateau (as shown in the illustration of Figure 6b). Interestingly, the beginning of the stress-strain curve is smooth at 673 K until the engineering strain of approximately 4%, when the serrations are first observed and continue into the necking stage. In contrast, at 873 K, the serrations appear right after yielding and disappear after necking. The serrated unstable plastic flow observed at high temperatures (T ≥ 673 K) is often found in solid solution reinforced alloys, for example, nickel-based super alloys. Gopinath et al. [43] studied the serration behavior of Ni-base superalloy 720Li at intermediate temperatures of 723, 773, and 823 K at strain rates between 10−3 and 10−5 s−1. They found that locking of mobile dislocations by substitutional elements is responsible for jerky flow, i.e., the serrations may be attributed to the segregation of substitutional elements at stacking faults bounded by Shockley partials [44] and/or the formation of Cottrell atmospheres [45].
The hindering effect of grain boundaries on dislocations is generally described by the Hall-Petch relationship between grain size (d) and yield stress ( σ y ) [46,47]:
σ y = σ 0 + k y d 1 / 2
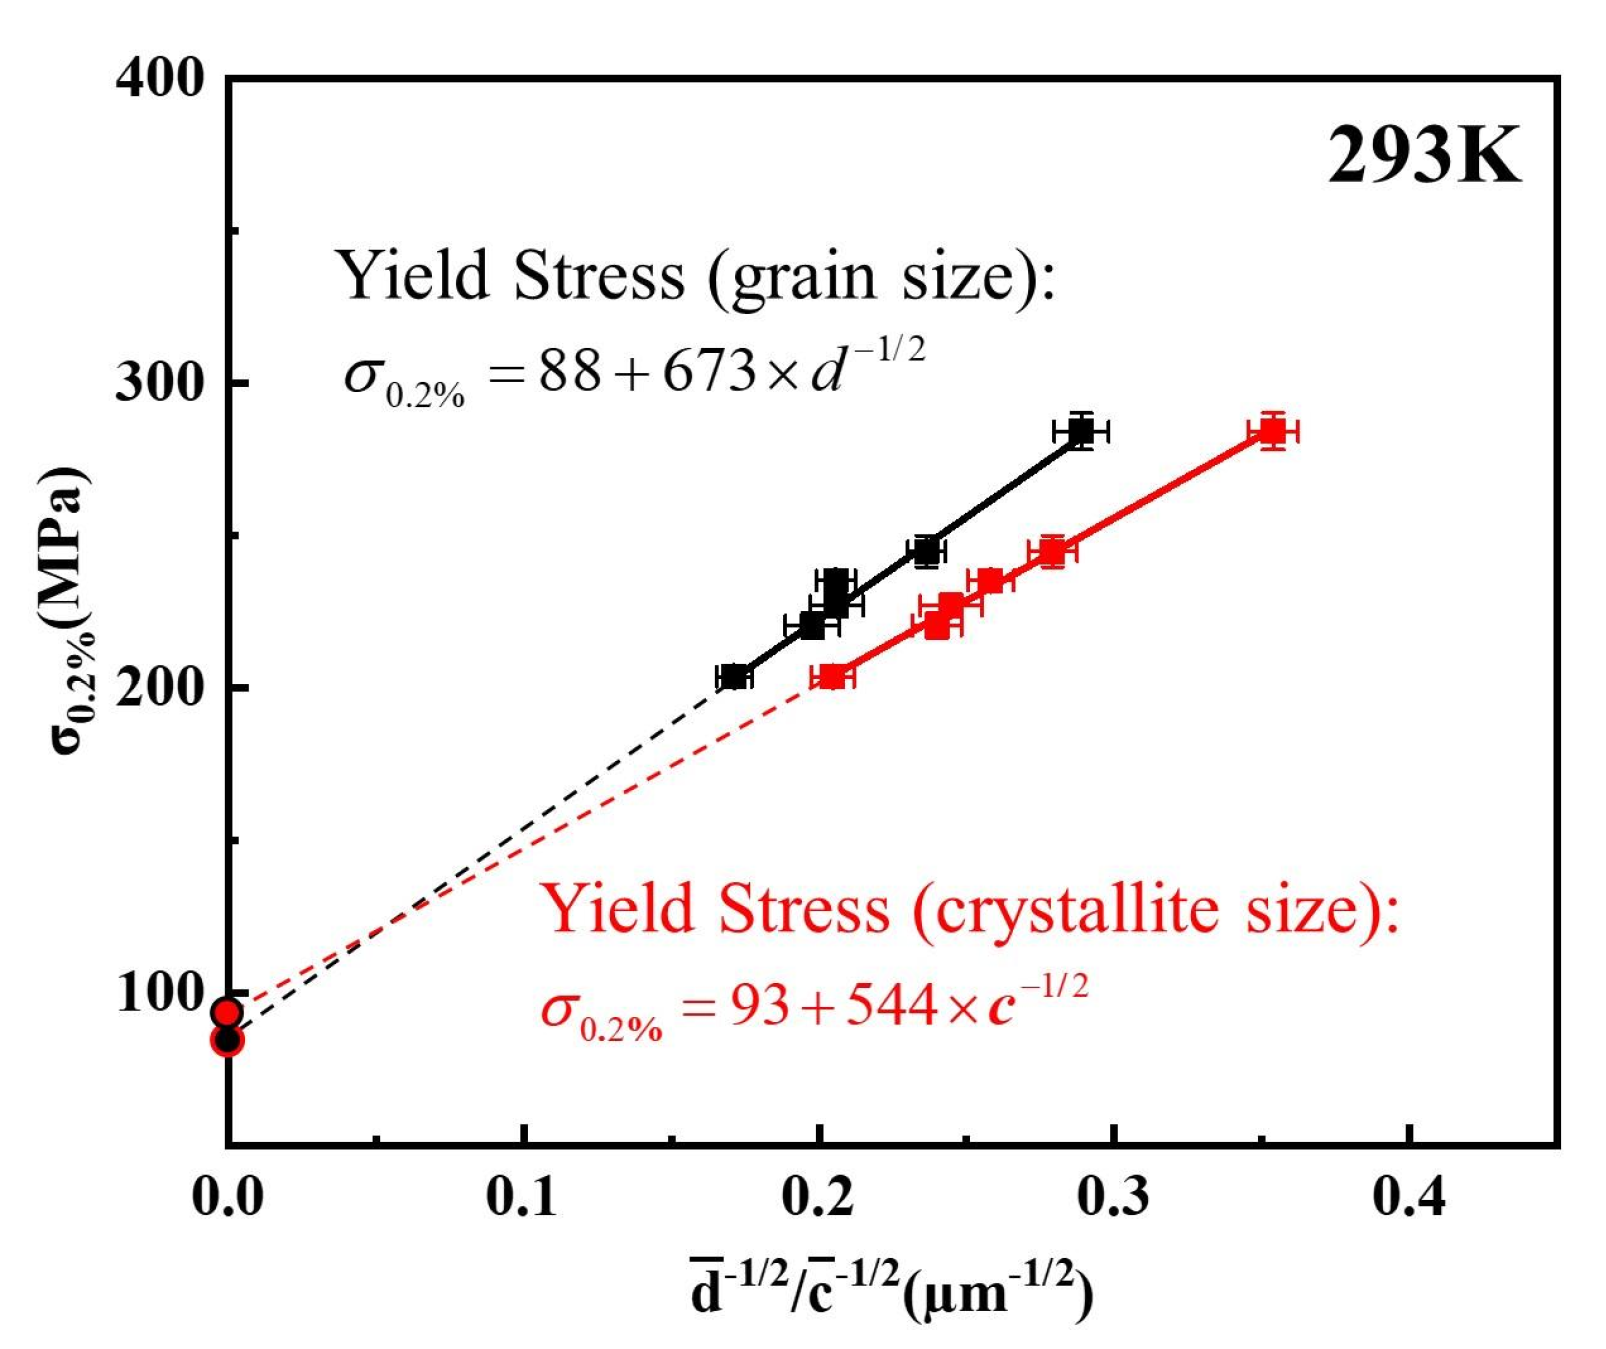
where σ 0 is the intrinsic lattice strength, representing the resistance of the crystal dot matrix to dislocation slip, i.e., the Peierls-Nabarro stress, and k y is the resistance offered by grain boundaries to dislocation slip. Note that in this paper, we count the grain sizes (d, excluding twin boundaries) and the crystallite sizes (c, including twin boundaries). Combining the yield stress (σ0.2%) obtained in the tensile tests, the Hall-Petch parameters ( σ 0 and k y ) of yield stress versus grain sizes d or crystallite sizes c were obtained by fitting the data with errors using a weighted least squares method, as shown in Figure 7. By extrapolating the linear fit for an infinite grain size ( d 1 / 2 0 ) and crystallite size ( c 1 / 2 0 ), we calculated the intrinsic lattice strengths to be 88 ± 6 and 93 ± 8 MPa (black and red dots in Figure 7), respectively. These two values are in good agreement, so it can be assumed that the intrinsic lattice strength of Ni2CrFe alloy is 90 MPa. Additionally, the slope, ky, of the Hall-Petch plot is 673 ± 28 and 544 ± 35 MPa μm 1/2. A comparison of the Hall–Petch slopes in Figure 7 reveals that the ratio of the Hall-Petch slope including grain boundaries and twin boundaries to the slope without twin boundaries is 0.81. This result can be attributed to the fact that for all alloys investigated in this study, the n value is approximately 0.46, i.e., there is about one annealed twin boundary in every two grains. As a result, the slope is expected to decrease by a factor of 1 / n + 1 = 0.82, in perfect agreement with the appeal results (detailed derivation can be found in Ref. [23]).
We now compare the experimentally determined Hall-Petch parameters of the Ni2CrFe alloy at 293 K with Figure 4b in the study by Schneider et al. [23]. Note that we mainly compare the experimentally obtained intrinsic lattice strength of the alloy, without calculating the predicted strength of Ni2CrFe alloy based on the solid dilution strengthening model of Varvenne et al [48]. The results show that the intrinsic lattice strength and Hall-Petch slope of Ni2CrFe alloy are moderate compared to CrMnFeCoNi and CrCoNi alloys, while its grain boundary strengthening is superior compared to Ni alloys (as shown in Table 3).
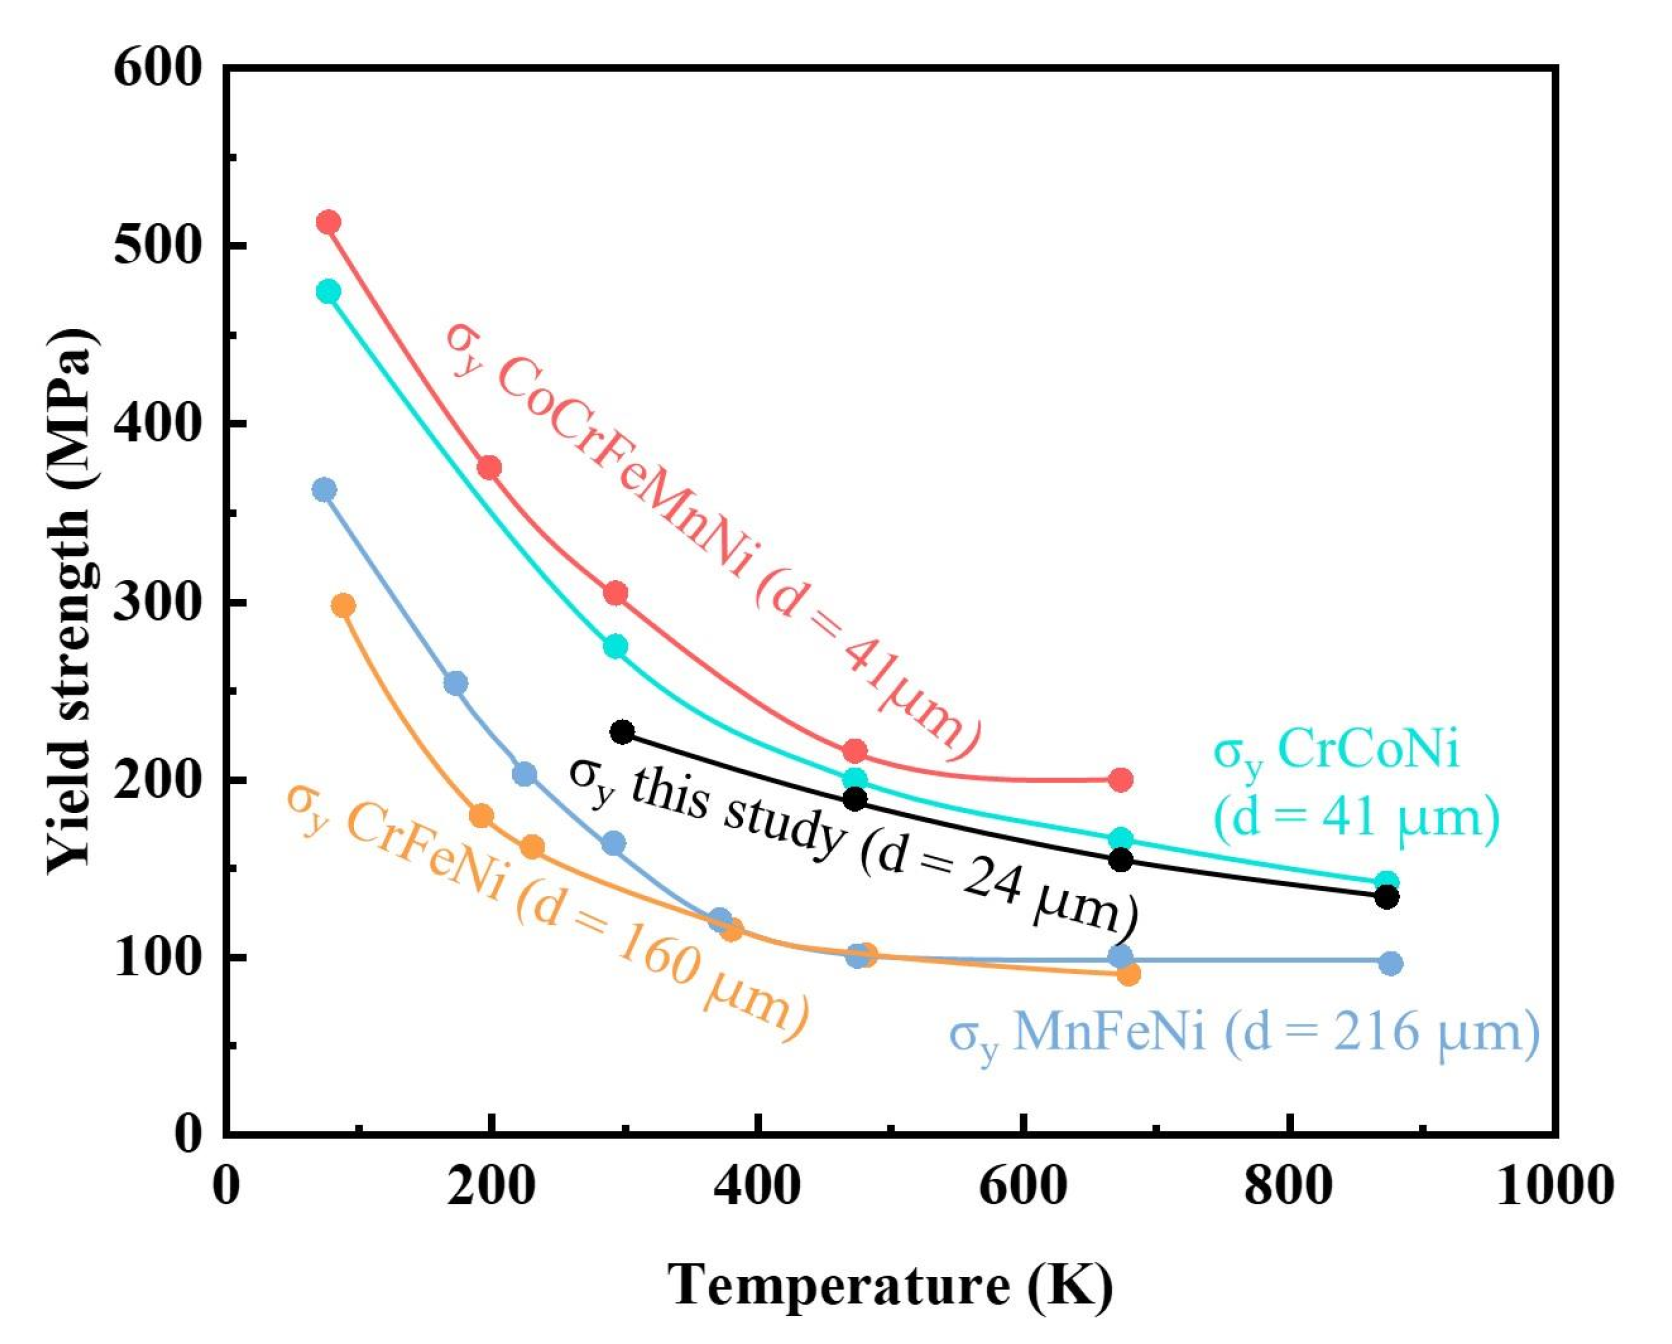
Another comparison of the temperature dependence of the 0.2% yield stress of the Ni2CrFe MEA (d = 24 μm, c = 15 μm) with those of other HEAs/MEAs reveals a similar trend. Figure 8 shows that the yield stress for d = 24 µm decreases with increasing temperature in the range 293–873 K, while it gradually levels off at higher temperatures, indicating that it corresponds to the athermal regime. In previous studies, the large decrease in yield stress with temperature cannot be attributed only to a softening of the shear modulus but was also related to thermal activation during plastic deformation. Please note that although the strength of Ni2CrFe MEA was only measured in the temperature range 293–873 K, a comparison with other alloys shows that the strength of this alloy decreases more slowly with increasing temperature, i.e., the alloy has a strong resistance to softening at high temperatures.

3.5. Analyses of Interactions between Slip Dislocations and Annealing Twins

In the primary recrystallization of low stacking fault energy metals after cold deformation, low-energy twin boundaries develop, high-energy grain boundaries and subgrain boundaries are reduced, and deformed grains are engulfed, allowing annealing twin nucleation and growth. For FCC alloys, the twin boundary is generally the {111} planes, since the {111} plane is a close-packed plane and has a lower energy. Figure 9 shows the color-coded grain orientation maps and {111} plane polar diagram of the twins and the corresponding grains in Ni2CrFe alloys after annealing at different temperatures for 1 h. As can be seen, the twin boundaries in all annealed alloys are the {111} plane, which is corroborated by the fact that the alloys are FCC structures.
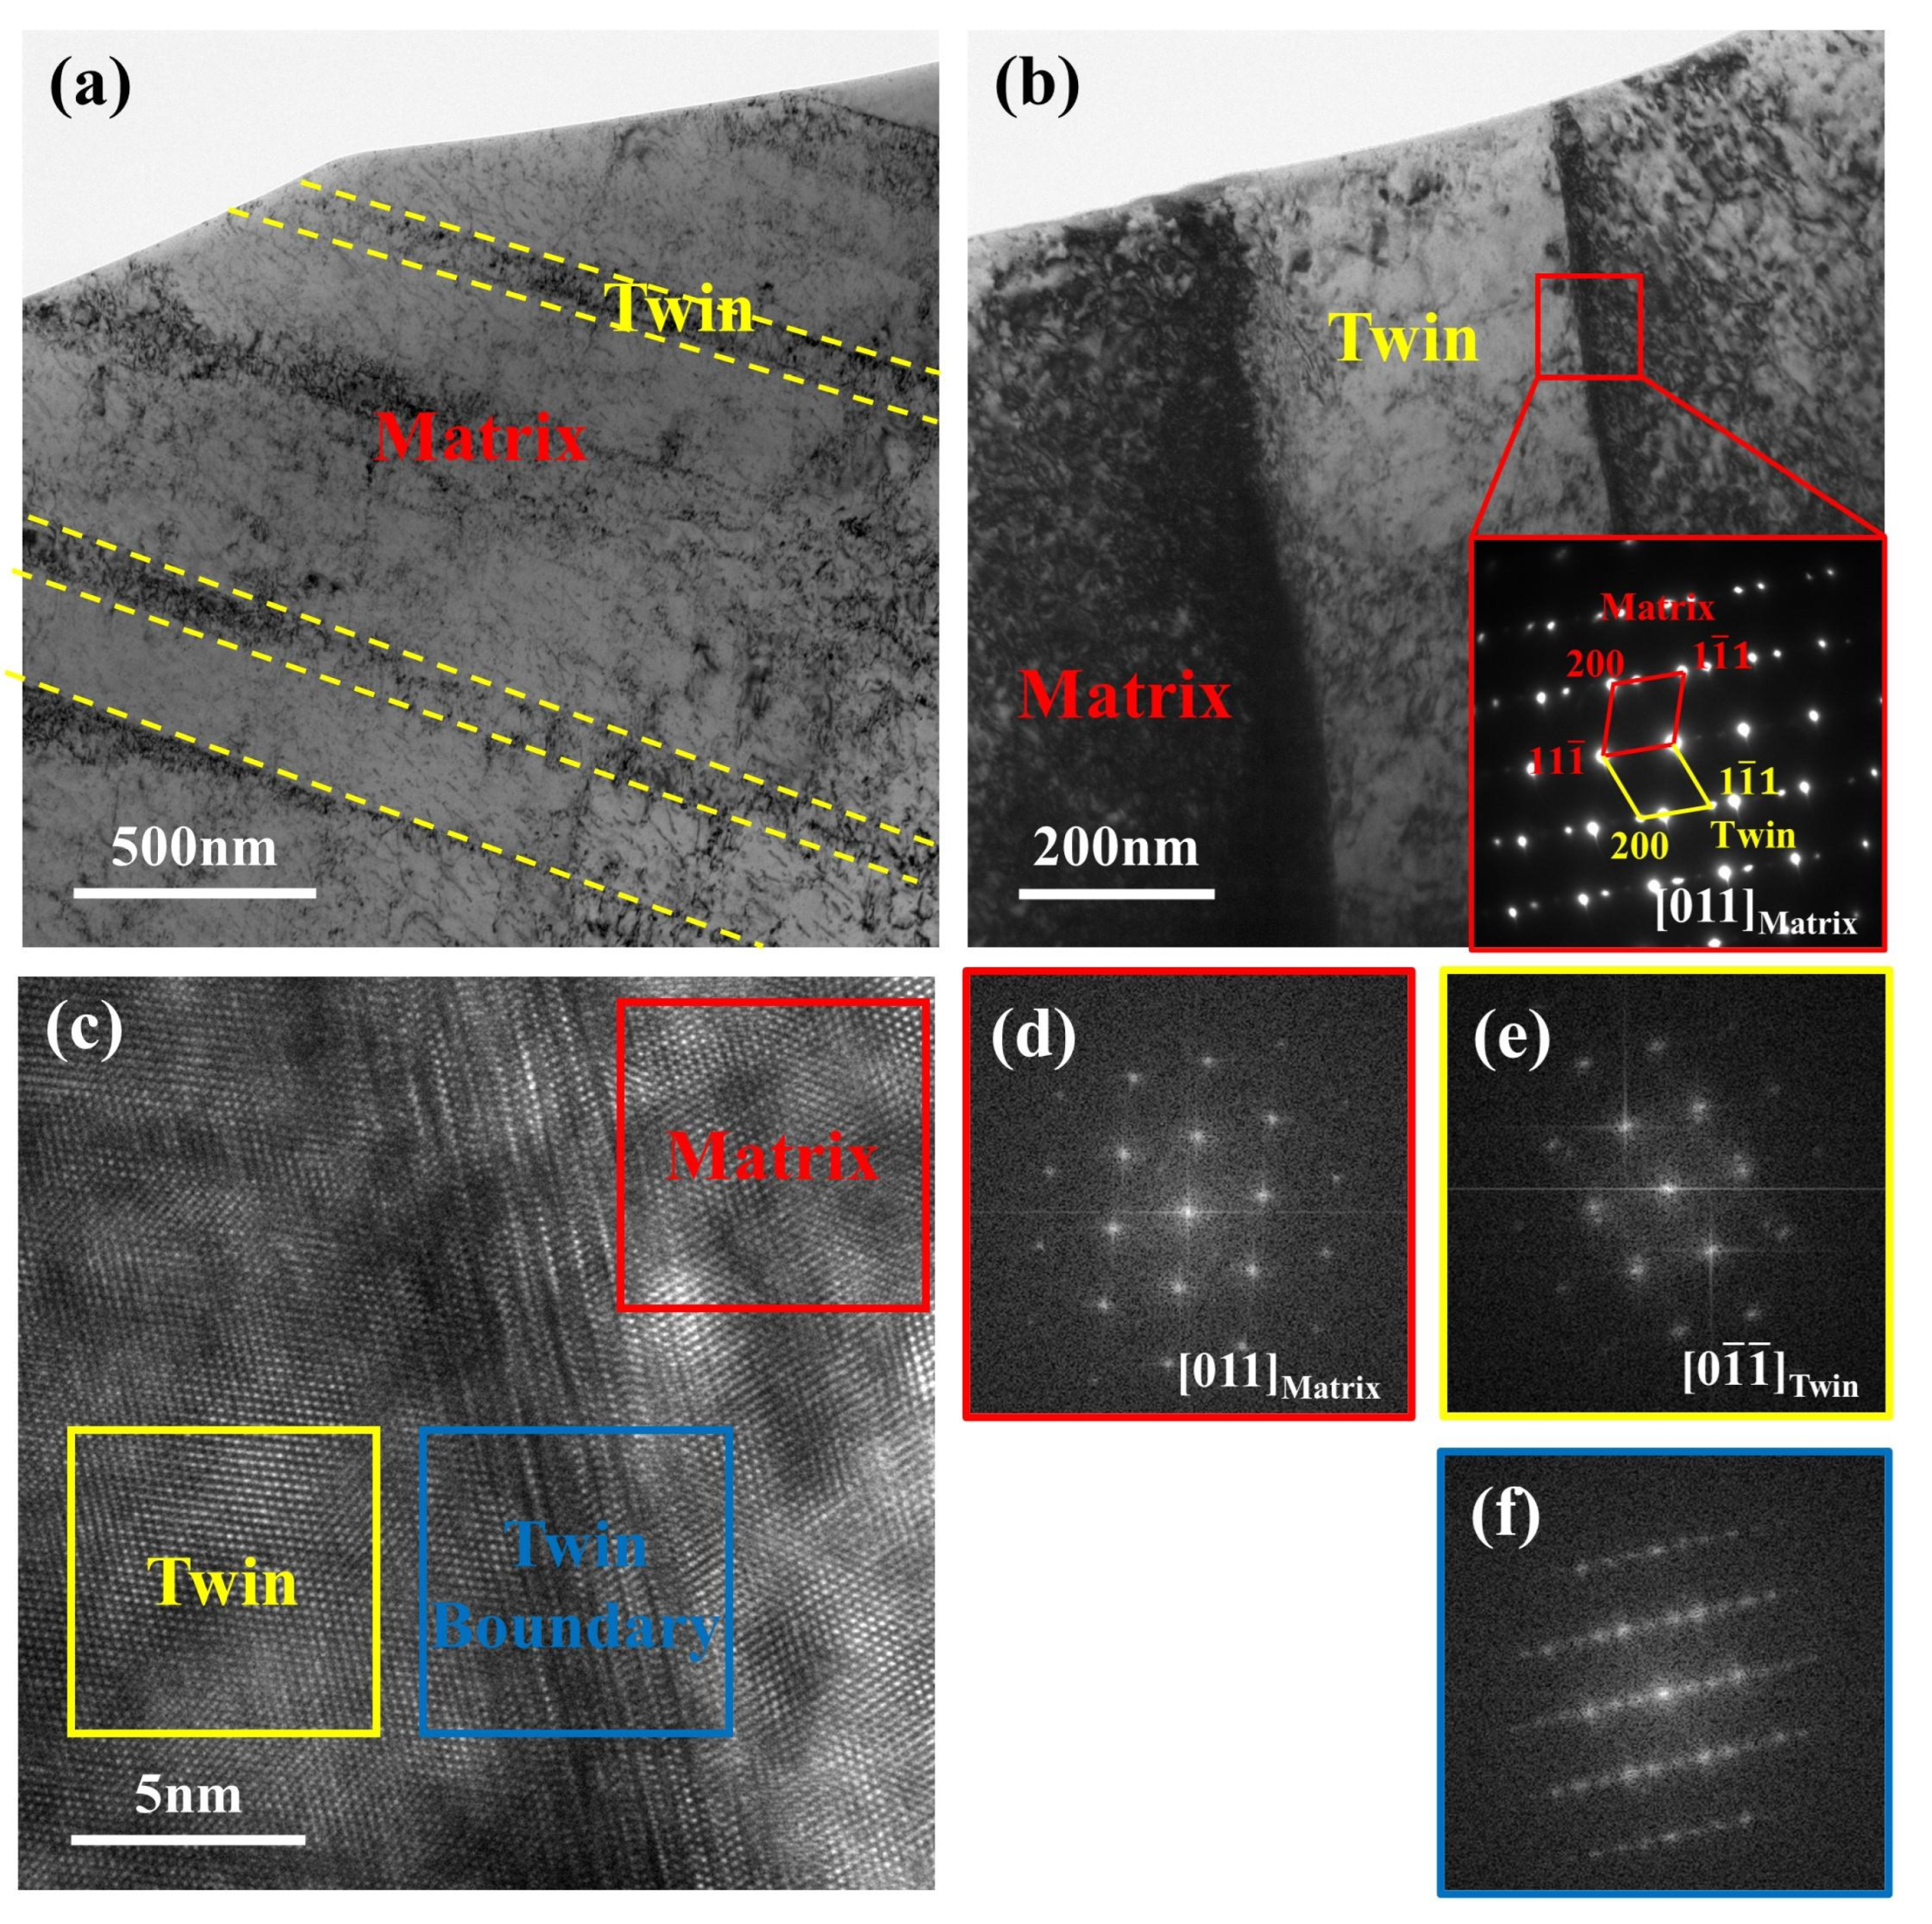
To uncover the interactions between dislocations and the annealing twin boundaries, TEM investigations were performed on CR-1023/4 specimens after tensile fracture at 293 K. In Figure 10a, multiple annealing twins can be seen with a thickness of about 200 nm. These fine twins may not be detected in EBSD. More importantly, dislocations are seen to pile up against annealing twin boundaries (Figure 10b), indicating that twin boundaries are effective barriers to dislocation slip. Additionally, the selected-area electron diffraction (SAED) of the twin boundary demonstrates the crystallographic orientation relationship between the annealing twin and the matrix, i.e., a 180° mirror symmetry relationship between the twin and the matrix. Thus, the twin can be formed by rotating the matrix alloy by 180° around the twinning direction, i.e., the orientation of the matrix/parent phase can be transformed into a twinning orientation by the transformation matrix of Equation (2).
T ( 111 ) = 1 3 ( 1 2 2 2 1 2 2 2 1 )
Applying this transformation matrix to the Burgers vector of slip dislocations in the matrix, the corresponding Burgers vector in the twin can be derived.
Figure 10c shows a high-resolution TEM (HRTEM) image for twin boundary, and the corresponding fast Fourier transformation (FFT) images are shown in Figure 10d-f. Please note that the twin boundary in HRTEM images has a thickness of 10-20 atomic layers, which is thicker than the annealing twin boundary in undeformed alloys. There are also obvious steps and dislocations present on the twin boundaries. In the following, we mainly focus on the interaction between the slip dislocation and the twin boundary to explain the reason for the increase in the thickness of the twin boundary.
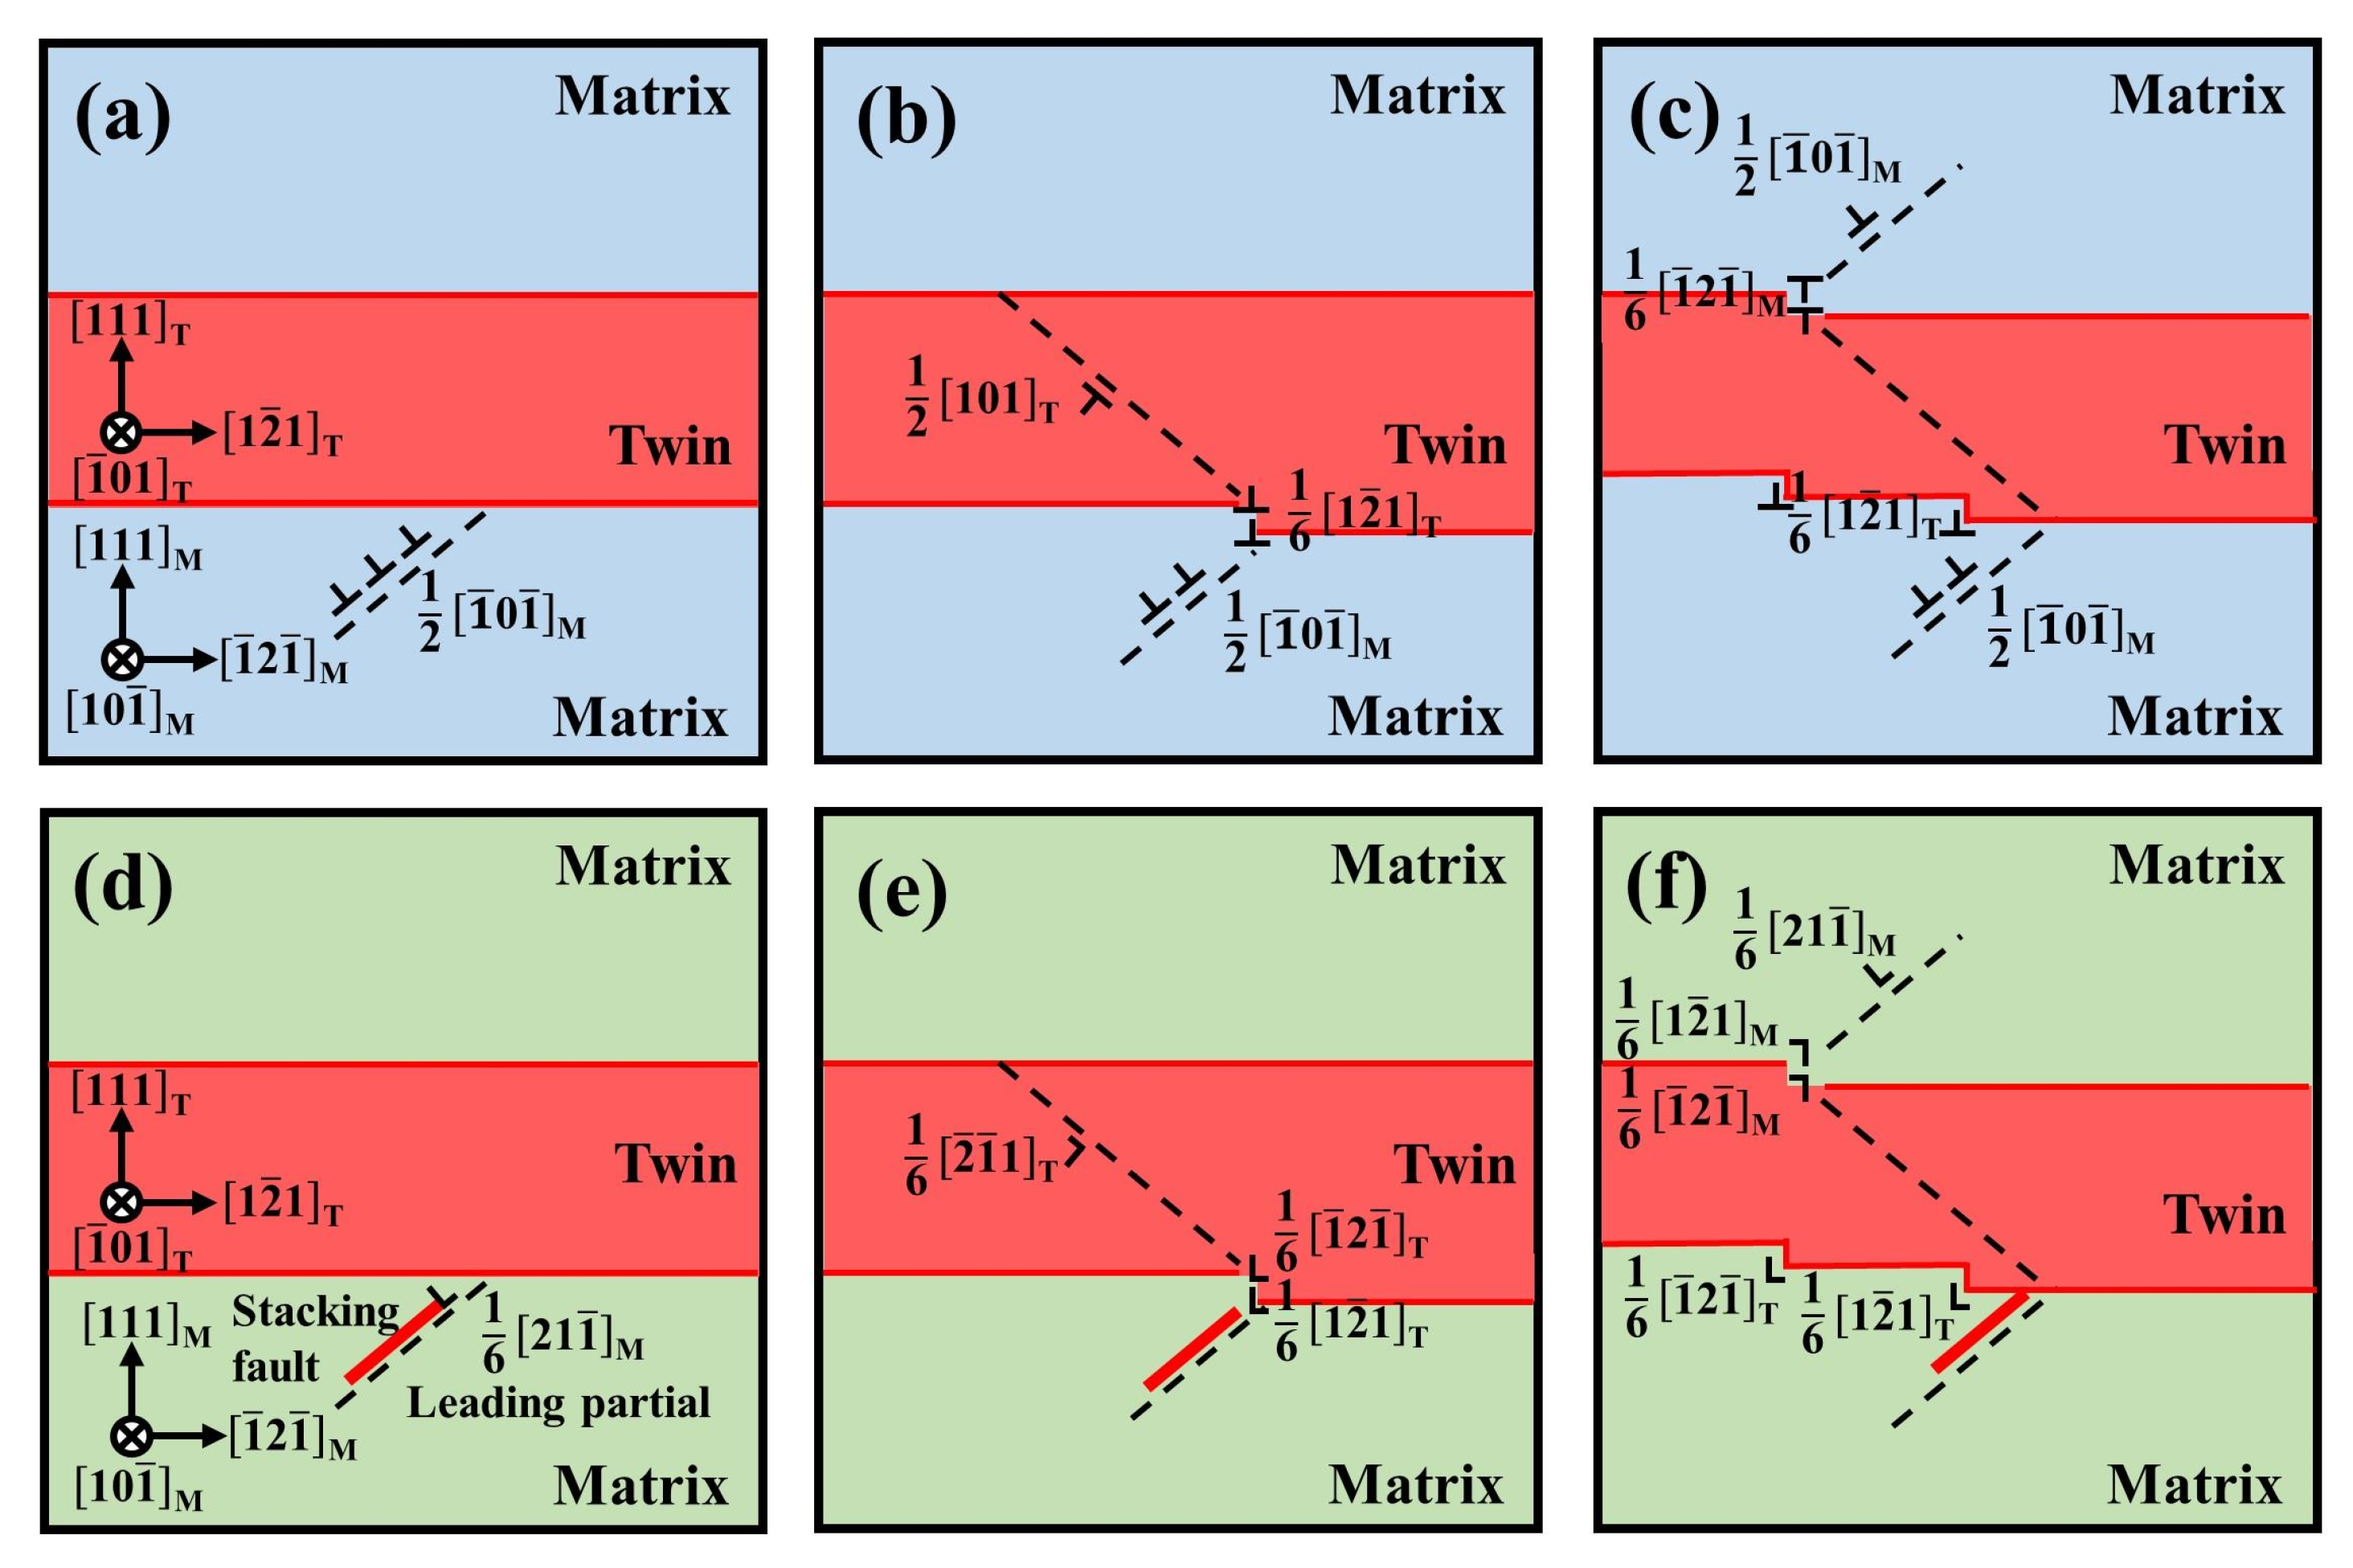
Figure 11 illustrates the possible mechanisms for the interaction of a/2<110> perfect dislocation (where a is the lattice constant) and a/6<112> leading to dislocations in the extended dislocation (in FCC materials, the perfect dislocation dissociates into an extended dislocation consisting of two Shockley partials with Burgers vectors a/6<112> separated by a stacking fault [49]). Without loss of generalization, a pair of {111} planes are chosen, one of them chosen to be the twin boundary and the other the interacting slip system in the FCC crystal structure. The twin boundary is chosen to be on a (111)M plane, and the slip plane is chosen to be a ( 1 1 ¯ 1 )M plane where the subscript M/T indicates that the indices are referenced to the matrix/twin phase. The crystallography is described in Figure 11a and d, where the matrix and twin are aligned in the following crystallographic directions: [111]M // [111]T, [ 1 ¯ 2 1 ¯ ]M // [ 1 2 ¯ 1 ]T, [ 1 ¯ 01 ]M // [ 1 ¯ 01 ]T, and they are converted to each other using Equation (2).
In the current study, we analyzed two distinct incorporation reactions under different slip dislocations, as shown in Figure 11 and summarized in Table 4. For the reaction I #, the candidate a/2[ 1 ¯ 0 1 ¯ ]M perfect dislocation in matrix has a Burgers vector of b MD = a / 2 [ 1 ¯ 0 1 ¯ M ] on its slip plane ( 1 1 ¯ 1 )M, with the matrix-twin crystallography chosen as shown in Figure 11a. When this perfect dislocation intersects with the (111)M twin boundary, the dislocation reaction of type I in Table 4 occurs. From this reaction, a movable a/2[101]T perfect dislocation and two a/6[ 1 2 ¯ 1 ]T twin partial dislocations that remain on the twin boundary are formed within the annealing twin, as shown in Figure 11b. When the perfect dislocation a/2[101]T ships out of the twin, another dislocation reaction similar to I # occurs, and a a/2[ 1 ¯ 0 1 ¯ ]M perfect dislocation slips into the matrix and leaves two a/6[ 1 ¯ 2 1 ¯ ]M twin partial dislocations on the twin boundary. By the aforementioned reaction, the thickness of the twin boundary is increased by two atomic layers, as shown in Figure 11c.
As for the reaction II #, the candidate dislocation, a a/6[ 21 1 ¯ ]M leading partial dislocation ahead of the stacking fault (bold red line in Figure 11d) in extended dislocation, approaches the twin boundary. The dislocation reaction of type II can be is partitioned into two stages (in Table 4):
  • The leading partial dislocation intersects with the (111)M twin boundary and reacts to generate a a/6[ 1 2 ¯ 1 ]T twin partial dislocation and a stair-rod dislocation. The stair-rod dislocation has a non-conventional Burgers vector (of a type a/6[ 3 1 ¯ 0 ]M = a/18[ 5 ¯ 74 ]T) in that it does not correspond to either a slip or twin Burgers vector of the FCC matrix (which include a/2<110> perfect dislocation, a/6<112> Shockley dislocation, and a/3<111> Frank dislocation).
  • The a/18[ 5 ¯ 74 ]T stair-rod dislocation dissociates as it passes through the twin boundary to form a a/6[ 1 ¯ 2 1 ¯ ]T twin partial dislocations and an a/6[ 2 ¯ 1 ¯ 1 ]T Shockley dislocation that slips into the twin [50]. Note that the solution for stair-rod partitioning factors (λ) needs to be introduced in order to ensure the equality of the vectors before and after the reaction, as in Table 4, λ = 2/3.
After the reaction II #, a movable a/6[ 2 ¯ 1 ¯ 1 ]T Shockley partial dislocation slips into the twin, and two twin partial dislocations remain on the twin boundary, as shown in Figure 11e. Figure 11d shows that another dislocation reaction similar to II # occurs when the a/6[ 2 ¯ 1 ¯ 1 ]T Shockley partial dislocation ships out of the twin.
In summary, the thickness of the twin boundary increases because of the interaction between the slip dislocation and the twin boundary, which can explain the phenomenon we observe in Figure 10c. However, these reactions will raise the energy of the system, so they are not automatic and must be subjected to an applied stress to occur. Therefore, it is generally believed that twin boundaries can be obstacles to dislocation slip such that pile-ups are formed at the twin boundaries to improve the strength of the alloy.

4. Conclusions

In conclusion, this study systematically investigated the role of grain boundaries and annealing twin boundaries on the strength of the non-equiatomic Ni2CrFe medium entropy alloy. Six different recrystallized grain sizes alloys were produced, and the effects of texture, grain size and temperature in the range between 293 and 873 K on the mechanical properties were documented. Transmission electron microscopy was used to correlate the interaction between dislocations and twin boundaries. From these investigations, the following conclusions can be drawn:
(1)
The Ni2CrFe MEA was found to be single-phase FCC after annealing at 873–1323 K for 40 min–6 h. The comparison with the CrFeNi alloy, which was reported in the literature to have a BCC + FCC two-phase microstructure after annealing at low temperatures, indicates that increasing the content of Ni improves the VEC value and stabilizes the FCC phase.
(2)
Deformed subgrains and adiabatic shear bands were observed in the cold-rolled Ni2CrFe alloy. The main crystallographic orientation of the cold-rolled alloy was a { 3 ¯ 3 ¯ 4 } <313> texture. Additionally, all recrystallized microstructures are weakly textured, except for the alloy annealing at 1023 K for 6 h.
(3)
Yield stress as a function of grain size (excluding annealing twins) and crystallite size (including both grain and annealing twin boundaries) was investigated at 293 K and found to be consistent with the Hall-Petch relationship. The intrinsic lattice strength of a single-phase FCC Ni2CrFe polycrystal is determined to be σ 0 = 90 MPa at 293 K.
(4)
The evolution of the yield stress of the Ni2CrFe MEA (d = 24 μm, c = 15 μm) with temperature between 293 K and 873 K is found to be in reasonable agreement with other alloys. However, this alloy has a stronger resistance to softening at high temperatures compared with others.
(5)
TEM images show that pile-ups form at twin boundaries in deformation, suggesting that twin boundaries do act as obstacles to dislocation ship and that crystallite size is a more relevant length scale to characterize Hall-Petch strengthening. Additionally, the thickening of the annealing twin boundary after deformation was observed and illustrated by the interaction between different dislocations and twin boundaries in FCC alloys.

Author Contributions

Conceptualization, Z.L. (Zhiwen Li), L.W., C.L., J.Z., L.L., R.C. and Y.S.; data curation, Z.L. (Zhiwen Li); formal analysis, Z.L. (Zhiwen Li), L.W., C.L. and B.W.; funding acquisition, L.W.; investigation, Z.L. (Zhe Li) and L.L.; methodology, Z.L. (Zhiwen Li); project administration, L.W. and Y.S.; software, Z.L. (Zhiwen Li); supervision, J.G.; validation, J.Z. and Z.L. (Zhe Li); writing—original draft, Z.L. (Zhiwen Li); writing—review and editing, B.W. All authors have read and agreed to the published version of the manuscript.

Funding

This work was funded by the National Key Research and Development Program of China (Grant no. 2022YFF0609000), National Natural Science Foundation of China (Grant no. 51871075, 52171034, and 52101037).

Data Availability Statement

The data that support the findings of this study are available from the corresponding author, specifically Professor Liang Wang of the Harbin Institute of Technology (email: [email protected]), upon reasonable request.

Conflicts of Interest

The authors declare no conflict of interest.

References

  1. Yeh, J.W.; Chen, S.K.; Lin, S.J.; Gan, J.Y.; Chin, T.S.; Shun, T.T.; Tsau, C.H.; Chang, S.Y. Nanostructured high-entropy alloys with multiple principal elements: Novel alloy design concepts and outcomes. Adv. Eng. Mater. 2004, 6, 299–303. [Google Scholar] [CrossRef]
  2. Cantor, B.; Chang, I.T.H.; Knight, P.; Vincent, A.J.B. Microstructural development in equiatomic multicomponent alloys. Mater. Sci. Eng. A 2004, 375, 213–218. [Google Scholar] [CrossRef]
  3. Yeh, J.W.; Chen, Y.L.; Chen, S.K. High-entropy alloys—A new era of exploitation. Mater. Sci. Forum 2007, 560, 1–9. [Google Scholar] [CrossRef]
  4. Miracle, D.B.; Senkov, O.N. A critical review of high entropy alloys and related concepts. Acta Mater. 2018, 122, 448–511. [Google Scholar] [CrossRef] [Green Version]
  5. Senkov, O.N.; Wilks, G.B.; Scott, J.M.; Miracle, D.B. Mechanical properties of Nb25Mo25Ta25W25 and V20Nb20Mo20Ta20W20 refractory high entropy alloys. Intermetallics 2011, 19, 698–706. [Google Scholar] [CrossRef]
  6. Couzinié, J.P.; Dirras, G.; Perrière, L.; Chauveau, T.; Leroy, E.; Champion, Y.; Guillot, I. Microstructure of a near-equimolar refractory high-entropy alloy. Mater. Lett. 2014, 126, 285–287. [Google Scholar] [CrossRef]
  7. Guo, N.N.; Wang, L.; Luo, L.S.; Li, X.Z.; Su, Y.Q.; Guo, J.J.; Fu, H.Z. Microstructure and mechanical properties of refractory MoNbHfZrTi high-entropy alloy. Mater. Design 2015, 84, 87–94. [Google Scholar] [CrossRef]
  8. Wu, Z.; Bei, H.; Pharr, G.M.; George, E.P. Temperature dependence of the mechanical properties of equiatomic solid solution alloys with face-centered cubic crystal structures. Acta Mater. 2014, 81, 428–441. [Google Scholar] [CrossRef]
  9. He, J.Y.; Wang, H.; Huang, H.L.; Xu, X.D.; Chen, M.W.; Wu, Y.; Liu, X.J.; Nieh, T.G.; An, K.; Lu, Z.P. A precipitation-hardened high-entropy alloy with outstanding tensile properties. Acta Mater. 2016, 102, 187–196. [Google Scholar] [CrossRef] [Green Version]
  10. Yang, T.; Zhao, Y.L.; Tong, Y.; Jiao, Z.B.; Wei, J.; Cai, J.X.; Han, X.D.; Chen, D.; Hu, A.; Kai, J.J.; et al. Multicomponent intermetallic nanoparticles and superb mechanical behaviors of complex alloys. Science 2018, 362, 933. [Google Scholar] [CrossRef]
  11. Otto, F.; Dlouhy, A.; Somsen, C.; Bei, H.; Eggeler, G.; George, E.P. The influences of temperature and microstructure on the tensile properties of a CoCrFeMnNi high-entropy alloy. Acta Mater. 2013, 61, 5743–5755. [Google Scholar] [CrossRef] [Green Version]
  12. Roy, U.; Roy, H.; Daoud, H.; Glatzel, U.; Ray, K.K. Fracture toughness and fracture micromechanism in a cast AlCoCrCuFeNi high entropy alloy system. Mater. Lett. 2014, 132, 186–189. [Google Scholar] [CrossRef]
  13. Gludovatz, B.; Hohenwarter, A.; Catoor, D.; Chang, E.H.; George, E.P.; Ritchie, R.O. A fracture-resistant high-entropy alloy for cryogenic applications. Science 2014, 345, 1153–1158. [Google Scholar] [CrossRef] [PubMed] [Green Version]
  14. Zhang, Z.J.; Sheng, H.W.; Wang, Z.J.; Gludovatz, B.; Zhang, Z.; George, E.P.; Yu, Q.; Mao, S.X.; Ritchie, R.O. Dislocation mechanisms and 3D twin architectures generate exceptional strength-ductility-toughness combination in CrCoNi medium-entropy alloy. Nat. Commun. 2017, 8, 14390. [Google Scholar] [CrossRef] [PubMed] [Green Version]
  15. Tong, Y.; Chen, D.; Han, B.; Wang, J.; Feng, R.; Yang, T.; Zhao, C.; Guo, W.; Shimizu, Y.; Liu, Y.T.; et al. Outstanding tensile properties of a precipitation-strengthened FeCoNiCrTi0.2 high-entropy alloy at room and cryogenic temperatures. Acta Mater. 2019, 165, 228–240. [Google Scholar] [CrossRef]
  16. Pradeep, K.G.; Tasan, C.C.; Yao, M.J.; Deng, Y.; Springer, H.; Raabe, D. Non-equiatomic high entropy alloys: Approach towards rapid alloy screening and property-oriented design. Mater. Sci. Eng. A 2015, 648, 183–192. [Google Scholar] [CrossRef]
  17. Ma, D.C.; Yao, M.J.; Pradeep, K.G.; Tasan, C.C.; Springer, H.; Raabe, D. Phase stability of non-equiatomic CoCrFeMnNi high entropy alloys. Acta Mater. 2015, 98, 288–296. [Google Scholar] [CrossRef]
  18. Cho, K.; Fujioka, Y.; Nagase, T.; Yasuda, H.Y. Grain refinement of non-equiatomic Cr-rich CoCrFeMnNi high-entropy alloys through combination of cold rolling and precipitation of sigma phase. Mater. Sci. Eng. A 2018, 735, 191–200. [Google Scholar] [CrossRef]
  19. Zhou, Y.; Zhou, D.; Jin, X.; Zhang, L.; Du, X.Y.; Li, B.S. Design of non-equiatomic medium-entropy alloys. Sci. Rep. 2018, 8, 1236. [Google Scholar] [CrossRef] [Green Version]
  20. Deng, H.W.; Wang, M.M.; Xie, Z.M.; Wang, X.P.; Xiong, Y. Enhancement of strength and ductility in non-equiatomic CoCrNi medium-entropy alloy at room temperature via transformation-induced plasticity. Mater. Sci. Eng. A 2021, 804, 140516. [Google Scholar] [CrossRef]
  21. Li, J.; Xie, B.B.; Fang, Q.H.; Liu, B.; Liu, Y.; Liaw, P.K. High-throughput simulation combined machine learning search for optimum elemental composition in medium entropy alloy. J. Mater. Sci. Technol. 2021, 68, 70–75. [Google Scholar] [CrossRef]
  22. Wu, Z.; Bei, H.; Otto, F.; Pharr, G.M.; George, E.P. Recovery, recrystallization, grain growth and phase stability of a family of FCC-structured multi-component equiatomic solid solution alloys. Intermetallics 2014, 46, 131–140. [Google Scholar] [CrossRef]
  23. Schneider, M.; Laplanche, G. Effects of temperature on mechanical properties and deformation mechanisms of the equiatomic CrFeNi medium-entropy alloy. Acta Mater. 2021, 204, 116470. [Google Scholar] [CrossRef]
  24. Sun, S.J.; Tian, Y.Z.; Lin, H.R.; Dong, X.G.; Wang, Y.H.; Zhang, Z.J.; Zhang, Z.F. Enhanced strength and ductility of bulk CoCrFeMnNi high entropy alloy having fully recrystallized ultrafine-grained structure. Mater. Design 2017, 133, 122–127. [Google Scholar] [CrossRef]
  25. Lu, W.J.; Luo, X.; Yang, Y.Q.; Huang, B. Hall-petch relationship and heterogeneous strength of CrCoNi medium-entropy alloy. Mater. Chem. Phys. 2020, 251, 123073. [Google Scholar] [CrossRef]
  26. Nakanishi, K.; Suzuki, H. Analysis of the grain size dependence of the yield stress in copper-aluminum and copper-nickel alloys. J. Jpn. I. Met. 1974, 15, 435–440. [Google Scholar] [CrossRef] [Green Version]
  27. Schneider, M.; George, E.P.; Manescau, T.J.; Zalezak, T.; Hunfeld, J.; Dlouhy, A.; Eggeler, G.; Laplanche, G. Analysis of strengthening due to grain boundaries and annealing twin boundaries in the CrCoNi medium-entropy alloy. Int. J. Plasticity 2019, 124, 155–169. [Google Scholar] [CrossRef]
  28. Schneider, M.; Werner, F.; Langenkämper, D.; Reinhart, C.; Laplanche, G. Effect of temperature and texture on Hall–Petch strengthening by grain and annealing twin boundaries in the MnFeNi medium-entropy alloy. Metals 2019, 9, 84. [Google Scholar] [CrossRef] [Green Version]
  29. Kumar, N.; Komarasamy, M.; Nelaturu, P.; Tang, Z.; Liaw, P.K.; Mishra, R.S. Friction stir processing of a high entropy alloy Al0.1CoCrFeNi. J. Occup. Med. 2015, 67, 1007–1013. [Google Scholar] [CrossRef]
  30. Sangid, M.D.; Ezaz, T.; Sehitoglu, H.; Robertson, I.M. Energy of slip transmission and nucleation at grain boundaries. Acta Mater. 2011, 59, 283–296. [Google Scholar] [CrossRef]
  31. Samaee, V.; Dupraz, M.; Pardoen, T.; Van Swygenhoven, H.; Schryvers, D.; Idrissi, H. Deciphering the interactions between single arm dislocation sources and coherent twin boundary in nickel bi-crystal. Nat. Commun. 2021, 12, 962. [Google Scholar] [CrossRef] [PubMed]
  32. Shin, H.J.; Jeong, H.T.; Lee, D.N. Deformation and annealing textures of silver wire. Mater. Sci. Eng. A 2000, 279, 244–253. [Google Scholar] [CrossRef]
  33. Priester, L. “Dislocation-interface” interaction-stress accommodation processes at interfaces. Mater. Sci. Eng. A 2001, 309, 430–439. [Google Scholar] [CrossRef]
  34. Kacher, J.; Eftink, B.P.; Cui, B.; Robertson, I.M. Dislocation interactions with grain boundaries. Curr. Opin. Solid St. M. 2014, 18, 227–243. [Google Scholar] [CrossRef]
  35. Laplanche, G.; Kostka, A.; Reinhart, C.; Hunfeld, J.; Eggeler, G.; George, E.P. Reasons for the superior mechanical properties of medium-entropy CrCoNi compared to high-entropy CrMnFeCoNi. Acta Mater. 2017, 128, 292–303. [Google Scholar] [CrossRef]
  36. Laplanche, G.; Gadaud, P.; Barsch, C.; Demtroder, K.; Reinhart, C.; Schreuer, J.; George, E.P. Elastic moduli and thermal expansion coefficients of medium-entropy subsystems of the CrMnFeCoNi high-entropy alloy. J. Alloys Compd. 2018, 746, 244–255. [Google Scholar] [CrossRef]
  37. Guo, S.; Ng, C.; Lu, J.; Liu, C.T. Effect of valence electron concentration on stability of fcc or bcc phase in high entropy alloys. J. Appl. Phys. 2011, 109, 103505. [Google Scholar] [CrossRef] [Green Version]
  38. Fullman, R.L.; Fisher, J.C. Formation of annealing twins during grain growth. J. Appl. Phys. 1951, 22, 1350–1355. [Google Scholar] [CrossRef]
  39. Baik, S.I.; Gupta, R.K.; Kumar, K.S.; Seidman, D.N. Temperature increases and thermoplastic microstructural evolution in adiabatic shear bands in a high-strength and high-toughness 10 wt.% Ni steel. Acta Mater. 2021, 205, 116568. [Google Scholar] [CrossRef]
  40. English, A.T.; Chin, G.Y. On the variation of wire texture with stacking fault energy in fcc metals and alloys. Acta Metall. 1965, 13, 1013–1016. [Google Scholar] [CrossRef]
  41. Lee, D.N.; Chung, Y.H.; Shin, M.C. Preferred orientation in extruded aluminum alloy rod. Scripta Metall. Mater. 1983, 17, 339–342. [Google Scholar] [CrossRef]
  42. Laplanche, G.; Horst, O.; Otto, F.; Eggeler, G.; George, E.P. Microstructural evolution of a CoCrFeMnNi high-entropy alloy after swaging and annealing. J. Alloys Compd. 2015, 647, 548–557. [Google Scholar] [CrossRef]
  43. Gopinath, K.; Gogia, A.K.; Kamat, S.; Ramamurty, U. Dynamic strain ageing in Ni-base superalloy 720Li. Acta Mater. 2009, 57, 1243–1253. [Google Scholar] [CrossRef]
  44. Suzuki, H. Chemical Interaction of Solute Atoms with Dislocations. Sci. Rep. Res. Inst. Tohoku Univ. 1952, 4, 455–463. [Google Scholar]
  45. Cottrell, A.H.; Bilby, B.A. Dislocation theory of yielding and strain ageing of iron. Proc. Phys. Soc. Lond. Sect. A 1949, 62, 49–62. [Google Scholar] [CrossRef]
  46. Hall, E.O. The Deformation and Ageing of Mild Steel: III Discussion of Results. Proc. Phys. Soc. Sect. B 1951, 21, 2891–2896. [Google Scholar] [CrossRef]
  47. Petch, N.J. The cleavage strength of polycrystals. J. Iron Steel Inst. 1953, 174, 25–28. [Google Scholar]
  48. Varvenne, C.; Luque, A.; Curtin, W.A. Theory of strengthening in fcc high entropy alloys. Acta Mater. 2016, 118, 164–176. [Google Scholar] [CrossRef] [Green Version]
  49. Hirth, J.P.; Lothe, J. Theory of Dislocations (2nd ed.). J. Appl. Mech. 1983, 50, 476–477. [Google Scholar] [CrossRef] [Green Version]
  50. Krogstad, J.A.; Sehitoglu, H.; Celebi, O.K.; Mohammed, A.S.K. Evolving dislocation cores at Twin Boundaries: Theory of CRSS Elevation. Int. J. Plasticity 2022, 148, 103141. [Google Scholar] [CrossRef]
Figure 1. Details of fabrication process: (a) the schematic illustration of ingots; (b) the visualization of specimen extraction position. XRD = X-ray diffraction, SEM = scanning electron microscopy, EBSD = electron backscattered diffraction, TEM = transmission electron microscopy, RD = rolling direction, TD = transverse direction, and ND = normal direction.
Metals 13 00134 g001
Figure 2. (a) XRD patterns of CR, CR-873/1, CR-1023/1, CR-1173/1, and CR-1323/1 Ni2FeCr samples; (b) Zoom-in (111)FCC diffraction peaks.
Metals 13 00134 g002
Figure 3. Comparison of the mean grain sizes (excluding twin boundaries) obtained by the linear intercept method (dLIM) with those determined by EBSD (dEBSD). The EBSD image in the upper left corner and image at the bottom right were taken at the same location and illustrate how grain sizes were determined using the line intercept method and EBSD, respectively.
Metals 13 00134 g003
Figure 4. EBSD diagram of cold-rolled Ni2CrFe MEA: (a) color-coded crystallite orientation + grain boundary maps; (b) band contrast map; (c) polar map of (100), (110) and (111); (d) { 3 ¯ 3 ¯ 4 } <313> standard pole figure.
Metals 13 00134 g004
Figure 5. Representative microstructures and corresponding inverse pole figures showing the texture parallel to the rod axis of recrystallized Ni2CrFe alloys with different grain and crystallite sizes: (a) d = 12 μm, c = 8 μm, (b) d = 18 μm, c = 13 μm, (c) d = 24 μm, c = 15 μm, (d) d = 24 μm, c = 17 μm, (e) d = 26 μm, c = 17 μm and (f) d = 34 μm, c = 24 μm.
Metals 13 00134 g005
Figure 6. Representative tensile engineering stress–strain curves of Ni2CrFe alloys at (a) room temperature with different states and (b) for a grain and crystallite size of 24 µm and 15 µm, respectively, at different temperatures. The inset in (b) shows a serrated flow after yielding for the curve obtained at 673 K and 873 K.
Metals 13 00134 g006
Figure 7. Yield stress (σ0.2%) at 293 K versus the reciprocal of the square root of the grain size (d) and crystallite size (c). The obtained Hall-Petch relationship is indicated within the plot.
Metals 13 00134 g007
Figure 8. Temperature dependence of the yield stress of Ni2CrFe alloys and compared with other HEAs/MEAs.
Metals 13 00134 g008
Figure 9. Twin boundaries’ characteristics analyzed by EBSD. The color-coded grain orientation maps and {111} plane polar diagram of the twins and the corresponding grains in Ni2CrFe alloys after annealing at different temperatures for 1 h. (a) CR-873/1; (b) CR-1023/1; (c) CR-1173/1; (d) CR-1323/1.
Metals 13 00134 g009
Figure 10. TEM micrographs of the CR-1023/4 Ni2CrFe alloys after tensile fracture at 293 K. (a) Bright-field (BF) image; (b) twin boundary and corresponding selected-area electron diffraction (SAED); (c) high-resolution TEM image of twin boundary; fast-Fourier-transformed images of matrix (d), twin (e), and twin boundary (f).
Metals 13 00134 g010
Figure 11. Possible mechanisms of interaction between different dislocations and twin boundaries in FCC alloys. (ac) perfect dislocation; (df) leading partial dislocation ahead of the stacking fault in extended dislocation.
Metals 13 00134 g011
Table 1. Heat treatment conditions and sample designations.
SpecimensAnnealing Temperature (K)Annealing Time
CR-873/18731 h
CR-1023/0102340 min
CR-1023/110231 h
CR-1023/210232 h
CR-1023/410234 h
CR-1023/610236 h
CR-1173/111731 h
CR-1323/113231 h
Table 2. Mean grain sizes (d), crystallite sizes (c), and number of annealing twin boundaries per grain (n) of the alloys after heat treatment at different temperatures and times.
Specimensd (μm)c (μm)n
CR-1023/111.99 ± 1.027.99 ± 0.950.50 ± 0.12
CR-1023/217.89 ± 0.9212.84 ± 0.800.39 ± 0.06
CR-1023/423.58 ± 1.9115.02 ± 0.950.56 ± 0.08
CR-1023/623.63 ± 1.4516.70 ± 1.520.42 ± 0.09
CR-1173/125.56 ± 2.2317.37 ± 2.420.47 ± 0.14
CR-1323/134.11 ± 2.2623.88 ± 1.770.42 ± 0.05
Table 3. Hall-Petch parameters of Ni2CrFe MEA and comparison with FCC type alloys from the literature [23,24,25,26,27,28,29,48].
Alloysσ0
(MPa)
ky
(Grain Size, MPa μm1/2)
ky
(Crystallite Size, MPa μm1/2)
Ni2CrFe90673544
Ni14180-
CrCoNi150815600
CrCoNi143653-
CrFeNi80966-
FeMnNi97660590
CoCrFeNi90866-
CoCrFeMnNi194490-
Table 4. Possible reactions between dislocation and twin boundary in this study; the unconventional stair-rod Burgers vector ( b S R ) and solution for stair-rod partitioning factors (λ) of the FCC system is given.
Type
(#)
Candidate
Dislocation
ReactionSolution for
Stair-Rod
Partitioning Factors (λ)
I a 2 [ 1 ¯ 0 1 ¯ ] M a 2 [ 1 ¯ 0 1 ¯ ] M T ( 111 ) a 6 [ 1 ¯ 4 ¯ 1 ¯ ] T Matrix   perfect   dislocation b M D a 2 [ 101 ] T + Twin   perfect   dislocation b T D a 6 [ 1 2 ¯ 1 ] T + a 6 [ 1 2 ¯ 1 ] T Twinning   partial b T P
II a 6 [ 21 1 ¯ ] M a 6 [ 21 1 ¯ ] M T ( 111 )   a 18 [ 2 ¯ 17 ] T Shockley   partial b M S a 6 [ 1 2 ¯ 1 ] T Twinning   partial b T P + a 18 [ 5 ¯ 74 ] T Stair - rod b S R
a 18 [ 5 ¯ 74 ] T Stair - rod b S R λ a 6 [ 1 ¯ 2 1 ¯ ] T Twinning   partial   b S R T P + a 6 [ 2 ¯ 1 ¯ 1 ] T Shockley   partial b S R T S
λ = 2/3
Disclaimer/Publisher’s Note: The statements, opinions and data contained in all publications are solely those of the individual author(s) and contributor(s) and not of MDPI and/or the editor(s). MDPI and/or the editor(s) disclaim responsibility for any injury to people or property resulting from any ideas, methods, instructions or products referred to in the content.