Article

Finite Element Analysis of Restraint Intensities and Welding Residual Stresses in the Ti80 T-Joints

School of Energy Engineering, Huanghuai University, Zhumadian 463000, China
*
Author to whom correspondence should be addressed.
Metals 2023, 13(1), 125; https://doi.org/10.3390/met13010125
Submission received: 4 December 2022 / Revised: 1 January 2023 / Accepted: 5 January 2023 / Published: 8 January 2023

Abstract

:
The restraint intensity of Ti80 T-joints was investigated using finite element analyses. The influence of slit height, vertical plate thickness and base plate thickness was studied, respectively. Results show that the slit height and vertical plate thickness have a significant impact, while the effect of base plate thickness is negligible. A prediction model of restraint intensity was constructed through binary linear regression; the error was estimated at about 10%. Then, finite element simulations were carried out to study the welding residual stresses of specimens with different restraint intensities. The results show that residual stresses on the backing weld surface are higher in the middle and lower at both ends, while the weld root shows opposite results. In general, stresses at the weld root are greater than those on the weld surface. The mean value of the residual stress at the weld root increases with the increase in restraint intensity but not uniformly, i.e., it is slow at first and then it increases rapidly. A prediction model of the residual stress was produced through cubic fitting, and the errors between the finite element simulations and predictions were about 8%. Using the prediction model, the residual stress of actual Ti80 alloy workpieces can be estimated before welding, and a corresponding strategy for avoiding cracks can be generated.

1. Introduction

The Ti80 alloy is one of the most commonly used marine titanium alloys and was developed in the 1980s by the Shanghai Iron and Steel Research Institute. It is an α-like titanium alloy with the following composition: Ti-6.0Al-2.5Nb- 2.2Zr-1.2Mo. It has a yield strength in excess of 785 MPa and exhibits excellent toughness, weldability and corrosion resistance. It is mainly applied as large diameter pressure pipes and force support components in ships [1,2,3]. In welding applications of thick plates, cold cracks appear in the T-joints. Residual stress has been considered an important factor that induces cold cracks [4]. Furthermore, the concept of restraint intensity has been proposed and developed [5,6,7]. It is defined as the force required to induce a unit of elastic deformation along the unit length of a groove. The unit is N·(mm·mm)−1. The positive correlation between the residual stress and the restraint intensity has been verified under certain restraint conditions [8,9,10]. Thus, it is of great practical significance to analyze and test the joint restraint intensity.
Numerous investigations have been conducted on joint restraint intensity, among which many self-constrained specimens have been designed for cold crack sensitivity tests, such as the famous Tekken specimen, Lehigh specimen, rigid butt-jointed specimen and so on [11]. Through welding experiments on specimens with equivalent restraint intensities on workpieces, the cold crack sensitivities could be evaluated. However, the restraint intensity tests have certain limitations; hence, special equipment should be used to provide loading and measure small displacements in the groove roots. Thus, numerical analyses are widely applied. Since 1980, restraint intensity has been determined through mathematical analyses. Chen et al. derived the restraint intensity formulas for VRC and ARC specimens based on the mechanics of the materials [12]. Another study by Liu et al. created a formula for a VRC specimen with some corrections and described the factors affecting the precision of the calculation [13]. Tao et al. calculated the welding restraint intensity of a fillet weld and a ring-stiffened cylinder, and the theory of cylindrical shells was used to develop an analytical solution of the welding restraint intensity of a fillet by determining the radial displacement function of an even circumferentially distributed force [14]. The mathematical analyses showed good application values for specimens with simple shapes. Meanwhile, some geometric simplifications are often required. This decreases the accuracy and applicability of the tool.
Moreover, the finite element (FE) method has been adopted due to its wide applicability and good accuracy [15,16,17]. Jing et al. studied the influence of specimen sizes on the restraint intensity of rigid butt-jointed specimens and VRC specimens, and the quantitative relationship between the specimen sizes (e.g., thickness, width, etc.) and the restraint intensity was obtained [18]. Elsewhere, Alipooramirabad et al. used restraint specimens from the Welding Institute of Canada (WIC) to simulate the restraint conditions of full-scale girth welds on energy pipelines. They calculated the restraint intensity of the specimens and workpieces using FE models. In addition, they explored the effects of heat input, wall thickness and variable restraint lengths on the WIC samples [19]. Zhang et al. studied the impact of specimen types and sizes on the restraint intensity of a Ti80 alloy Tekken specimen and a rigid butt-jointed specimen. The accuracy of the FE simulation was verified through actual measurements, and the predictor formula of the rigid butt-jointed specimen restraint intensity was also determined [20,21]. Watanabe et al. estimated the restraint intensity of an H-shaped restraint test specimen and the relationship between the restraint intensity and the transverse shrinkage; the research findings were used for actual steel ship structures [22,23]. Park et al. derived a quantitative relation between welding deformation and restraint intensity through FE analyses, after which the welding deformation of a large ship structure was successfully predicted [24,25]. Satoh et al. proposed an FE method for predicting the restraint intensity and cracking tendency in slit-type welding joints; the relationship between residual stress and crack sensitivity was also discussed [26,27]. Shin et al. designed two H-type test specimens with restraint coefficients of 100 and 200 MPa/mm, respectively. The corresponding welding heat process and residual stress were studied via FE analyses, and the effect of the restraint intensity on the residual stresses was also analyzed [28]. However, the current studies have almost entirely focused on butt joints, with very few focusing on T-joints. Meanwhile, little research has been conducted on titanium specimens. In this paper, based on the engineering application background of a Ti80 alloy T-joint, a variable constraint T-joint specimen was selected as the research object. The accuracy of the FE method was verified, and the influence of slit height, vertical plate thickness and base plate thickness on the restraint intensity was investigated. The quantitative relationship between these parameters and the restraint intensities was established. Moreover, the quantitative relationship between the restraint intensity and the residual stress was also explored. Based on these relationships, the residual stress of actual Ti80 alloy workpieces can be estimated before welding, and a corresponding strategy for avoiding cracks can be generated. Our study provides ideas that will guide the application of Ti80 T-joints in welding fields.

2. FE Simulation and Verification

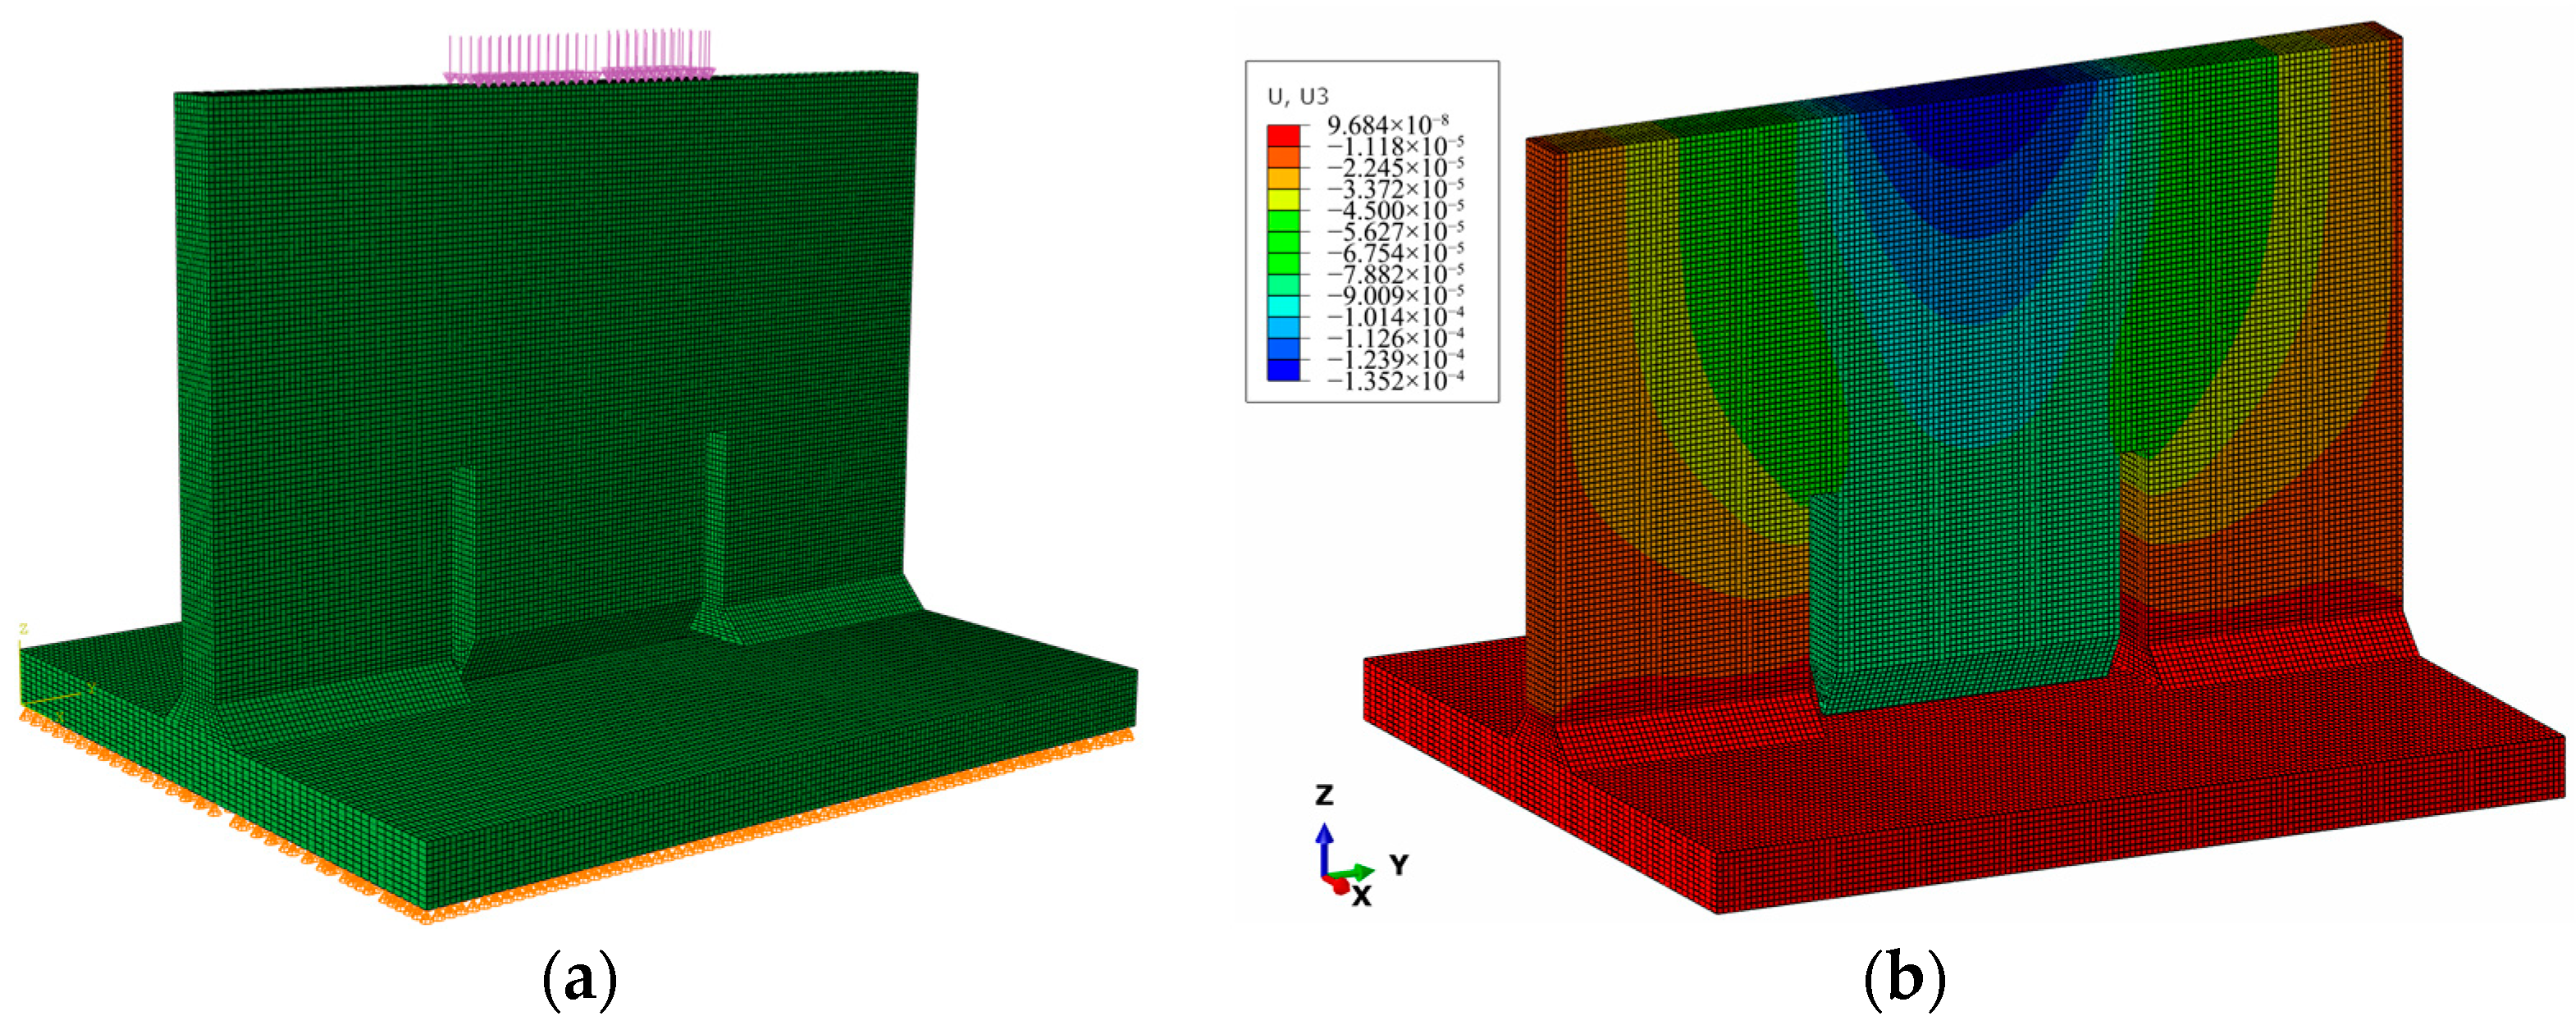
2.1. Fundamental Principles
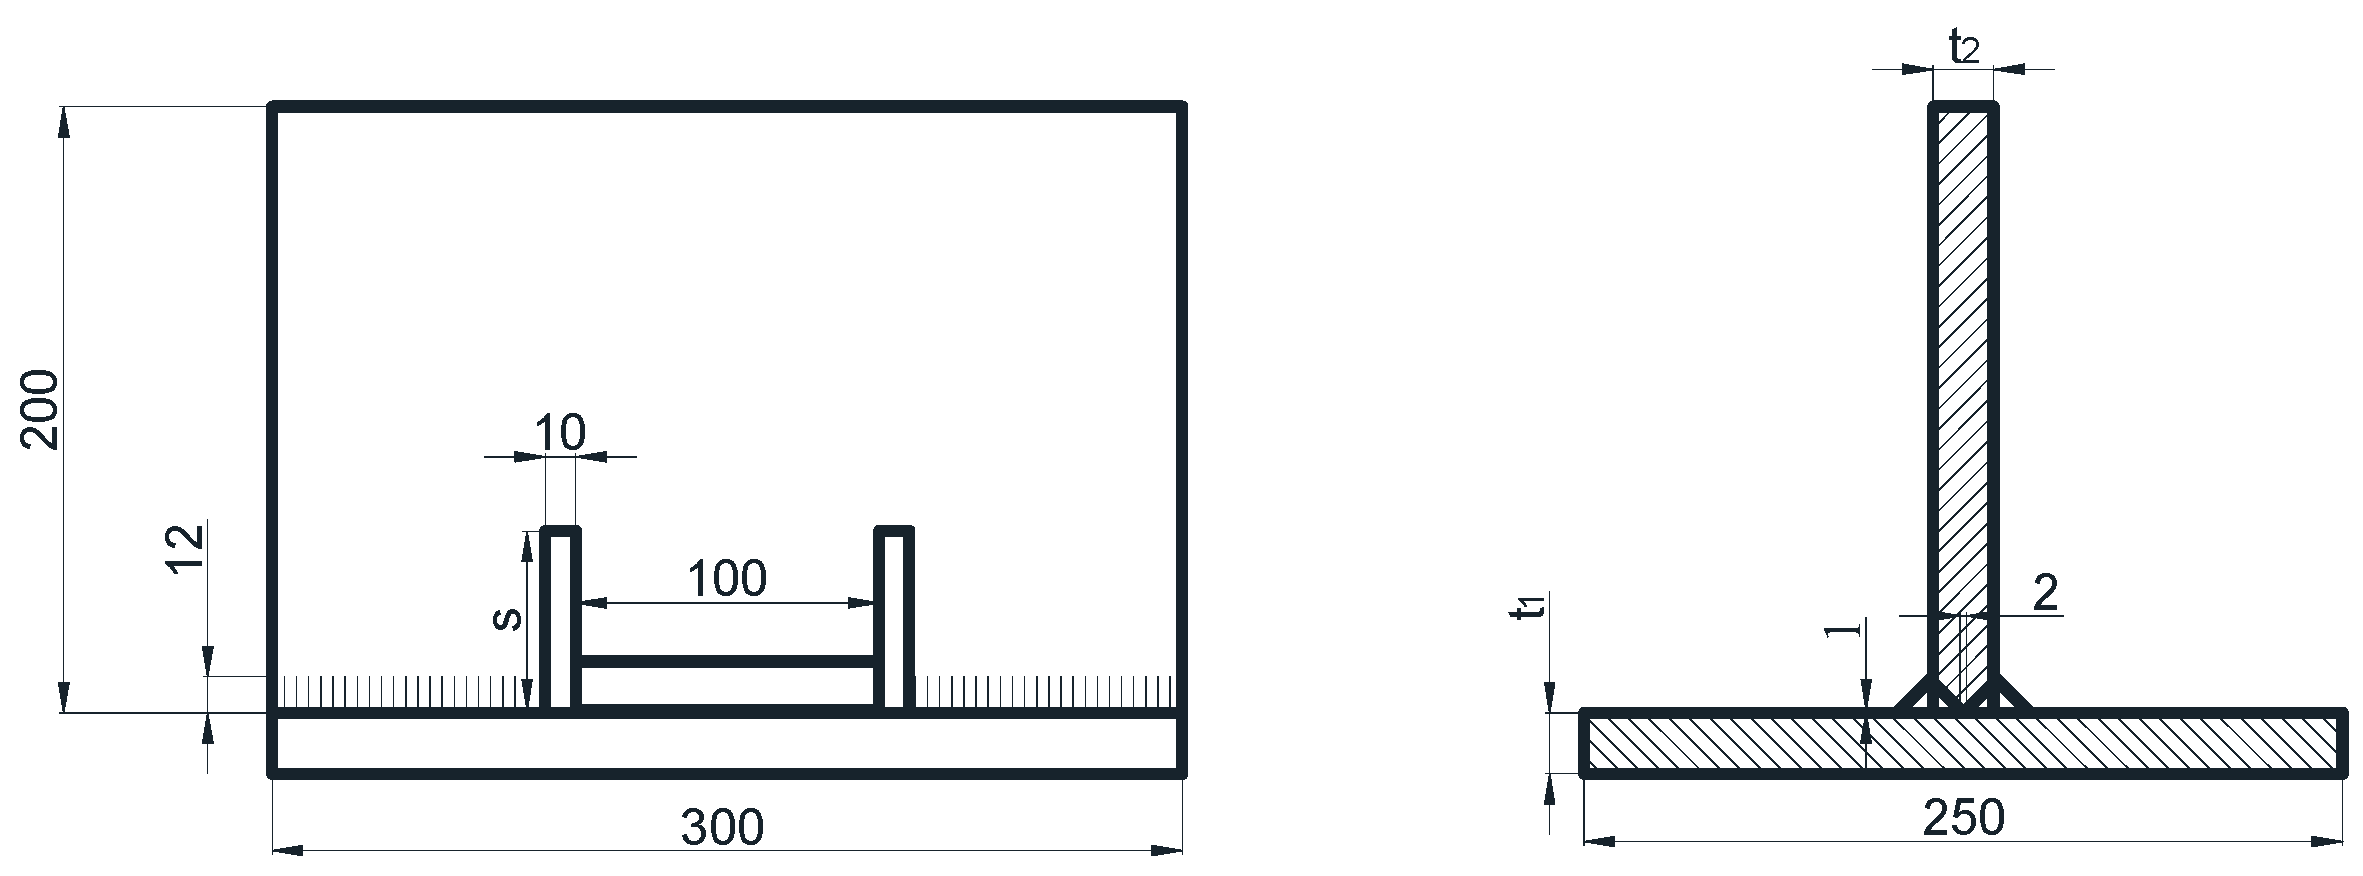
The theoretical basis of the FE simulations adopted in this study is the basic elastic–plastic criterion of metal materials. It includes the Von Mises yield criterion, which is used to explore the plastic deformation of a material under a given stress state. The flow criterion represents the relationship between the increment of a plastic strain tensor and the current stress state. The isotropic hardening criterion states that the material shows the same yield response in all directions.
The ABAQUS software was used for the restraint intensity simulations. To perform the welding simulation, the Visual Weld software was utilized. This software adopted a direct calculation method and divided the analysis process into a series of load incremental steps. In each step, the stiffness matrix was inverted and several iterations were performed to obtain an acceptable solution, after which the next incremental step was solved. The sum of all incremental responses was the approximate solution of the elastic–plastic analysis [29,30,31].

2.2. Dimensions

The specimen dimensions are illustrated in Figure 1. The base plate size was 300 × 250 × t1 (mm3), and the vertical plate size was 300 × 200 × t2 (mm3), with t1 and t2 being the thicknesses. Anchor welds were produced at both ends with a height of 12 mm and a length of 90 mm, respectively. The slit width was 10 mm, and the height was variable and marked as s. The test welds were prepared in the middle, and the blunt edge width of the groove was 2 mm. The height of the base plate was 1 mm.

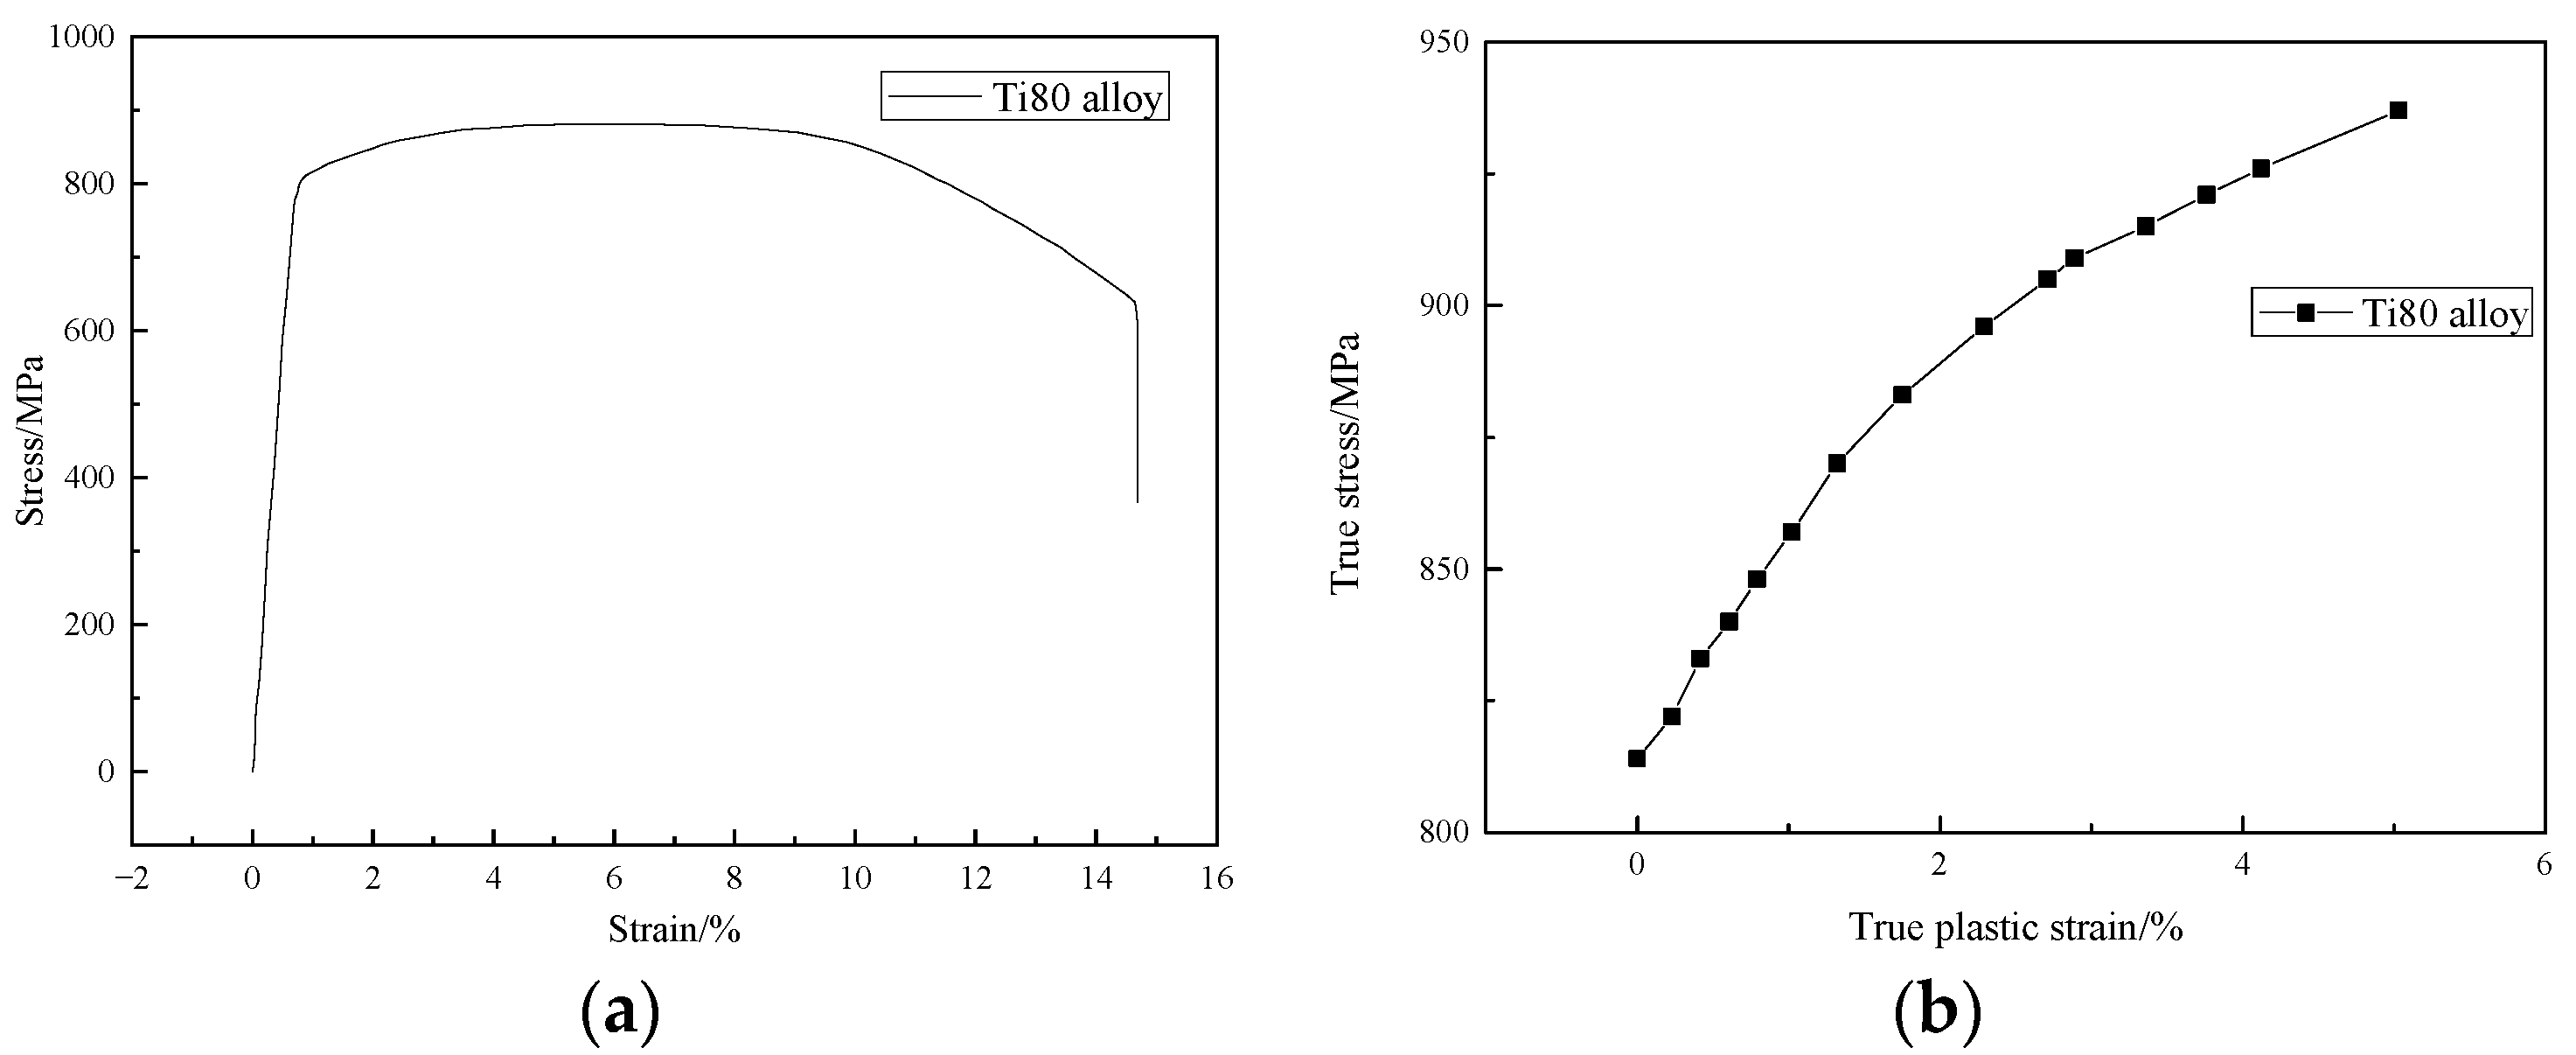
2.3. Mechanical Parameters

For the FE simulations in the study, some basic parameters acquired from experimental measurements were set. The density was 4.51 g/cm3; the yield strength was 814 MPa; the Young’s modulus was 114 GPa; the Poisson’s ratio was 0.33. The true stress and plastic strain data were obtained from the Ti80 tensile curve at room temperature, as shown in Figure 2.

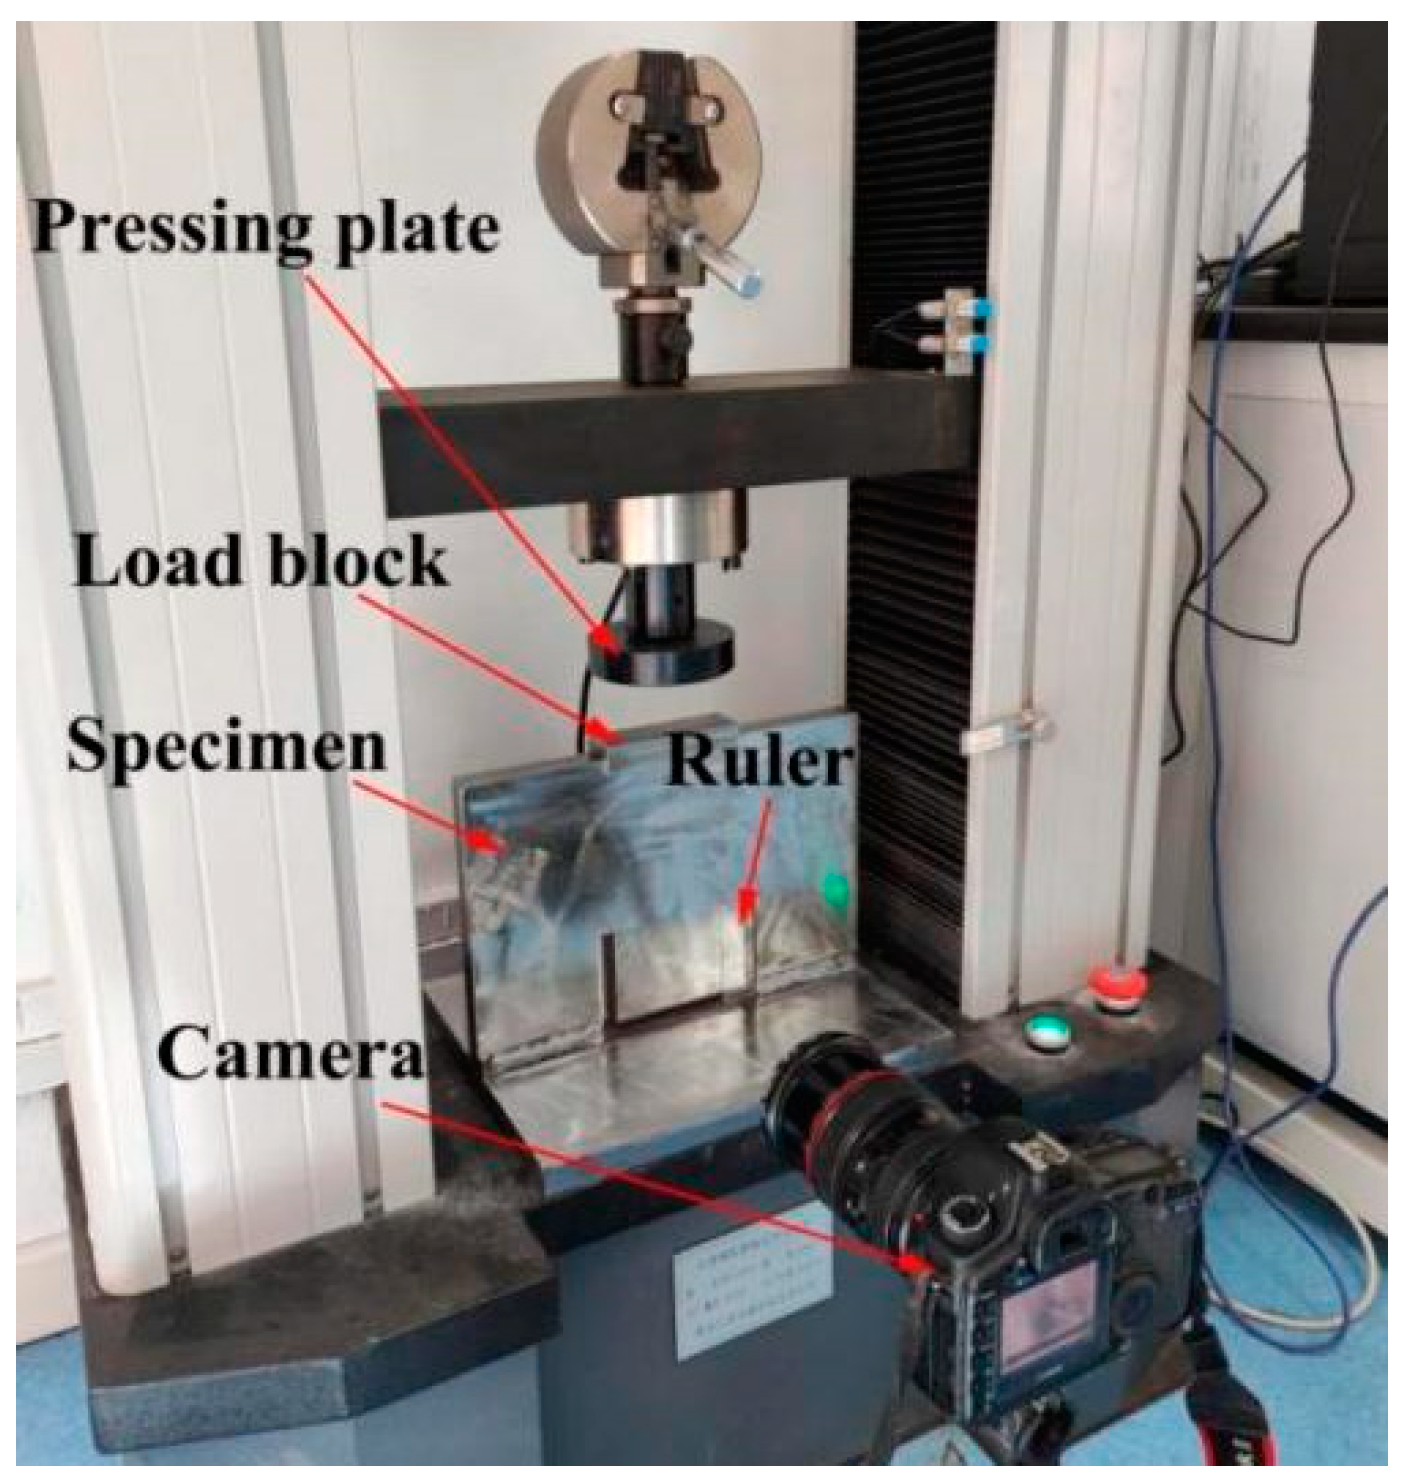
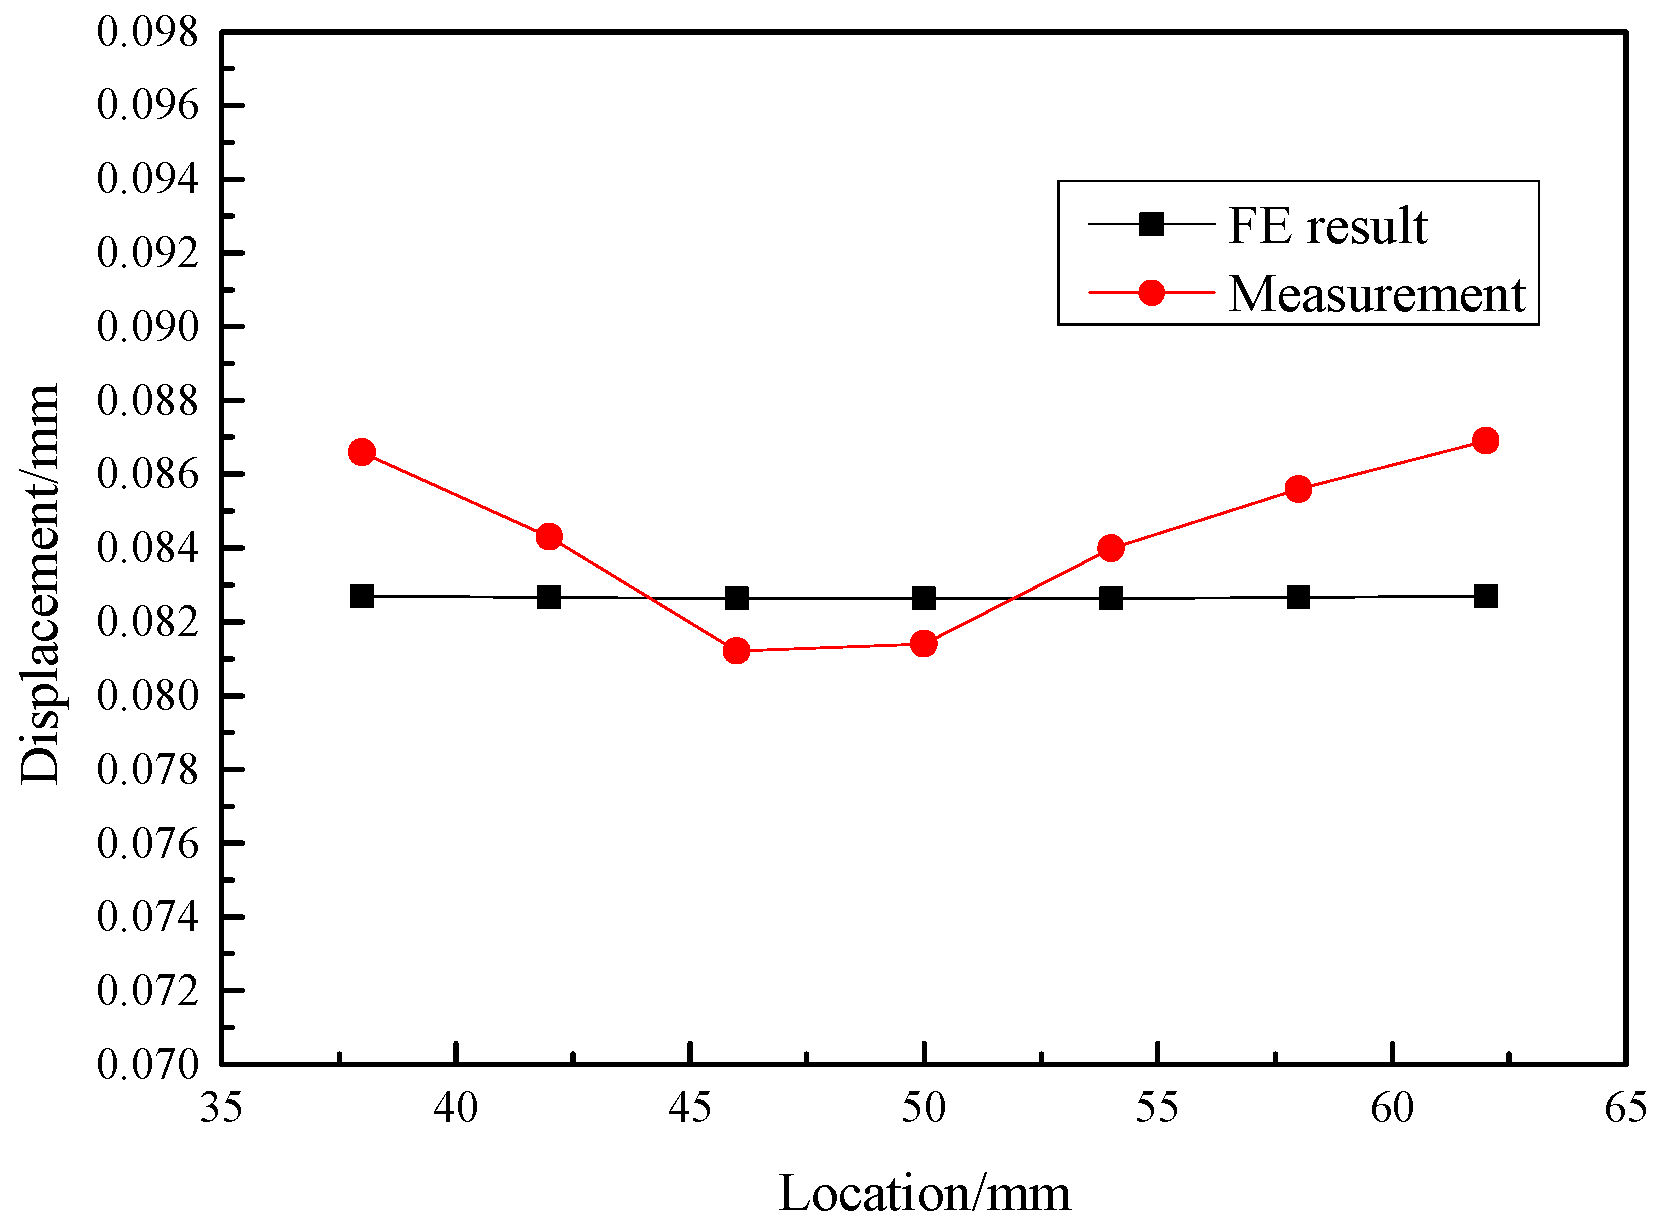
2.4. Experimental Validation

Next, actual measurements and FE simulations were performed to verify the accuracy of the FE method. The thickness of the base and vertical plate was 20 mm, and the slit height was 60 mm. The measurement method is illustrated in Figure 3. An electronic universal testing machine was used to generate a 150-KN force; the pressing plate exerted pressure on top of the specimen through a load block to ensure loading uniformity. An HD digital camera in fixed-focus mode was used to take photos of the groove root before and after loading. Seven-point intervals of 5 mm were marked at the groove root, and a glass ruler with an exact scale was also placed to calibrate the distance. The displacement of the marked points was acquired by comparing the photos.
As a contrast, an FE model with the same specimen and loading was built. First, a three-dimensional geometrical model of the same size as the experimental specimen was built using the SolidWorks software. Then, the HyperMesh software was used for FE mesh generation. A hexahedral element was selected due to its higher accuracy compared with tetrahedron elements. For the mesh-independent verification, samples with different element sizes and the same boundary conditions were simulated. The displacement at the groove root is shown in Figure 4. The results fluctuate greatly when the element size exceeds 10 mm. However, they tend to be stable when the element size is reduced to 2 mm. Thus, the element size was determined to be 2 mm in the study.
The final FE model is shown in Figure 5a. The geometric model was meshed with 237,600 elements and 266,232 nodes, and the element type was C3D8R, which is a widely used eight-node select-reduced element with both good calculation accuracy and efficiency. The element check showed the following: the aspect ratio was less than 4; the Jacobian was greater than 0.7; the min angle was greater than 40°. These indicators showed that the elements have a satisfactory quality. The boundary condition was imposed according to the actual condition. The bottom surface of the base plate was fully fixed, and the force was loaded on the upper surface of the vertical plate. The simulation results are shown in Figure 5b. The specimen moves down along the Z-axis, and closer to the top, a greater displacement is obtained. The root displacement is almost uniform, and the base plate is almost undeformed due to the rigid fixing. The groove root displacement in the same position as the test points was extracted and compared with the measurement, as illustrated in Figure 6. The average error of all points was kept at about 3%, which ensures the accuracy of the FE simulation.

3. Results and Discussion

3.1. Effect of Slit Height on Restraint Intensity

The thickness of the base and vertical plate was kept at 20 mm, and the slit height was changed to 0 mm, 20 mm, 40 mm, 60 mm, 80 mm, 100 mm, 120 mm, 140 mm and 160 mm to study the effect of the slit height on the restraint intensity. According to the definition of restraint intensity, the displacement was extracted to calculate the restraint intensity using Formula (1) as follows:
R = F l x
where R is the restraint intensity in N·(mm·mm)−1, F is the loading force in N, l is the groove length of 100 mm, and x is the displacement of the groove root in mm.
Thus, as shown in Figure 7a, the restraint intensity of specimens with different slit heights was calculated. Notably, the restraint intensity is significantly affected by the slit height. As the height increases, the constraint effect of the anchor welds decreases. The deformation of the groove root is enhanced; hence, the restraint intensity reduces considerably. In addition, the restraint intensity is not evenly distributed along the groove. When the slit heights are as small as 0 mm and 20 mm, the restraint intensity at the two ends is increased, which is mainly because the ends of the test welds are close to the anchor welds and the deformation is significantly decreased. However, when the heights increase to more than 40 mm, the deformation at the ends of the test welds is enhanced due to the notch effect of the slits, and the restraint intensity at the middle section is increased.
The mean value of the restraint intensity with different slit heights is shown in Figure 7b. The restraint intensity nearly shows a linear decrease as the slit height increases. The following linear fitting was produced to acquire a quantitative relationship:
R = 53.57 s + 11345.05
The correlation coefficient R2 is 0.99902, indicating a satisfactory result. Formula (2) can be employed to predict the restraint intensity. Furthermore, the data points of 0 mm and 20 mm deviate more from the straight line, which may be caused by the larger fluctuation of the restraint intensity distribution.

3.2. Effect of Vertical Plate Thickness on Restraint Intensity

The base plate thickness was kept at 20 mm, and the slit height was kept at 60 mm. The vertical plate thickness was changed to 12 mm, 16 mm, 20 mm, 24 mm, 28 mm, 32 mm, 36 mm and 40 mm to study the effect of the vertical plate thickness on the restraint intensity. The simulation results are shown in Figure 8a. It can be observed that the distributions of restraint intensity along the grooves fluctuate a little. The data points at both ends of the test welds are slightly reduced due to the notch effect of the slits.
Figure 8b shows the relationship between the restraint intensity and the vertical plate thickness. As the thickness increases, the restraint intensity increases almost linearly. When the thickness increases from 12 mm to 40 mm, the restraint intensity increases from 5133 N·(mm·mm)−1 to 17,772 N·(mm·mm)−1, which means that a 3.3-fold increase in the thickness is accompanied by a 3.5-fold increase in the restraint intensity. The quantitative relationship can be acquired through the following linear fitting:
R = 456.36 t 2 618.82
The correlation coefficient R2 is 0.9926, which indicates a good fitting. Compared with the effect of the slit height, the absolute value of the slope is significantly larger, implying that the vertical plate thickness has a significant impact on the restraint intensity.

3.3. Effect of Base Plate Thickness on Restraint Intensity

The vertical plate thickness was maintained at 20 mm, and the slit height was maintained at 60 mm, while the base plate thickness was kept at 12 mm, 16 mm, 20 mm, 24 mm, 28 mm, 32 mm and 40 mm. The simulation results are shown in Figure 9. As the thickness increases, the restraint intensity tends to decrease slightly. This is likely caused by the reduced possibility of cooperative deformation in the thicker base plate, i.e., deformation will be more likely to occur near the groove of the vertical plate when loading, and the restraint intensity declines. As the thickness increases by 3.3 times from 12 mm to 40 mm, the restraint intensity declines by 1.87%, which is only from 7920 N·(mm·mm)−1 to 7772 N·(mm·mm)−1. This suggests that the base plate thickness has little effect on the restraint intensity.

3.4. Linear Regression Analysis

The above analyses show that the restraint intensity has a strong linearity correlation to the slit height and vertical plate thickness. Meanwhile, the effect of the base plate thickness is negligible. Therefore, the restraint intensity can be predicted through the binary linear regression model. The SPSS statistical analysis software was used, where the slit height and vertical plate thickness were set as the independent variables and restraint intensity was set as the dependent variable.
The regression results revealed that the Durbin–Watson test value was 1.85, approaching 2, indicating that the observed values were basically independent. The adjusted R-squared was 0.913, showing that the independent variables significantly affected the dependent variables. The significance coefficient, or p value, was much less than 0.05, indicating that the regression model was statistically significant. The regression model is as follows:
R = 83.66 s + 489.90 t 2 + 4319.30
Using the regression model, the restraint intensity of specimens with different dimensions was calculated. The specimens were numbered from 1–8, and the errors between the regression model predicted values and the FE simulation results are shown in Figure 10. It can be seen that the errors fluctuate randomly, which conforms to the hypothesis of the regression analysis. Moreover, the average error was 10.00%, which showed that the model had good accuracy on the restraint intensity prediction.

3.5. Effect of Restraint Intensity on Welding Residual Stress

The FE software Visual Weld was employed to simulate the welding residual stresses of different restraint intensity specimens. The quantitative relationship between the restraint intensity and the welding residual stress was investigated. In Ti80 T-joint welded components, the backing weld is most susceptible to welding defects, and, thus, the simulation was performed for the backing weld and not for the whole. Specimens with a base and vertical plate thickness of 20 mm were selected. Different restraint intensities were obtained by changing the slit height. Transition meshing was performed from fine meshes near the weld regions to coarse meshes in farther regions. The mesh check showed the following: the aspect ratio was less than 5; the Jacobian was greater than 0.7; the min angle was greater than 30°. The element’s quality was satisfactory.
Normally, the TIG welding method is adopted for the backing weld, and, hence, the double ellipsoid model was selected for the heat source model; the heat input was determined based on the actual welding parameters, i.e., a welding current of 250 A, a voltage of 28 V and a speed of 15 cm·min−1. The convective heat loss and heat dissipation by radiation were considered in the FE simulation. The convective heat loss was described by the Newton’s law, and the transfer coefficient was set at 20 W·m2. Heat dissipation by radiation was defined by the Stefan–Boltzmann’s law, and the surface emissivity was 0.8 [32]. The material’s behavior was described based on the software database, and a phase change of α to β at 995 °C was considered; more details can be found in the documentation of SYSWELDTM.
To verify the accuracy, the FE simulation and welding test were conducted for specimens with a slit height of 60 mm. The results are presented in Figure 11. The weld morphology of the two is exactly the same, and, hence, the simulation is considered reliable.
The distribution of the residual stress after welding is shown in Figure 12. The residual stresses exist near the weld, and their values are below the yield strength. There is also some distribution near the slits, but the values are smaller. In addition, there are significant differences in the residual stress distributions on the upper surface and root. The values of the elements on the upper surface and root were extracted along the pass direction, as shown in Figure 13. The stresses on the weld surface are higher in the middle and lower at both ends, and this matches the distribution of the restraint intensity. In contrast, the stress distribution at the weld root shows opposite patterns, i.e., the middle segment is lower and the two ends are higher. In general, the stresses at the weld root are greater than those on the weld surface, which is consistent with the fact that cracks tend to occur at the weld root in welded components. Therefore, research should focus on the weld root.
The average value of residual stress in the weld root part with little fluctuation in the 20–80 mm section was 669 MPa. Similarly, FE analyses were conducted for the specimens with slit heights of 0~160 mm. The results showed that the stress distributions were the same with the 60-mm specimen. The average residual stress of each specimen was obtained, and the summarized results are shown in Figure 14a. Notably, the residual stress increases with the increase of restraint intensity. When the restraint intensity is small, the increment speed is slow, but it goes up when the restraint intensity reaches higher.
The logarithm of abscissa was calculated to facilitate the calculation, followed by a polynomial fitting. After several attempts, the cubic fitting showed better results, which are shown in Figure 14b. The correlation coefficient R2 was 0.99778, indicating a satisfactory result. The quantitative relationship between the residual stress and the restraint intensity is expressed as follows:
S = 24.16 r 3 586.83 r 2 + 4756.94 r 12222.63
where S is the welding residual stress and r is the logarithm of restraint intensity.
To verify the accuracy of the above prediction model, FE simulations were performed on specimens with a 20-mm base plate, a 60-mm slit and 12-mm and 32-mm vertical plates. The average stresses at the weld root were 611.46 MPa and 678.22 MPa. Meanwhile, the predicted values from Formula (5) were 650.97 MPa and 729.79 MPa, respectively. The error between the FE simulation and the prediction was within 8%, indicating the accuracy of Formula (5) in predicting the welding residual stress. In future research, the residual stress in actual Ti80 alloy workpieces will be predicted using the model, and experimental measurements will be conducted to further verify the accuracy. Based on the prediction model, the residual stress of actual Ti80 alloy workpieces can be estimated before welding, and a corresponding strategy for avoiding cracks can be generated.

4. Conclusions

In this paper, T-joint specimens of the Ti80 alloy with different dimensions were selected as the research objects. The restraint intensity and welding residual stress were studied by FE simulations, whose accuracy had been verified. The influence of slit height, vertical plate thickness and base plate thickness on the restraint intensity was investigated. The quantitative relationship between these parameters and the restraint intensities was also studied. Moreover, the quantitative relationship between the restraint intensity and the residual stress was explored. The following conclusions were obtained:
(1)
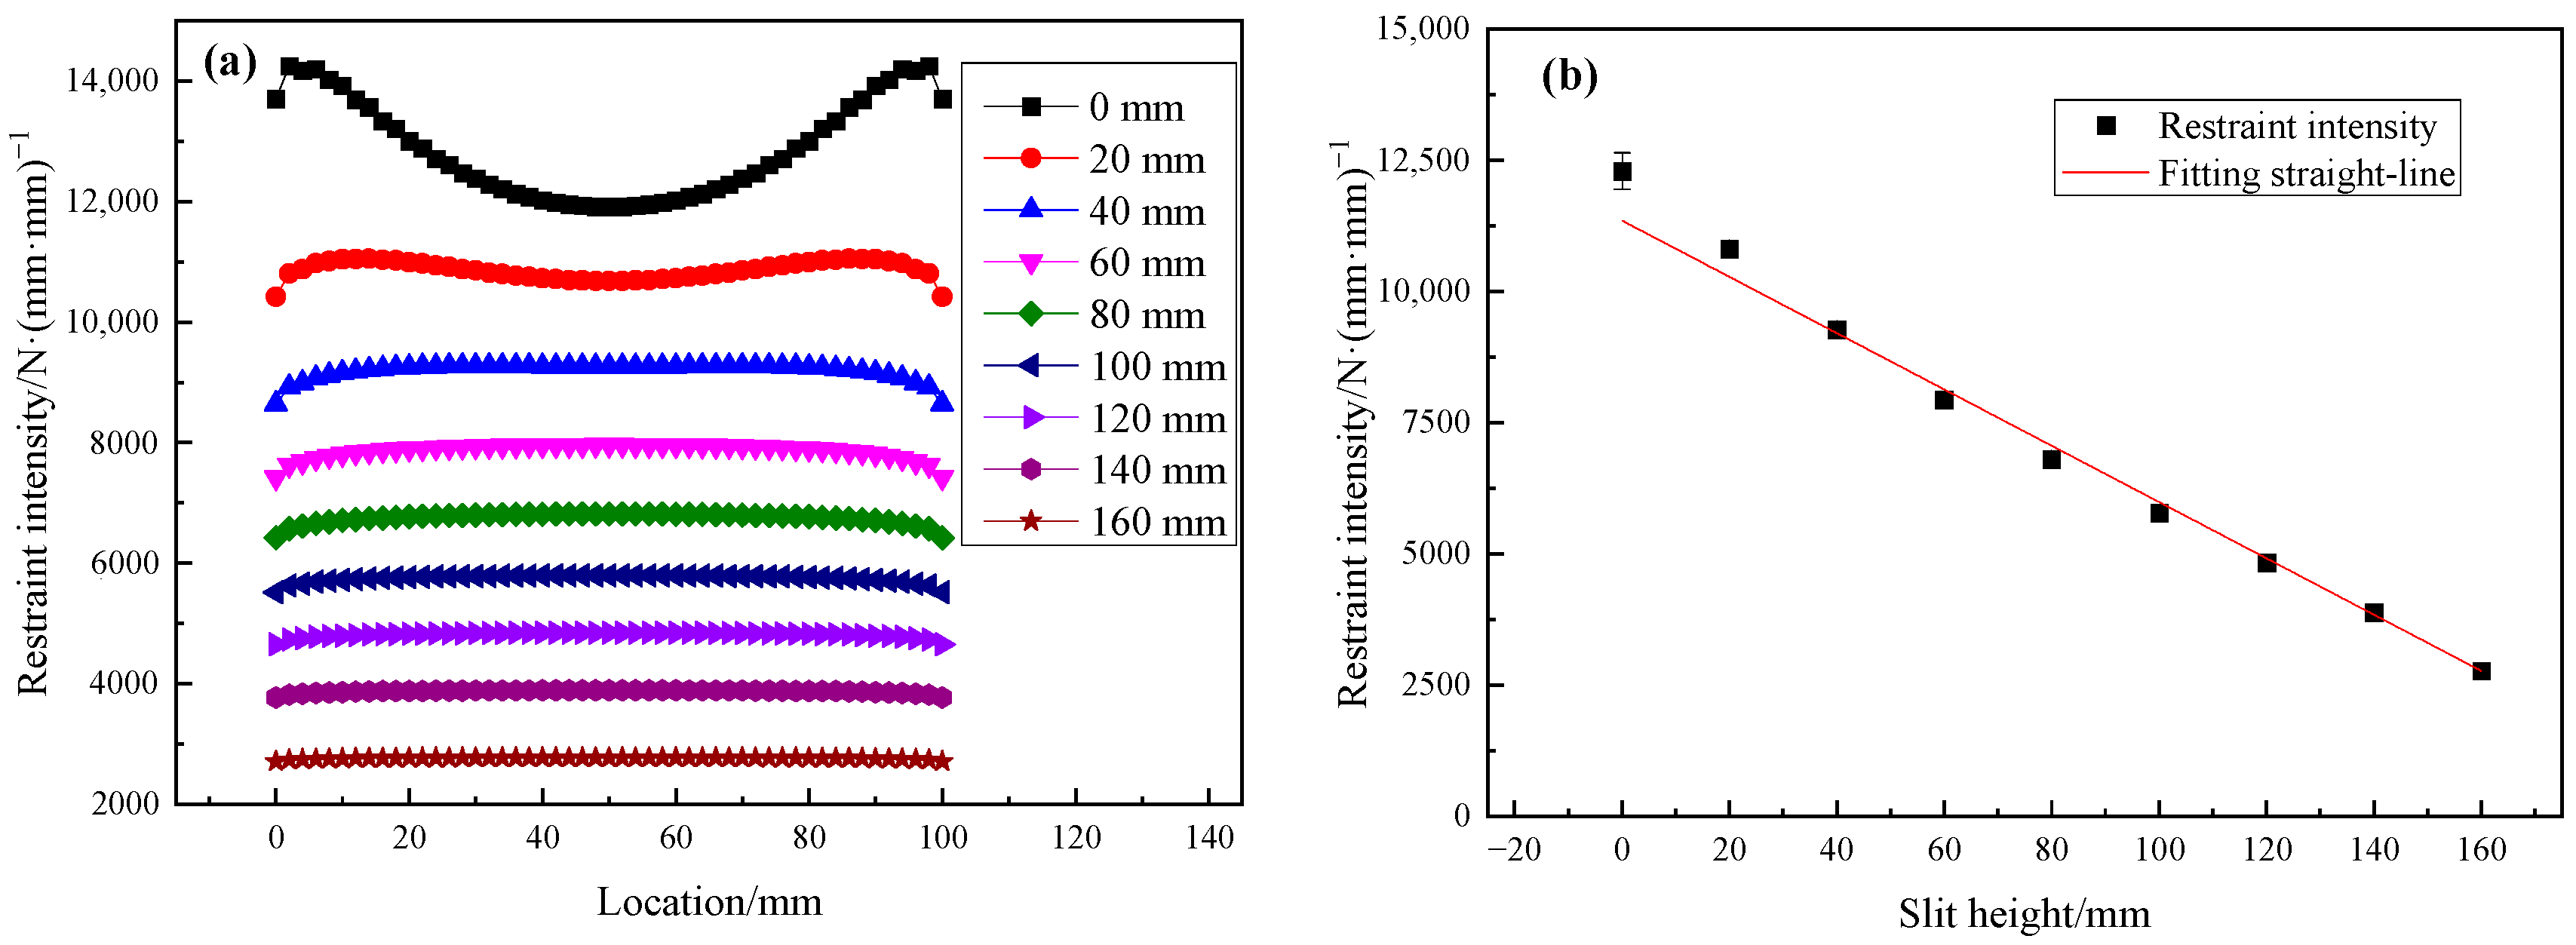
The restraint intensity is significantly affected by the slit height. As the height increases, the restraint intensity decreases linearly. The reason for this is that with the height increase, the constraint effect of the anchor welds decreases and the deformation of the groove root is enhanced. The restraint intensity is not evenly distributed along the groove; when the slit heights are as small as 0 mm and 20 mm, the restraint intensity at the two ends is increased, which is mainly because the ends of the test welds are close to the anchor welds, and the deformation is significantly decreased. When the heights increase to more than 40 mm, the deformation at the ends of the test welds is enhanced due to the notch effect of the slits and the restraint intensity at the middle section is increased.
(2)
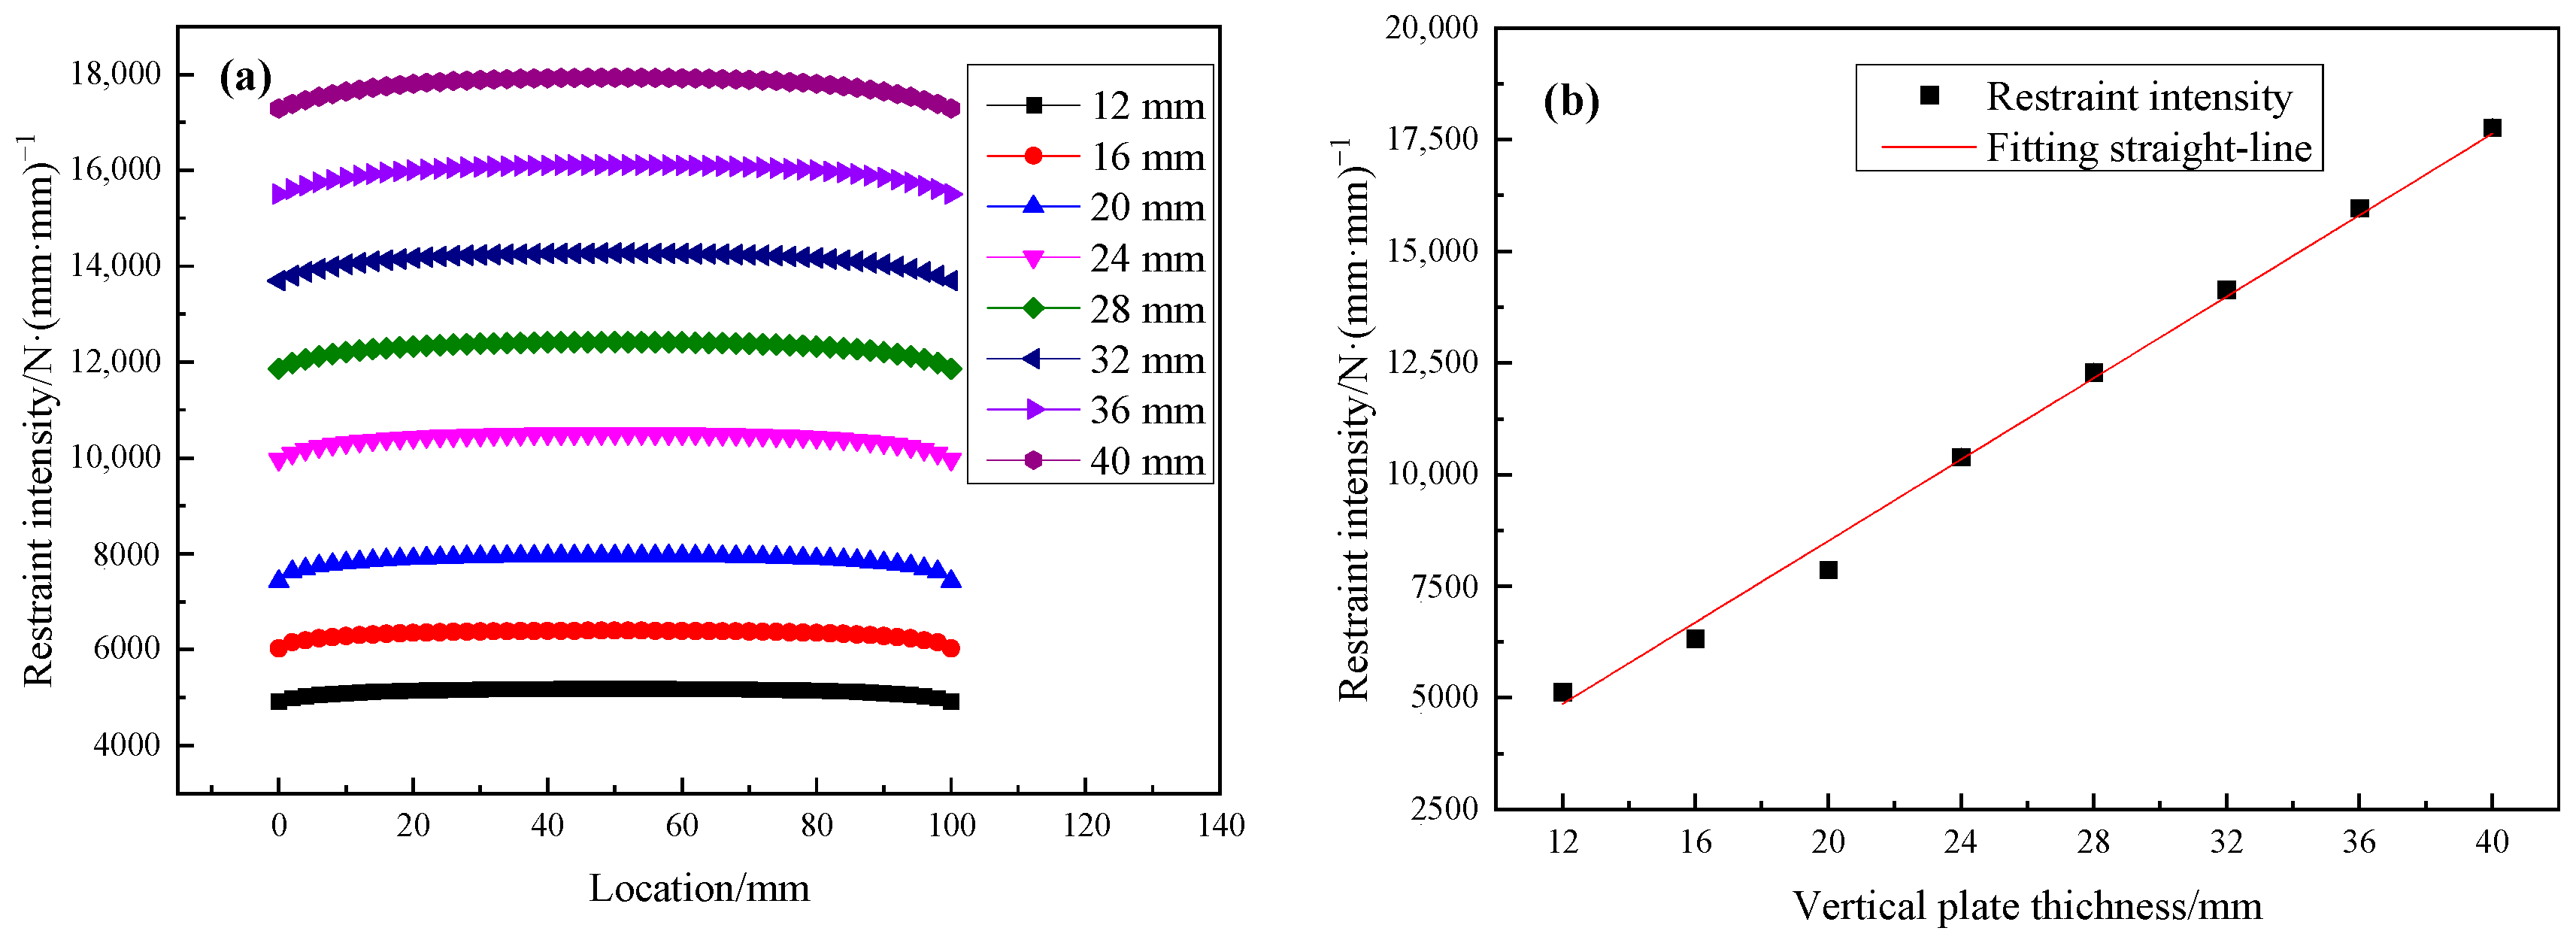
The vertical plate thickness has a significant impact on the restraint intensity. As the vertical plate thickness increases, the restraint intensity increases almost linearly. The distributions of the restraint intensity along the grooves fluctuate a little; the data points at both ends of the test welds are slightly reduced due to the notch effect of the slits.
(3)
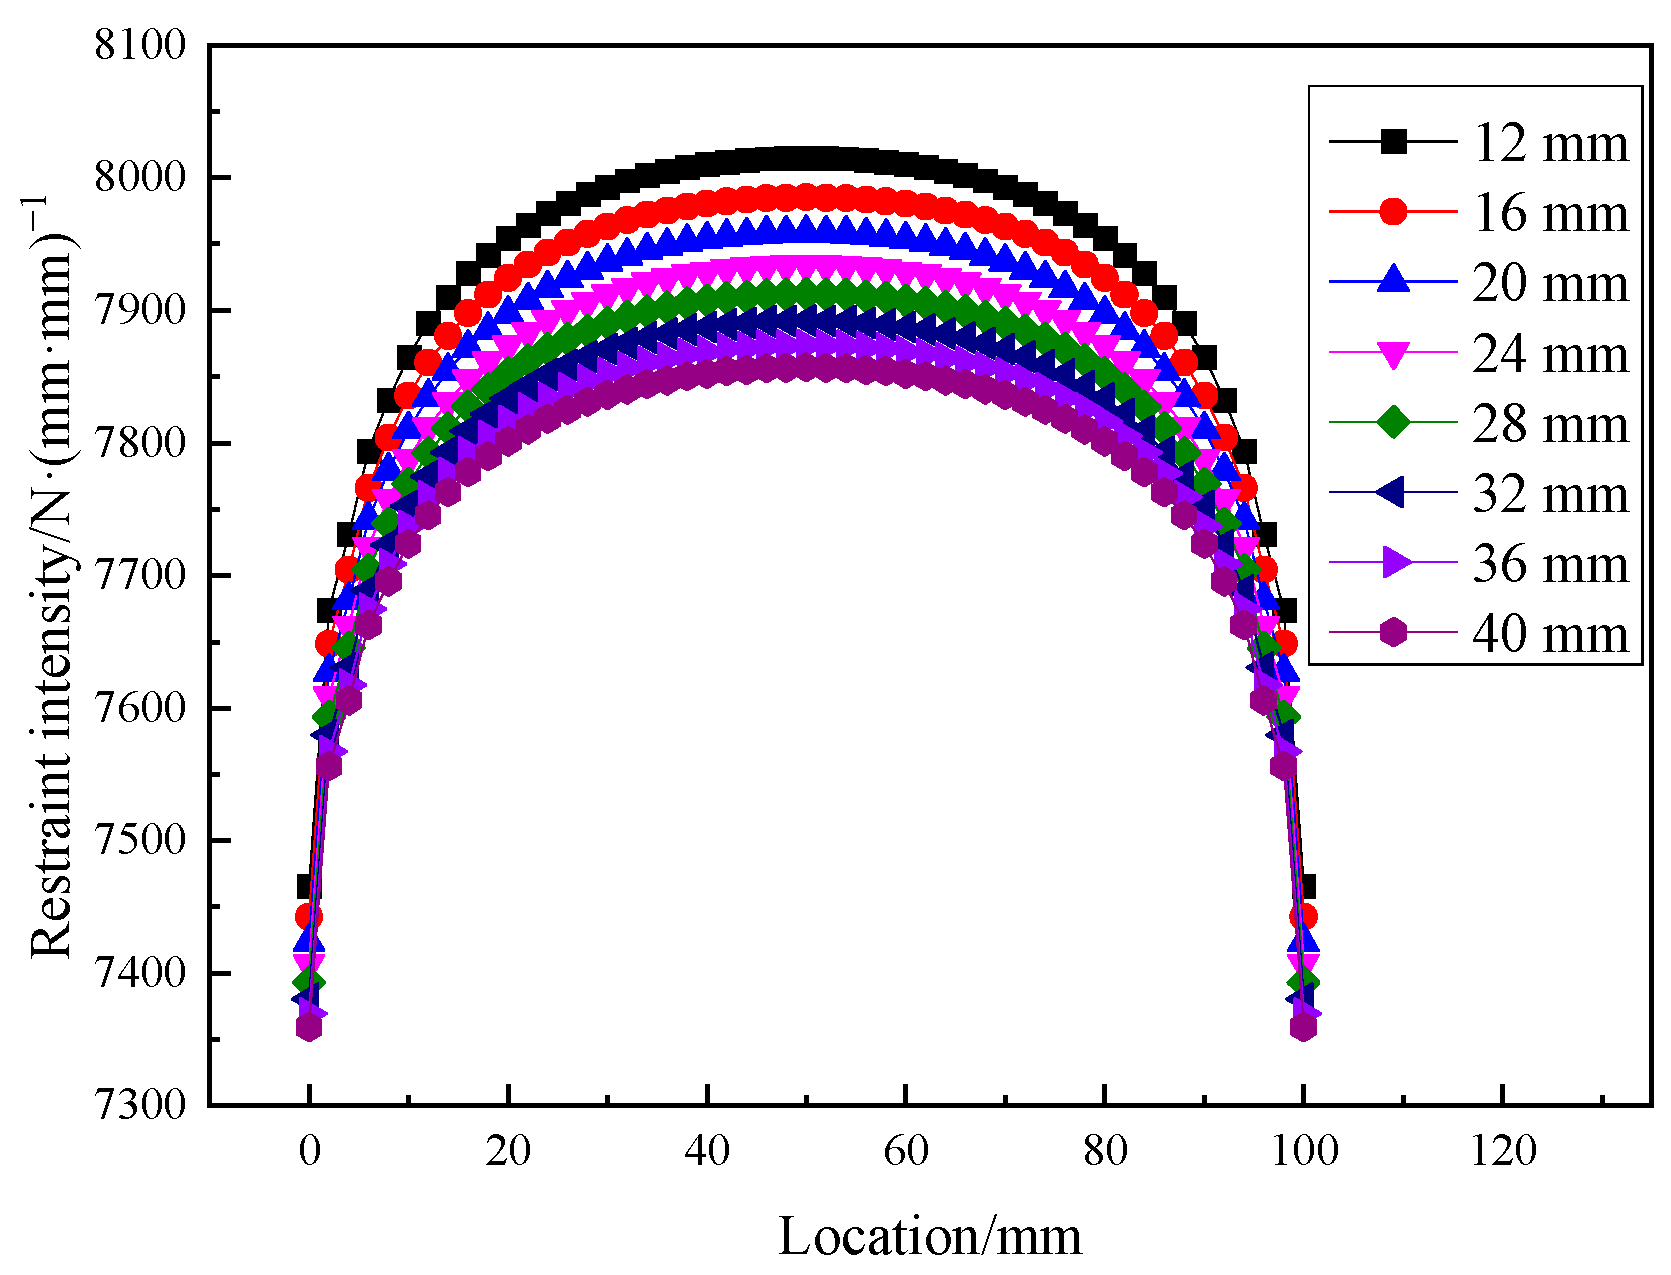
The base plate thickness has little effect on the restraint intensity. As the thickness increases, the restraint intensity tends to decrease very slightly. This is likely caused by the reduced possibility of cooperative deformation in thicker base plates, i.e., deformation will be more likely to occur near the groove of the vertical plate.
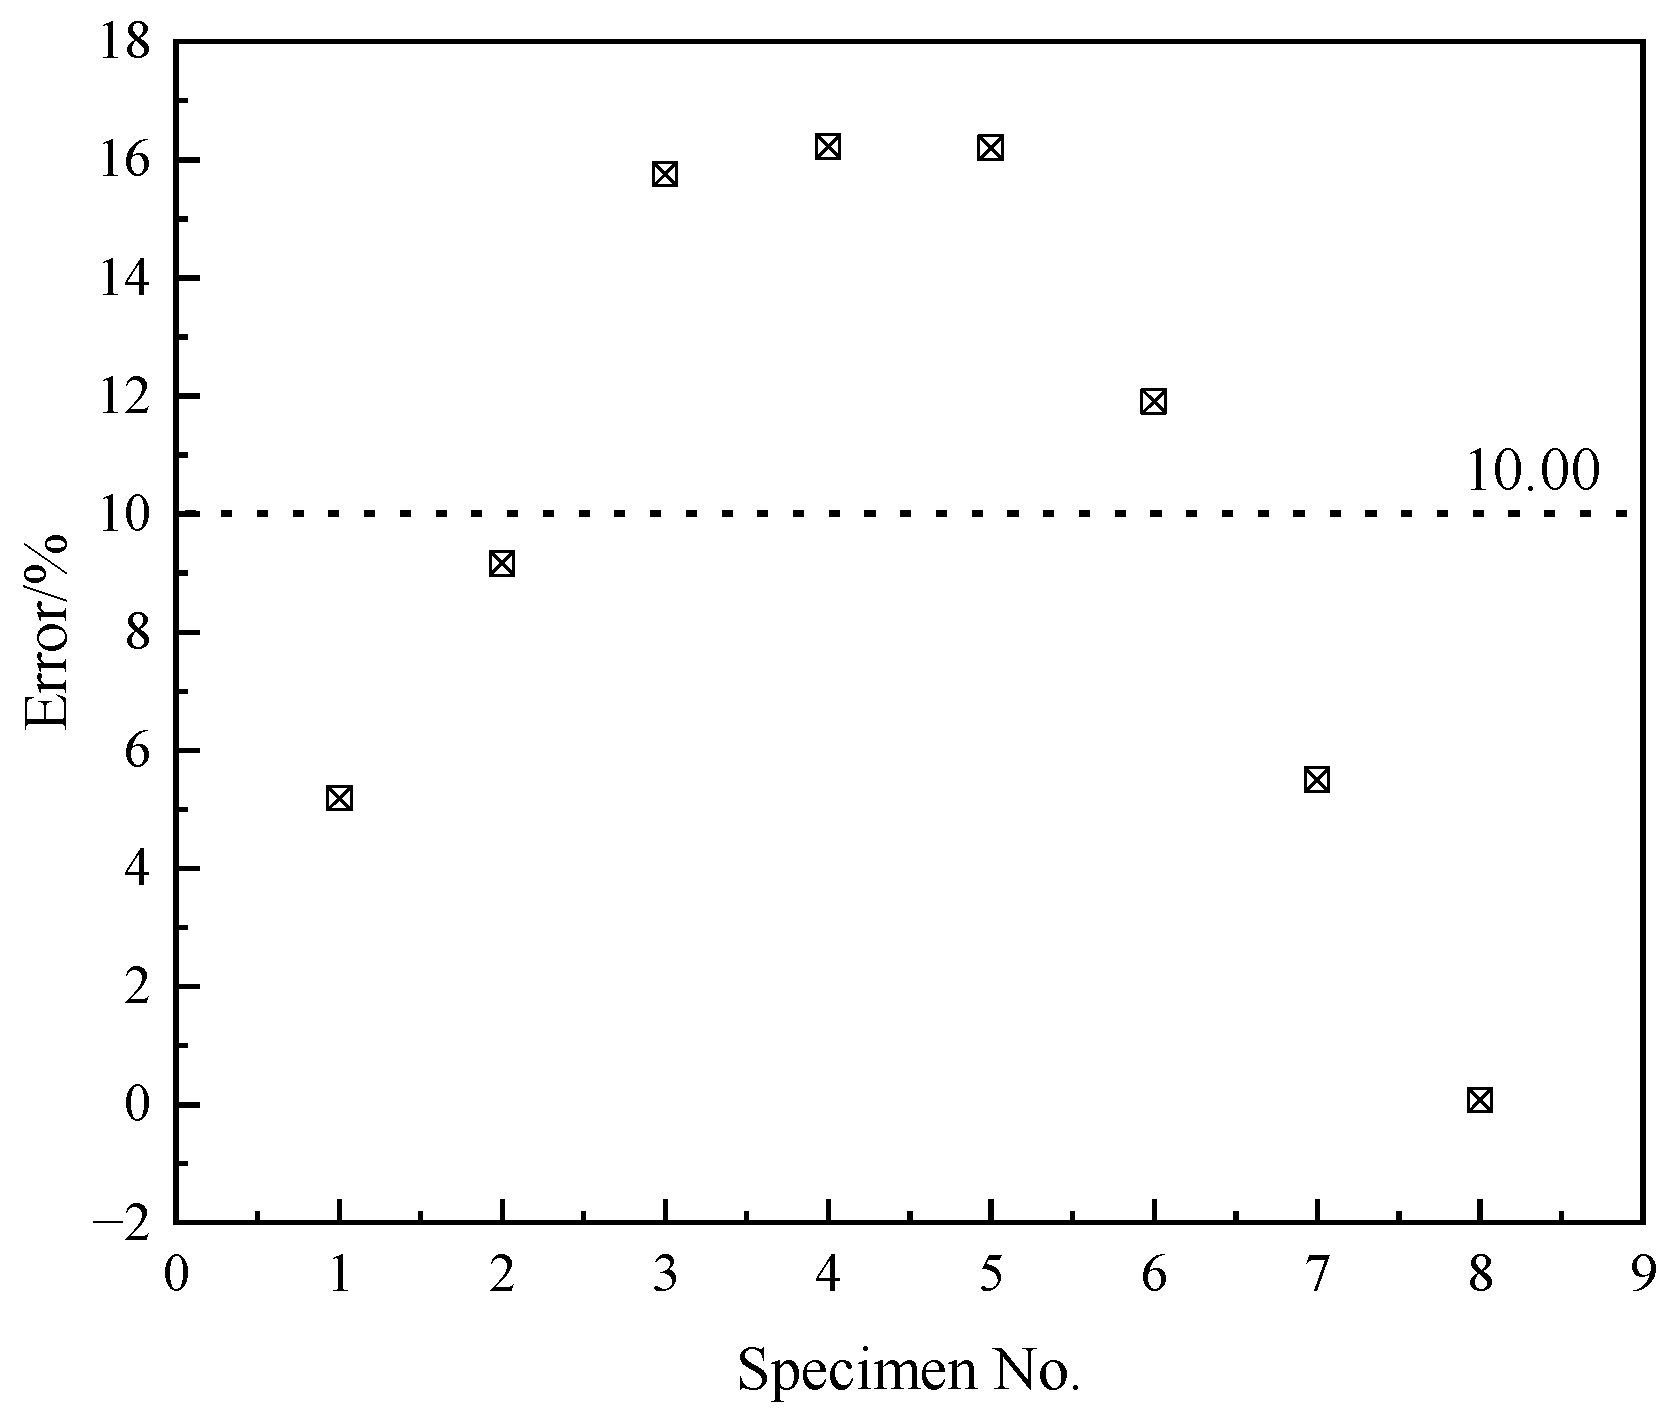
(4)
A binary linear regression model of restraint intensity can be constructed as follows: R = 83.66 s + 489.90 t 2 + 4319.30 where R is the restraint intensity, s is the slit height and t2 is the vertical plate thickness. Eight specimens with different dimensions were calculated by the formula, and the average error was 10%, indicating good accuracy for the prediction formula.
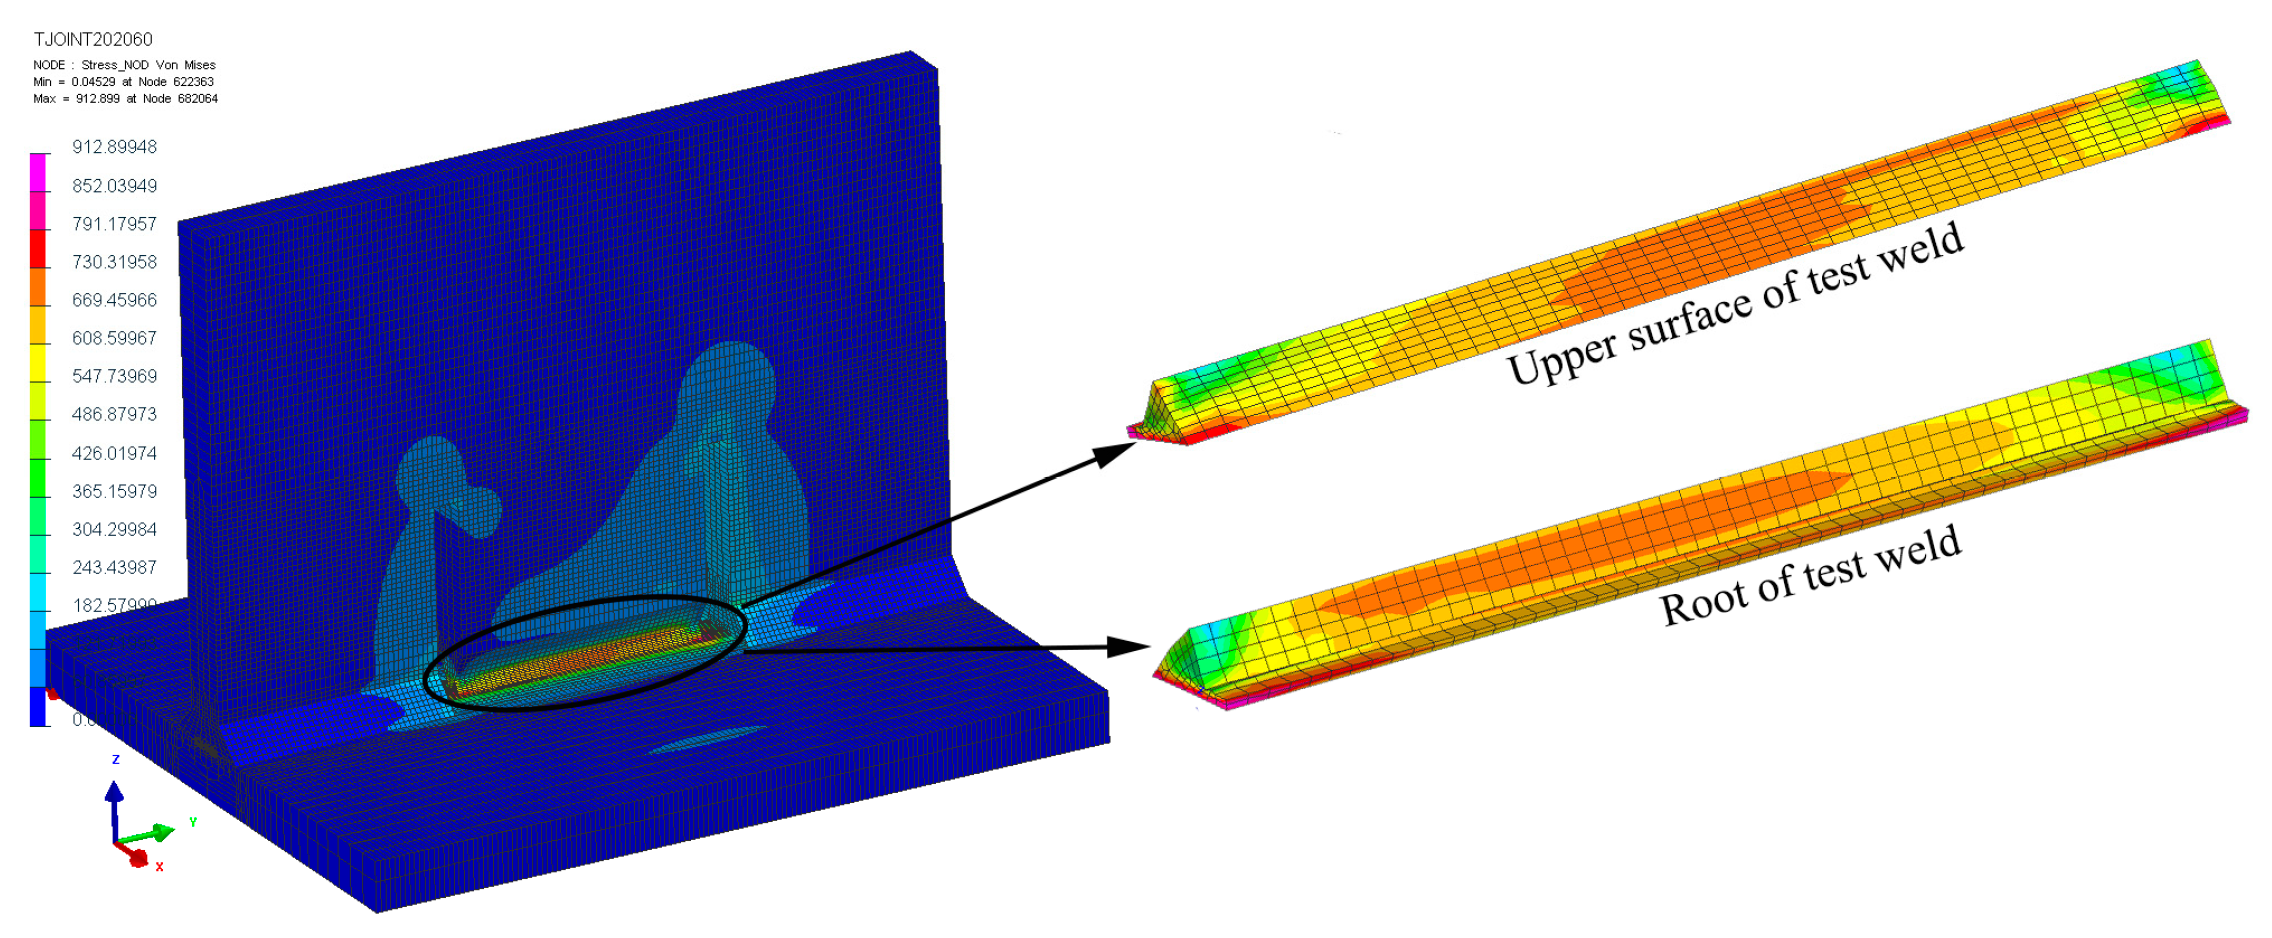
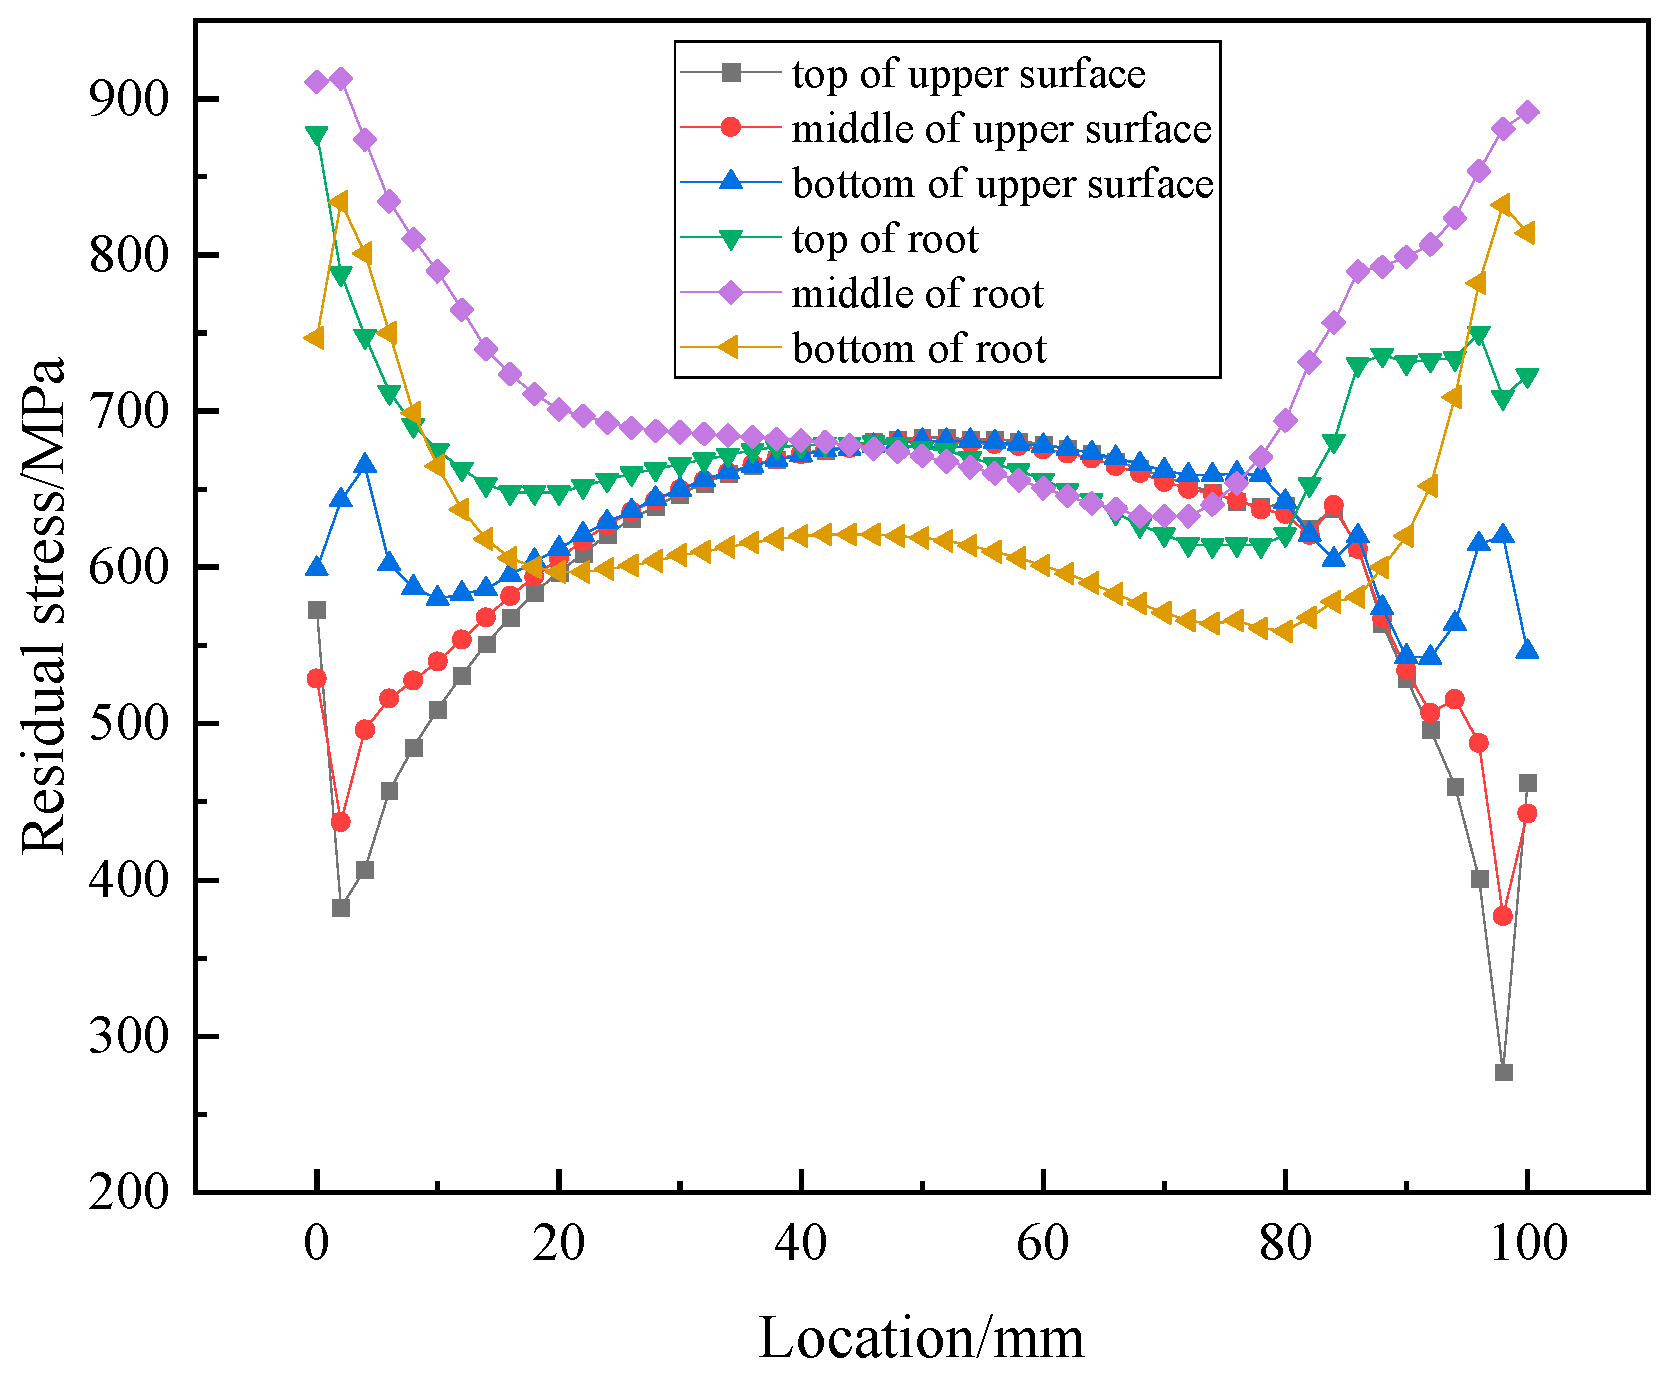
(5)
The welding residual stresses on the backing weld surface are higher in the middle and lower at both ends, while the weld root shows opposite results. In general, stresses at the weld root are greater than those on the weld surface. The mean residual stress value at the weld root increases with the increase in the restraint intensity but not uniformly, i.e., it is slow at first and then increases rapidly. A prediction model of the residual stress was produced using cubic fitting as follows: S = 24.16 r 3 586.83 r 2 + 4756.94 r 12222.63 where S is the welding residual stress and r is the logarithm of the restraint intensity. The errors between the finite element simulations and predictions were about 8%. Through the prediction model, the residual stress of actual Ti80 alloy workpieces can be estimated before welding, and a corresponding strategy for avoiding cracks can be generated.

Author Contributions

Conceptualization, L.Z. and Q.W.; methodology, L.Z. and P.C.; software, L.Z.; validation, B.L., Z.Z. and X.Y.; data curation, P.C.; writing—original draft preparation, L.Z.; writing—review and editing, L.Z.; formal analysis, B.L.; visualization, Q.W.; supervision, L.Z.; project administration, L.Z.; funding acquisition, L.Z. All authors have read and agreed to the published version of the manuscript.

Funding

This research was funded by the National Natural Science Foundation of China (Grant No. 51701189), the Natural Science Foundation of Henan Province of China (202300410280), the Henan Province Key R&D and Promotion Special Project (192102210163), the Key Scientific Research Projects of Colleges and Universities in Henan Province (21B430009), the Innovation and Development Research Project of Zhumadian City and the National Scientific Research Project Cultivation Fund of Huanghuai University (XKPY-202007).

Data Availability Statement

The data are available from the corresponding author upon reasonable request.

Acknowledgments

The authors would like to thank Zhanxue Wang from Huanghuai University for her help with the sample preparations.

Conflicts of Interest

The authors declare no conflict of interest.

References

  1. Chen, J.; Zhao, Y.Q.; Chang, H. Research and development of titanium alloy for shipbuilding in China. Mater. Rev. 2005, 6, 67–70. [Google Scholar]
  2. Zhao, Y.Q. The new main titanium alloys used for ship-building developed in China and their applications. Mater. China 2014, 33, 398–404. [Google Scholar]
  3. Sun, J.K.; Meng, X.J.; Chen, C.H. Research, application and development of shipbuilding titanium alloy in China. Acta Metall. Sin. 2004, 38, 33–36. [Google Scholar]
  4. Ruben, L.L.; Marina, C.B.; María, M.C. Residual stresses with time-independent cyclic plasticity in finite element analysis of welded joints. Metals 2017, 7, 136. [Google Scholar]
  5. Chen, C.; Wang, J.H.; Tang, Y.M. Constraint of welded joints in hull and its influence on cold cracks. Mar. Technol. 1981, 3, 7–14. [Google Scholar]
  6. Fukuda, K.; Tsuji, M. Japanese studies on structural restraint severity in relation to weld cracking. Weld. World 1977, 15, 155–189. [Google Scholar]
  7. Suzuki, H. Weldability of modern structural steels in Japan. Trans. Iron Steel Inst. Jpn. 1983, 23, 189–204. [Google Scholar] [CrossRef] [Green Version]
  8. Sun, J.M.; Jonas, H.; Thomas, N.P. Influence of restraint conditions on welding residual stresses in H-type cracking test specimens. Materials 2019, 12, 2700. [Google Scholar] [CrossRef] [Green Version]
  9. Cross, C.E.; Boellinghaus, T. The effect of restraint on weld solidification cracking in aluminium. Weld. World 2006, 50, 51–54. [Google Scholar] [CrossRef]
  10. Qin, T.T.; Piao, X.H.; Jiang, Y.H. Analysis and prevention of forging stress cracks for sealing ring. Forg. Stamp. Technol. 2020, 45, 37–41. [Google Scholar]
  11. Thomas, K.; Thomas, B. Cold cracking tests-an overview of present technologies and applications. Weld. World 2013, 57, 3–37. [Google Scholar]
  12. Chen, C.; Wang, J.H.; Tang, Y.M. Study on the restraint intensity of welded joint. Weld. Joi. 1981, 6, 6–9. [Google Scholar]
  13. Liu, B.; Chen, M.M. Calculation of the restraint intensity of VRC test assemblies. J. Cent. Southwest Jiaotong Univ. 1993, 2, 31–36. [Google Scholar]
  14. Tao, S.S.; Zong, P.; Dong, J.Y. The calculation method for welding restraint intensity of fillet weld in ring stiffened cylinder. Trans. China Weld. Inst. 2013, 34, 97–100. [Google Scholar]
  15. Ramesh, B.; Elsheikh, A.H.; Satishkumar, S.; Shaik, A.M.; Djuansjah, J.; Ahmadein, M.; Moustafa, E.B.; Alsaleh, N.A. The Influence of boron carbide on the mechanical properties and bonding strength of B4C/Nickel 63 coatings of brake disc. Coatings 2022, 12, 663. [Google Scholar] [CrossRef]
  16. Ammar, H.E.; Guo, J.J.; Huang, Y.; Ji, J.J. Temperature field sensing of a thin-wall component during machining: Numerical and experimental investigations. Int. J. Heat Mass Transf. 2018, 126, 935–945. [Google Scholar]
  17. Abdallah, K.; Ezzat, S.; Ammar, E. Effect of single-period overload parameters on fatigue crack retardation for high-density polyethylene. Theor. Appl. Fract. Mec. 2022, 118, 103249. [Google Scholar]
  18. Jing, H.Y.; Xu, J.J.; Xu, L.Y. Finite element simulation of the restraint intensity of rigid butt-jointed cracking specimen and VRC specimen. Trans. China Weld. Inst. 2018, 39, 1–5. [Google Scholar]
  19. Alipooramirabad, H.; Paradowska, A.M.; Ghomashchi, R.; Kotousov, A.; Hoye, N. Prediction of welding stresses in WIC test and its application in pipelines. Mater. Sci. Technol. 2016, 32, 1462–1470. [Google Scholar] [CrossRef]
  20. Zhang, L.; Yang, Q.; Zhang, X.W.; He, W.X.; Li, X.X.; Gu, R.C. Finite element analysis on restraint intensity of Ti80 alloy specimen with Y-joint groove. Dev. Appl. Mater. 2020, 35, 37–41. [Google Scholar]
  21. Zhang, L.; Zhang, X.W.; Hu, Y.S.; Xu, J.X.; Geng, P.Z. Finite element analysis on restraint intensity of Ti80 alloy rigid restraint. Rare Met. 2021, 45, 1223–1229. [Google Scholar]
  22. Watanabe, M.; Satoh, K. Research on intensity of restraint and reaction stress in welded joints. J. Zosen Kiokai 1961, 1961, 349–358. [Google Scholar] [CrossRef] [PubMed]
  23. Watanabe, M.; Takagi, O.; Satoh, K.; Aso, F. External constraint and shrinkage of butt-welded joints in the erection of assemblies on building way. J. Zosen Kiokai 1958, 1958, 191–200. [Google Scholar] [CrossRef] [PubMed]
  24. Park, J.; An, G.; Woo, W. The effect of initial stress induced during the steel manufacturing process on the welding residual stress in multi-pass butt welding. Int. J. Nav. Archit. Ocean Eng. 2018, 10, 129–140. [Google Scholar] [CrossRef]
  25. Park, J.; An, G.; Kim, S. The effect of welding-pass grouping on the prediction accuracy of residual stress in multipass butt welding. Math. Probl. Eng. 2017, 2017, 7474020. [Google Scholar] [CrossRef] [Green Version]
  26. Satoh, K.; Ueda, Y.; Kihara, H. Recent trend of researches on restraint stresses and strains for weld cracking. Trans. JWRI 1972, 1, 53–68. [Google Scholar]
  27. Satoh, K. An analytical approach to the problem of restraint intensity in slit weld. Trans. JWRI 1972, 1, 69–76. [Google Scholar]
  28. Shin, S.B.; Lee, D.-J.; Park, D.-H. A study on the evaluation of transverse residual stress at the multi-pass FCA butt weldment using FEA. J. Weld. Join. 2010, 28, 26–32. [Google Scholar]
  29. Huang, X.M.; Sun, J.; Li, J.F. Finite element simulation and experimental investigation on the residual stress-related monolithic component deformation. Int. J. Adv. Manuf. Tech. 2015, 77, 1035–1041. [Google Scholar] [CrossRef]
  30. Tlili, I.; Baleanu, D.; Mohammad, S.S. Numerical and experimental analysis of temperature distribution and melt flow in fiber laser welding of Inconel 625. Int. J. Adv. Manuf. Tech. 2022, 121, 765–784. [Google Scholar] [CrossRef]
  31. Caruso, S.; Umbrello, D. Numerical and experimental validation of gas metal arc welding on AISI 441 ferritic stainless steel through mechanical and microstructural analysis. Int. J. Adv. Manuf. Tech. 2022, 120, 7433–7444. [Google Scholar] [CrossRef]
  32. Jia, Y.B.; Saadlaoui, Y.; Hamdi, H.; Sijobert, J.; Roux, J.C. An experimental and numerical case study of thermal and mechanical consequences induced by laser welding process. Case Stud. Therm. Eng. 2022, 35, 1–19. [Google Scholar] [CrossRef]
Figure 1. Dimensions of the T-joint specimen.
Metals 13 00125 g001
Figure 2. Mechanical properties of the Ti80 alloy: (a) tensile curve; (b) true stress and plastic strain.
Metals 13 00125 g002
Figure 3. Facility for restraint intensity testing.
Metals 13 00125 g003
Figure 4. Mesh-independent verification results.
Metals 13 00125 g004
Figure 5. FE model and result: (a) FE model; (b) simulation result.
Metals 13 00125 g005
Figure 6. Comparison of the FE and the measurement results.
Metals 13 00125 g006
Figure 7. Restraint intensity of specimens with different slit heights: (a) distribution of restraint intensities; (b) linear fitting result.
Metals 13 00125 g007
Figure 8. Restraint intensity of specimens with different vertical plate thicknesses: (a) distribution of restraint intensities; (b) linear fitting result.
Metals 13 00125 g008
Figure 9. Restraint intensity of specimens with different vertical plate thickness.
Metals 13 00125 g009
Figure 10. Errors between predicted values and FE simulation values.
Metals 13 00125 g010
Figure 11. Comparison of simulation result and actual joint macrograph.
Metals 13 00125 g011
Figure 12. Simulation results of the welding residual stress.
Metals 13 00125 g012
Figure 13. Residual stresses on the test weld.
Metals 13 00125 g013
Figure 14. Relationship between welding residual stress and restraint intensity: (a) FE simulation results; (b) the cubic fitting result.
Metals 13 00125 g014
Disclaimer/Publisher’s Note: The statements, opinions and data contained in all publications are solely those of the individual author(s) and contributor(s) and not of MDPI and/or the editor(s). MDPI and/or the editor(s) disclaim responsibility for any injury to people or property resulting from any ideas, methods, instructions or products referred to in the content.

