Article

Influence on Fatigue Strength of Post-Process Treatments on Thin-Walled AlSi10Mg Structures Made by Additive Manufacturing

Department of Industrial Engineering (DIN), Alma Mater Studiorum—Università di Bologna, Via Fontanelle 40, 47121 Forlì, Italy
*
Author to whom correspondence should be addressed.
Metals 2023, 13(1), 126; https://doi.org/10.3390/met13010126
Submission received: 9 December 2022 / Revised: 2 January 2023 / Accepted: 6 January 2023 / Published: 8 January 2023

Abstract

:
This work aims to study the fatigue behavior of thin-walled structures and the possible influence of post-process treatments. Specimens with novel geometry were manufactured in AlSi10Mg with different inner diameter values using selective laser melting (SLM) technology and then treated. The different processes applied to the specimens were T6 quenching, microshot peening, and controlled roughness machining. The fracture data were analyzed to obtain the fatigue strength values at 2 × 10 6 cycles. The results showed that the mechanical treatments and the T6 quenching improved the fatigue strength by over 55% and over 80%, respectively. Relative density and per cent porosity were measured, and microscopic observations by electron microscope, metallographic microscope, and scanning electron microscope (SEM) were performed. It was possible to conclude that thickness did not affect fatigue life in the studied cases.

1. Introduction

Interest in additive manufacturing has grown exponentially in recent years. This technology makes it possible to 3D print various metals, which then find applications in the automotive, aerospace, and biomedical fields. However, using parts produced through additive technology requires high mechanical properties comparable to those of cast materials. The strength of the resulting parts must be studied both in the static case and in the case of cyclic stress, particularly regarding fatigue behavior at a high number of cycles. The main advantage of manufacturing metals by SLM 3D printing is the possibility of obtaining very complex shapes, produced layer by layer by a laser that can selectively melt the powder used. This characteristic allows the manufacturing of non-standard specimens of specific shapes, suitable for investigating less familiar aspects of fatigue behavior. Numerous studies [1,2,3] have focused on static mechanical properties, such as yield and ultimate tensile strengths, and high cycle fatigue life, especially concerning steel. The authors concluded that the limit value obtained by this manufacturing methodology is lower than that obtained by classical machining methods but that subsequent surface or thermal treatments can improve the component’s useful life. SLM stainless steel and titanium alloys are currently employed in lightweight biomechanical applications characterized by thin lattice structures, whose fatigue behavior was studied in [4,5]. As reported in the literature for other materials [6], the laser power has to be appropriately adjusted to obtain optimal microstructures. However, not only steel and titanium components can be produced with SLM 3D printing, but also light aluminium alloys can be made with this process. These alloys find use in numerous industries due to their high mechanical properties and low density.
Research has been conducted in the literature on AlSi10Mg aluminium regarding its properties and their modification with the printing parameters. By changing the energy density values, scanning speed, and spacing required by the printing machine, the properties of aluminium could be determined. Additionally, in these studies, the best mechanical characteristics were obtained in specimens that had undergone heat treatment, as well as in a given build orientation and position [7,8,9], which is very important when considering lattice structures characterized by structural elements with different orientations. Moreover, the effect of process parameters on surface roughness and surface defects was studied in [10] because of their generally known high importance on fatigue strength. In [11], the influence of hatch spacing and build direction on the porosity of the specimen was analyzed, and the correlation between the defect size and the energy used was studied. Several studies have been conducted on the microstructure and properties of this material made by selective laser melting (SLM) [12,13]. In some, the durability with a high number of cycles has also been highlighted [14]. One option to increase the cyclic stress resistance is to perform post-process treatments that improve the surface quality or reduce the amount of defects present, such as microshot peening and heat treatments. Numerous studies consider the microstructural changes and mechanical properties of the AlSi10Mg alloy, following heat treatments for quenching [15,16,17]. In other investigations, differences in fatigue life between as-built, surface-treated, and heat-treated specimens were highlighted [18,19]. Testing materials according to the international normative [20] do not allow for the evaluation of the possible effect of the thickness on the fatigue behavior of thin-walled components. On the other side, from the pioneering work of Peterson [21], it is known that the material’s volume can affect the fatigue properties. One of the most advanced applications of additive manufacturing is the development of optimized thin-walled lightweight structures [22,23,24].
This consideration identified the need to study the fatigue strength of the AlSi10Mg aluminium alloy, considering the effect of post-process treatments and the wall thickness. To achieve that goal, new custom-made specimens were designed and manufactured.

2. Materials and Methods

2.1. Samples’ Geometry

To analyze the influence of wall thickness on fatigue life, an ad hoc design of specimens was made, as shown in Figure 1. Commonly, the specimens used in other studies [1,2,3] are those with the basic “dog-bone” geometry, while for standard specimens, the typical geometry is solid in this work, and 12 mm diameter cylindrical hollow specimens were used. Internally, a cavity was manufactured, allowing for the resistant section to be modified, which is helpful for investigating the strength at different wall thicknesses. In general, when studying fatigue in classical machined specimens, the failure mechanism consists of the nucleation of a crack frequently on the external surface of the component or in correspondence with an inner defect, which, once propagated, leads to breakage. Thanks to layer-by-layer deposition and selective powder melting, the additive manufacturing process allows for the fabrication of internally hollow components without subsequent cutting machining. This can also lead to the presence of defects on the internal surface of the component, which cannot be eliminated and can therefore affect fatigue life. In addition, considering different wall thicknesses and, consequently, a lower amount of material can lead to a smaller absolute number of defects and a subsequent influence on the number of cycles the material can withstand. The overall dimensions of the specimen were considered based on the geometry of the testing machine used. The wall thicknesses studied were 2.4 mm, 1.2 mm, and 0.6 mm, slightly above the minimum value achievable with SLM technology. Figure 1 shows the specimen with a wall thickness in the central part of 0.6 mm.
As in the case of the standard samples, fillets were added to avoid possible stress concentrations between the investigated area and the gripping sections characterized by the small-diameter hole required to release the powder used for printing. These features were then verified through FEM analysis. By placing one end of the specimen as a fixed constraint and applying a bending moment on the opposite side, the stresses and possible singularities of the fittings were verified.

2.2. Production of Specimens through Additive Manufacturing

The EOSM280 (EOS GmbH Electro Optical Systems, Krailling/Munich, Germany) machine with SLM printing technology was used for production. The parameters entered for manufacturing included a laser power of 320 W and an energy density of 41.025 J/mm3. It is well known that SLM components may show anisotropy as regards strength properties. The worst case is to have the build direction perpendicular to the load, so the samples were printed vertically, with the build axis along Z. After fabrication, all of the specimens were subjected to stress-relief treatment. In contrast, only a few series were subjected to post-processing treatments, as follows: T6 hardening heat treatment, micro-shot peening, and controlled roughness machining. Microshot peening was performed using 0.2 mm glass balls with a pressure of 4 bar, while the controlled roughness process consisted of machining the surface of the cylinders to improve their roughness to the same level obtained by microshot peening, which is around 6 μ m [25]. Finally, the T6 tempering heat treatment performed included:
  • Solubilization at 520 °C;
  • Quenching in water;
  • Artificial aging at 160 °C for 6 h.

2.3. Testing Machine and Test Methods

The failure data allowed for the calculation of the fatigue strength of the considered specimens using the staircase method [26] according to ISO 12017 [27]. The standard was applied by considering 15 specimens for the series with stress-relief treatment and 6–8 specimens for the remaining groups. In addition, a step of 5 MPa was considered between two consecutive stress values. The specimens were stressed cyclically until failure or until the run-out value, which was set at 2 × 10 6 cycles. The lower limit of the fatigue strength is calculated for a probability of failure of 10% and at a confidence level of 90%. The fatigue life was determined for the various series used, as shown in the test plan in Table 1.
Experimental tests were conducted on an Italsigma 2 TM 831 rotary bending machine (ITALSIGMA, Forlì, Italy), with a stress ratio of R = 1 and a frequency of 60 Hz. A weighing scale was used to determine the density of the specimens, which, by exploiting Archimedes’ principle and measuring the mass of the specimen in air and water, can return the value sought. Preliminary fracture surface analyses were performed using a Zeiss Stemi 305 stereomicroscope (Zeiss, Oberkochen, Germany) equipped with Axiocam 105 colour (Zeiss, Oberkochen, Germany) cameras with available zooms of 0.8, 1, 2, 3, and 4. The observations were enhanced by using a scanning electron microscope (SEM) (Zeiss, Oberkochen, Germany), which enabled a detailed study of the fracture surface, its microstructure, and its peculiarities. To study the melt pool typical of the additive manufacturing process, the samples were polished, treated with Keller’s reagent (Antec Inc., Louisville, KY, USA) for about 35 s, and then immersed in hot water for a few seconds. Images were then captured with a Nikon Optiphot-100 (NIKON CORPORATION, Tokyo, Japan) metallographic microscope with 5×, 10×, 20×, and 50× zoom, equipped with a 3Mpx Moticam 3 (MoticEurope, Barcelona, Spain) camera. The same instrument was used to capture the images needed for porosity percentage calculation, which was performed with ImageJ software (1.53k, NIH, Bethesda, MD, USA).

3. Results

Information obtained from the experimental tests included fatigue strength at 2 × 10 6 cycles, density, and porosity values. The density values obtained a result from averaging various measures on each sample set. Considering the powder data sheet provided by the manufacturer, it was possible to calculate the relative density value in percentage terms. Finally, with regard to the porosity, data were obtained from the analysis of photographs taken under a metallographic microscope, averaging the results corresponding to the cross-section of the specimen and the longitudinal section. For specimens with a wall thickness equivalent to 2.4 mm, with a larger resistant cross-section, the results are given in Table 2.
The results show numerous microporosities in the material that influence the density and the percentage of porosity present.
For the specimens with a thickness of 1.2 mm, the data obtained from the tests are shown in Table 3.
Finally, the experimental data obtained for the 0.6 mm wall thickness samples are given in Table 4. As it can be noted, it was impossible to determine the fatigue strength for the 3A set of specimens, which presented premature failures due to the combined effect of torsion, bending, and defectivity.

4. Discussion

The measured values show that the specimens have a low fatigue strength when compared to cast aluminium alloys [28], which increases in case treatments are performed. In particular, it can be seen that the best in terms of fatigue life is the T6 thermal treatment. This treatment led to a percentage increase of 81% for the 2.4 mm thickness, while it led to an increase of 82% in the 1.2 mm specimens. The standard deviation value was the main factor that influenced the increase in fatigue strength. The highest dispersion was recorded in the specimens with only the stress relief treatment. Figure 2 shows just this by indicating how the failure data are distributed for the 2.4 mm and 1.2 mm thickness series. However, this parameter was grown by the treatments performed, obtaining the minimum value and, thus, the best condition found when performing the heat treatment.
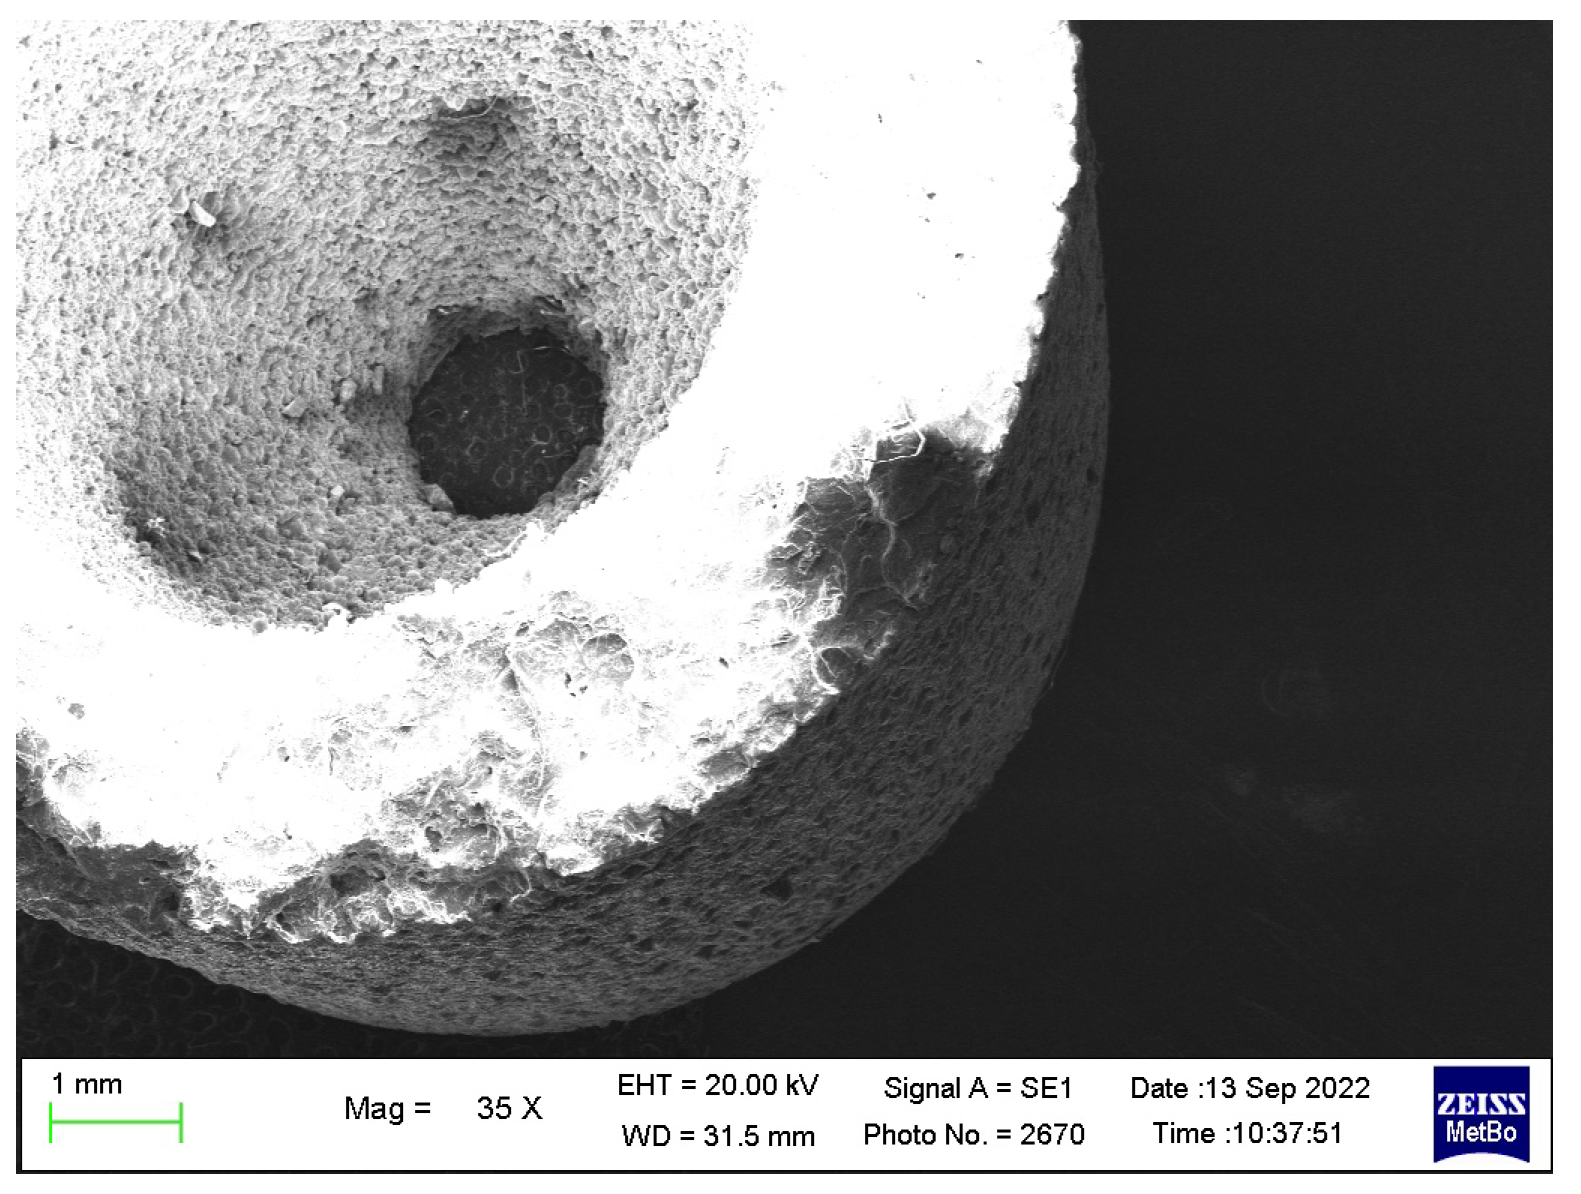
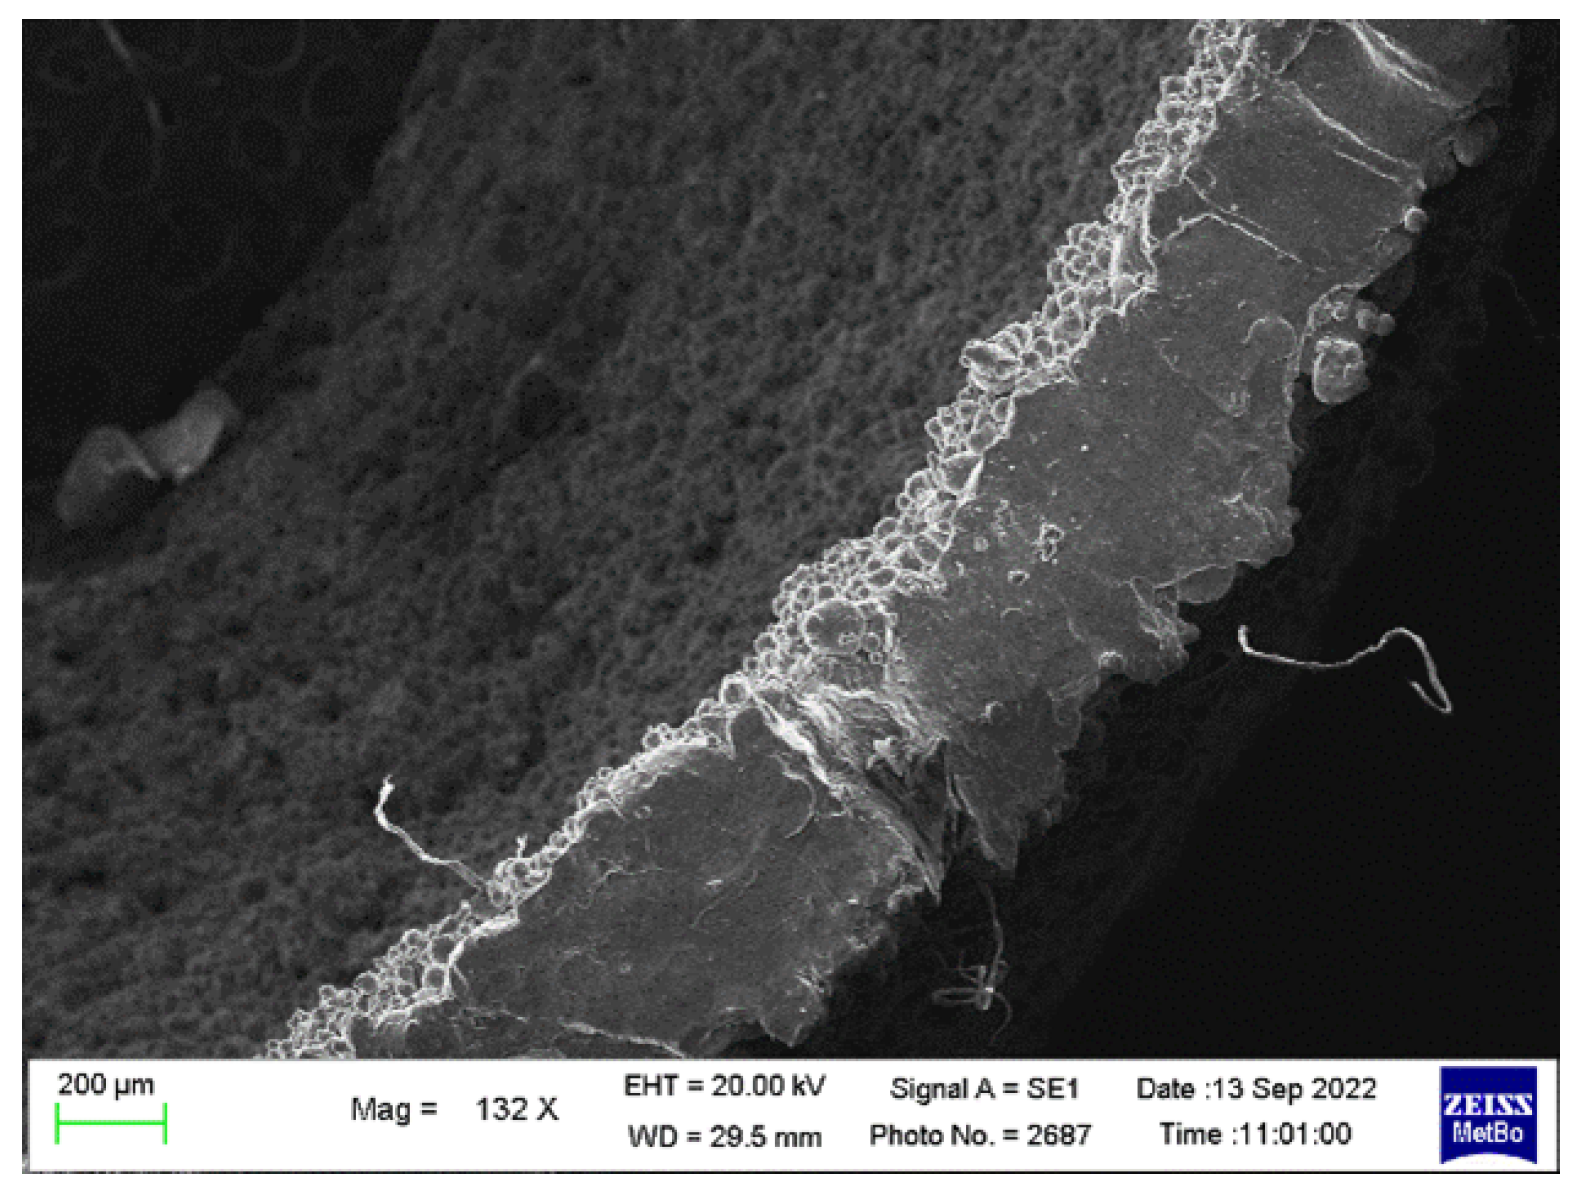
The increase was also found through the performance of surface treatments. Micro shot peening resulted in +57%, while the increase gained from increasing cylinder surface quality through controlled roughness machining was 55%. The extension of fatigue life was achieved through increased maximum allowable stress due to the treatments and a lower standard deviation present. The surface treatments performed allowed for an increase in surface quality that can also be observed through SEM analysis, as in Figure 3. In particular, the difference between the inner and the outer shot-peened surface is evident. The improvement of the surface’s quality can be better appreciated in Figure 4 This decrease in roughness led to increased fatigue life due to the lower presence of defects on the specimen surface. This investigation showed that there are no significant differences in fatigue life considering the different thicknesses. In fact, with the same treatment carried out, the thicknesses of 2.4 mm and 1.2 mm presented very similar fatigue strength values, so the difference can be neglected. In the case of treatment A (As-built), the ratio between the difference of the fatigue strength values for the two thicknesses and their average is around 7%, while in the case of the heat treatment (T6), it was around 8%. In both cases, the fatigue strength values are slightly higher for the higher thickness.
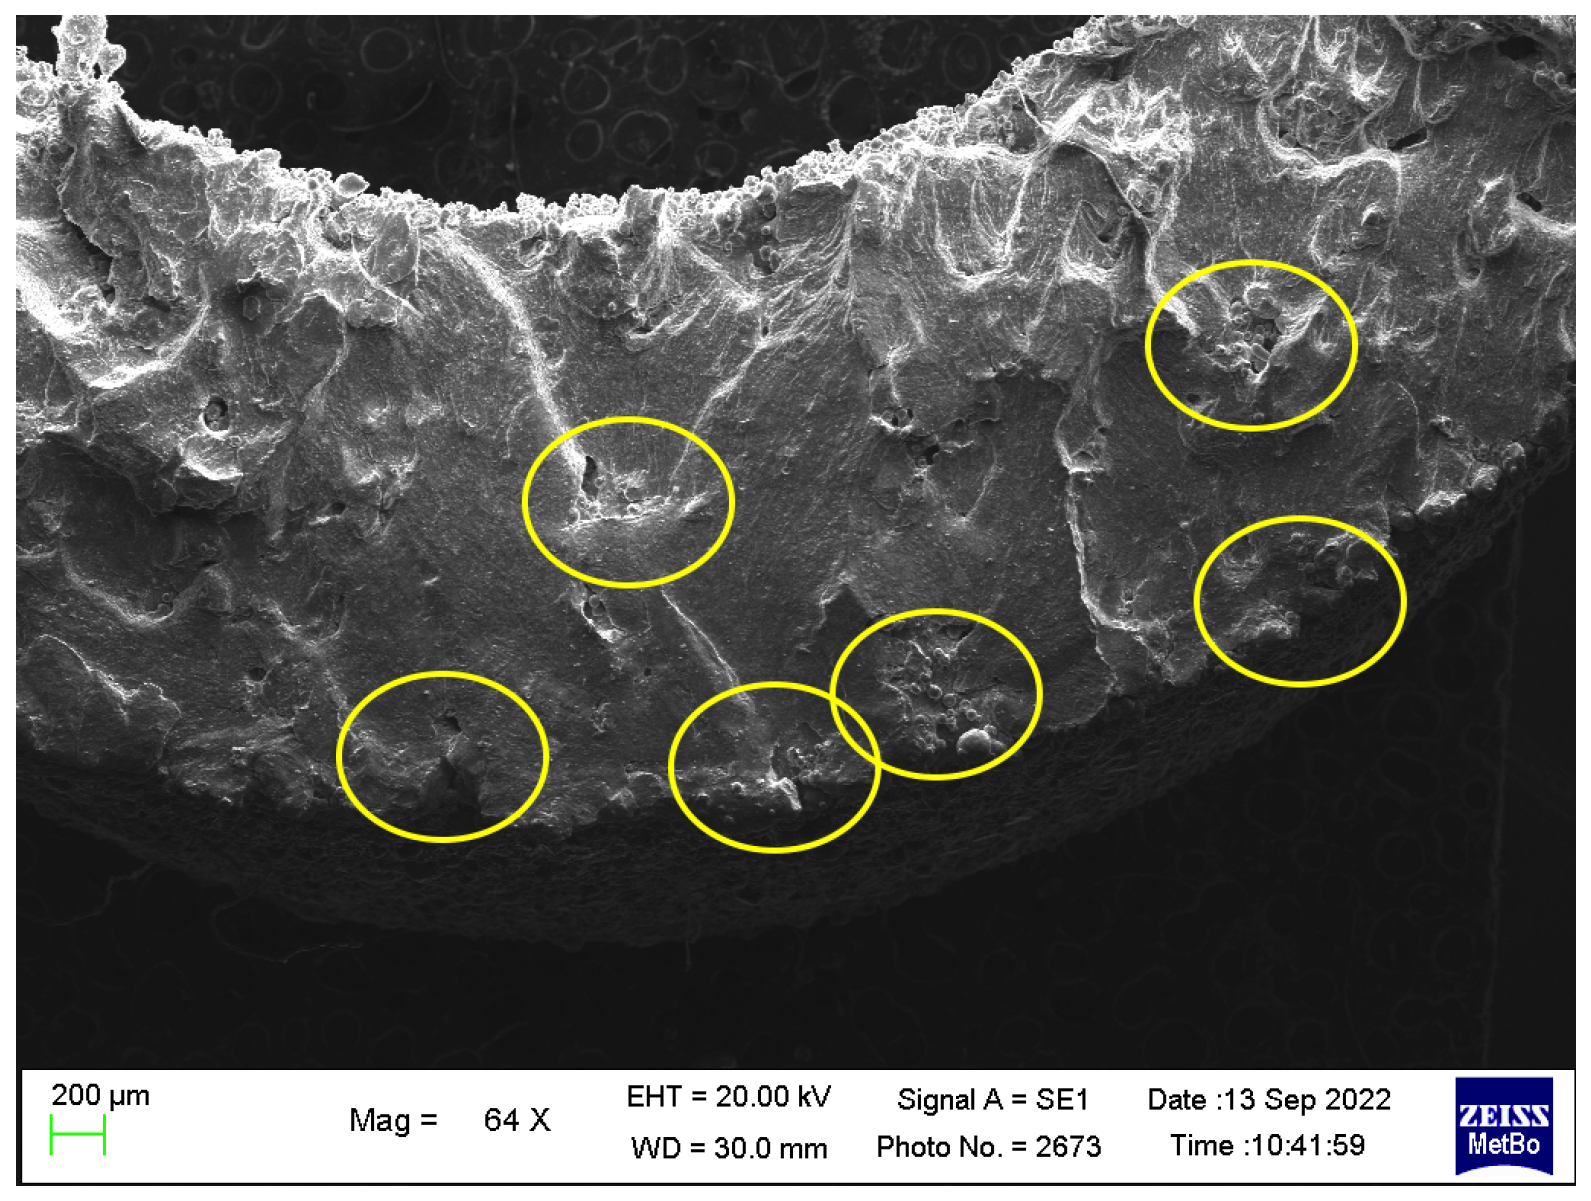
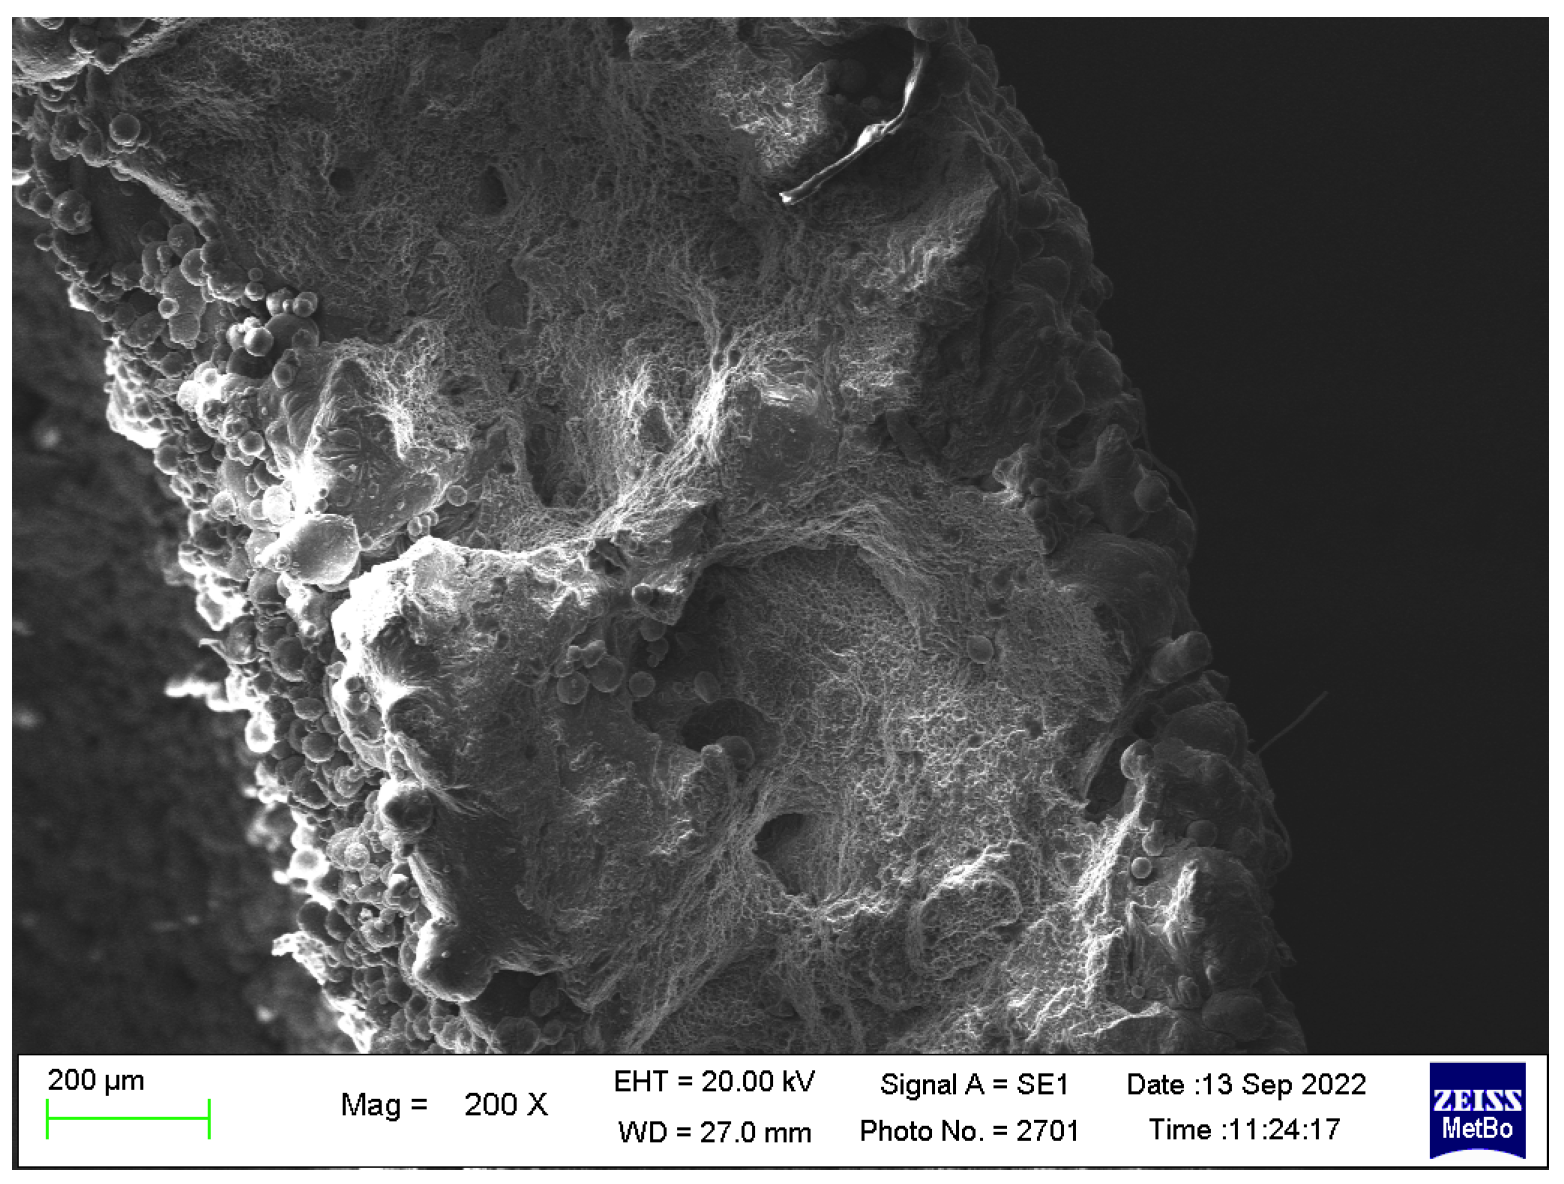
The case of the 0.6 mm thick samples was not taken into consideration for this analysis due to their specific characteristics in relation to the dimensions of the defects. Since less material was present in the thinner specimens, the defects that could have led to subsequent cracking of the specimen should be statically less. Due to the high porosity of the material, however, it was possible to observe that the defects were of a large size. For this reason, no difference between the various thicknesses was noticed. This behavior is more highlighted for the 0.6 mm thick samples. In this series, as can be seen from the SEM in Figure 5, the defects present extended along the specimen’s entire wall, leading to a drastic drop in the fatigue strength value. A similar feature appears in the 1.2 mm thick specimens’ SEM observations, as seen in Figure 6.
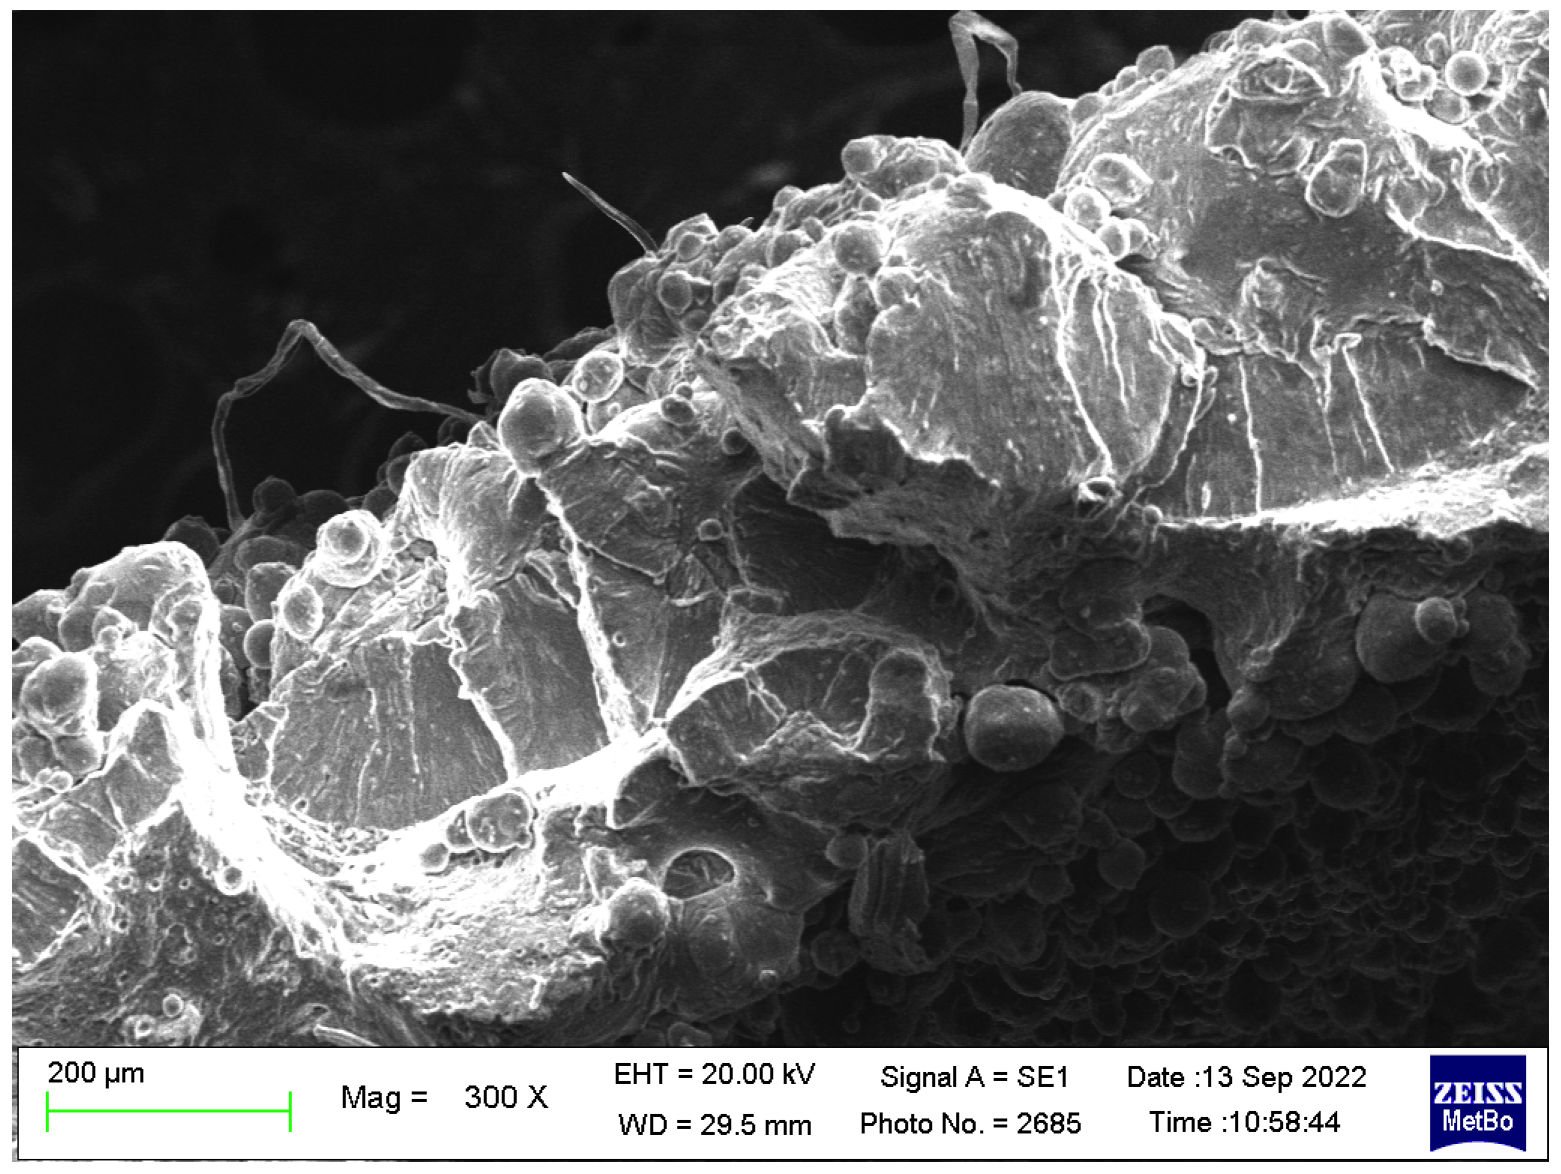
The general fracture surface appearance involves a smooth area around the initial propagation site, for example, in Figure 7 and Figure 8, where the presence of defects and fracture triggers of very significant size was also noted. These are mainly present on the outer surface of the specimen, as in Figure 7. In Figure 8, multiple fatigue crack origin sites can be identified due to a higher material resistance.
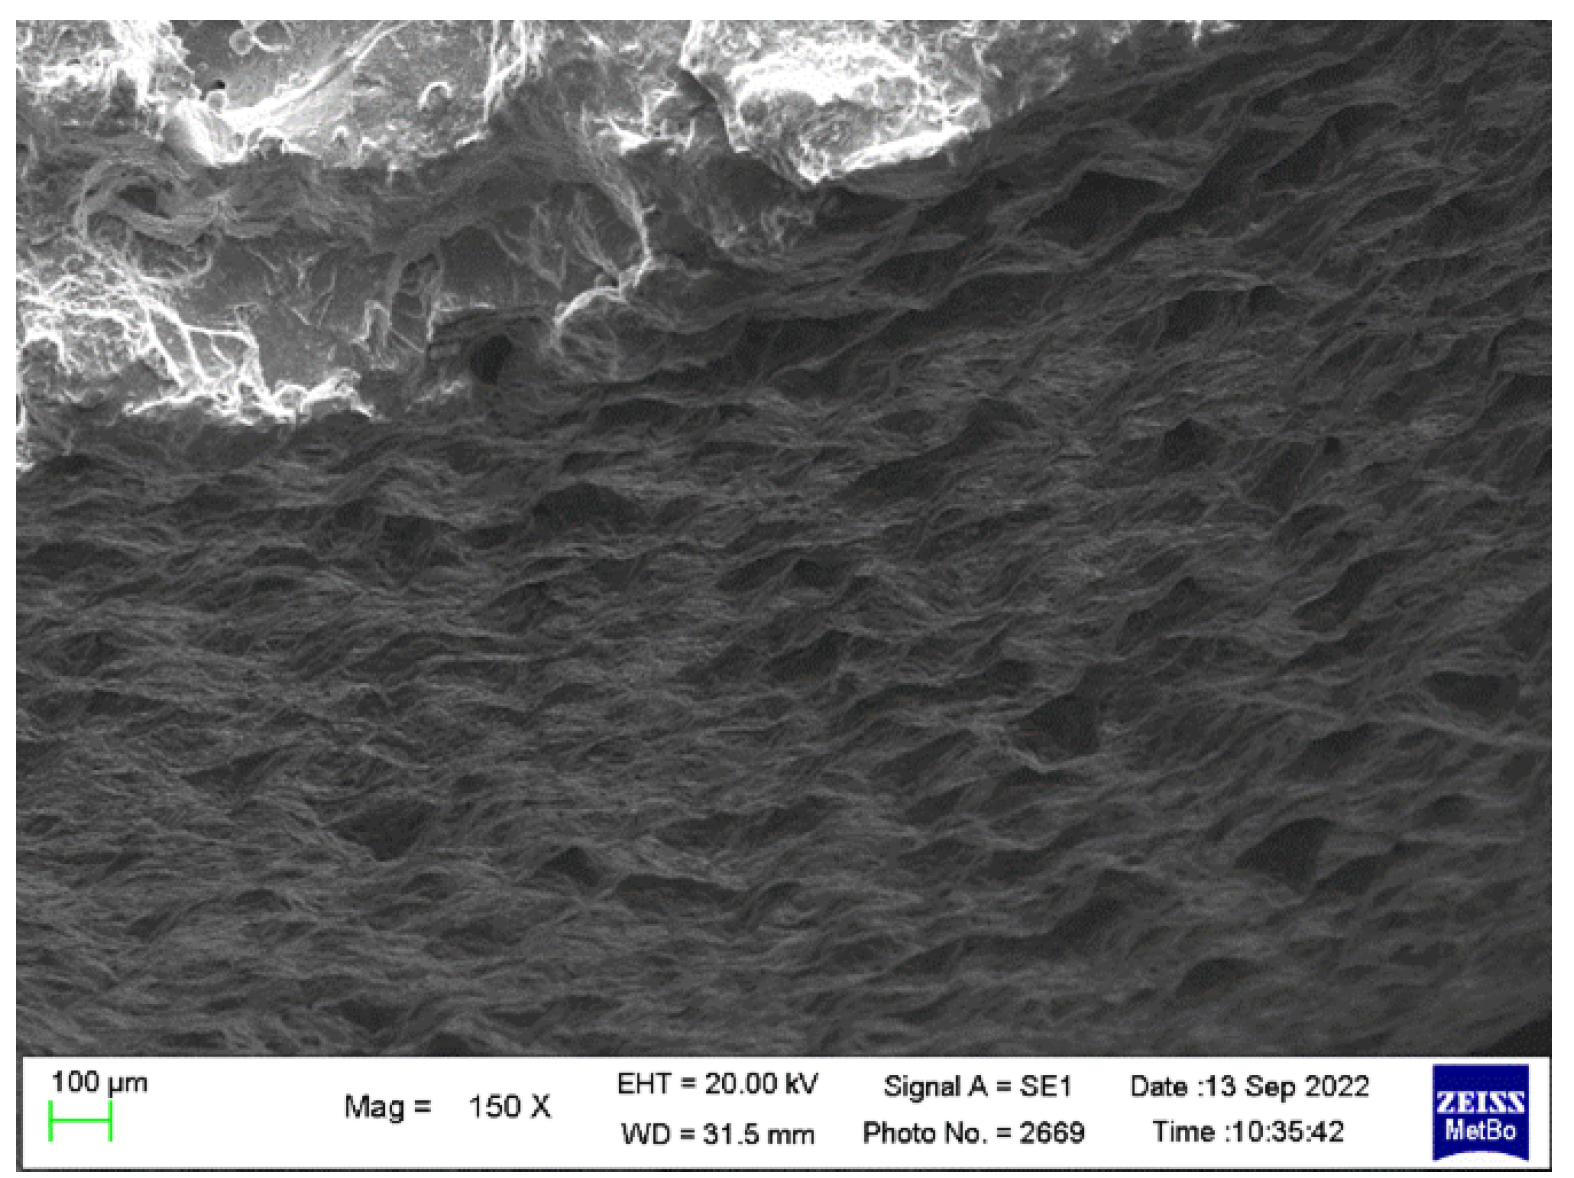
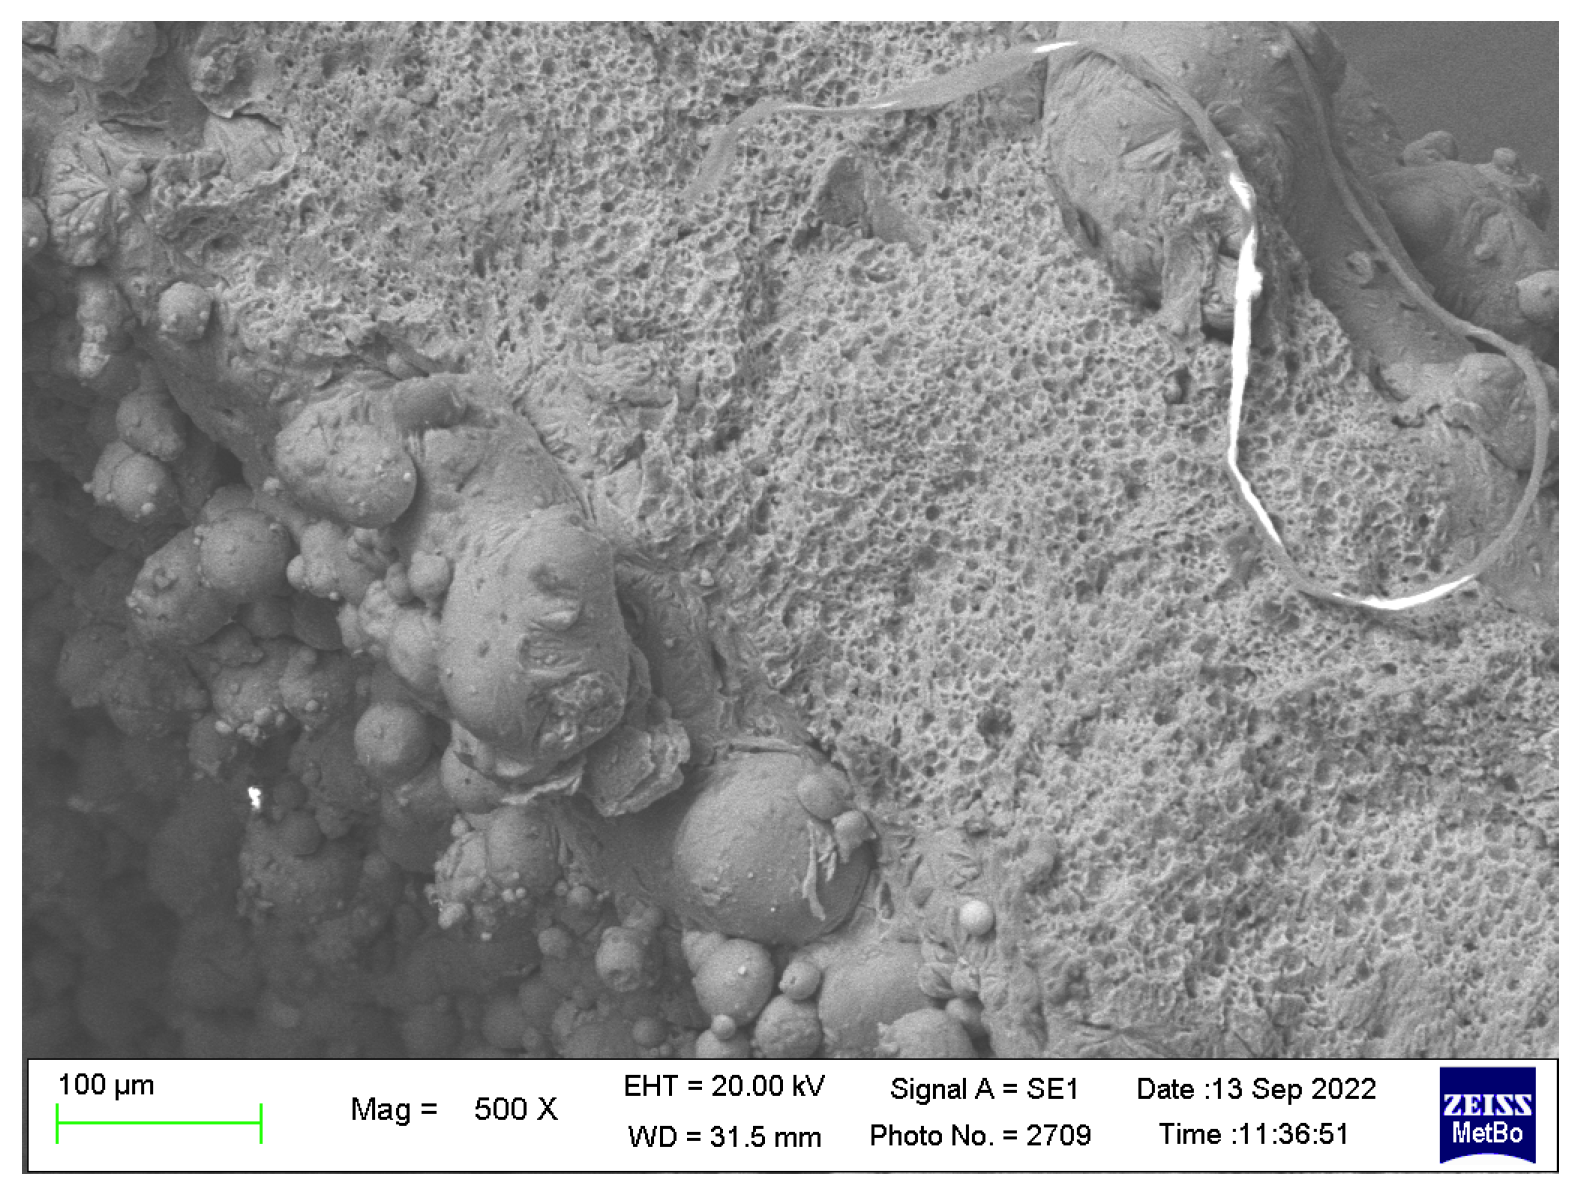
The final propagation part of the section is similar in the case of the as-built, shot-peened, and controlled rugosity treatment, and it looks brittle, like, for example, in Figure 9 and Figure 10. On the contrary, failure surfaces in the T6-treated specimens show evident plastic dimples, as can be seen in Figure 11 and Figure 12. After the fatigue failure tests, analyses were performed to detect the actual density of the specimens. From the values found and reported in the Table 2, Table 3 and Table 4, it could be observed that these were also affected by the treatment performed.
As expected from the previous porosity calculations, the defects in the specimens turned out to be varied and significant in size. The presence of high-porosity values is probably due to the use of low energy density [22]. Comparing the values used in the studies proposed by Ahmed H. Maamoun et al. for the same energy, the cavities in the sample were found to be the same size. In particular, the cavities in the specimen were, in many cases, due to a lack of powder or improper melting of the powder. This phenomenon was later observed through metallographic microscope investigations. As can be seen in Figure 13, depicting the whole section of a 1.2 mm thickness specimen, pores larger than 100 μ m are surrounded in many cases by trails of micropores due precisely to the insufficient melting energy of the powders.
In Figure 14, the longitudinal section of the same specimen is shown. It is possible to see that the porosity distribution is quite uneven. As a consequence, the density of the specimen is weakly related to its fatigue resistance, which is more dependent on the locally measured porosity. Moreover, the unmelted powder trapped in the material contributes to the density but is removed in the polishing operations needed to perform the metallographic analysis [29].
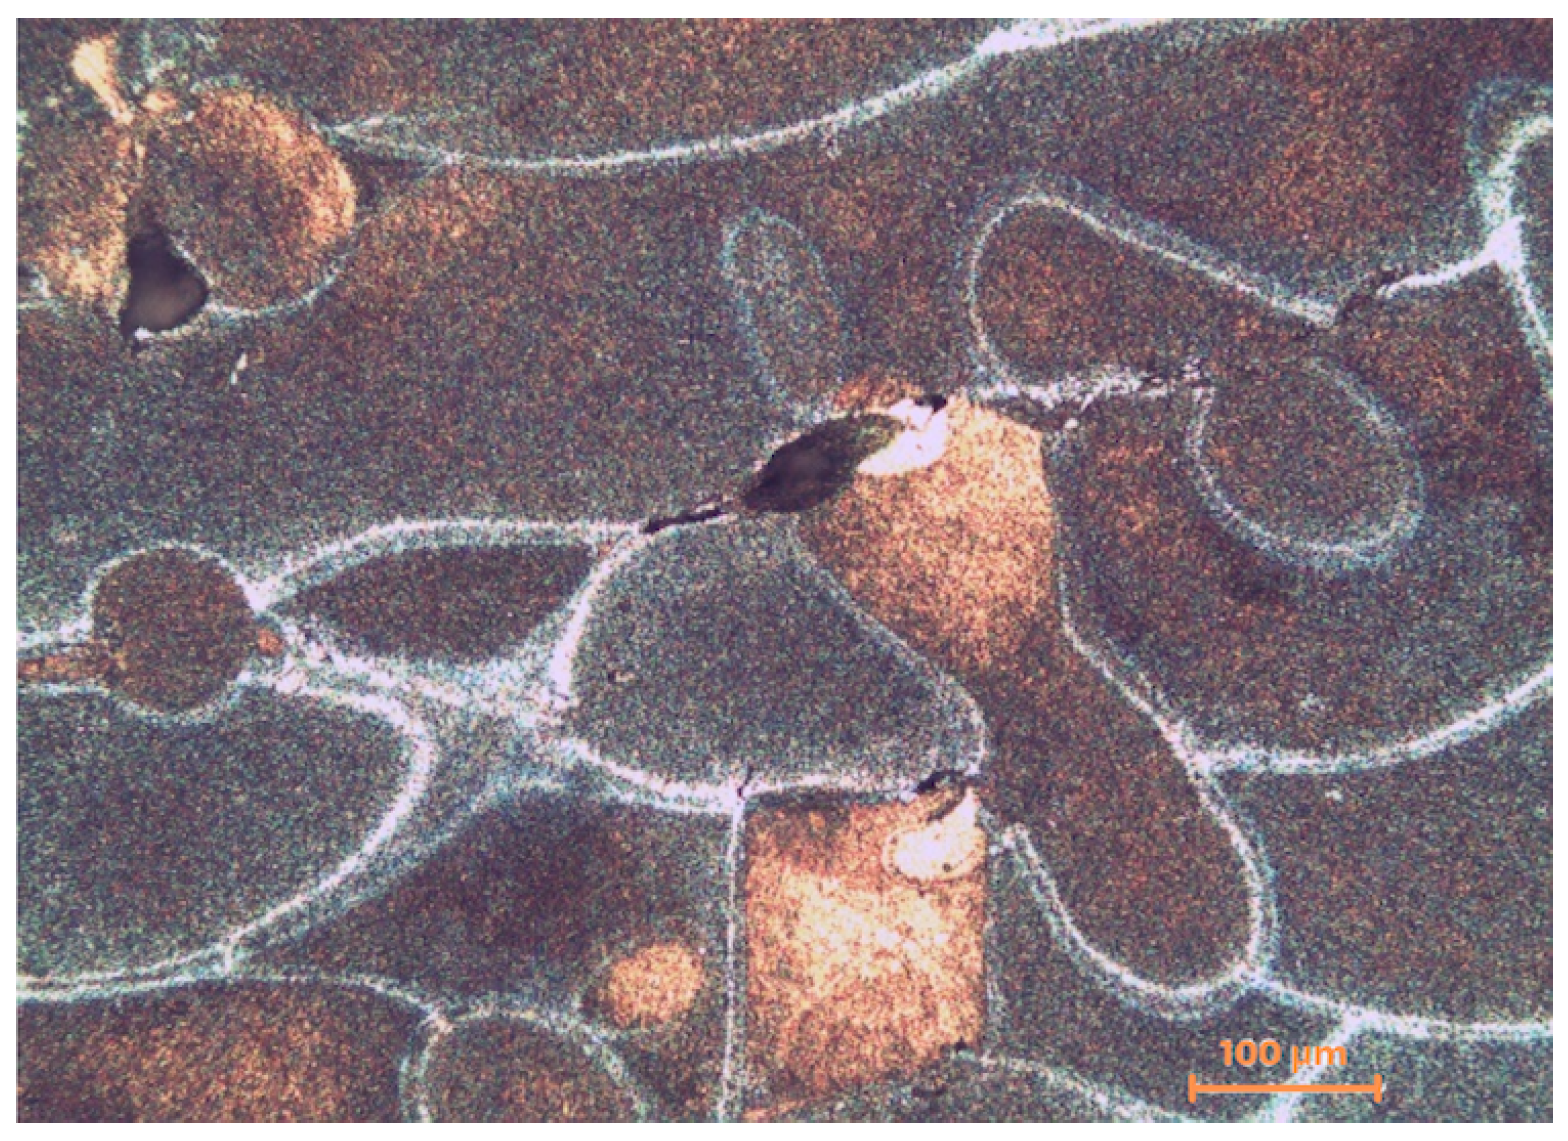
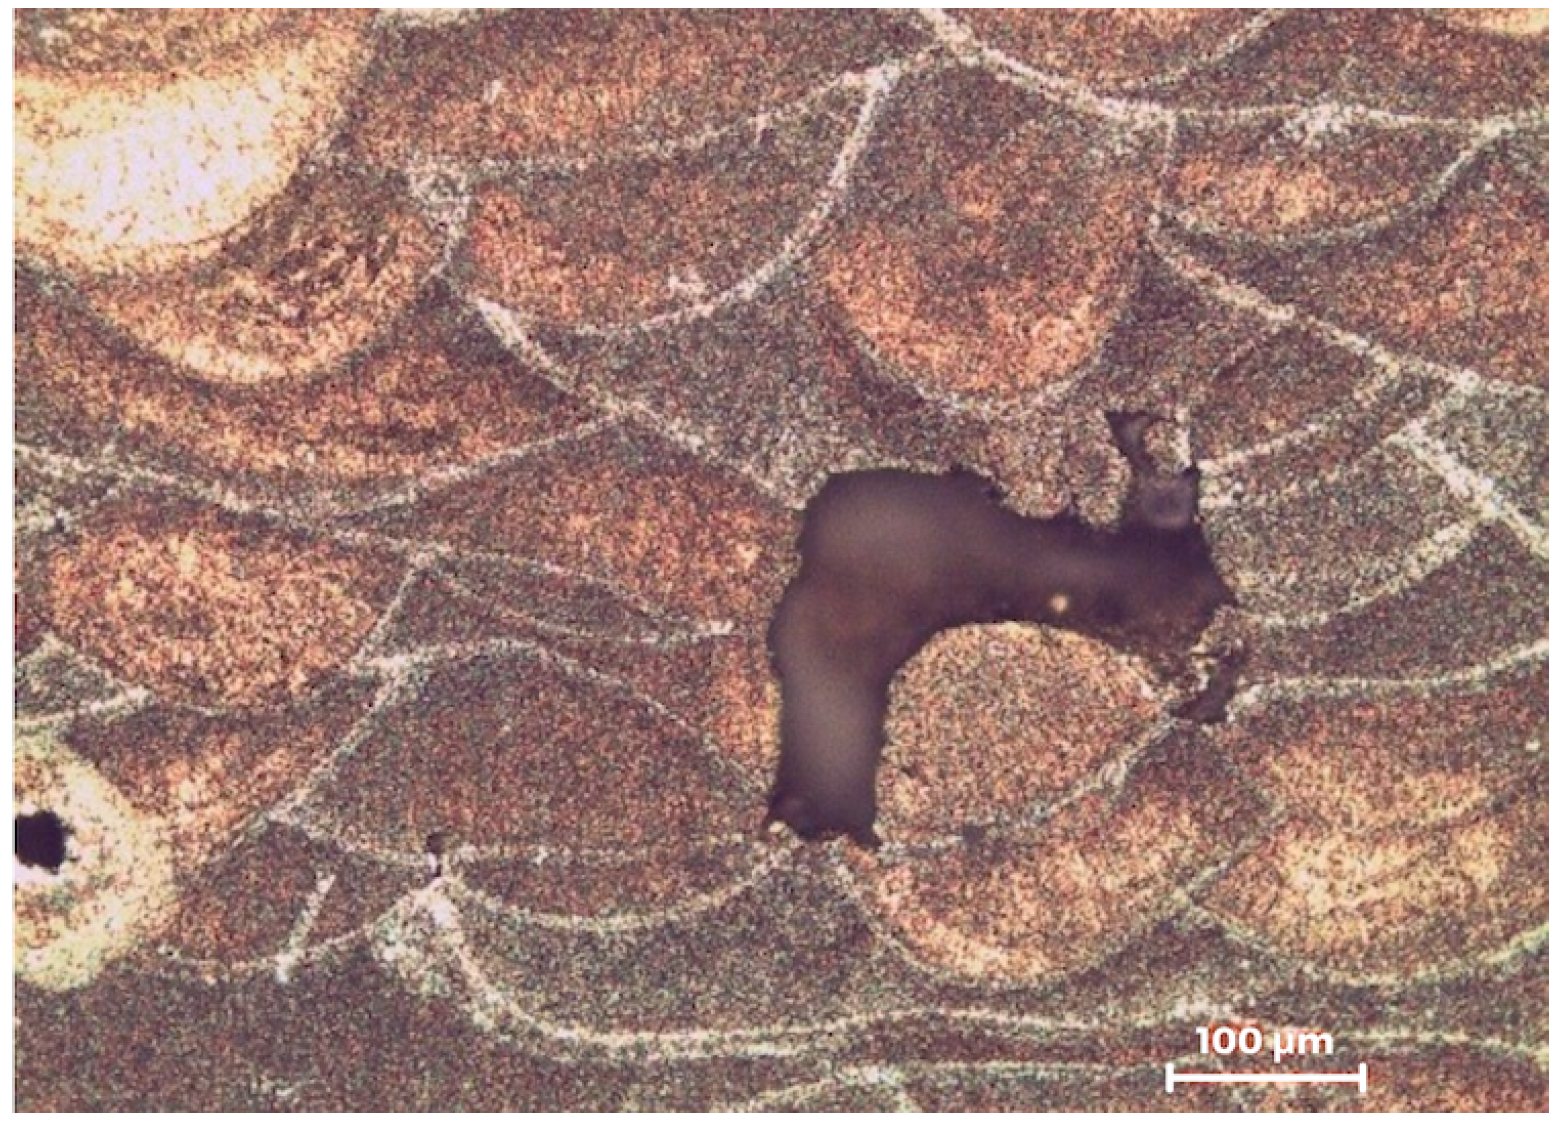
A deeper analysis of the pores described above was later made by images obtained from the metallographic microscope. By the acid attack of the sample with Keller’s reagent, the defects in the edges of the melt pools typical of the additive manufacturing process were recorded, as in Figure 15 and Figure 16. In fact, observing the common shapes of the additive process, there is a grain difference between the inside of the melt pool and the edge. Due to a different solidification rate, you get a coarser grain in the outermost part than in the interior. This difference in the solidification process is one of the causes of the emergence of pores, together with the presence of unmelted powder. While the effect of the pores shown in Figure 15 is minimal as regards the fatigue life, the cavities similar to the one shown in Figure 16, depicting a transversal section, may act as a pre-existing intergranular crack, which is mainly detrimental.
The future directions of this study will include the effect of the manufacturing parameters, such as laser power and build orientation, on the fatigue strength in relation to the effect of the wall thickness, particularly regarding the lower values.

5. Conclusions

In this paper, the fatigue strength value for an aluminium alloy, AlSi10Mg, was investigated by means of non-standard tubular specimens fabricated by selective laser melting. The results show that the fatigue strength is independent of the thickness of the component analyzed. This result can be associated with the presence of porosity of a significant size. However, an increase in fatigue strengths was achieved by performing subsequent post-processing treatments that markedly improved the reference stress and dispersion of values. The number of defects observed in the specimen correlated with the printing parameters chosen during the production process, which led to improperly fused powder within the specimen. The best improvement of fatigue strength was obtained by performing a T6 heat treatment.

Author Contributions

Conceptualization, N.S. and G.M.; methodology, N.S. and G.M.; software, N.S.; validation, N.S. and G.M.; investigation, N.S.; resources, G.M.; data curation, N.S.; writing—original draft preparation, N.S. and G.M.; writing—review and editing, G.M.; supervision, G.M.; project administration, G.M.; and funding acquisition, G.M. All authors have read and agreed to the published version of the manuscript.

Funding

Financed by the European Union—NextGenerationEU (National Sustainable Mobility Center CN00000023, Italian Ministry of University and Research Decree n. 1033–17/06/2022, Spoke 11—Innovative Materials and Lightweighting). The opinions expressed are those of the authors only and should not be considered representative of the European Union or the European Commission’s official position. Neither the European Union nor the European Commission can be held responsible for them.

Data Availability Statement

The raw dataset and high-resolution pictures may be retrieved from the authors upon request.

Acknowledgments

The authors thank Paolo Proli for technical support, Fabrizio Tarterini for performing the SEM observations, and the company 3D Metal Additive Manufacturing (https://3dmetal.it/, accessed on 8 December 2022) for providing the specimens.

Conflicts of Interest

The authors declare no conflict of interest.

References

  1. Croccolo, D.; De Agostinis, M.; Fini, S.; Olmi, G.; Robusto, F.; Ćirić Kostić, S.; Vranić, A.; Bogojević, N. Fatigue Response of As-Built DMLS Maraging Steel and Effects of Aging, Machining, and Peening Treatments. Metals 2018, 8, 505. [Google Scholar] [CrossRef] [Green Version]
  2. Croccolo, D.; De Agostinis, M.; Fini, S.; Olmi, G.; Robusto, F.; Ćirić-Kostić, S.; Morača, S.; Bogojević, N. Sensitivity of direct metal laser sintering Maraging steel fatigue strength to build orientation and allowance for machining. Fatigue Fract. Eng. Mater. Struct. 2019, 42, 374–386. [Google Scholar] [CrossRef] [Green Version]
  3. Croccolo, D.; Agostinis, M.D.; Fini, S.; Olmi, G.; Vranic, A.; Ciric-Kostic, S. Influence of the build orientation on the fatigue strength of EOS maraging steel produced by additive metal machine. Fatigue Fract. Eng. Mater. Struct. 2016, 39, 637–647. [Google Scholar] [CrossRef]
  4. Radlof, W.; Panwitt, H.; Benz, C.; Sander, M. Image-based and in-situ measurement techniques for the characterization of the damage behavior of additively manufactured lattice structures under fatigue loading. Procedia Struct. Integr. 2022, 18, 50–59. [Google Scholar] [CrossRef]
  5. Yang, L.; Yan, C.; Cao, W.; Liu, Z.; Song, B.; Wen, S.; Zhang, C.; Shi, Y.; Yang, S. Compression–compression fatigue behavior of gyroid-type triply periodic minimal surface porous structures fabricated by selective laser melting. Acta Mater. 2019, 181, 49–66. [Google Scholar] [CrossRef]
  6. Khorasani, M.; Ghasemi, A.; Leary, M.; Sharabian, E.; Cordova, L.; Gibson, I.; Downing, D.; Bateman, S.; Brandt, M.; Rolfe, B. The effect of absorption ratio on meltpool features in laser-based powder bed fusion of IN718. Opt. Laser Technol. 2022, 153, 108263. [Google Scholar] [CrossRef]
  7. Rosenthal, I.; Stern, A.; Frage, N. Microstructure and Mechanical Properties of AlSi10Mg Parts Produced by the Laser Beam Additive Manufacturing (AM) Technology. Metallogr. Microstruct. Anal. 2014, 3, 448–453. [Google Scholar] [CrossRef]
  8. Kempen, K.; Thijs, L.; Van Humbeeck, J.; Kruth, J.-P. Mechanical Properties of AlSi10Mg Produced by Selective Laser Melting. Proc. Phys. Procedia 2012, 39, 349–446. [Google Scholar] [CrossRef] [Green Version]
  9. Tarakçı, G.; Khan, H.M.; Yılmaz, M.S.; Özer, G. Effect of building orientations and heat treatments on AlSi10Mg alloy fabricated by selective laser melting: Microstructure evolution, mechanical properties, fracture mechanism and corrosion behavior. Rapid Prototyp. J. 2022, 28, 1609–1621. [Google Scholar] [CrossRef]
  10. Yang, T.; Liu, T.; Liao, W.; MacDonald, E.; Wei, H.; Chen, X.; Jiang, L. The influence of process parameters on vertical surface roughness of the AlSi10Mg parts fabricated by selective laser melting. J. Mater. Process. Technol. 2019, 266, 26–36. [Google Scholar] [CrossRef]
  11. Maamoun, A.H.; Xue, Y.F.; Elbestawi, M.A.; Veldhuis, S.C. The effect of selective laser melting process parameters on the microstructure and mechanical properties of Al6061 and AlSi10Mg alloys. Materials 2018, 12, 12. [Google Scholar] [CrossRef] [PubMed] [Green Version]
  12. Tang, M.; Pistorius, P.C. Oxides, porosity and fatigue performance of AlSi10Mg parts produced by selective laser melting. Int. J. Fatigue 2017, 94, 192–201. [Google Scholar] [CrossRef]
  13. Xiao, H.; Zhang, C.; Zhu, H. Effect of direct aging and annealing on the microstructure and mechanical properties of AlSi10Mg fabricated by selective laser melting. Rapid Prototyp. J. 2023, 29, 118–127. [Google Scholar] [CrossRef]
  14. Brandl, E.; Heckenberger, U.; Holzinger, V.; Buchbinder, D. Additive manufactured AlSi10Mg samples using Selective Laser Melting (SLM): Microstructure, high cycle fatigue, and fracture behavior. Mater. Des. 2012, 34, 159–169. [Google Scholar] [CrossRef]
  15. Lv, F.; Shen, L.; Liang, H.; Xie, D.; Wang, C.; Tian, Z. Mechanical properties of AlSi10Mg alloy fabricated by laser melting deposition and improvements via heat treatment. Optik 2019, 179, 8–18. [Google Scholar] [CrossRef]
  16. Majeed, A.; Zhang, Y.; Lv, J.; Peng, T.; Atta, Z.; Ahmed, A. Investigation of T4 and T6 heat treatment influences on relative density and porosity of AlSi10Mg alloy components manufactured by SLM. Comput. Ind. Eng. 2020, 139. [Google Scholar] [CrossRef]
  17. Girelli, L.; Tocci, M.; Gelfi, M.; Pola, A. Study of heat treatment parameters for additively manufactured AlSi10Mg in comparison with corresponding cast alloy. Mater. Sci. Eng. A 2019, 739, 317–328. [Google Scholar] [CrossRef]
  18. Bagherifard, S.; Beretta, N.; Monti, S.; Riccio, M.; Bandini, M.; Guagliano, M. On the fatigue strength enhancement of additive manufactured AlSi10Mg parts by mechanical and thermal post-processing. Mater. Des. 2018, 145, 28–41. [Google Scholar] [CrossRef]
  19. Croccolo, D.; de Agostinis, M.; Fini, S.; Olmi, G.; Paiardini, L.; Robusto, F.; Bonomo, A. Influence of Heat and Surface Treatments on the Fatigue Response of DMLS Manufactured AlSi10mg. MSF 2021, 1016, 1205–1210. [Google Scholar] [CrossRef]
  20. ISO 1143:2021; Metallic Materials—Rotating Bar Bending Fatigue Testing. ISO: Geneva, Switzerland, 2021.
  21. Peterson, R.E. Model Testing as Applied to Strength of Materials. J. Appl. Mech. 1933, 1, 79–84. [Google Scholar] [CrossRef]
  22. Plocher, J.; Panesar, A. Review on design and structural optimisation in additive manufacturing: Towards next-generation lightweight structures. Mater. Des. 2019, 183, 108164. [Google Scholar] [CrossRef]
  23. Magerramova, L.; Isakov, V.; Shcherbinina, L.; Gukasyan, S.; Petrov, M.; Povalyukhin, D.; Volosevich, D.; Klimova-Korsmik, O. Design, Simulation and Optimization of an Additive Laser-Based Manufacturing Process for Gearbox Housing with Reduced Weight Made from AlSi10Mg Alloy. Metals 2022, 12, 67. [Google Scholar] [CrossRef]
  24. Wang, D.; Wei, X.; Liu, J.; Xiao, Y.; Yang, Y.; Liu, L.; Tan, C.; Yang, X.; Han, C. Lightweight design of an AlSi10Mg aviation control stick additively manufactured by laser powder bed fusion. Rapid Prototyp. J. 2022, 28, 1869–1881. [Google Scholar] [CrossRef]
  25. Maamoun, A.H.; Elbestawi, M.A.; Veldhuis, S.C. Influence of Shot Peening on AlSi10Mg Parts Fabricated by Additive Manufacturing. J. Manuf. Mater. Process. 2018, 2, 40. [Google Scholar] [CrossRef] [Green Version]
  26. Minak, G. Comparison of Different Methods for Fatigue Limit Evaluation by Meansof the Monte Carlo Method. J. Test Eval. 2022, 35, 1–8. [Google Scholar]
  27. ISO 12107:2012; Metallic Materials—Fatigue Testing—Statistical Planning and Analysis of Data. ISO: Geneva, Switzerland, 2012.
  28. Linder, J.M.; Axelsson, M.; Nilsson, H. The influence of porosity on the fatigue life for sand and permanent mould cast aluminium. Int. J. Fatigue 2006, 28, 1752–1758. [Google Scholar] [CrossRef]
  29. Aboulkhair, N.T.; Simonelli, M.; Parry, L.; Ashcroft, I.; Tuck, C.; Hague, C. 3D printing of Aluminium alloys: Additive Manufacturing of Aluminium alloys using selective laser melting. Prog. Mater. Sci. 2019, 106, 100578. [Google Scholar] [CrossRef]
Figure 1. Geometry of samples [mm] made for experimental tests.
Metals 13 00126 g001
Figure 2. The failure trends recorded for stress-relief-treated specimens for the 2.4-mm and 1.2-mm-thick series.
Metals 13 00126 g002
Figure 3. Test specimen with microshot-peened external surface.
Metals 13 00126 g003
Figure 4. Close-up of shot-peened the external surface.
Metals 13 00126 g004
Figure 5. Defect extending through the entire thickness of a 0.6 mm walled specimen.
Metals 13 00126 g005
Figure 6. Defect extending through the entire thickness of a 1.2 mm walled specimen.
Metals 13 00126 g006
Figure 7. Fatigue crack origin on the surface of a shot-peened specimen.
Metals 13 00126 g007
Figure 8. Multiple crack starters on T6-treated specimen.
Metals 13 00126 g008
Figure 9. Final fracture surface of a 0.6 mm thick specimen as built.
Metals 13 00126 g009
Figure 10. Final fracture surface of a 2.4 mm thick specimen as built.
Metals 13 00126 g010
Figure 11. Final fracture surface of a 0.6 mm thick specimen T6 treated.
Metals 13 00126 g011
Figure 12. Final fracture surface of a 1.2 mm thick specimen T6 treated.
Metals 13 00126 g012
Figure 13. Porosity in a 1.2 specimen transversal section due to low energy density.
Metals 13 00126 g013
Figure 14. Porosity in a 1.2 specimen longitudinal section due to low energy density.
Metals 13 00126 g014
Figure 15. Porosity in a transversal section.
Metals 13 00126 g015
Figure 16. Porosity in a longitudinal section.
Metals 13 00126 g016
Table 1. Test plan.
Table 1. Test plan.
Wall ThicknessTreatment A, Stress ReliefTreatment B, Micro Shot PeeningTreatment C, Controlled RoughnessTreatment D, T6 Temper
0.6 mm1A1B1C1D
1.2.mm2A//////2D
2.4 mmNot Calculateed//////3D
Table 2. Characteristics of the samples with a thickness of 2.4 mm.
Wall Thickness 2.4 mmFatigue Strength at 2 × 10 6 CyclesRelative DensityPorosity
1 A25.6 MPa95.3%2.1%
Stress Relief
1 B
Micro Shot41.6 MPa94%///
Peening
1 C
Controlled41.1 MPa95.3%3.07%
Roughness
1 D47.8 MPa96.5%3.97%
T6 Temper
Table 3. Characteristics of the samples with a thickness of 1.4 mm.
Wall Thickness 2.4 mmFatigue Strength at 2 × 10 6 CyclesRelative DensityPorosity
2 A28.4 MPa95.6%1.14%
Stress Relief
2 D51.7 MPa96.0%3.3%
Temper
Table 4. Characteristics of the samples with a thickness of 0.6 mm.
Wall Thickness 2.4 mmFatigue Strength at 2 × 10 6 CyclesRelative DensityPorosity
3 A///96.4%1.73%
Stress Relief
3 D37.8 MPa94.5%4.35%
T6 Temper
Disclaimer/Publisher’s Note: The statements, opinions and data contained in all publications are solely those of the individual author(s) and contributor(s) and not of MDPI and/or the editor(s). MDPI and/or the editor(s) disclaim responsibility for any injury to people or property resulting from any ideas, methods, instructions or products referred to in the content.